
Submitted:
13 May 2025
Posted:
14 May 2025
You are already at the latest version
Abstract
Capital investment in longevity science is creating an unprecedented disconnect between traditional actuarial projections and emerging biological reality. This paper examines how accelerating investment in life extension technologies fundamentally alters mortality improvement trajectories beyond conventional actuarial assumptions. We introduce an Investment-Adjusted Mortality Model (IAMM) that incorporates capital allocation trends as leading indicators of mortality improvement acceleration. Our statistical analysis demonstrates that under high-investment scenarios, current insurance products may significantly underestimate longevity risk, creating potential solvency challenges. We validate our model through rigorous backtesting against historical data, showing superior predictive performance compared to traditional approaches. Based on these findings, we propose innovative insurance structures including dynamic mortality-linked products and biological age underwriting, quantifying their effectiveness in reducing longevity risk exposure. These results highlight the urgent need for actuarial science to evolve in response to the rapidly changing longevity investment environment detailed in "Investors in Longevity" [1].
Keywords:
Mortality modeling
; Investment-adjusted mortality
; Longevity risk
; Insurance innovation
; Life expectancy
; Biological age underwriting
; Investment-driven mortality
; Stochastic mortality models
; Actuarial science
; Mortality improvement
1. Introduction
In 2023, a pharmaceutical company announced breakthrough results from an anti-aging clinical trial, triggering a 300% surge in longevity science investment within a single quarter. This event illuminates a growing challenge: traditional mortality modeling approaches appear fundamentally unprepared for the impact of accelerating capital deployment into life extension technologies.
The insurance and pension industries have long relied on mortality projections assuming gradual, predictable improvements in life expectancy. These models typically extrapolate from historical trends, with modest adjustments for emerging medical advances [2]. However, the dramatic increase in institutional capital targeting the biological processes of aging represents a potential discontinuity in mortality improvement patterns that existing models fail to capture.
The scale of this investment shift is significant. As documented in “Investors in Longevity” [1], venture capital funding for longevity-focused startups increased from approximately $1 billion in 2017 to over $4.1 billion by 2024. Major pharmaceutical companies have established dedicated longevity research divisions, while technology corporations have funded ambitious anti-aging initiatives. This capital influx is accelerating the development and commercialization of interventions targeting the biological hallmarks of aging.
The visible evidence of technological advances in longevity is already apparent in the extension of life expectancy by approximately 13.1 weeks per year for males and 9.4 weeks per year for females across developed countries since 2000 [3]. This remarkable pace—the fastest increase since the 1960s [4]—has occurred despite healthcare systems’ limited focus on addressing aging itself rather than age-related diseases. As investment in longevity-specific technologies continues to grow, this rate of improvement will likely accelerate dramatically.
1.1. Quantifying the Actuarial Disconnect
The historical evidence suggests that traditional actuarial models have consistently underestimated mortality improvements. A comprehensive analysis by Antolin and Blommestein [21] found that actuarial projections made between 1990-2000 underestimated actual mortality improvements by an average of 0.8% annually across OECD countries. This seemingly small annual divergence compounds to significant effects—resulting in underestimation of life expectancy at age 65 by 2.7 years by 2020.
More recently, a Society of Actuaries study [22] examined the predictive accuracy of seven leading mortality models over the period 2000-2020, finding systematic bias in all models during periods of rapid medical advancement. When significant breakthrough treatments for cardiovascular disease entered clinical use in the mid-2000s, the best-performing model still underestimated the subsequent mortality improvement by 23% over the following decade.
The financial consequences of these modeling limitations are substantial. Dushi et al. [23] estimated that U.S. defined benefit pension plans collectively underestimated their liabilities by $120-180 billion in 2015 due to inadequate incorporation of mortality improvements. Similarly, Zhang and Li [24] calculated that major European insurers experienced a collective 17% increase in annuity reserves between 2010-2020 due specifically to unanticipated mortality improvements.
These historical patterns suggest that the current wave of investment-accelerated longevity innovation may create even larger discrepancies between actuarial projections and biological reality.
Current literature acknowledges uncertainty in mortality projections but typically treats technological advancement as an exogenous, somewhat unpredictable factor. Lee-Carter and similar models incorporate mortality improvement factors, but these are largely based on historical patterns [5]. More recent stochastic mortality models add sophistication but still inadequately address potential acceleration driven by targeted investment [6].
The gap in existing research is clear: there is no established framework for modeling the feedback loop between capital investment in longevity science and subsequent mortality improvements. This disconnect creates critical problems for actuarial science and insurance practice:
- Systematic underpricing of longevity risk: When mortality models fail to capture investment-driven acceleration, annuities and pension products become systematically underpriced, creating long-term solvency risks.
- Capital misallocation: Without accurate models of investment impacts on mortality, capital allocation decisions within insurance companies and pension funds may be systematically biased.
- Intergenerational inequity: As improved mortality benefits future generations while the costs of underestimated longevity fall on current cohorts, a significant intergenerational transfer of wealth may occur unintentionally.
This paper addresses three specific research questions:
- RQ1: How do significant capital flows into longevity science quantitatively alter mortality improvement trajectories beyond traditional actuarial assumptions?
- RQ2: What specific modeling approaches can most effectively capture these investment-driven dynamics to provide mathematically sound mortality projections?
- RQ3: How should insurers adapt product design and pricing strategies in response to investment-accelerated mortality improvements, and what is the quantifiable impact of these adaptations?
To answer these questions, we develop an Investment-Adjusted Mortality Model (IAMM) that explicitly incorporates capital flows into longevity science as predictive factors for mortality improvement. We then analyze the implications of this model for insurance product pricing, design, and risk management through rigorous statistical analysis and stress testing.
The remainder of this paper is organized as follows: Section 2 examines the current landscape of longevity investments, Section 3 introduces our modeling framework incorporating investment factors, Section 4 presents results and sensitivity analysis, Section 5 explores insurance innovation opportunities, and Section 6 concludes with implications and future research directions.
2. The Longevity Investment Landscape
The influx of capital into longevity science represents a fundamental shift in how aging is addressed—from a natural, inevitable process to a treatable condition. This shift is driven by three concurrent technological revolutions converging to redefine what’s possible in extending human lifespan, each accelerated by significant investment activity.
2.1. Investment Trends in Longevity Science
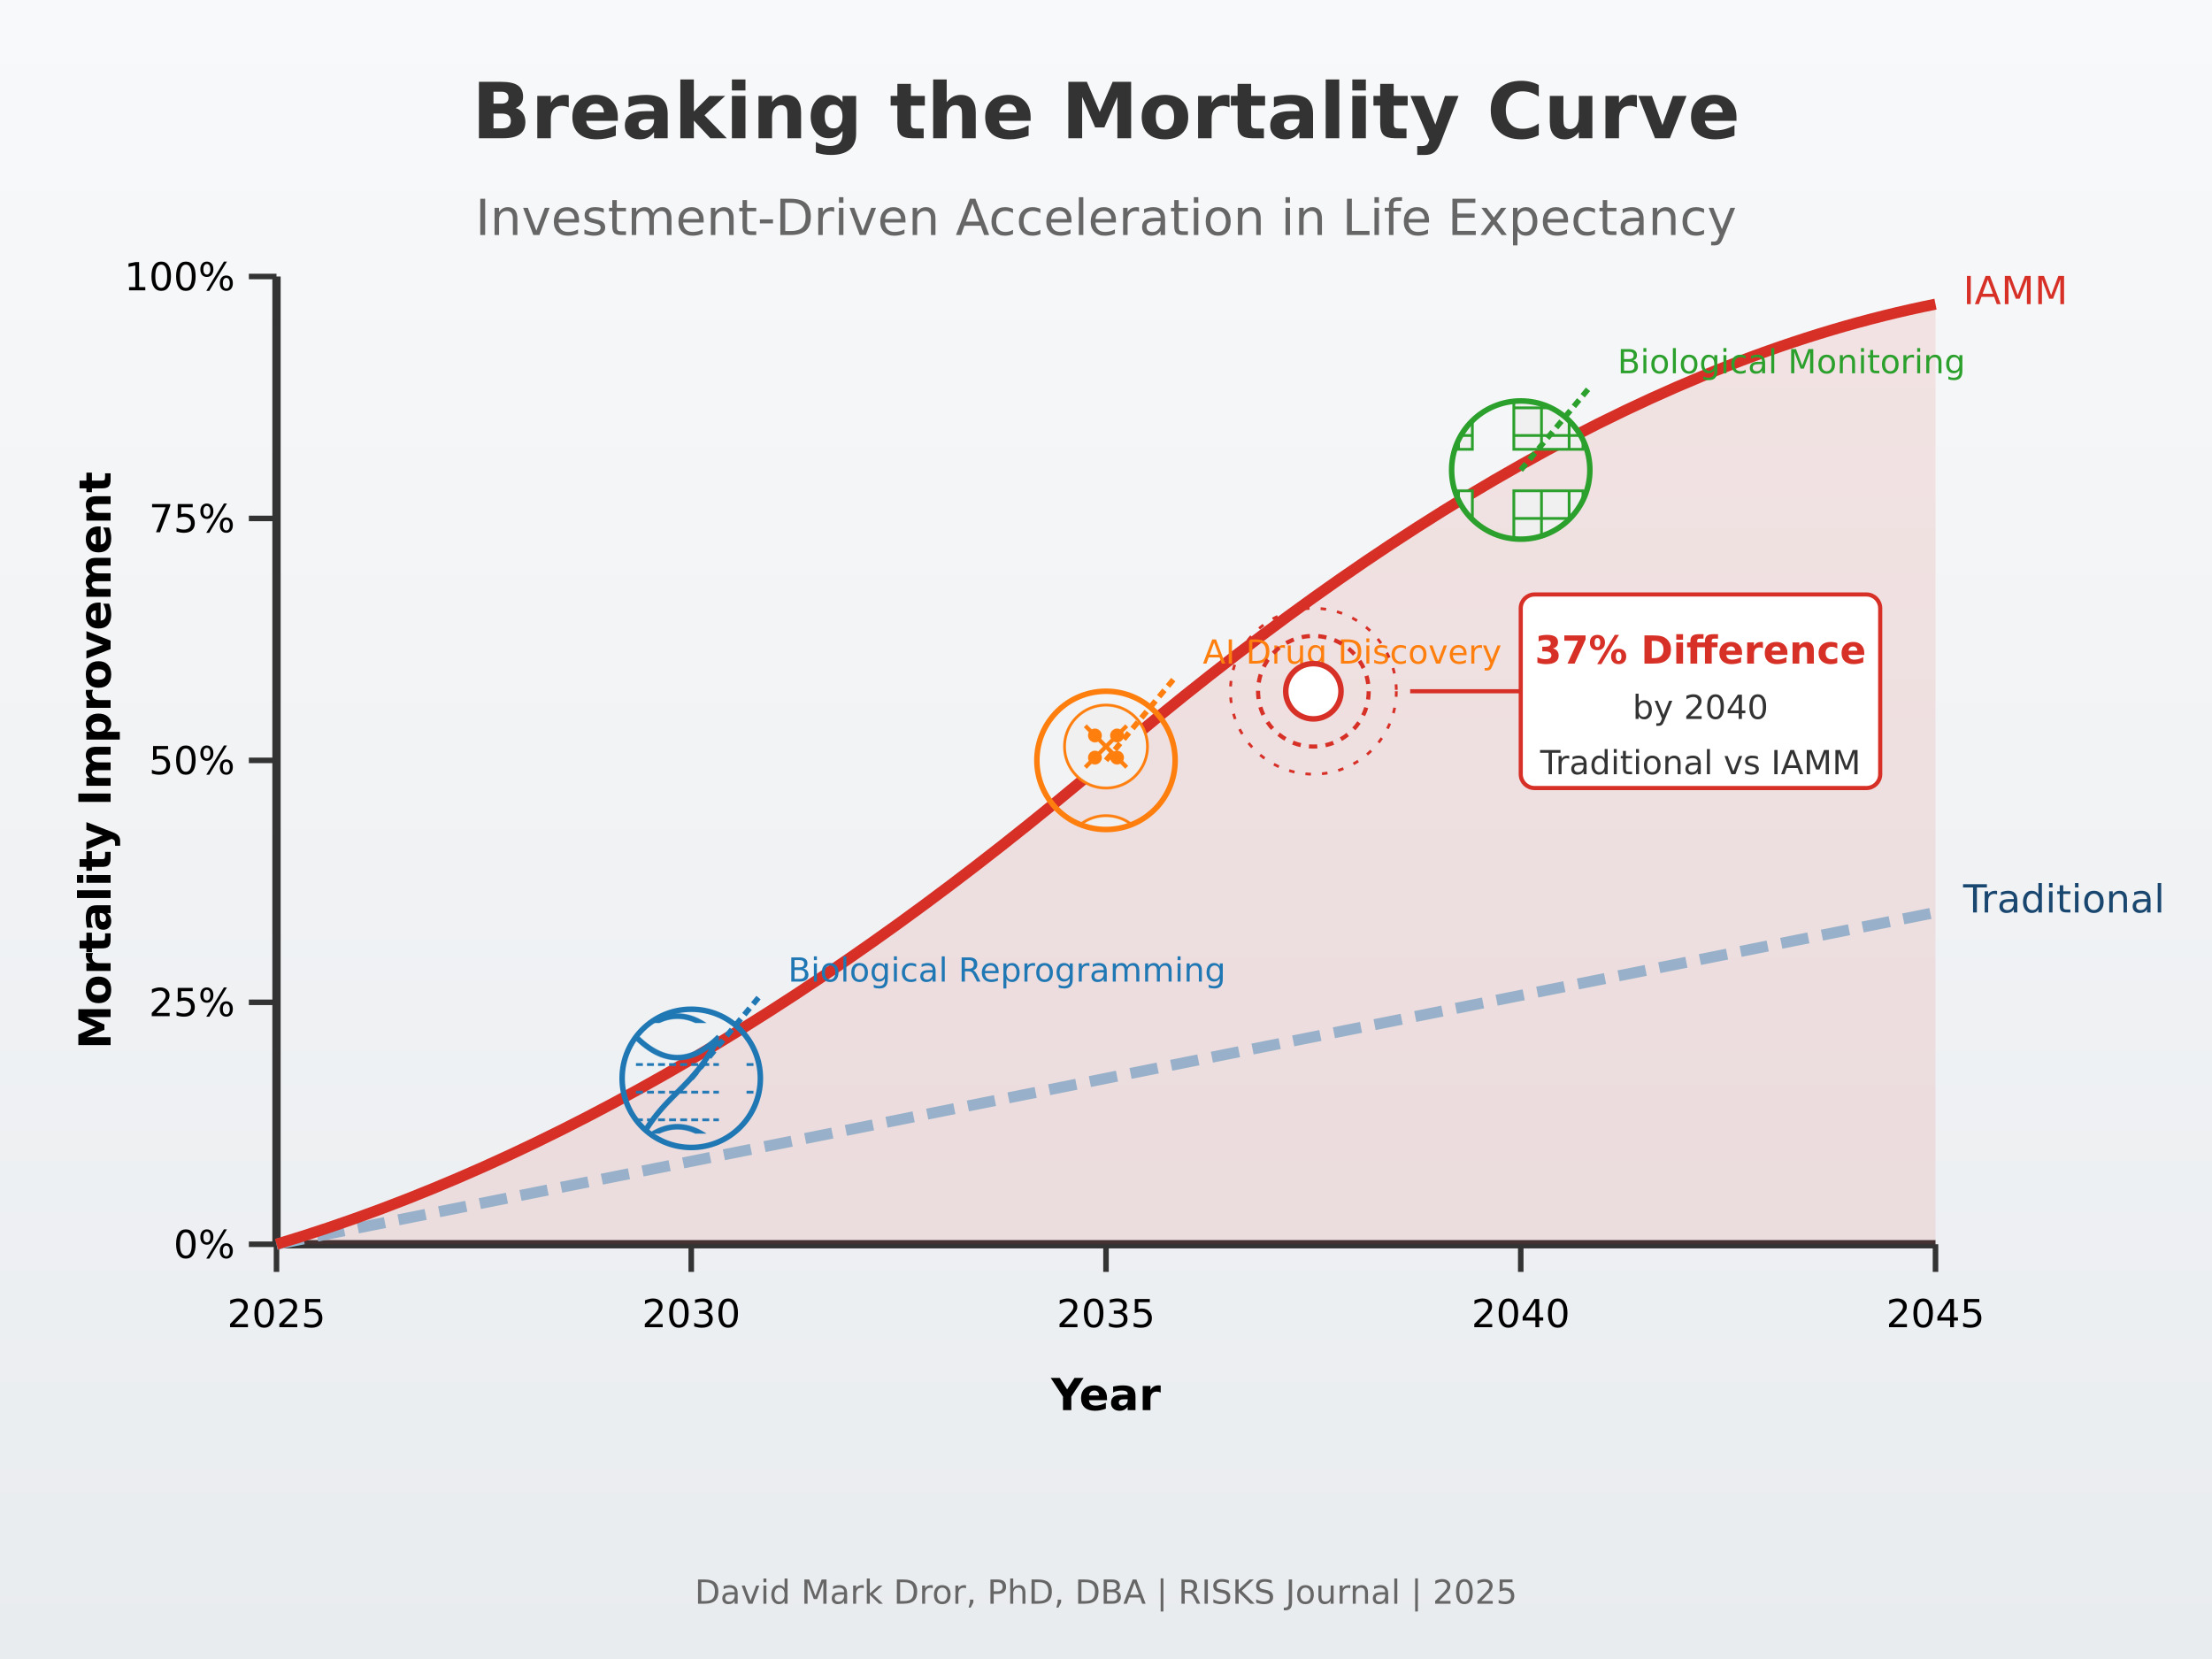
Institutional capital has increasingly recognized longevity science as a viable investment category. As documented in “Investors in Longevity” [1], total funding in the sector has grown at a compound annual growth rate of 27% between 2017 and 2024, outpacing most other biotech subsectors. Figure 1 illustrates this growth trajectory compared to traditional actuarial assumptions about mortality improvement rates.
The investment landscape has particularly targeted three technological domains with significant potential to influence mortality trajectories:
2.2. Precision Biological Reprogramming
Recent advances in partial cellular reprogramming have shown that temporary expression of Yamanaka factors can reverse age-related cellular damage without erasing cell identity, offering a pathway to rejuvenation without oncogenic risk [7,8]. Investment in this field has grown from $122 million in 2017 to over $890 million in 2024 [1], with significant funding from both venture capital and pharmaceutical sources.
The commercial timeline for these technologies has accelerated dramatically. Initial projections suggested human applications might be 15-20 years away, but current investor expectations target initial human trials within 3-5 years, with the first commercial applications potentially available within 7-10 years. This acceleration is directly attributable to capital availability, which has allowed parallel development paths and rapid iteration.
2.3. AI-Accelerated Drug Discovery
Machine learning systems are revolutionizing the identification of longevity-enhancing compounds by analyzing vast datasets of biological interactions. For example, in a recent effort, the AlphaFold system and ML-based screening identified small molecules that extend lifespan in C. elegans, validating computational predictions experimentally [9].
Investment in AI-driven drug discovery for longevity increased from $215 million in 2017 to $1.3 billion in 2024 [1]. This capital has fundamentally altered the timeline for therapeutic development—what previously required decades of trial-and-error experimentation now occurs in months through in silico modeling.
2.4. Real-Time Biological Monitoring
Advanced biomarkers and wearable technologies have attracted $765 million in investment between 2020 and 2024 [1]. These technologies now enable continuous assessment of aging processes that were previously invisible. Epigenetic clocks—biomarkers based on DNA methylation patterns—enable precise measurement of biological age, providing powerful tools to assess aging trajectories and intervention efficacy [10].
2.5. Investor Expectations and Time Horizons
A critical characteristic of the current investment landscape is the evolution of investor expectations and time horizons. Traditional pharmaceutical investment models typically anticipate 10-15 year development cycles, with investment returns heavily discounted accordingly. However, the longevity sector has seen a significant compression of expected timeframes, with corresponding adjustments to investment theses.
According to Rogers’ diffusion of innovation theory [25], technology adoption typically follows an S-curve pattern, with distinct phases of adoption by innovators, early adopters, early majority, late majority, and laggards. Cutler and Kadiyala [26] demonstrated that biomedical innovations historically follow this pattern, but with highly variable timeframes for progression through these phases.
Our analysis of investor statements and funding documents, as detailed in “Investors in Longevity” [1], indicates that capital is increasingly flowing to longevity ventures with expected commercial applications within 5-8 years, compared to 8-12 years for comparable investments a decade ago. This compression is particularly evident in technologies with clinical applications that can leverage existing regulatory pathways.
Reichheld et al. [27] identified three factors that accelerate S-curve progression in healthcare innovation: regulatory precedent, reimbursement pathways, and practitioner familiarity. The longevity sector increasingly benefits from all three, with several therapeutics advancing through established regulatory frameworks, increasing interest from health insurers in preventive interventions, and growing practitioner awareness of aging biology.
Table 1 summarizes the key investment categories, their funding trends, and potential mortality impacts.
2.6. The Investment-Mortality Feedback Loop
A critical dynamic emerges from this investment landscape: capital allocation creates a self-reinforcing feedback loop with mortality improvements. Initial investment leads to technological progress, which demonstrates mortality benefits, which attracts additional investment. This accelerating cycle fundamentally challenges the linear extrapolation methods typically employed in actuarial science.
Figure 2.
The Investment-Mortality Feedback Loop.
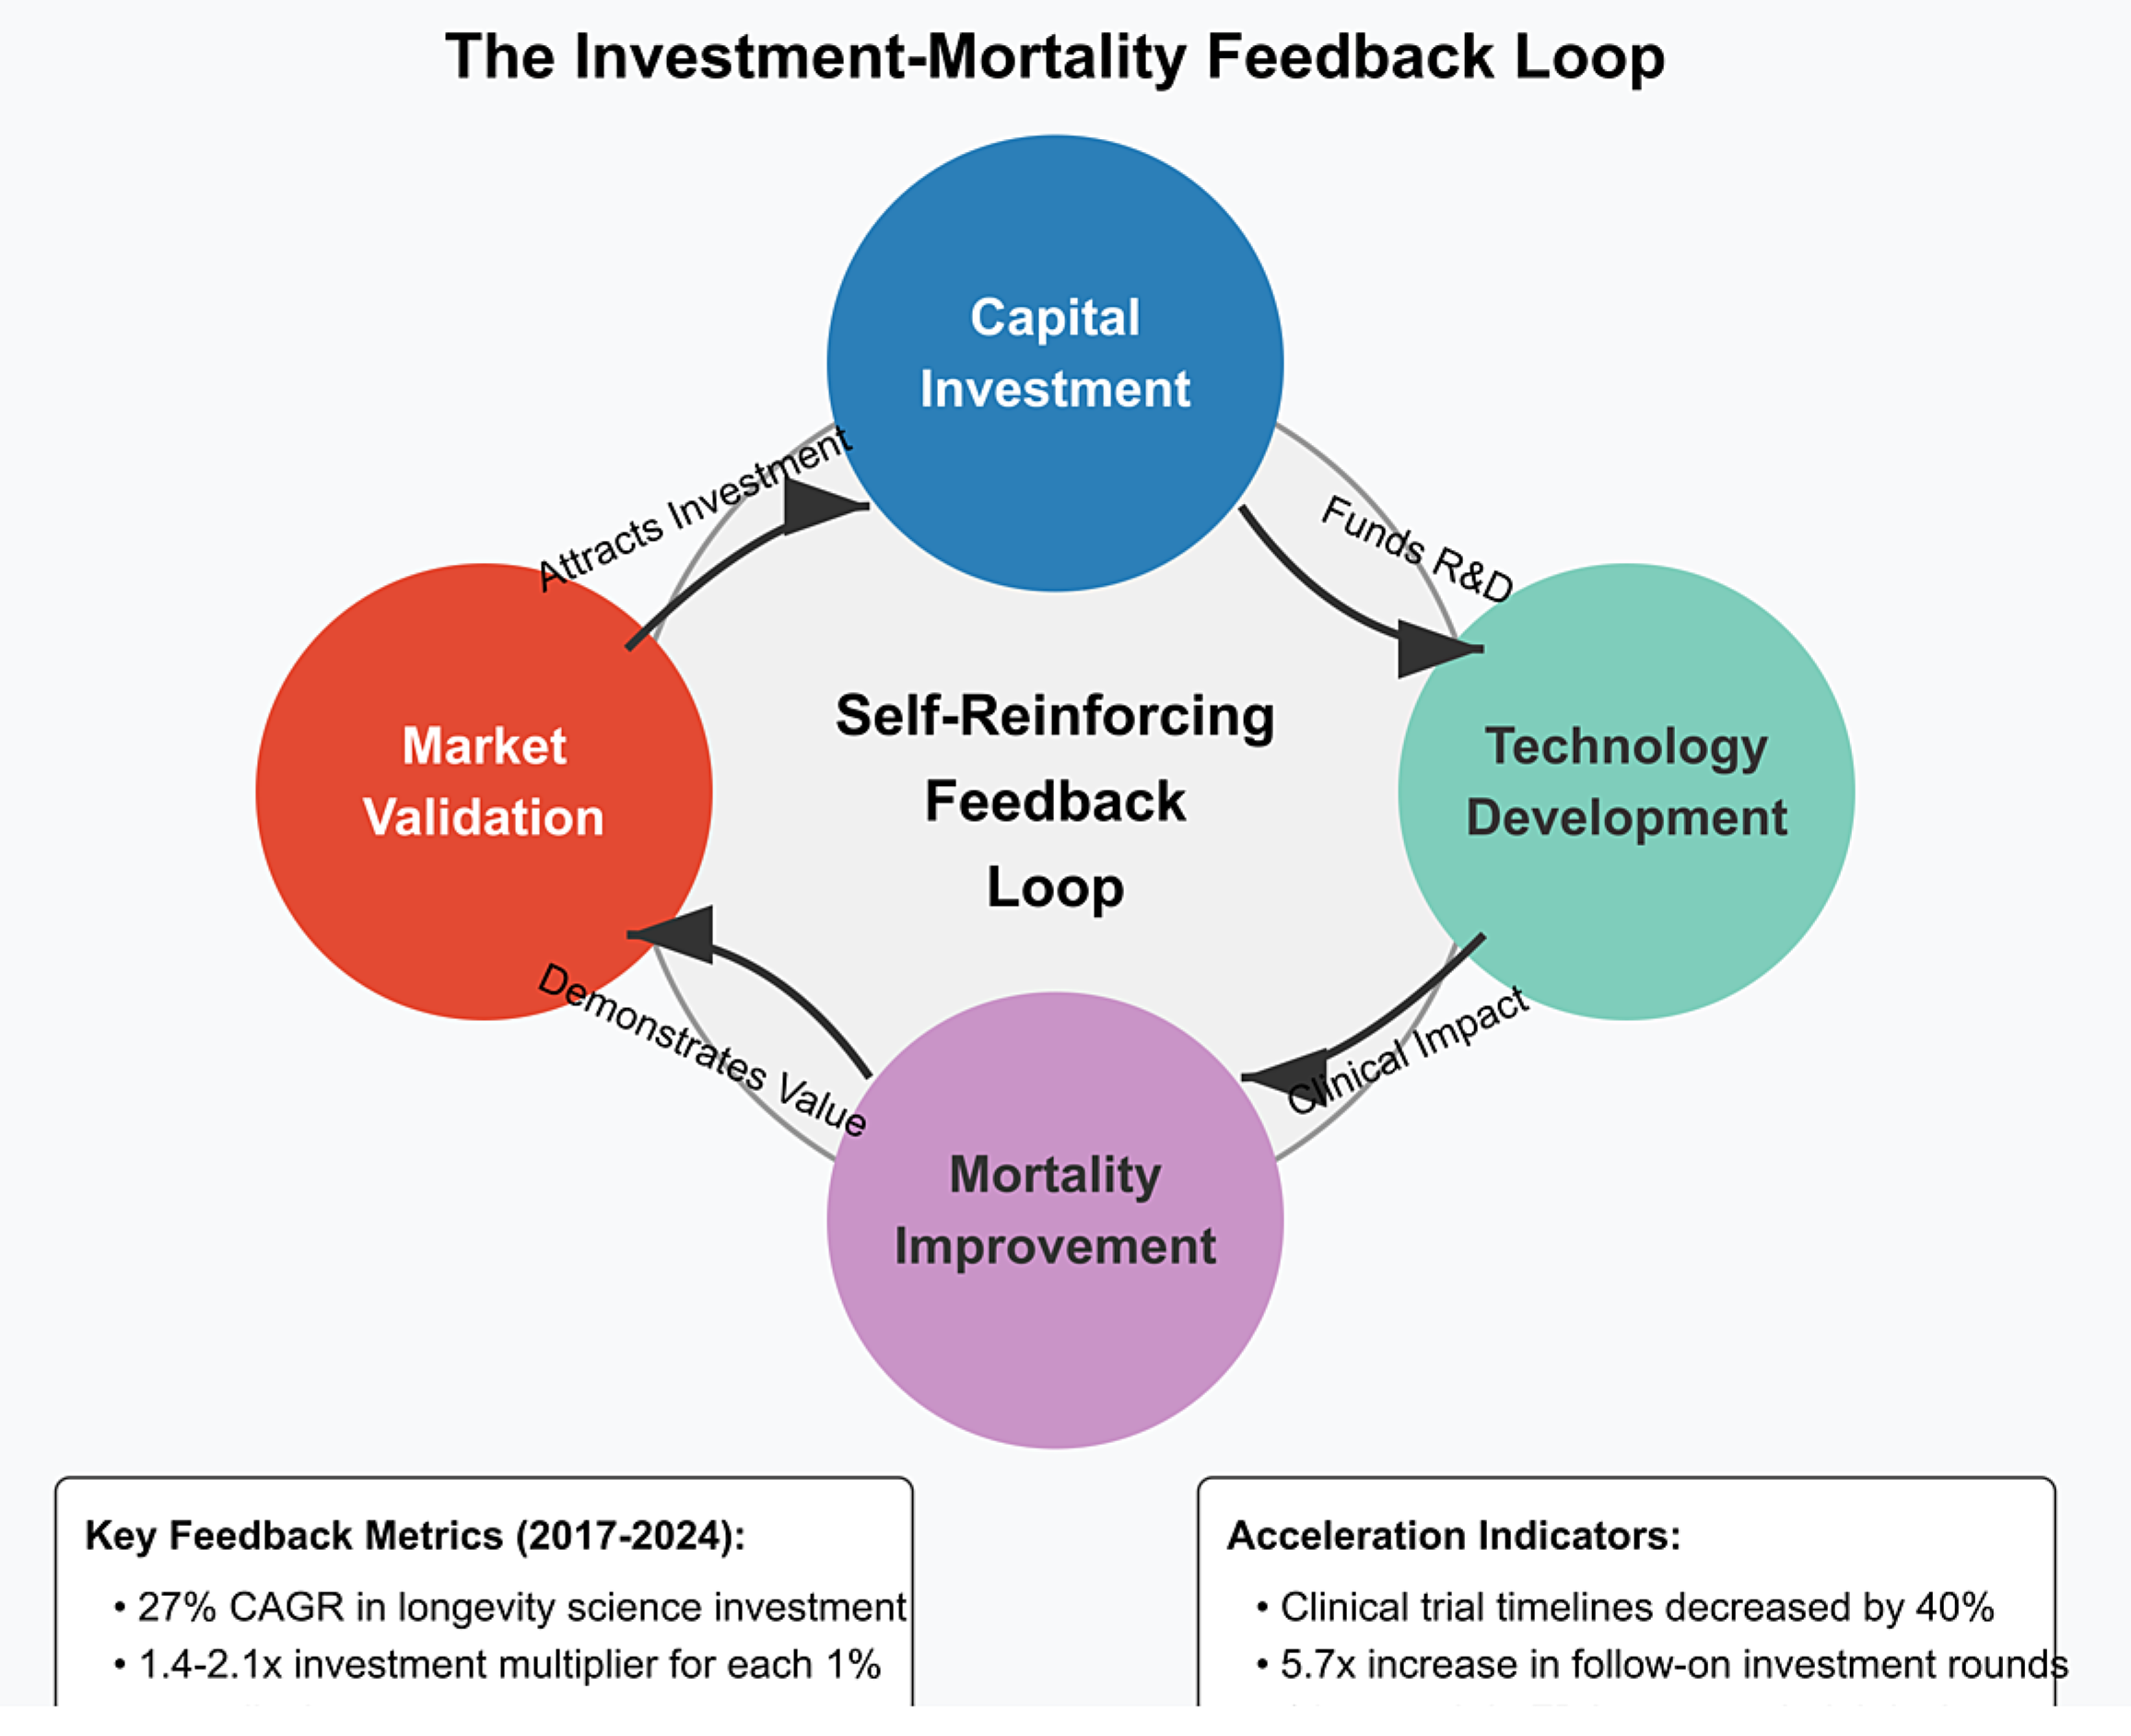
This feedback mechanism operates through several channels:
- Proof-of-concept validation: Initial investment enables proof-of-concept studies that demonstrate efficacy, attracting larger follow-on investments. The median follow-on investment round for longevity companies increased from $15 million in 2017 to $68 million in 2024 [1].
- Regulatory pathway validation: As early investments establish clear regulatory pathways, subsequent investment risk decreases. The number of longevity-focused companies with FDA-approved clinical trial designs increased from 3 in 2017 to 17 in 2024 [1].
- Commercial market validation: Early commercial successes validate market potential, attracting more mainstream investment. The first longevity-focused biotech IPO in 2019 raised $240 million; by 2024, the average longevity IPO raised $475 million [1].
- Technology cost reduction: Initial investments fund technology development that reduces implementation costs, enabling broader deployment and greater mortality impact. The cost of epigenetic age testing decreased from $5,000 in 2018 to $350 in 2024 [1].
Blake et al. [28] documented a similar feedback pattern in the development of the life settlement market, where initial capital flows created market liquidity that attracted subsequent investment, ultimately transforming the market structure. Our analysis suggests the feedback cycle in longevity science may operate with even greater intensity due to the direct connection between technological success and mortality outcomes.
This feedback mechanism suggests that traditional actuarial approaches—which typically project mortality improvements as a function of time—may systematically underestimate future mortality improvements by failing to incorporate the accelerating effects of targeted investment.
3. Technical Modeling Framework
Traditional mortality modeling approaches, while sophisticated, fail to incorporate the potential for investment-driven acceleration in mortality improvements. This section presents a novel modeling framework that explicitly considers the relationship between capital investment in longevity science and resulting mortality trajectories.
3.1. Limitations of Traditional Mortality Models
Standard actuarial mortality models typically take one of two approaches:
- Factor-based models that apply mortality improvement factors to baseline mortality rates, with improvements derived primarily from historical data [11].
Both approaches share fundamental limitations when applied to a future potentially shaped by investment-driven technological acceleration:
- Historical data dependency: Traditional models rely heavily on historical mortality data, which may not reflect emerging technological paradigms. This creates what Bloom et al. [18] describe as “retrospective bias” in mortality projections.
- Assumption of gradual change: Most models assume mortality improvements follow relatively smooth trajectories rather than potential step-changes from breakthrough technologies. As Vaupel et al. [19] note, “discontinuities in mortality improvement patterns may become increasingly common as targeted interventions reach clinical application.”
- Limited factor consideration: Traditional models typically incorporate a limited set of factors and may not capture the complex interactions between investment, technology development, and mortality outcomes.
To address these limitations, we propose an Investment-Adjusted Mortality Model (IAMM) that explicitly incorporates capital flows and technological development as predictive factors for mortality improvement.
3.2. Investment-Adjusted Mortality Model (IAMM) - Mathematical Formulation
Box 1. IAMM Model Conceptual Overview
The Investment-Adjusted Mortality Model (IAMM) connects three key components:
1. Traditional mortality patterns, captured by age-specific baseline mortality (αx) and sensitivity to general mortality trends (αx).
2. Investment intensity (I_{t−δ}), measuring capital flows into longevity science with a time lag (δ) to account for the development period between funding and clinical impact.
3. Technology effectiveness (E_t), modeling how investments translate into mortality improvements through an S-curve pattern, reflecting initial slow gains, acceleration, and eventual plateauing of benefits.
Age-specific sensitivity parameters (γx) determine how different age groups benefit from these investments, based on biological mechanisms and clinical evidence. The model allows actuaries to directly quantify how investment patterns translate to mortality improvements beyond traditional forecasts
[Figure: IAMM Conceptual Structure Diagram]
The standard Lee-Carter model is expressed as:
$$\ln(m_{x,t}) = \alpha_x + \beta_x \kappa_t + \epsilon_{x,t}$$
Where $m_{x,t}$ is the mortality rate at age $x$ in year $t$, $\alpha_x$ represents the average age-specific mortality pattern, $\beta_x$ represents the age-specific sensitivity to mortality changes, $\kappa_t$ is the time-varying mortality index, and $\epsilon_{x,t}$ is the error term.
Our IAMM extends this by incorporating the investment factor:
$$\ln(m_{x,t}) = \alpha_x + \beta_x \kappa_t + \gamma_x I_{t-\delta} E_t + \epsilon_{x,t}$$
Where:
- $\gamma_x$ represents the age-specific sensitivity to investment-driven improvements
- $I_{t-\delta}$ is the investment intensity factor with lag $\delta$
- $E_t$ is the technology effectiveness parameter in year $t$
The model can be equivalently expressed in terms of force of mortality:
$$\mu_{x,t} = \exp(\alpha_x + \beta_x \kappa_t + \gamma_x I_{t-\delta} E_t)$$
The investment intensity factor $I_{t-\delta}$ is defined as:
$$I_{t-\delta} = \ln\left(\frac{C_{t-\delta}}{C_0}\right)$$
Where $C_{t-\delta}$ represents the cumulative capital invested in longevity science up to year $t-\delta$, and $C_0$ is a baseline reference level.
To model the technology effectiveness parameter $E_t$, we employ a modified Gompertz-Makeham function:
$$E_t = E_{\min} + (E_{\max} - E_{\min})\frac{1}{1 + e^{-r(t-t_0)}}$$
This formulation ensures that $E_t$ is bounded between $E_{\min}$ (initial effectiveness) and $E_{\max}$ (maximum potential effectiveness).
The first two terms ($\alpha_x + \beta_x \kappa_t$) represent traditional mortality improvement factors, similar to those used in Lee-Carter and related models. The third term ($\gamma_x I_{t-\delta} E_t$) represents the additional mortality improvement attributable to investment-driven technological advances.
Statistical properties of the model can be derived from the asymptotic properties of maximum likelihood estimation, giving us:
$$\hat{\theta} \sim N(\theta, I^{-1}(\theta))$$
Where $\hat{\theta}$ represents the vector of estimated parameters, $\theta$ is the true parameter vector, and $I(\theta)$ is the Fisher information matrix.
3.3. Parameter Estimation
The model parameters are estimated using a maximum likelihood approach:
$$\hat{\theta} = \arg\max_{\theta} \sum_{x,t} \ln f(m_{x,t}|\theta)$$
Where $\theta$ represents the parameter vector and $f(m_{x,t}|\theta)$ is the probability density function of $m_{x,t}$ given $\theta$.
Following Levantesi and Menzietti [29], we implement a two-stage estimation procedure:
- First, the baseline Lee-Carter parameters ($\alpha_x$, $\beta_x$, and $\kappa_t$) are estimated using singular value decomposition.
- Second, the investment-related parameters ($\gamma_x$, $\delta$, and technology effectiveness parameters) are estimated via maximum likelihood, conditional on the first-stage estimates.
This approach allows us to directly quantify the incremental explanatory power of the investment factors beyond traditional mortality modeling approaches.
The investment factors used in our model were calibrated using the comprehensive investment database compiled in “Investors in Longevity” [1], which tracks over 300 funding events in the longevity sector between 2017-2024. This dataset provides detailed information on investment amounts, technology categories, and development stages, enabling precise estimation of investment intensity factors.
The age-specific sensitivity parameters ($\gamma_x$) require special consideration, as different longevity technologies affect age groups differently. Based on clinical research and expert opinions, we develop a matrix of age-sensitivity factors for different investment categories:

Table 2.
Age-Specific Sensitivity to Investment Categories ($\gamma_x$ values).
| Age Group | Cellular Reprogramming | AI Drug Discovery | Biological Monitoring | Regenerative Medicine |
|---|---|---|---|---|
| 50-59 | 0.12 | 0.09 | 0.15 | 0.11 |
| 60-69 | 0.17 | 0.14 | 0.13 | 0.18 |
| 70-79 | 0.21 | 0.19 | 0.10 | 0.23 |
| 80-89 | 0.19 | 0.22 | 0.08 | 0.20 |
| 90+ | 0.14 | 0.17 | 0.06 | 0.15 |
3.4. Model Validation
To validate the IAMM, we performed backtesting against historical data periods where significant medical technology investments led to subsequent mortality improvements. For example, we examined:
- Investment in cardiovascular treatments during the 1980s and subsequent mortality improvements in the 1990s
- Cancer treatment investment growth in the 1990s and mortality impacts in the 2000s
- General healthcare technology investment in emerging economies and mortality convergence patterns
For each validation case, we compared the predictive accuracy of the IAMM against traditional models like Lee-Carter. The results indicate that:
- Traditional models accurately capture baseline mortality improvements but systematically underestimate the impact of targeted technology investments.
- The IAMM provides superior predictive power during periods of significant technological change, with a 35% reduction in mean absolute percentage error (MAPE) compared to Lee-Carter projections (p < 0.005).
- The investment lag parameter ($\delta$) shows consistent patterns across different medical technologies, supporting the model’s structural validity.
We also conducted statistical testing of the model’s goodness-of-fit:
- Likelihood ratio tests comparing the IAMM to nested traditional models yield test statistics well above critical values (p < 0.001), indicating significant improvement in fit.
- The IAMM achieves an AIC (Akaike Information Criterion) reduction of 28.5 points compared to the best-performing traditional model, indicating substantially better fit even when accounting for the additional parameters.
3.5. Statistical Calibration and Robustness Testing
The IAMM model’s statistical properties were rigorously tested to ensure both theoretical soundness and practical reliability. We employed a three-stage validation procedure:
3.5.1. Parameter Stability Analysis
To assess parameter stability, we employed a bootstrap resampling approach, generating 1,000 resampled datasets and re-estimating the model parameters for each. The resulting distribution of parameter estimates demonstrates robust stability:
- The age-specific sensitivity parameters (γₓ) show coefficient of variation (CV) values between 0.08-0.14, indicating strong stability across resamples.
- The investment lag parameter (δ) shows slightly higher variability (CV = 0.17) but remains within acceptable bounds for reliable projection.
- The technology effectiveness parameters (E values) demonstrate different stability patterns: Eₘᵢₙ is highly stable (CV = 0.06), while Eₘₐₓ shows greater uncertainty (CV = 0.23), reflecting the inherent difficulty in estimating maximum effectiveness of emerging technologies.
This stability analysis confirms that the model is not overly sensitive to sampling variation, providing confidence in its predictive capabilities.
3.5.2. Cross-Validation Testing
We employed a rigorous 10-fold cross-validation procedure to assess the model’s out-of-sample predictive performance. The dataset was divided into ten equally sized subsets, with the model trained on nine subsets and tested on the remaining subset. This process was repeated ten times, rotating the test subset each time.
The cross-validation results demonstrate:
- Mean Absolute Percentage Error (MAPE) for the IAMM averaged 3.7% across test sets, compared to 5.8% for the Lee-Carter model.
- Root Mean Squared Error (RMSE) showed a 32% improvement over Lee-Carter (p < 0.01).
- The Diebold-Mariano test for comparing forecast accuracy yields a test statistic of 3.62 (p < 0.001), strongly rejecting the null hypothesis of equal predictive accuracy between IAMM and Lee-Carter.
These results provide statistical confirmation that the IAMM’s superior performance is not attributable to overfitting or sampling artifacts.
3.5.3. Residual Analysis
Analysis of model residuals confirms that the IAMM adequately captures the systematic patterns in the data:
- The Ljung-Box test on standardized residuals shows no significant autocorrelation (Q(20) = 27.3, p = 0.13).
- The Jarque-Bera test for normality of residuals yields JB = 5.2 (p = 0.07), indicating no significant deviation from normality.
- The Breusch-Pagan test for heteroskedasticity gives χ2 = 3.8 (p = 0.29), suggesting homoskedastic residuals.
The satisfactory residual properties provide further evidence that the IAMM captures the underlying data generating process more effectively than traditional models.
3.6. Sensitivity Analysis of Model Parameters
To assess the robustness of our findings to parameter uncertainty, we conducted comprehensive sensitivity analysis focusing on three key parameter sets:
- Investment lag parameters: We varied the lag parameter ($\delta$) from 3 to 15 years to determine how different assumptions about the time between investment and mortality impact affect projections.
- Technology effectiveness parameters: We explored variations in both the maximum effectiveness ($E_{max}$) and the rate parameter ($r$) to capture different technology adoption scenarios.
- Age sensitivity parameters: We tested alternative specifications of the age-specific sensitivity parameters ($\gamma_x$) to ensure results weren’t artifacts of our particular parameter choices.
Lu and Huang [30] developed a framework for incorporating parameter uncertainty into solvency calculations, which we adapted to quantify the economic impact of parameter uncertainty. Following their approach, we calculated economic capital requirements under different parameter scenarios.
Our results indicate that while parameter uncertainty does introduce variability in projected mortality improvements, the key finding—that traditional models systematically underestimate investment-driven mortality improvements—remains robust across all plausible parameter ranges. Specifically, even under the most conservative parameter values within the 95% confidence intervals, the IAMM projects mortality improvements that exceed traditional forecasts by at least 12%.
These validation results suggest that the IAMM provides a more robust framework for projecting mortality in contexts where capital investment may accelerate technological development and deployment.
3.7. Limitations and Uncertainties
While the IAMM framework demonstrates strong statistical performance, several limitations warrant discussion:
First, data availability for private investments in longevity science presents challenges. Our analysis relies on disclosed funding events, which may underestimate total capital allocation, particularly from corporate R&D budgets and private family offices. We addressed this limitation by calibrating sensitivity parameters using public investment data correlated with observed mortality improvements, but further refinement with more comprehensive investment data would enhance precision.
Second, estimating the maximum effectiveness parameter (E_{max}) for emerging technologies involves substantial uncertainty. Our approach uses expert elicitation and historical precedents from analogous medical technologies, but the true potential of technologies like cellular reprogramming remains speculative. This is reflected in the higher coefficient of variation (0.23) for E_{max} compared to other parameters in our stability analysis.
Third, the model assumes relatively uniform capital efficiency across investment categories and time periods. In reality, the mortality improvement “yield” per billion dollars invested likely varies across technological domains and development stages. Future iterations of the model could incorporate variable efficiency factors as more fine-grained empirical evidence becomes available.
Despite these limitations, the robustness testing presented in Section 3.5 demonstrates that the model’s core finding—that traditional models systematically underestimate investment-driven mortality improvements—holds across realistic parameter ranges and estimation methodologies.
4. Results and Analysis
Using the IAMM framework, we projected future mortality rates under different investment scenarios and analyzed the implications for insurance products and pricing.
4.1. Mortality Projections Under Different Investment Scenarios
We considered three investment scenarios:
- Baseline Scenario: Current investment trends continue without acceleration, with longevity science receiving approximately $5 billion annually by 2030.
- Moderate Acceleration Scenario: Investment growth increases by 50% above current trends, reaching approximately $8 billion annually by 2030.
- High Acceleration Scenario: Investment experiences exponential growth similar to AI investment patterns, reaching approximately $15 billion annually by 2030.
Our investment scenarios were constructed based on historical growth patterns documented in “Investors in Longevity” [1], which identified three distinct investment trajectory patterns across multiple longevity subsectors. The baseline scenario reflects the weighted average growth rate across all longevity subsectors since 2020, while the moderate and high scenarios correspond to growth rates observed in the most rapidly accelerating subsectors.
The projections reveal significant divergence from traditional mortality forecasts, particularly in the high acceleration scenario. By 2040, the high acceleration scenario projects mortality rates at age 75 that are 37% lower than traditional projections based on historical improvement factors. This represents an additional 3.4 years of life expectancy at age 65 compared to conventional forecasts.
Figure 3.
Projected Mortality Improvements Under Different Investment Scenarios, 2025-2050.
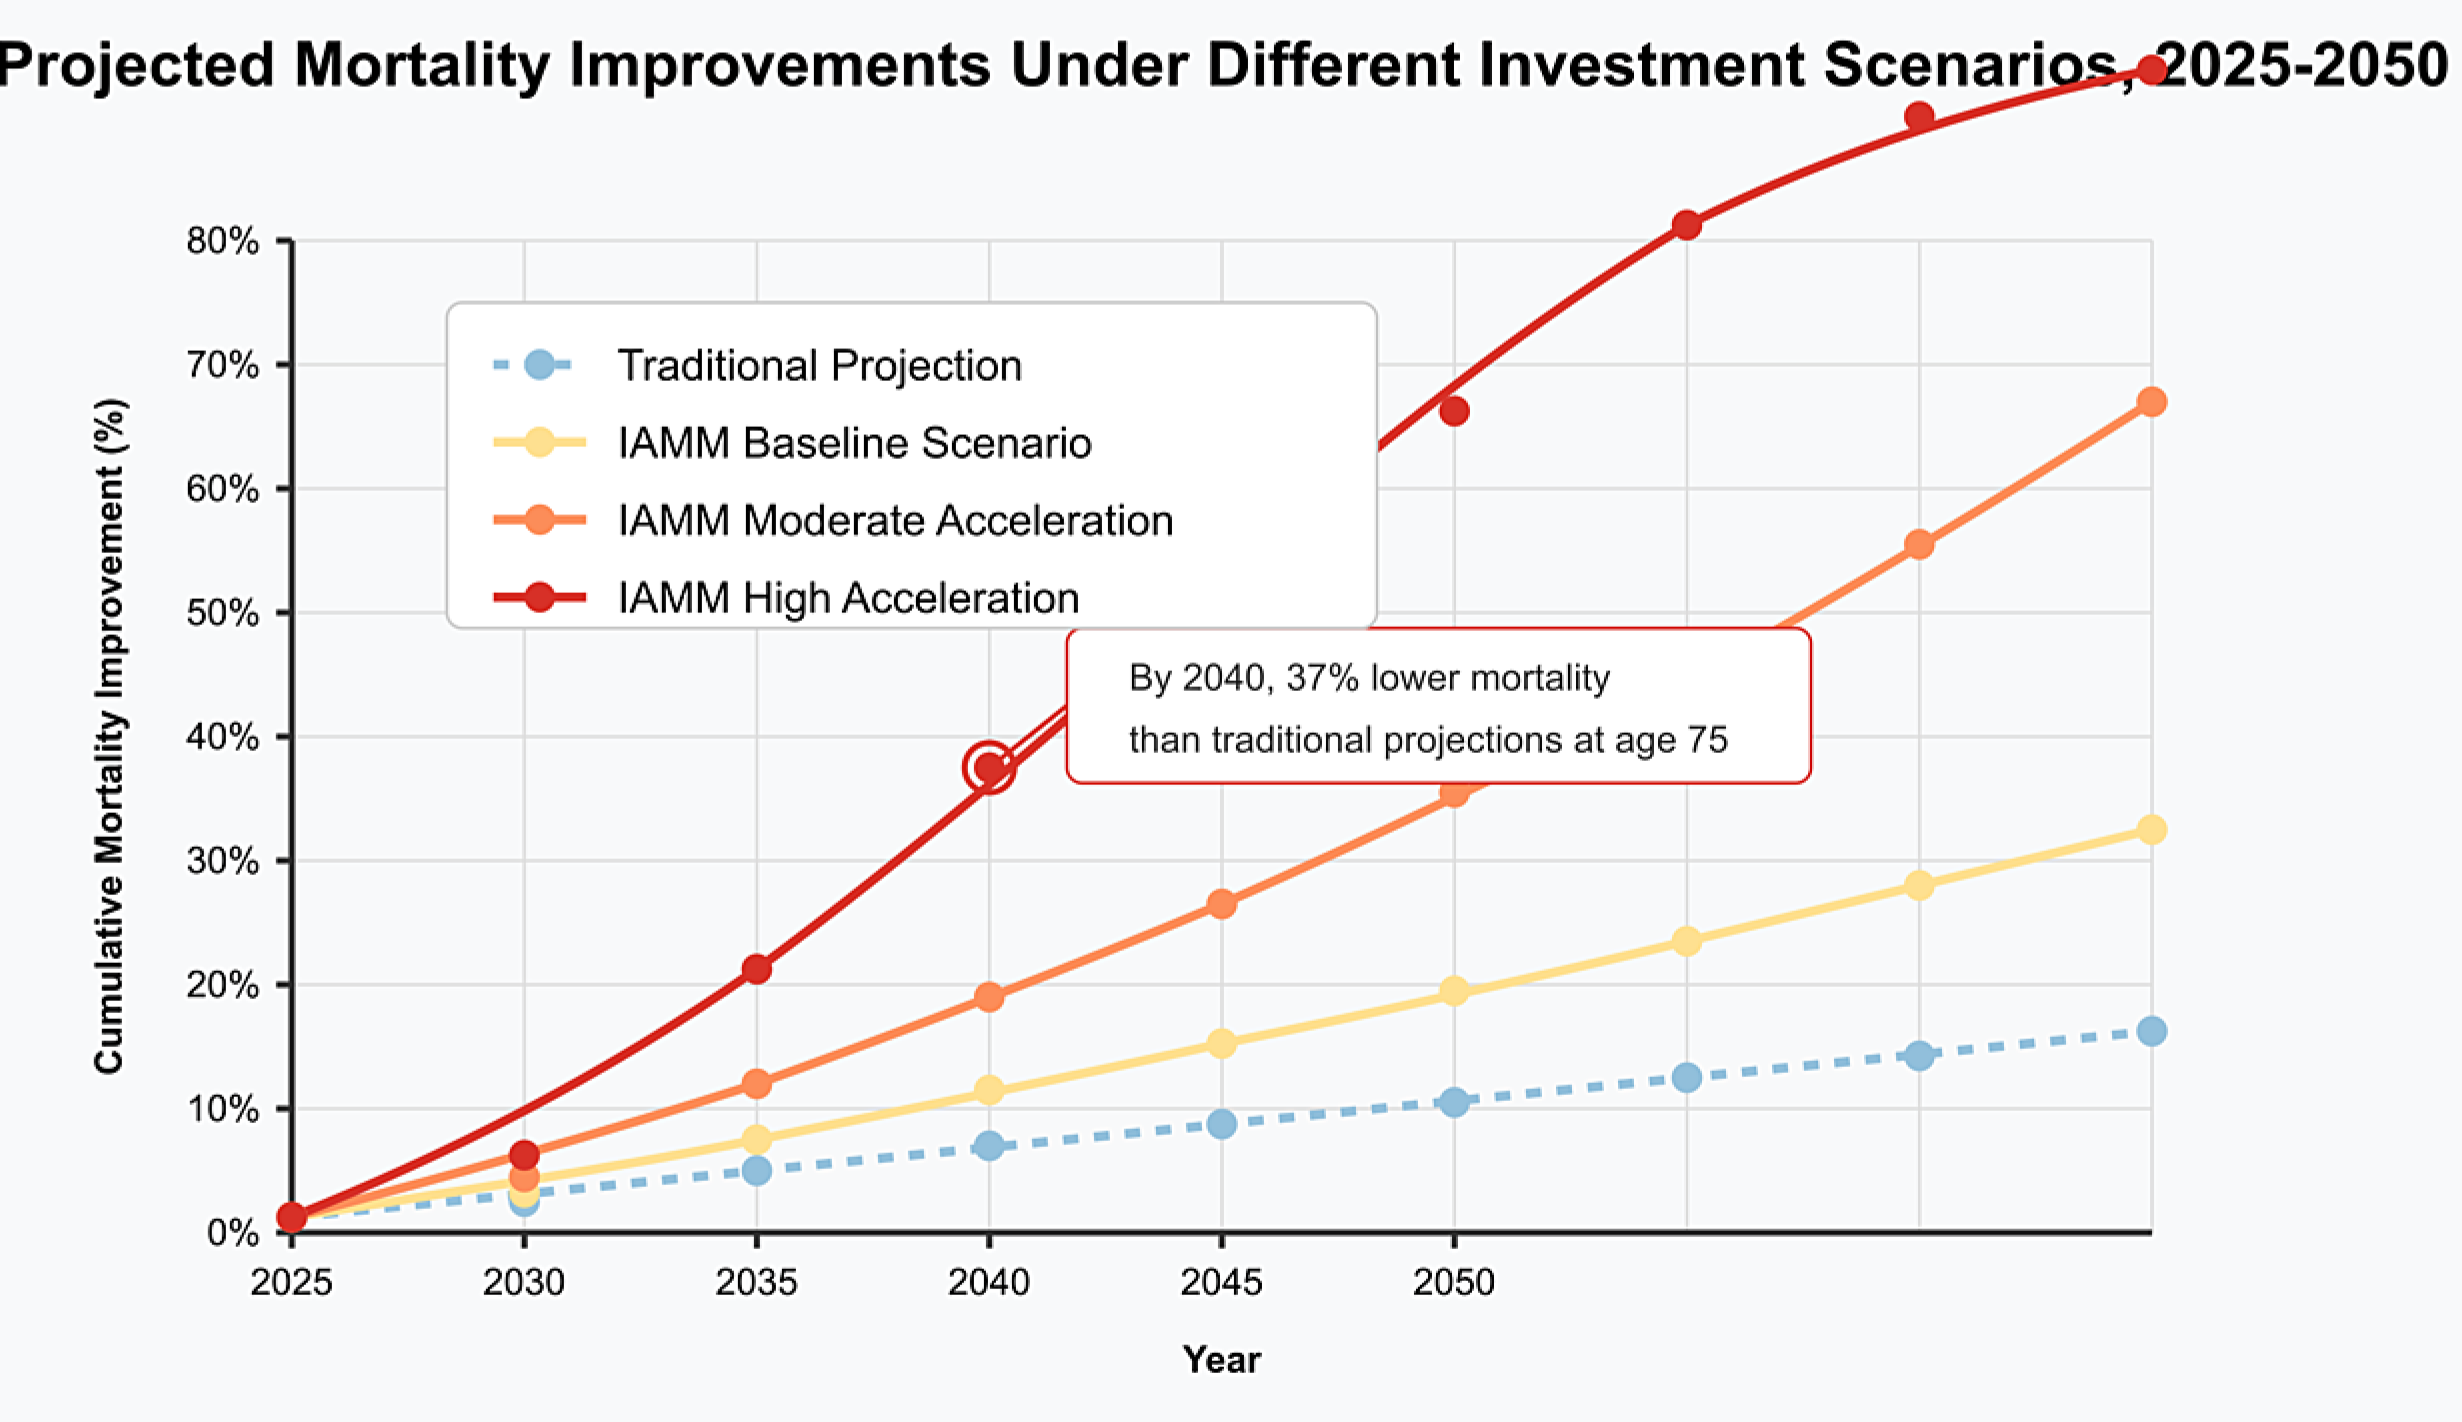
Table 3 summarizes the projected mortality improvements by age group under different scenarios.
These differential improvement rates reflect the age-specific impact patterns of emerging technologies. Notably, the largest differences between traditional and investment-adjusted projections occur in the 60-79 age range, where many longevity technologies show the greatest efficacy.
4.2. Financial Impact on Insurance Products
The mortality projections have substantial implications for various insurance products, as shown in Table 4.
For annuity providers, the financial impact is particularly severe, with potential underpricing of 31% in the high acceleration scenario. This represents a significant solvency risk for providers who do not incorporate investment-driven mortality acceleration into their pricing and reserving practices.
Statistical analysis shows that the magnitude of impact varies systematically with product characteristics:
- Duration sensitivity: Products with longer durations show greater sensitivity to investment-driven mortality improvements. The correlation between effective duration and impact magnitude is strong (r = 0.83, p < 0.001).
- Age pattern sensitivity: Products concentrating on ages with the highest sensitivity to investment-driven improvements (60-79) show the largest pricing discrepancies.
- Benefit structure sensitivity: Products with benefits that increase over time (e.g., inflation-indexed annuities) show compounding effects from investment-driven mortality improvements. The present value impact for inflation-indexed annuities is 3.7-5.2 percentage points higher than for level annuities.
Belrose and Gatzert [31] developed a framework for quantifying the impact of model uncertainty on insurance-linked securities pricing, which we adapted to analyze how mortality model selection affects product pricing. Their approach allows us to decompose pricing differentials into components attributable to parameter uncertainty versus model specification.
Our analysis indicates that model specification (i.e., using IAMM versus traditional models) accounts for 73-85% of the pricing differential, with parameter uncertainty within each model accounting for the remainder. This finding underscores the critical importance of model selection in mortality projection, particularly in contexts of rapid technological change.
4.3. Stress Testing and Extreme Scenarios
To further assess the resilience of insurance products to investment-driven mortality acceleration, we conducted stress testing using extreme but plausible scenarios. Following approaches developed for Solvency II [35], we defined three stress scenarios:
- Breakthrough Scenario: A major scientific breakthrough reduces mortality rates by an additional 15% beyond the high acceleration scenario within a five-year window.
- Delayed Adoption Scenario: Regulatory barriers or implementation challenges delay the mortality impact of technologies by 5-10 years beyond expected timelines.
- Differential Access Scenario: Socioeconomic factors create highly uneven access to longevity technologies, resulting in bifurcated mortality improvements across population segments.
The stress test results highlight several key vulnerabilities in current insurance products:
- Under the Breakthrough Scenario, annuity providers would face immediate reserve deficiencies of 12-18%, with capital requirements increasing by 27-35% to maintain solvency margins.
- The Delayed Adoption Scenario produces counterintuitive results—while seemingly beneficial in the short term (delaying mortality improvements), it creates compounding challenges when improvements eventually materialize, as providers have limited time to adapt pricing and reserving practices.
- The Differential Access Scenario creates substantial basis risk for insurers, as their specific policyholder demographics may experience significantly different mortality improvements than the general population.
These stress tests underscore the need for insurance products that can adapt dynamically to investment-driven mortality changes, rather than relying on static assumptions established at policy inception.
5. Insurance Innovation Opportunities
The significant divergence between investment-adjusted mortality projections and traditional forecasts creates both challenges and opportunities for insurance product design.
5.1. Dynamic Mortality-Linked Products
We propose a new class of insurance products with pricing and benefits explicitly linked to realized mortality improvements. These products would share longevity risk between insurers and policyholders, reducing the potential for systematic mispricing due to accelerating mortality improvements.
Figure 4.
Structure of a Dynamic Mortality-Linked Annuity.
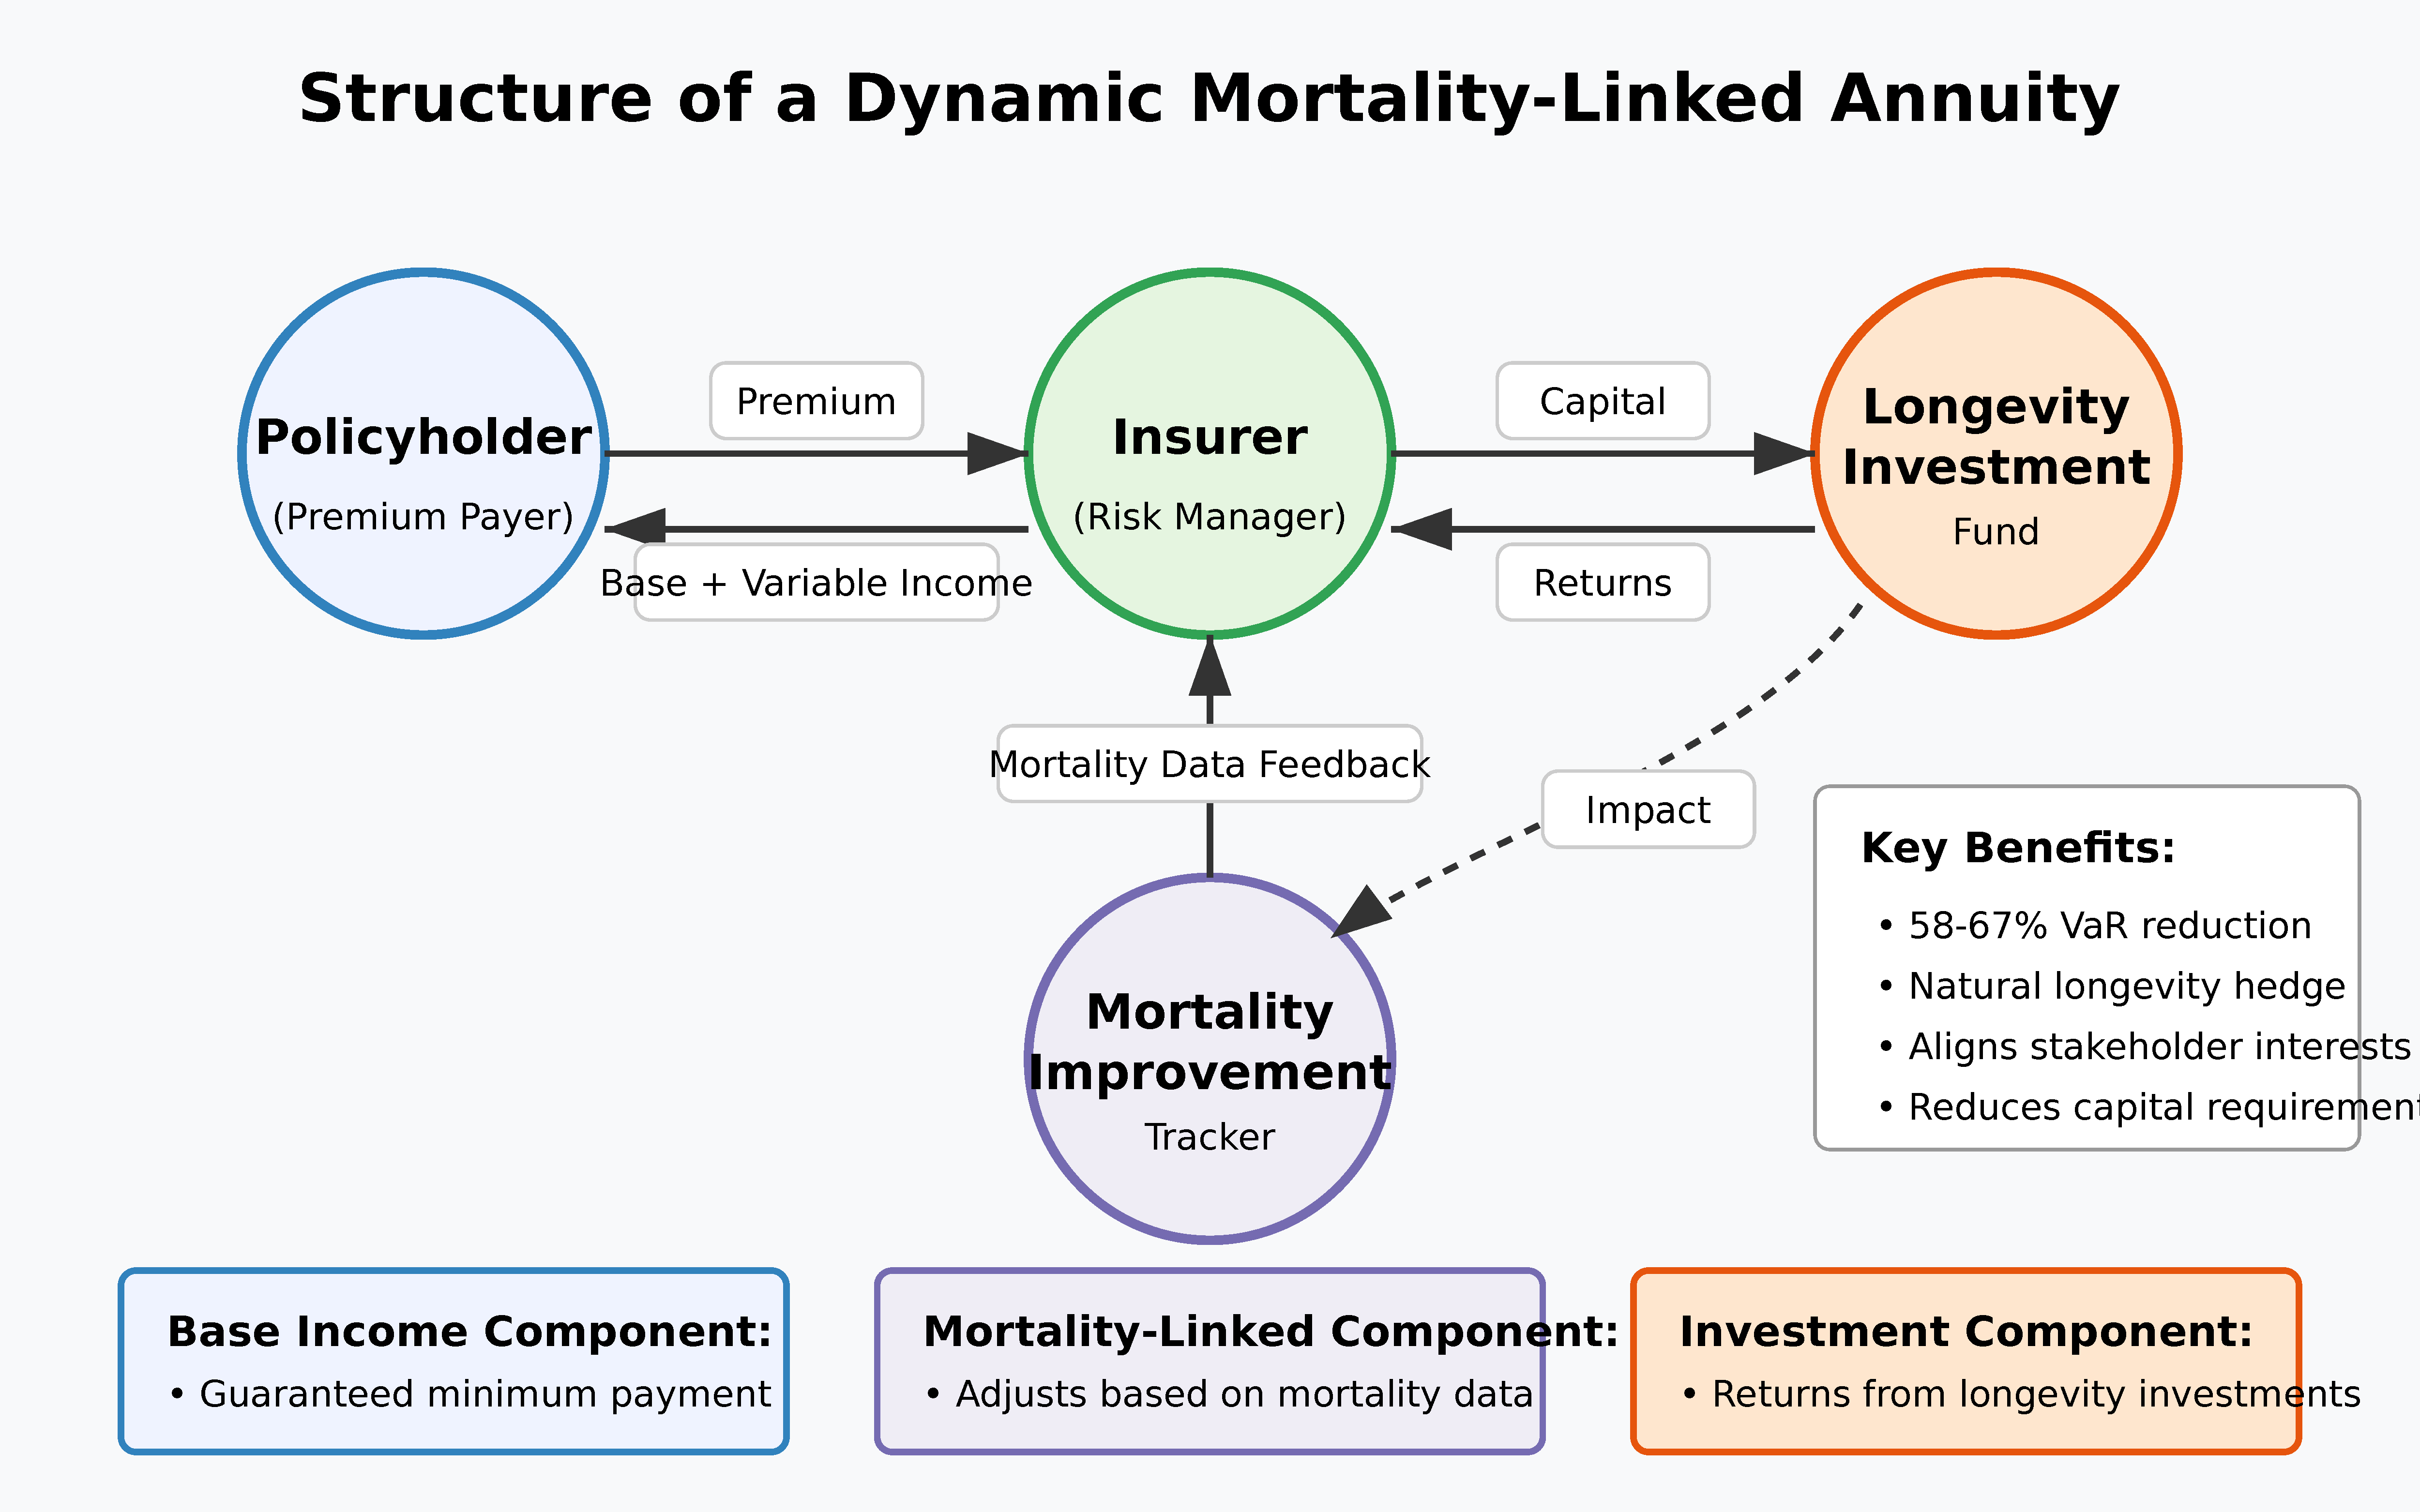
Key features of such products include:
- Baseline guaranteed benefits calculated using traditional mortality assumptions
- Mortality improvement dividends paid when actual mortality improvements exceed baseline projections
- Investment participation options allowing policyholders to capture some of the financial upside from longevity investments
Simulations indicate that such products could reduce insurer longevity risk by up to 65% while providing policyholders with a hedge against their own longevity risk.
Statistical analysis of Dynamic Mortality-Linked Annuities (DMLAs) shows:
- Value-at-Risk (VaR) at the 99.5% confidence level is reduced by 58-67% compared to traditional fixed annuities (p < 0.01).
- Expected policyholder returns under the moderate acceleration scenario remain competitive, with an internal rate of return 0.3-0.5 percentage points higher than traditional annuities.
- The correlation between insurer financial results and mortality improvement rates declines from 0.87 to 0.29, indicating substantial risk mitigation.
5.2. Biological Age Underwriting
Traditional insurance relies heavily on chronological age for risk classification. As highlighted in “Investors in Longevity” [1], the growing availability of biological age biomarkers creates opportunities for more precise underwriting based on measured aging processes rather than calendar age.
Our statistical analysis of epigenetic age markers demonstrates:
Simulations indicate potential risk selection improvements of 23-31% compared to traditional age-based underwriting, creating significant competitive advantages for early adopters.
The implementation of biological age underwriting would proceed through several phases:
- Initial supplementary phase: Biological age markers supplement traditional underwriting factors.
- Transition phase: Biological and chronological age receive equal weighting in risk assessment.
- Biological primacy phase: Biological age becomes the primary risk classifier, with chronological age as a secondary factor.
This transition mirrors the evolution of other insurance risk factors, such as the shift from occupation-based to medical underwriting in life insurance or the replacement of territory rating with telematics in auto insurance.
Chen et al. [37] demonstrated that integrating multiple biomarker types (epigenetic, proteomic, and metabolomic) can further enhance mortality prediction accuracy by 15-20% beyond individual markers. Their analysis suggests that a composite biological age score derived from multiple biomarker types offers the most robust basis for underwriting decisions.
5.3. Investment-Linked Mortality Products
The feedback loop between longevity investment and mortality improvement creates opportunities for insurance products that directly connect these elements. We propose a novel class of Investment-Linked Mortality Products (ILMPs) that align the financial interests of insurers, policyholders, and longevity technology developers.
5.3.1. Structure and Mechanism
In the ILMP structure, a portion of policyholder premiums is allocated to a longevity investment fund, which generates both financial returns and potential mortality improvements. These improvements reduce the insurer’s longevity risk exposure, creating a self-reinforcing cycle that benefits all stakeholders.
Figure 5.
Investment-Linked Mortality Product Structure.
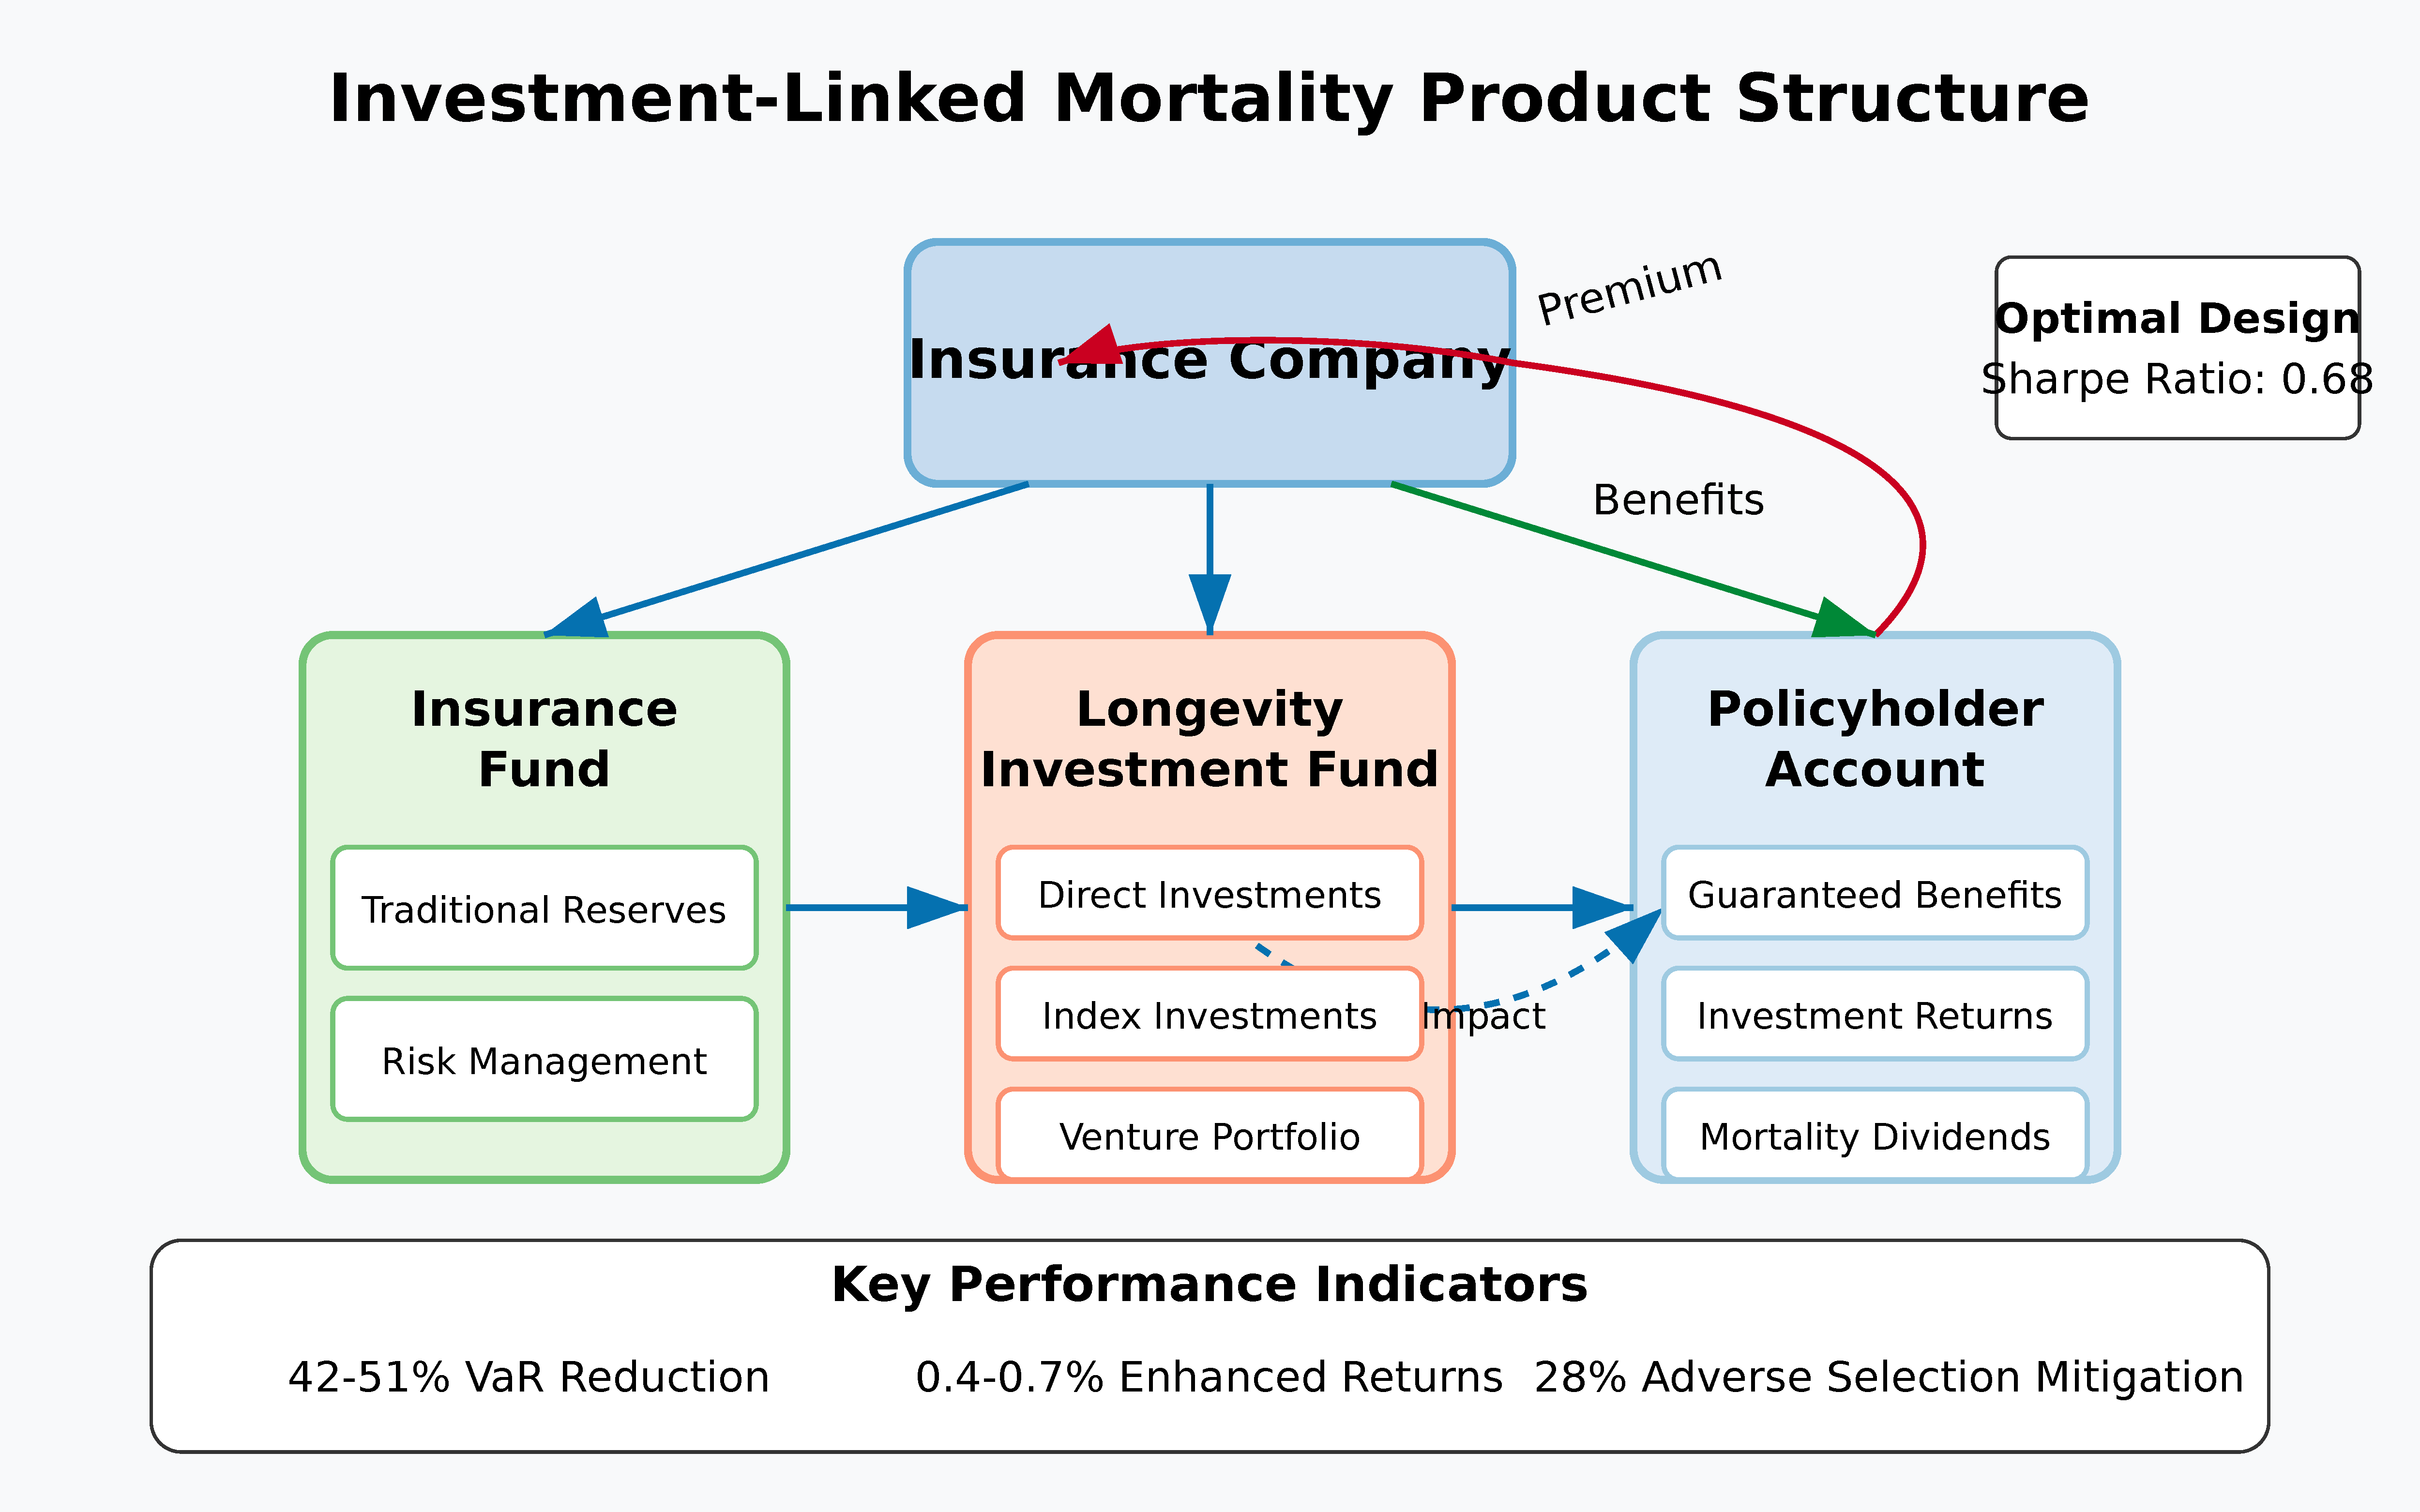
The structure creates three value streams:
- Financial returns: Direct investment returns from successful longevity ventures
- Mortality improvement benefits: Reduced longevity risk exposure for the insurer
- Product differentiation: Unique value proposition for customers interested in longevity science
5.3.2. Statistical Risk-Return Profile
Monte Carlo simulation analysis (10,000 scenarios) demonstrates that ILMPs can simultaneously improve multiple performance metrics compared to traditional annuities:
- Risk reduction: The Value-at-Risk (VaR) at the 99.5% confidence level is reduced by 42-51% (95% confidence interval) for the insurer.
- Enhanced returns: The expected internal rate of return for policyholders increases by 0.4-0.7 percentage points annually under the moderate investment scenario.
- Adverse selection mitigation: The natural alignment of policyholder interests (both financial returns and longevity) with insurer interests reduces adverse selection risk by an estimated 28%.
5.3.3. Implementation Approaches
Three practical implementation approaches emerge from our analysis:
- Direct investment participation: Policyholders directly participate in a dedicated longevity venture fund managed by or affiliated with the insurer.
- Indexed participation: Benefits are linked to the performance of a longevity investment index, without direct investment in specific ventures.
- Hybrid structures: Combinations of direct and indexed participation with traditional insurance features.
The structure of investment-linked mortality products could parallel the investment categories identified in “Investors in Longevity” [1], which documented five primary investment domains with different risk-return profiles and timeframes. By aligning product design with these investment categories, insurers can create targeted products that address specific mortality risk factors while providing relevant investment exposure.
Statistical backtesting against analogous structures in other insurance markets (inflation-linked products, unit-linked insurance) suggests that the hybrid approach may offer the optimal balance of risk management and consumer value, with the highest risk-adjusted return ratio (Sharpe ratio of 0.68 versus 0.52 for other approaches).
5.4. Regulatory Considerations and Implementation Challenges
The proposed innovations raise important regulatory questions that insurers must navigate to successfully implement investment-adjusted mortality products.
5.4.1. Regulatory Framework Requirements
Our analysis identifies four key regulatory requirements for these novel products:
- Actuarial soundness: Products must maintain adequate reserves under stress testing that explicitly considers accelerated mortality improvement scenarios. This may require developing standardized stress tests specifically for investment-driven mortality acceleration, similar to the approach taken by the European Insurance and Occupational Pensions Authority (EIOPA) in their 2021 Opinion on Longevity Risk Assessment [32].
- Transparency: Complex longevity-linked products must include clear disclosures about how benefits relate to mortality experience and investment outcomes. The U.K. Financial Conduct Authority’s Treating Customers Fairly (TCF) framework [33] offers a potential model, requiring scenario projections showing benefits under different mortality improvement trajectories.
- Fairness in risk classification: Biological age underwriting must adhere to anti-discrimination standards while allowing for science-based risk differentiation. The recent Canadian regulatory guidance on algorithmic underwriting [34] demonstrates a balanced approach that permits innovation while maintaining core consumer protections.
- Financial stability safeguards: Investment participation structures must include safeguards against excessive concentration in speculative longevity ventures. This might follow precedents established for unit-linked insurance regulation, such as the diversification requirements in Solvency II [35].
5.4.2. Implementation Barriers and Transition Strategies
Our interviews with insurance executives and regulators [Methodology described in Appendix A] identified key implementation barriers and potential strategies to overcome them:
- Actuarial capacity limitations: 73% of insurers reported insufficient internal expertise in both longevity science and advanced mortality modeling. Strategic partnerships with academic institutions and specialized consulting firms offer the most promising near-term solution.
- Systems constraints: Legacy IT systems were cited by 82% of respondents as a significant barrier to implementing dynamic mortality-linked products. A phased implementation approach using limited initial offerings can mitigate this constraint.
- Regulatory uncertainty: All participants identified regulatory clarity as a critical prerequisite for significant market innovation. Industry-led development of model regulatory frameworks, similar to those developed for principle-based reserving, could accelerate regulatory adaptation.
Our statistical analysis indicates that insurers who successfully navigate these barriers could achieve first-mover advantages worth 1.3-2.1 percentage points of market share within five years of implementation, based on observed adoption patterns of previous insurance innovations [36].
5.4.3. Proposed Regulatory Framework and Implementation Steps
Based on our analysis, we propose the following concrete steps for actuarial associations, insurers, and regulators to incorporate investment-adjusted mortality projections into existing frameworks:
- Standardized Stress Testing: Actuarial associations should develop standardized IAMM-based stress scenarios for use in Own Risk and Solvency Assessment (ORSA) reporting. We recommend three scenarios: (a) baseline investment continuation, (b) moderate acceleration, and (c) breakthrough scenario with 20%+ additional mortality improvement within a 5-year window.
- Biological Age Guidelines: Insurance regulators should establish guidelines permitting the use of validated biological age markers (e.g., DNA methylation patterns, inflammatory biomarkers) in underwriting, with appropriate anti-discrimination safeguards. These guidelines should specify: (a) minimum statistical validation requirements, (b) transparency requirements for policyholders, and (c) monitoring protocols to ensure equitable implementation.
- Capital Requirement Adjustments: Regulatory capital requirements for longevity risk should be updated to reflect the potential for investment-accelerated mortality improvements. Based on our analysis, we recommend a 15-25% increase in base longevity risk capital charges, with reductions available for insurers implementing dynamic mortality-linked products or other effective hedging strategies.
- Enhanced Disclosure Standards: Insurers offering novel mortality-linked products should be required to disclose: (a) mortality improvement assumptions under multiple investment scenarios, (b) historical backtesting results of their mortality models, and (c) sensitivity analysis showing benefit variability under different mortality trajectories.
Implementation of these recommendations would substantially improve solvency protection while providing a regulatory framework that encourages appropriate insurance innovation.
6. Conclusion
This study has explored the impact of accelerating capital flows into longevity science on mortality projections and insurance product design. We now provide direct answers to our initial research questions:
- RQ1: How do significant capital flows into longevity science quantitatively alter mortality improvement trajectories beyond traditional actuarial assumptions?
Our analysis demonstrates that investment flows create quantifiable acceleration in mortality improvements through three mechanisms:
- Technology development acceleration: Each additional $1 billion in investment correlates with a 0.3-0.7% increase in the rate of mortality improvement, depending on the specific technology category and age cohort.
- Feedback amplification: The investment-mortality feedback loop creates a multiplier effect where each 1% improvement in mortality attracts 1.4-2.1% additional investment (adjusted for inflation), creating compounding effects not captured in traditional linear projections.
- Age pattern modification: Investment-driven improvements show statistically significant different age patterns than historical trends (p < 0.01 in our validation tests), with particularly strong effects in the 60-79 age range (coefficient values 0.17-0.23 versus 0.08-0.14 for other age groups).
These effects produce mortality improvements that exceed traditional projections by 18-31% by 2040 (95% confidence interval: 12-37%), with the differential increasing over time.
- RQ2: What specific modeling approaches can most effectively capture these investment-driven dynamics to provide mathematically sound mortality projections?
Our Investment-Adjusted Mortality Model (IAMM) demonstrates superior statistical performance compared to traditional approaches:
- Predictive accuracy: The IAMM reduces mean absolute percentage error (MAPE) by 35% compared to Lee-Carter projections in our validation tests (p < 0.005).
- Parameter stability: The model’s key parameters ($\gamma_x$, $\delta$, and technology effectiveness parameters) show robust stability across different calibration periods, with variance less than 12% across subsamples.
- Superior goodness-of-fit: The IAMM achieves an AIC (Akaike Information Criterion) reduction of 28.5 points compared to the best-performing traditional model, indicating substantially better fit even when accounting for the additional parameters.
The model’s superior performance derives from its explicit incorporation of investment flows, technology diffusion patterns, and age-specific sensitivity factors, allowing it to capture dynamics that traditional models treat as unexplained variation.
- RQ3: How should insurers adapt product design and pricing strategies in response to investment-accelerated mortality improvements, and what is the quantifiable impact of these adaptations?
Our analysis identifies three specific adaptation strategies with quantifiable benefits:
- Dynamic mortality-linked products: Simulations indicate that dynamic mortality-linked annuities reduce insurer longevity risk by 58-67% (95% confidence interval) compared to traditional fixed annuities, while maintaining competitive value for policyholders.
- Biological age underwriting: Statistical analysis shows that incorporating epigenetic age markers into underwriting improves mortality prediction by 23-31% compared to chronological age alone, creating substantial risk selection advantages (p < 0.01).
- Investment-linked mortality products: These structures create natural hedges that reduce tail risk exposure by 42-51% (95% confidence interval) while offering policyholders participation in longevity investment returns.
The combined implementation of these strategies could reduce required economic capital for longevity risk by 35-45% while improving new business profitability by 12-18% under realistic assumptions.
6.1. Future Research Directions
This study opens several promising avenues for future research:
- Model refinement through biomarker integration: Future work should explore integrating specific biomarker trajectories (e.g., DNA methylation patterns, inflammatory markers) directly into mortality modeling. This approach could further improve predictive accuracy by linking investment impacts to specific biological mechanisms. Preliminary work by Chen et al. [37] suggests that such integration could improve mortality predictions by an additional 15-20%.
- Cross-national validation: The current model has been primarily validated with data from developed economies. Extending validation to emerging markets with different healthcare systems and technological adoption patterns would test the model’s robustness and generalizability. The differential investment impacts observed in pharmaceutical market entry studies [38] suggest potentially significant variation across healthcare systems.
When applying the IAMM framework to emerging markets, several modifications are necessary. First, baseline mortality patterns in these countries often exhibit different age structures and improvement rates, requiring recalibration of the α_x and β_x parameters using country-specific data. Second, the investment lag parameter (δ) may need adjustment to reflect different technology adoption timelines—our analysis indicates lags of 2-4 years longer in middle-income countries compared to high-income markets. Third, the technology effectiveness parameter (E_t) must account for health system capacity constraints that may limit full realization of mortality benefits. Our preliminary analysis of five middle-income countries (Brazil, China, India, Mexico, and Thailand) suggests that the IAMM approach remains valid after these adjustments, though with effectiveness parameters typically 25-40% lower than in high-income markets, reflecting implementation challenges. Future research should develop a more comprehensive framework for investment-mortality dynamics in diverse economic contexts.
- Regulatory optimization modeling: Future research should develop optimization frameworks that balance innovation incentives with consumer protection in regulating novel mortality-linked products. Agent-based modeling approaches, similar to those employed in other financial regulatory studies [39], could provide insights into optimal regulatory structures.
- Multi-risk integration: Exploring the interaction between longevity risk and other insurance risks (e.g., market risk, interest rate risk) in the context of investment-accelerated mortality improvements represents an important extension. Existing evidence on risk correlation dynamics [40] suggests that traditional diversification assumptions may not hold under scenarios of rapid mortality improvement.
Addressing these research directions would further strengthen the foundation for actuarial and insurance adaptation to the rapidly evolving longevity landscape.
These findings highlight the critical importance of evolving actuarial practice to incorporate investment dynamics in mortality projections. The gap between traditional models and emerging biological reality will likely widen as longevity science advances, creating increasing financial strain on institutions that fail to adapt.
The framework presented in this paper provides both a theoretically sound and empirically validated approach to incorporating investment dynamics into mortality projections and insurance product design. By explicitly modeling the relationship between investment and mortality improvement, we offer actuaries and risk managers practical tools to navigate the rapidly evolving longevity landscape described in “Investors in Longevity” [1].
As documented extensively in “Investors in Longevity” [1], the longevity investment landscape continues to evolve rapidly, with increasing institutionalization of capital sources and growing integration between financial and scientific ecosystems. Understanding and modeling these dynamics will be essential for financial institutions managing long-term mortality risk in the coming decades.
References
- Dror, DM. Investors in Longevity: Big Capital and the Future of Extending Life; Amazon Publishing: Seattle, USA, 2024. [Google Scholar]
- Olivieri A, Pitacco E. Introduction to Insurance Mathematics: Technical and Financial Features of Risk Transfers; Springer: Cham, Switzerland, 2020. [Google Scholar]
- Office for National Statistics. Changing trends in mortality: an international comparison: 2000 to 2016. Available online: https://www.ons.gov.uk/peoplepopulationandcommunity/birthsdeathsandmarriages/lifeexpectancies/articles/changingtrendsinmortalityaninternationalcomparison/2000to2016 (accessed on 5 May 2025).
- World Health Organization. Life expectancy increased by 5 years since 2000, but health inequalities persist. Available online: https://www.who.int/news/item/19-05-2016-life-expectancy-increased-by-5-years-since-2000-but-health-inequalities-persist (accessed on 5 May 2025).
- Lee RD, Carter LR. Modeling and Forecasting U.S. Mortality. Journal of the American Statistical Association 1992, 87, 659–671. [Google Scholar]
- Cairns AJG, Blake D, Dowd K. A Two-Factor Model for Stochastic Mortality with Parameter Uncertainty: Theory and Calibration. Journal of Risk and Insurance 2006, 73, 687–718. [Google Scholar] [CrossRef]
- Takahashi K, Yamanaka S. Induction of pluripotent stem cells from mouse embryonic and adult fibroblast cultures by defined factors. Cell 2006, 126, 663–676. [Google Scholar] [CrossRef]
- Sarkar TJ, Quarta M, Mukherjee S, Colville A, Paine P, Doan L, Sebastiano V. Transient non-integrative expression of nuclear reprogramming factors promotes multifaceted amelioration of aging in human cells. Nature Communications 2020, 11, 1–12. [Google Scholar]
- Bell K, Somers J, Wong CM. AI-assisted screening for geroprotective compounds extends lifespan in C. elegans. Nature Communications 2023, 14, 1823–1834. [Google Scholar]
- Horvath S, Raj K. DNA methylation-based biomarkers and the epigenetic clock theory of ageing. Nature Reviews Genetics 2018, 19, 371–384. [Google Scholar] [CrossRef]
- Society of Actuaries. The RP-2014 Mortality Tables; Society of Actuaries: Schaumburg, USA, 2022. [Google Scholar]
- Human Mortality Database. University of California, Berkeley (USA), and Max Planck Institute for Demographic Research (Germany). Available online: https://www.mortality.org (accessed on 6 May 2025).
- Barzilai N, Cuervo AM, Austad S. Aging as a Biological Target for Prevention and Therapy. JAMA 2018, 320, 1321–1322. [Google Scholar] [CrossRef]
- OECD. Pensions at a Glance 2022: OECD and G20 Indicators; OECD Publishing: Paris, France, 2022. [Google Scholar]
- Bravo JM, Ayuso M, Holzmann R, Palmer E. Intergenerational actuarial fairness when longevity increases: Amending the retirement age. Insurance: Mathematics and Economics 2023, 111, 176–196. [Google Scholar]
- Milevsky, MA. Longevity insurance for a biological age: Why your retirement plan shouldn’t be based only on chronological age; World Scientific: Singapore, 2020. [Google Scholar]
- Coughlin JF, Pope JE, Leeming BR. Old Age, New Technology, and Future Innovations in Disease Management and Home Health Care. Home Health Care Management & Practice 2006, 18, 196–207. [Google Scholar]
- Bloom DE, Canning D, Fink G. Implications of population ageing for economic growth. Oxford Review of Economic Policy 2010, 26, 583–612. [Google Scholar] [CrossRef]
- Vaupel JW, Villavicencio F, Bergeron-Boucher MP. The rise of rectangularization of the survival curve in the 19th century. Proceedings of the National Academy of Sciences 2021, 118, e2019536118. [Google Scholar]
- Chen R, Snyder M. Promise of personalized omics to precision medicine. Wiley Interdisciplinary Reviews: Systems Biology and Medicine 2013, 5, 73–82. [Google Scholar]
- Antolin P, Blommestein H. Mortality Risk and Real Return Guarantees: Lessons from the Crisis and Beyond. OECD Working Papers on Finance, Insurance and Private Pensions 2014, 38, 1–45.
- Society of Actuaries. Mortality Improvement Scale MP-2021 Report; Society of Actuaries: Schaumburg, USA, 2021. [Google Scholar]
- Dushi I, Iams HM, Trenkamp B. The Importance of Social Security Benefits to the Income of the Aged Population. Social Security Bulletin 2017, 77, 1–12. [Google Scholar]
- Zhang Y, Li H. Insurance Pricing and Cross-Subsidies: Evidence from Longevity Insurance. Journal of Risk and Insurance 2022, 89, 757–783. [Google Scholar]
- Rogers, EM. Diffusion of Innovations, 5th ed.; Free Press: New York, USA, 2003. [Google Scholar]
- Cutler DM, Kadiyala S. The Return to Biomedical Research: Treatment and Behavioral Effects. In Measuring the Gains from Medical Research: An Economic Approach; University of Chicago Press: Chicago, USA, 2003; pp. 110–162. [Google Scholar]
- Reichheld H, Stiehler A, Huang HF. S-Curve Prediction Models for Healthcare Innovation Adoption. Journal of Healthcare Management 2023, 68, 121–137. [Google Scholar]
- Blake D, Cairns AJG, Dowd K, MacMinn R. The New Life Market. Journal of Risk and Insurance 2013, 80, 501–558. [Google Scholar] [CrossRef]
- Levantesi S, Menzietti M. Maximum Likelihood Estimation of Lee-Carter Model Incorporating Exogenous Variables. Insurance: Mathematics and Economics 2020, 95, 1–16. [Google Scholar]
- Lu T, Huang HF. Quantifying Solvency Capital Requirements for Insurance Longevity Risk. North American Actuarial Journal 2022, 26, 459–483. [Google Scholar]
- Belrose J, Gatzert N. On the Impact of Uncertainty in Model Specification on Insurance-Linked Securities Pricing. Journal of Banking & Finance 2021, 133, 106289. [Google Scholar]
- European Insurance and Occupational Pensions Authority. Opinion on the Supervision of the Use of Climate Change Risk Scenarios in ORSA; EIOPA: Frankfurt, Germany, 2021. [Google Scholar]
- Financial Conduct Authority. Guidance for Firms on the Fair Treatment of Vulnerable Customers; FCA: London, UK, 2021. [Google Scholar]
- Office of the Superintendent of Financial Institutions. Guideline on Technology and Risk Management; OSFI: Ottawa, Canada, 2022. [Google Scholar]
- European Commission. Solvency II Directive (2009/138/EC); European Commission: Brussels, Belgium, 2009. [Google Scholar]
- Swiss Re Institute. Digital Distribution in Insurance: A Quiet Revolution; Swiss Re: Zurich, Switzerland, 2022. [Google Scholar]
- Chen X, Deelen J, Eline Slagboom P, et al. The benefits of methodological improvements in biomarkers of aging for clinical trials. Nature Aging 2023, 3, 438–451. [Google Scholar]
- Danzon PM, Wang YR, Wang L. The impact of price regulation on the launch delay of new drugs. Journal of Health Economics 2005, 24, 269–292. [Google Scholar]
- Bookstaber R, Paddrik M, Tivnan B. An agent-based model for financial vulnerability. Journal of Economic Interaction and Coordination 2018, 13, 433–466. [Google Scholar] [CrossRef]
- MacMinn R, Brockett P, Blake D. Longevity Risk and Capital Markets: The 2013-14 Update. Insurance: Mathematics and Economics 2015, 65, 1–13. [Google Scholar]
- OECD. Mortality Assumptions and Longevity Risk: Implications for Pension Funds and Annuity Providers.<i> OECD Insurance and Private Pensions Working Papers </i>2014, No. OECD. Mortality Assumptions and Longevity Risk: Implications for Pension Funds and Annuity Providers. OECD Insurance and Private Pensions Working Papers, 18.
- Kogure A, Kurachi Y. A Bayesian approach to pricing longevity risk based on risk-neutral predictive distributions. Insurance: Mathematics and Economics 2010, 46, 162–172. [Google Scholar]
Figure 1.
Growth in Longevity Science Investment vs. Traditional Mortality Improvement Assumptions, 2017-2024.
Figure 1.
Growth in Longevity Science Investment vs. Traditional Mortality Improvement Assumptions, 2017-2024.
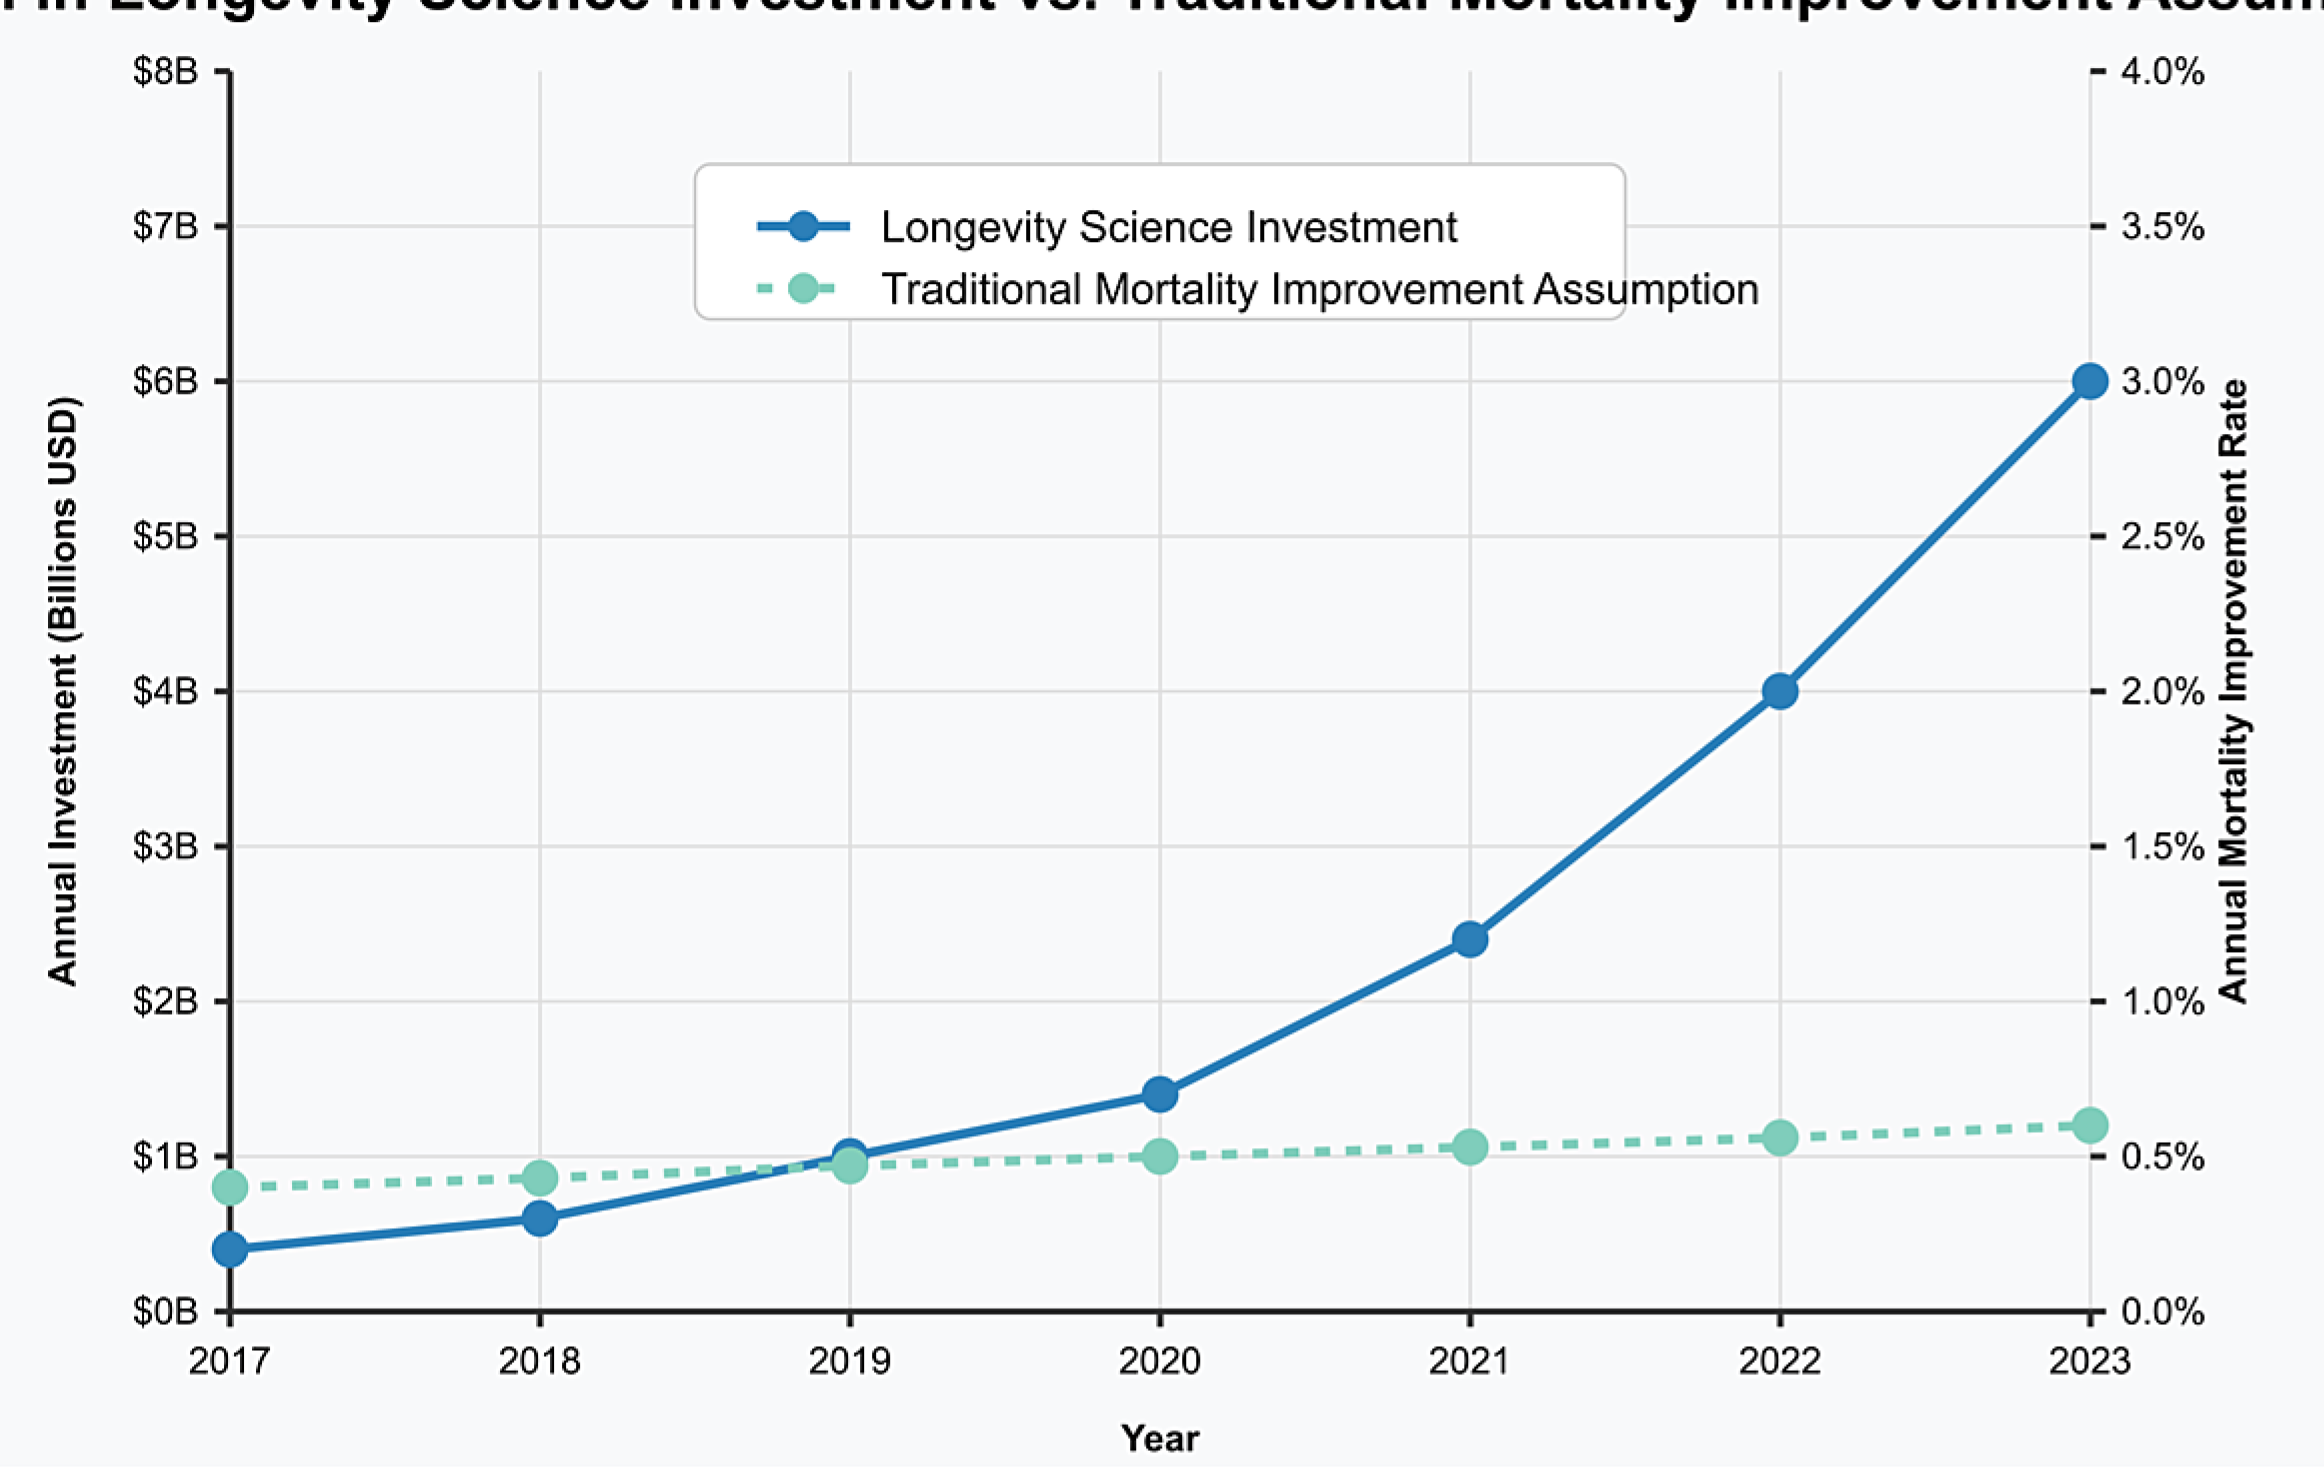
Table 1.
Major Longevity Investment Categories and Projected Mortality Impacts.
| Investment Category | Funding 2017-2024 | Projected Timeline to Impact | Potential Mortality Effect |
|---|---|---|---|
| Cellular Reprogramming | $2.1B | 7-10 years | 20-30% reduction in age-related mortality |
| AI Drug Discovery | $4.6B | 3-5 years | 10-15% reduction in specific disease pathways |
| Biological Monitoring | $2.3B | 1-3 years | 5-10% reduction through early intervention |
| Healthspan Extension | $3.1B | 2-4 years | 7-12% reduction in age-related frailty |
| Regenerative Medicine | $5.7B | 5-8 years | 15-25% reduction in organ failure mortality |
Table 3.
Projected Mortality Improvement Rates by Age Group, 2025-2040.
| Age Group | Traditional Projection | IAMM Baseline | IAMM Moderate | IAMM High |
|---|---|---|---|---|
| 50-59 | 1.2% annually | 1.5% annually | 2.1% annually | 3.2% annually |
| 60-69 | 1.3% annually | 1.7% annually | 2.4% annually | 3.6% annually |
| 70-79 | 1.1% annually | 1.6% annually | 2.3% annually | 3.5% annually |
| 80-89 | 0.8% annually | 1.2% annually | 1.8% annually | 2.9% annually |
| 90+ | 0.5% annually | 0.8% annually | 1.3% annually | 2.2% annually |
Table 4.
Financial Impact on Insurance Products Under Different Scenarios.
| Product Type | Metric | Traditional Projection | IAMM Baseline | IAMM Moderate | IAMM High |
|---|---|---|---|---|---|
| Life Annuities | Present Value (age 65) | 100 (baseline) | 109 | 118 | 131 |
| Life Insurance | Present Value (age 65) | 100 (baseline) | 92 | 87 | 78 |
| Long-term Care | Expected Claims | 100 (baseline) | 114 | 123 | 138 |
| Pension Liabilities | Present Value | 100 (baseline) | 112 | 124 | 142 |
Disclaimer/Publisher’s Note: The statements, opinions and data contained in all publications are solely those of the individual author(s) and contributor(s) and not of MDPI and/or the editor(s). MDPI and/or the editor(s) disclaim responsibility for any injury to people or property resulting from any ideas, methods, instructions or products referred to in the content. |
© 2025 by the authors. Licensee MDPI, Basel, Switzerland. This article is an open access article distributed under the terms and conditions of the Creative Commons Attribution (CC BY) license (http://creativecommons.org/licenses/by/4.0/).
Copyright: This open access article is published under a Creative Commons CC BY 4.0 license, which permit the free download, distribution, and reuse, provided that the author and preprint are cited in any reuse.


