
Submitted:
09 May 2025
Posted:
09 May 2025
You are already at the latest version
Abstract
Layout analysis of elements is indispensable in graphic design, and layout design can make the audience receive visual information as well as more attractive. The combination of deep learning and graphic design has gradually turned into a popular research direction in graphic design in recent years. However, in the era of rapid development of artificial intelligence, the analysis of layout still requires manual participation. To address this problem, this paper proposes a method for analyzing the layout of complex layout image elements based on the improved deeplabv3+ model. The method reduces the number of model parameters and training time by replacing the backbone network, and in order to improve the effect of multi-scale semantic feature extraction, the null rate of ASPP is fine-tuned, and the model is trained by self-constructed movie poster dataset. The experimental results show that the improved DeepLabv3+ model achieves a better segmentation effect on the self-constructed poster dataset, with MIoU reaching 75.60%. Compared with the classical models such as FCN, PSPNet and DeepLabv3, the improved model in this paper effectively reduces the number of model parameters and training time while also ensuring the accuracy of the model.
Keywords:
DeepLabv3+
; Image Segmentation
; Poster Layout Analysis
; Deep Learning
1. Introduction
At this stage, artificial intelligence has developed into the intersection of many disciplines such as cognitive science, psychology, art, computer science and so on [1,2]. With the development of deep learning and neural networks, more and more researchers combine them with design, such as intelligent image color matching and intelligent image quality evaluation [3,4]. And the complex layout images obtained from text, graphics, images and other layout elements through the process of artistic design, pre-press processing, typesetting and so on are widely used in packaging, posters, book binding and so on [5,6]. At present, the study of complex layout images is only for simple document images, and there are few reports on the design of complex layout images. Therefore, there is an urgent need for more scientific, intelligent and perfect methods and techniques for analyzing the layout of complex layout images.
Compared with such complex images as posters, document images, newspapers and other complex images have a single background and neatly arranged text, graphics, tables and other foregrounds. At present, domestic and foreign research in the field of complex layout image analysis, reported more mainly for document images, newspapers and other complex images, while in the traditional poster design, brochures and other aspects of the report is less. Traditional layout analysis can be roughly categorized into three approaches: top-down approach [7], bottom-up approach [8] and hybrid approach [9]. After the rise of neural networks, a number of researchers have combined layout analysis with computers, deep learning, neural networks, and other techniques to explore complex layout image analysis [10]. Wu et al. [11] proposed a method for document image layout analysis with explicit edge embedding networks, which exploits the model to overcome the data scarcity by using an integrated document approach compared to the traditional methods. Guo et al. [12] proposed a design space to describe the design elements in advertising posters and introduced a design sequence to rationalize the design decisions of human designers in creating posters. There is still much room for research in the field of combining visual communication design images with deep learning techniques.
The central question of this research is how to perform automatic layout design through artificial intelligence. The first task in using AI for layout design is to make the computer understand the constituent elements of the layout. In this paper, deep learning techniques will be used to locate and recognize the constituent elements of layouts in complex layout images. Recognizing text in a scene image is challenging due to the inherent complexity of the image. The presence of different foregrounds and complex graphical backgrounds in natural images like movie posters and the text in the images with various variations of fonts, colors, sizes, orientations, and textures make it even more challenging to perform image layout analysis for complex layout images like movie posters.
Aiming at the problem of difficulty in analyzing the layout of visual communication images, this paper takes movie posters as the research object and carries out the construction of movie poster dataset. Based on the improved DeepLabv3+ network model, the segmentation and recognition of text, theme and graphic regions of movie posters are carried out. Finally, according to the layout segmentation results, the positional relationship of the theme area, text area and graphic area is analyzed, and the layout analysis of the movie poster is carried out using the GoogLeNet image classification network model.
2. Film Poster Composition Layout Method
At present, there is no uniform view in the academic world on the compositional layout of film posters, so there are various methods of classification. This study combines the existing rules of poster layout design composition and typography, and summarizes film poster images into the following eight commonly used types: centered layout, split layout, symmetrical layout, diagonal layout, wraparound layout, full-screen layout, axial layout, inclined layout, and other compositional layouts.
Centered layout will be the main elements in a centrally aligned manner, can quickly attract the eye to occupy the visual focus, as shown in Figure 1(a). The split layout arranges the poster in an asymmetrical structure with the figure above the text below and the figure below the text above, ensuring a balanced and stable picture and forming a sharp contrast, as shown in Figure 1(b). The symmetrical layout arranges the main elements in a symmetrical manner relative to the central axis, visually giving a feeling of rigour and rationality, as shown in Figure 1(c). The diagonal layout distributes the main elements of the poster in opposite corners, adding an unstable variation that can bring a visual impact, as shown in Figure 1(d). Surrounding layout is generally a graphic surrounded by text, its composition form is fuller, more information, as shown in Figure 1(e). Full-screen layout is mainly graphics to support the entire layout, supplemented by text, visually give people an intuitive and strong feelings, as shown in Figure 1 (f). Axis layout is dominated by a hidden axis, arranging the main elements in a hidden axis to break the limitations of a centered layout and make the layout appear less dull, as shown in Figure 1(g). Tilt layout mainly arranges the main elements of the poster in a tilted manner, giving a sense of visual motion and instability, as shown in Figure 1(h). In practical examples, it is difficult for some posters to generalize and define the characteristics of a layout, and it may be difficult to fit into a certain layout classification. In order to simplify the analysis, this study categorizes posters that are disorganized, free-layout posters, or posters that are laid out in other layout styles within the Other Layout category. The first eight ways encompass most of the current ways of laying out a film poster.
3. Film Poster Layout Segmentation Method Based on Improved deepLabv3+
3.1. Relevant Model Theory
3.1.1. DeepLabv3+ Base Model
DeepLabv3+ (Rethinking Atrous Convolution for Semantic Image Segmentation) is a semantic segmentation based on Atrous Spatial Pyramid Pooling (ASPP) module proposed by Google team in 2019 network [13], and the model is widely used in various image semantic segmentation tasks. The model introduces a Decoder structure based on DeepLabv3 [14], which further fuses the underlying features with the higher-level features to improve the segmentation boundary accuracy. The overall architecture of the DeepLabv3+ model is shown in Figure 2, and the main body of its Encoder is the DCNN with cavity convolution, which uses Xception [15]. The model introduces the cavity convolution, which increases the sensory field without loss of information, so that each convolution output contains a larger range of information.
The algorithm effectively expands the network sensory field and captures a wide range of contextual information to improve the segmentation accuracy of the image through the cavity convolution in the ASPP module. The equivalent convolution kernel K of the cavity convolution is formulated as:
where k is the original convolutional kernel size and r is the null rate.
As the backbone feature extraction network extracts to a low-order feature and a high-order feature, the high-order feature captures the information of different scales, and finally the parallel extracted features are fused, and the fused feature map contains rich semantic information, and then the number of channels is adjusted by the 1×1 convolution, and then it is fused with the low-order feature by the up-adoption operation in Decoder, and then it is fused with the low-order feature by the 3×3 convolution and up adoption operation to revert to the original size to get the final segmentation result.
3.1.2. Mobilenetv3 Network
Mobilenetv3 is a lightweight convolutional neural network, which has been accumulated from two generations of networks, Mobilenetv1 and Mobilenetv2, retaining the deep separable convolution of Mobilenetv1 and the inverted residual linear bottleneck block of Mobilenetv2, while improving the model structure to reduce the amount of parameters and training time. Mobilenetv3 builds on v2 by adding the Squeeze and Excitation block (SE) attention mechanism to the Bottleneck block, replacing the ReLU6 function with hard-swish, the sigmoid function with hard sigmoid and redesigning the structure of the time-consuming layer of the network. The overall structure of the time-consuming layer of the network is shown in Figure 3, in which the structure of the small and large versions is basically the same, and the only difference lies in the number of basic unit bneck and the internal parameters, which are mainly reflected in the difference in the number of channels.
3.1.3. GoogLeNet Network
In order to avoid the problems of slow network training convergence, long training time, and susceptibility to gradient vanishing and gradient explosion, the Google team proposed the GoogLeNet network in 2014, which won the first place in the classification task in the ImageNet competition that year [17]. This network introduces the Inception structure in order to fuse feature information of different scales, and uses a 1x1 convolutional kernel for dimensionality reduction as well as mapping process, which mainly adopts a global mean pooling strategy instead of a fully connected layer in order to reduce the parameters and adds two auxiliary classifiers to help the training, which not only achieves the effect of model fusion, but also adds a back-propagated gradient signal to the network, and also provides additional regularization that benefits the training of the network. The model consists of 22 modular structures including a convolutional layer, 9 modular structures, a global average pooling layer and an output layer. The network is mainly used in the fields of image classification and object recognition.
3.2. Improved deeplabv3+ Network Models
In order to effectively extract the semantic information of movie posters at different scales, DeepLabv3+ structure is used in this paper. The algorithmic model proposed in this paper is obtained by improving the DeepLabv3+ algorithmic model, which contains Encoder and Decoder modules, the Encoder module contains the main body of the backbone network (DCNN) with null convolution as well as the ASPP (Null Spatial Convolutional Pooling Pyramid, Atrous Spatial Pyramid Pooling) module, in which the main body of DCNN adopts the improved Xception network with cavity convolution, which mainly adopts deep separable convolution, making its computational volume smaller. On this basis, the shallow features generated by the DCNN are utilized and fed into the Decoder encoder module, and the high semantic high-level features are fed into the Decoder for up-sampling, followed by fusion of the features using the results obtained by 1×1 convolution, extraction of the features using 3×3 convolution, and bilinear interpolation of the image to obtain segmentation predictions consistent with the image size.
Due to the more complex structure of the backbone network Xception in the original DeepLabv3+ model, this is more difficult for extracting smaller categories and textures in complex layout images, and when the network is extracting details and texture information, problems such as blurring and confusion may occur, resulting in the inability to continuously extract a particular category. In addition, the network has more parameters, is more computationally intensive, and takes longer to reason. In this paper, the lightweight Mobilenetv3-small network structure will be used as the feature extraction network, which has a reduced number of parameters relative to the Xception network, as well as a reduced number of computations and time required, thus increasing the speed of training and learning.
The combination of null rates for the ASPP module null convolution in the original DeepLabv3+ is 6, 12, and 18, and as the backbone network carries out feature extraction, the resolution of the feature maps decreases gradually, and the combination of 6, 12, and 18 can not extract the features of the multi-resolution feature maps more efficiently because it does not set a smaller null rate, resulting in a lack of the ability to segment the small targets. In order to effectively extract the semantic information of complex layout images at different scales, the DeepLabv3+ structure is improved in this paper. In the improved DeepLabv3+ model the original backbone network Xception is replaced by Mobilenetv3-small network, and at the same time two null convolution layers are added in the ASPP module, and the null convolution null rate in the module is changed from a combination of 6, 12, and 18 to a combination of 2, 4, 8, 12, and 16, in order to be able to enhance the ability of the network model for the segmentation of different size categories in complex layout images. It is processed by two modules, the backbone network and ASPP, and transmitted to the Decoder module, whose main structure remains unchanged. After the complex layout image processed by Decoder module will output the predicted layout element segmentation, then the prediction result will be passed to the GoogLeNet classification model to classify the layout, and finally get the result prediction of the layout mode of the movie poster. The structure of the improved DeepLabv3+ model is shown in Figure 4.
4. Dataset and Model Training
4.1. Dataset Production
In this study, the movie poster images were obtained from the IMP Awards (http://www.impawards.com/) and the Douban website (https://movie.douban.com/). The dataset contains 2300 high-resolution movie poster images with a minimum resolution of 505×755 pixels and a maximum resolution of 6889×9778 pixels. After completing the image sampling use the open source annotation software labelme for manual annotation, where red is the subject class, green is the text class, and yellow is the graphic class. Figure 5 shows the sample image acquisition of a movie poster and a sample annotation map, Figure 5(b) is a sample annotation map, after annotation of a poster will correspondingly generate a json file, which stores the coordinates of the points on the annotation outline and the basic information of the image, and after the completion of the annotation, we get 2300 json files. Use the script that comes with labelme to convert the json file to a film poster dataset in the same format as the Pascal VOC 2012 [18] dataset. The manual segmentation labelling effect after the conversion is completed is shown in Figure 5(c).
The poster dataset is divided into training, validation and test sets in the ratio of 7:2:1, where 1610 poster images in the training set, 460 poster images in the validation set and 230 poster images in the test set. The training set is used to train the model parameters, the validation set is used for model hyperparameter tuning, and the test set is used to evaluate the model generalization ability.
The manually segmented 2300 labelled diagrams were divided into 9 categories according to 9 poster layout styles, where the distribution of category samples is shown in Figure 6 and their categories are schematically illustrated in Figure 1. Each category was divided into a training set and a validation set in the ratio of 9:1, where the training set had a total of 2080 poster images and the validation set 220 poster images. Table 1 shows the division of the poster segmentation dataset and the layout classification dataset training set, validation set, and test set.
4.2. Model Training
In this paper, the model is built using the Pytorch deep learning framework and trained on a computer with a system environment of Win10, an Intel(R) Core (TM) i7-10700F CPU @ 2.90GHz processor and an NVIDIA Geforce RTX 3060 Ti 12G graphics card.
The dataset was imported into the improved DeepLabv3+ model and the model was trained. The categories for semantic segmentation are background, subject, text and graphics, and the output segmented images are of the same size as the input. Using the migration learning approach, the model parameters that have been trained by the large-scale dataset Pascal VOC 2012 are migrated to the model in this paper, and then the model training is carried out to train 200 Epochs respectively, with the Batch size set to 4. In this paper, the stochastic gradient descent (SGD) method is used to optimize the model during training, and according to the gradient descent method, the parameters of the model are continuously adjusted to minimize the loss function of the model, and its mathematical expression for updating the model parameters is as follows:
Where θt denotes the parameter values of the model at the tth iteration, α denotes the learning rate, and ∇L(θt) denotes the gradient of the loss function L (θ) with respect to the model parameter θ. Momentum was set to 0.9, initial learning rate was set to 0.007, and weight decay index was 0.0005. The poster layout classification dataset was then put into the GoogLeNet classification network model for training, with its training batch size set to 2, initial learning rate set to 0.001, and 200 epochs trained.
5. Experimental Results and Analysis
5.1. Loss Functions and Evaluation Indicators
The study in this paper belongs to the multi-category image segmentation problem, which are subject, text and graphics. Therefore, the categorical cross-entropy function is chosen as the loss function of the image segmentation model, which is calculated as follows:
where N is the number of samples, oi is the true label value of the sample, and pi is the probability of the predicted value of the sample. Loss value is the difference between the actual output probability and the expected output probability. The smaller the value of the cross entropy is, the closer the two probability distributions are.
Firstly, 2070 movie poster datasets and corresponding labeled graphs are imported into four image semantic segmentation models for training, of which 1610 images are in the training set and 460 images are in the validation set, and the changes of the loss function in the training and validation sets are observed during the training of the networks. As shown in Figure 7, it shows the change of loss function during the training process of the three models, where the horizontal coordinate represents the number of training rounds, and the vertical coordinate represents the loss function value. The first 50 rounds of all three models were trained by freezing, and the last 150 rounds were trained by unfreezing. Comparison of the loss change curves of the three models shows that the gap between the training loss and the validation loss of the improved model in this paper is small, and the training loss and the validation loss as a whole tends to decrease during the whole training process, and the loss gradually tends to flatten out after 150 rounds of iteration, which indicates that the model has reached the optimal state. It can be seen that the improved model in this chapter is normal throughout the training process, there is no overfitting or underfitting phenomenon, and the model is in good condition.
After the network training is completed, 230 test set images are fed into the trained model. Despite the fact that movie posters have complex graphical backgrounds and fonts of various colours and sizes, they still perform well on the improved segmentation model in this paper.
In this paper, Mean Intersection over Union (MIoU) is used as an evaluation index, which is calculated as follows:
where nij denotes the number of pixels in which category i is predicted to be category j, nii denotes the number of pixels that are predicted accurately, and n is the number of target categories (containing background, theme, text, and graphics).
5.2. Segmentation Comparison Experiment Analysis
5.2.1. Impact of Different Backbone Feature Extraction Networks on Model Performance
In order to reduce the number of parameters of the model, shorten the training time of the model, and improve the segmentation accuracy of the model for small target categories. In this paper, Xception, ResNet101, Mobilenetv2 and Mobilentv3-small networks are selected as the backbone feature extraction networks for testing the improved model, and Table 2 shows the performance of the model when different backbone feature extraction networks are used.
From Table 2, it can be seen that the Xception and ResNet101 networks have a higher number of parameters, more computation and longer inference time, which took almost 10 hours more compared to the Mobilenet series of networks. The Mobilenetv3 network is based on Mobilenetv1 and Mobilenetv2 with the addition of an attention mechanism and an improved time-consuming layer, thus it can be seen that Mobilenetv3-small has a greater improvement in segmentation accuracy compared to the previous three network structures, and the training time has also been reduced to some extent. Therefore, Mobilenetv3-small network is chosen as the backbone feature extraction network for the model in this chapter.
5.2.2. Comparative Experimental Analysis of Different Models
In order to further validate the advantages as well as the effectiveness of this paper's model in the task of image semantic segmentation, four models, namely, the classical model DeepLabv3 [14], FCN [19], PSPNet [20], and the original Deeplabv3+, are selected for comparative testing and analyzing with this paper's model, and the experimental results are shown in Table 3. In order to verify the validity of the models, all experiments are compared under the same parameter settings, and all are trained using the poster dataset constructed in this paper.
From the results in Table 3, it can be seen that the improved model in this chapter reduces 45 minutes in training time compared to the FCN model, and the segmentation accuracy is improved by 2.6%; compared to the PSPNet model, the improved model in this paper improves 2.0% in MIoU, and the training time is reduced by 78 minutes; compared to the DeepLabv3 model, the segmentation accuracy of this paper's model has a small effect of improvement. Compared with the DeepLabv3 model, the model in this paper has a small effect of improving the segmentation accuracy, which is only 0.8%, but the training time is saved by 165 minutes, which is a larger time reduction in comparison; compared with the original DeepLabv3+ model, the model in this paper has a large improvement in the segmentation accuracy, which is 6.1% compared to the improvement, and the training time is also relatively reduced by 52 minutes. In summary, the performance of the improved model in this chapter on the self-built dataset is the most outstanding compared to the classical model.
As can be seen from Figure 8, although the DeepLabv3 model has a higher MIoU performance compared with other classical models during training, the generalization ability of its model is not high as can be seen from the test result graphs. the FCN model is not fine enough for some detail segmentation, and the learning effect of the layout style model with fewer data samples is not as good as that of the improved model in this chapter. Compared with PSPNet and the basic DeepLabv3+ model, the difference in segmentation accuracy between the improved models in this paper is not large, and from the visualization results, the segmentation fineness of the improved models in this chapter is better than that of PSPNet and DeepLabv3+.
5.3. Analysis of Layout Results
This paper is divided into two phases. The first stage is to segment the elements of the poster using the improved DeepLabv3+ model, while the second stage is to analyze the position based on the segmentation of the elements of the poster layout, and to determine the layout method of each element of the poster using the GoogLeNet model. The main layout methods are shown in the common movie poster layout methods summarized in Part 2.
The GoogLeNet model was first trained with the movie poster classification dataset, and in order to select the classification model with better performance, comparative experiments were carried out using AlexNet [21], Mobilenet [22] and VGGNet [23], as shown in Figure 9, which shows the change of the loss during the training process of the four models, as well as the curve of the change of the classification accuracy rate under the same conditions.
From Figure 9, it can be seen that the GoogLeNet model has the best performance in the whole training process, so in this paper, the GoogLeNet model is chosen to analyze the layout method classification of movie posters. The network is constructed based on the Inception network, which fuses feature information from different scales to achieve better recognition results. Although the loss of the GoogLeNet model did not drop to a very low level during training, the loss was trending down throughout. As can be seen from the classification accuracy, iterating the same number of training times, GoogLeNet performs best in terms of accuracy.
6. Conclusions
Based on the analysis and generalization of the characteristics of complex layout images, this paper proposes a complex image layout analysis method based on improved DeepLabv3+. By improving the backbone network and the ASPP module in the DeepLabv3+ model, the network is easier to train and the image pixel recognition accuracy is higher, which enhances the model's ability to segment smaller categories of targets; secondly, based on the summarization of the poster image layout categories in this paper, we combine the GoogLeNet network model with the layout classification and analysis of the complex image. Using the improved method in this chapter to analyze the layout of layout elements of movie posters, the experimental results show that the accuracy of the method in this chapter does not differ much from that of the classical model, but the method in this chapter effectively enhances the model's ability to recognize the segmentation of smaller target categories and effectively reduces the training time of the model while guaranteeing the accuracy. Despite the performance improvement of the method in this chapter, due to the complexity of the design style of the complex layout image theme, text and other layout elements, the network is not effective in recognizing the text of the tilted style, and the model will continue to be improved in the future.
Author Contributions
Conceptualization, Z.Y.; methodology, Z.Y. and Y.P.; software, Y.P.; validation, X.L., W.Z. and Y.C.; resources, H.H. and L.Z.; writing—original draft preparation, Y.P.; writing—review and editing, Z.Y. and D.L.; supervision, Z.Y.; project administration, Z.Y.; funding acquisition, Z.Y. All authors have read and agreed to the published version of the manuscript.
Funding
This research was funded by the Natural Science Foundation of Hunan Province, Grant No. 2021JJ30218.
Institutional Review Board Statement
Not applicable.
Informed Consent Statement
Not applicable.
Data Availability Statement
Datasets and software code for the research described in the article will be available on the github.
Conflicts of Interest
The authors declare no conflicts of interest.
References
- Li, Hongni. 2021. Visual communication design of digital media in digital advertising. Journal of Contemporary Educational Research, 5(7), 36-39. [CrossRef]
- Jin, Xin., Zhou, Bin., Zou, Dongqing., Li, Xiaodong., Sun, Hongbo., & Wu, Lu. 2018. Image aesthetic quality assessment: A survey. Science and Technology Review, 36(9), 36-45. http://www.kjdb.org/CN/10.3981/j.issn.1000-7857.2018.09.005.
- Deng, Yubin., Loy, Chen, Change., & Tang, Xiaoou. 2017. Image aesthetic assessment: An experimental survey. IEEE Signal Processing Magazine, 34(4), 80-106. [CrossRef]
- She, Dongyu., Lai, Yu, Kun., Yi, Gaoxiong., & Xu, Kun. 2021. Hierarchical layout-aware graph convolutional network for unified aesthetics assessment. In Proceedings of the IEEE/CVF Conference on Computer Vision and Pattern Recognition, CVPR, Online, pp. 8475-8484. [CrossRef]
- Riyanto, Bedjo. 2023. Analysis of Design Elements on Secret Magic Control Agency Movie Poster. TAMA: Journal of Visual Arts, 1(1), 29-37. [CrossRef]
- Chen, Siyuan., Liu, Danfei., Pu, Yumei., & Zhong, Yunfei. 2022. Advances in deep learning-based image recognition of product packaging. Image and Vision Computing, 104571. [CrossRef]
- George, Nagy., & Sharad, C, Seth. 1984. Hierarchical image representation with application to optically scanned documents. Proc. 7th Int. Conference on Pattern Recognition (ICPR), 347-349. http://digitalcommons.unl.edu/cseconfwork.
- Mao, Song., Rosenfeld, Azriel., & Kanungo, Tapas. 2003. Document structure analysis algorithms: a literature survey. Document recognition and retrieval X, 5010, 197-207. [CrossRef]
- Ha, Jaekyu., Haralick, R. M., & Phillips, I. T. 1995. Document page decomposition by the bounding-box project. In Proceedings of 3rd International Conference on Document Analysis and Recognition. IEEE, Vol. 2, (1995, August). pp. 1119-1122. [CrossRef]
- Pu, Yumei., Liu, Danfei., Chen, Siyuan., & Zhong, Yunfei. 2023. Research Progress on the Aesthetic Quality Assessment of Complex Layout Images Based on Deep Learning. Applied Sciences, 13(17), 9763. [CrossRef]
- Wu, Xingjiao., Zheng, Yingbin., Ma, Tianlong., Ye, Hao., & He, Liang. 2021. Document image layout analysis via explicit edge embedding network. Information Sciences, 577, 436-448. [CrossRef]
- Guo, Shunan., Jin, Zhuochen., Sun, Fuling., Li, Jingwen., Li, Zhaorui., Shi, Yang., & Cao, Nan. 2021. Vinci: an intelligent graphic design system for generating advertising posters. In Proceedings of the 2021 CHI conference on human factors in computing systems. (2021, May). pp. 1-17. [CrossRef]
- Chen, Liang, Chieh., Papandreou, George., Schroff, Florian., & Adam, Hartwig. 2017. Rethinking atrous convolution for semantic image segmentation. arXiv preprint arXiv:1706.05587. [CrossRef]
- Chen, Liang, Chieh., Papandreou, George., Kokkinos, Iasonas., Murphy, Kevin., & Yuille, Alan, L. 2017. Deeplab: Semantic image segmentation with deep convolutional nets, atrous convolution, and fully connected crfs. IEEE transactions on pattern analysis and machine intelligence, 40(4), 834-848. [CrossRef]
- Chollet, Francois. 2017. Xception: Deep learning with depthwise separable convolutions. In Proceedings of the IEEE conference on computer vision and pattern recognition. pp. 1251-1258. [CrossRef]
- Andrew, Howard., Mark, Sandler., Grace, Chu., Liang-Chieh, Chen., Bo, Chen., Mingxing, Tan., Weijun, Wang., Yukun, Zhu., Ruoming, Pang., Vijay, Vasudevan., Quoc, V. Le., Hartwig, Adam. 2019. Searching for mobilenetv3. Proceedings of the IEEE/CVF international conference on computer vision. pp. 1314-1324. [CrossRef]
- Szegedy, Christian., Wei Liu, Yangqing Jia., Sermanet, Pierre., Reed, Scott., Anguelov, Dragomir., Erhan, Dumitru., Vanhoucke, Vincent., Rabinovich, Andrew. 2015. Going deeper with convolutions. 2015 IEEE Conference on Computer Vision and Pattern Recognition (CVPR), 1-9. [CrossRef]
- Everingham, Mark., Eslami, S. M. Ali., Van Gool, Luc., Williams, Christopher. K. I., Winn, John., & Zisserman, Andrew. 2015. The pascal visual object classes challenge: A retrospective. International journal of computer vision, 111, 98-136. [CrossRef]
- Long, Jonathan., Shelhamer, Evan., & Darrell, Trevor. 2015. Fully convolutional networks for semantic segmentation. In Proceedings of the IEEE conference on computer vision and pattern recognition, pp. 3431-3440. [CrossRef]
- Zhao, Hengshuang., Shi, Jianping., Qi, Xiaojuan., Wang, Xiaogang., & Jia, Jiaya. 2017. Pyramid scene parsing network. In Proceedings of the IEEE conference on computer vision and pattern recognition, pp. 2881-2890. [CrossRef]
- Krizhevsky, Alex., Sutskever, Ilya., & Hinton, Geoffrey. E. 2017. ImageNet classification with deep convolutional neural networks. Communications of the ACM, 60(6), 84–90. [CrossRef]
- Howard, Andrew, G., Zhu, Menglong., Chen, Bo., Kalenichenko, Dmitry., Wang, Weijun., Weyand, Tobias., Andreetto, Marco., & Adam, Hartwig. 2017. Mobilenets: Efficient convolutional neural networks for mobile vision applications. arXiv preprint arXiv:1704.04861. [CrossRef]
- Simonyan, Karen., & Zisserman, Andrew. 2014. Very deep convolutional networks for large-scale image recognition. arXiv preprint arXiv:1409.1556. [CrossRef]
Figure 1.
Schematic Diagram of the Poster Layout. (a) Centered Layout; (b) Split Layout; (c) Symmetrical Layout; (d) Diagonal Layout; (e) Wraparound Layout; (f) Full-Screen Layout; (g) Axial Layout; (h) Inclined Layout.
Figure 1.
Schematic Diagram of the Poster Layout. (a) Centered Layout; (b) Split Layout; (c) Symmetrical Layout; (d) Diagonal Layout; (e) Wraparound Layout; (f) Full-Screen Layout; (g) Axial Layout; (h) Inclined Layout.
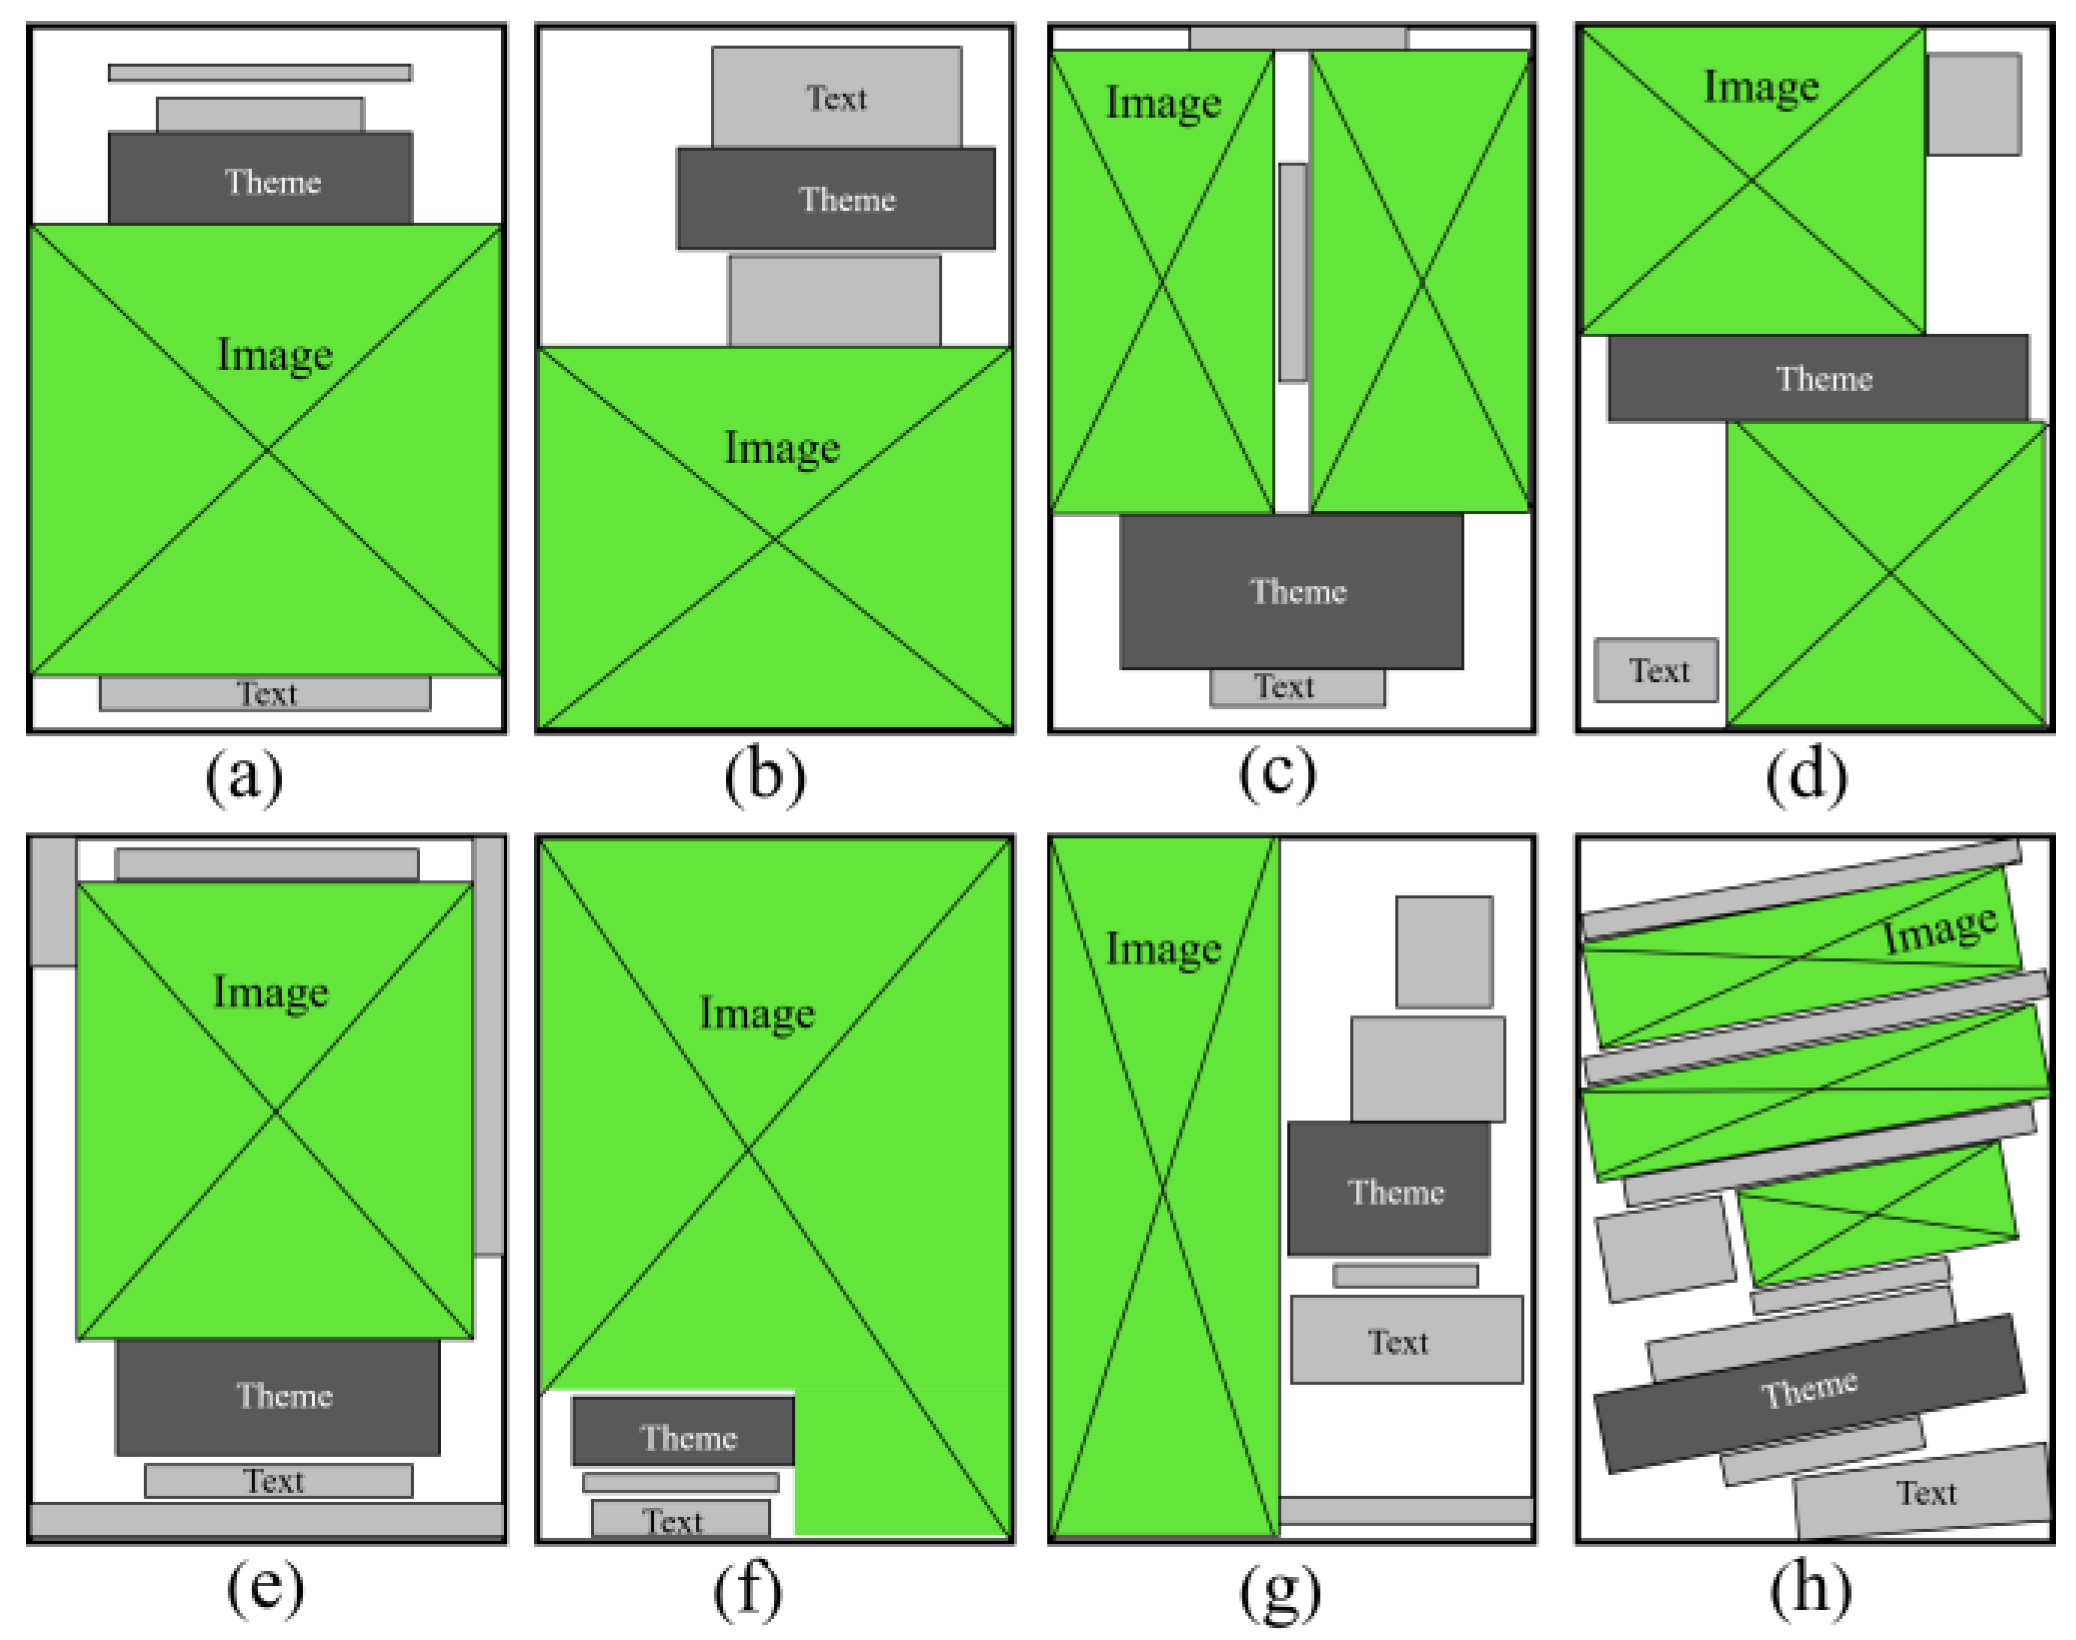
Figure 2.
DeepLabv3+ Basic Network Architecture [13].
Figure 2.
DeepLabv3+ Basic Network Architecture [13].
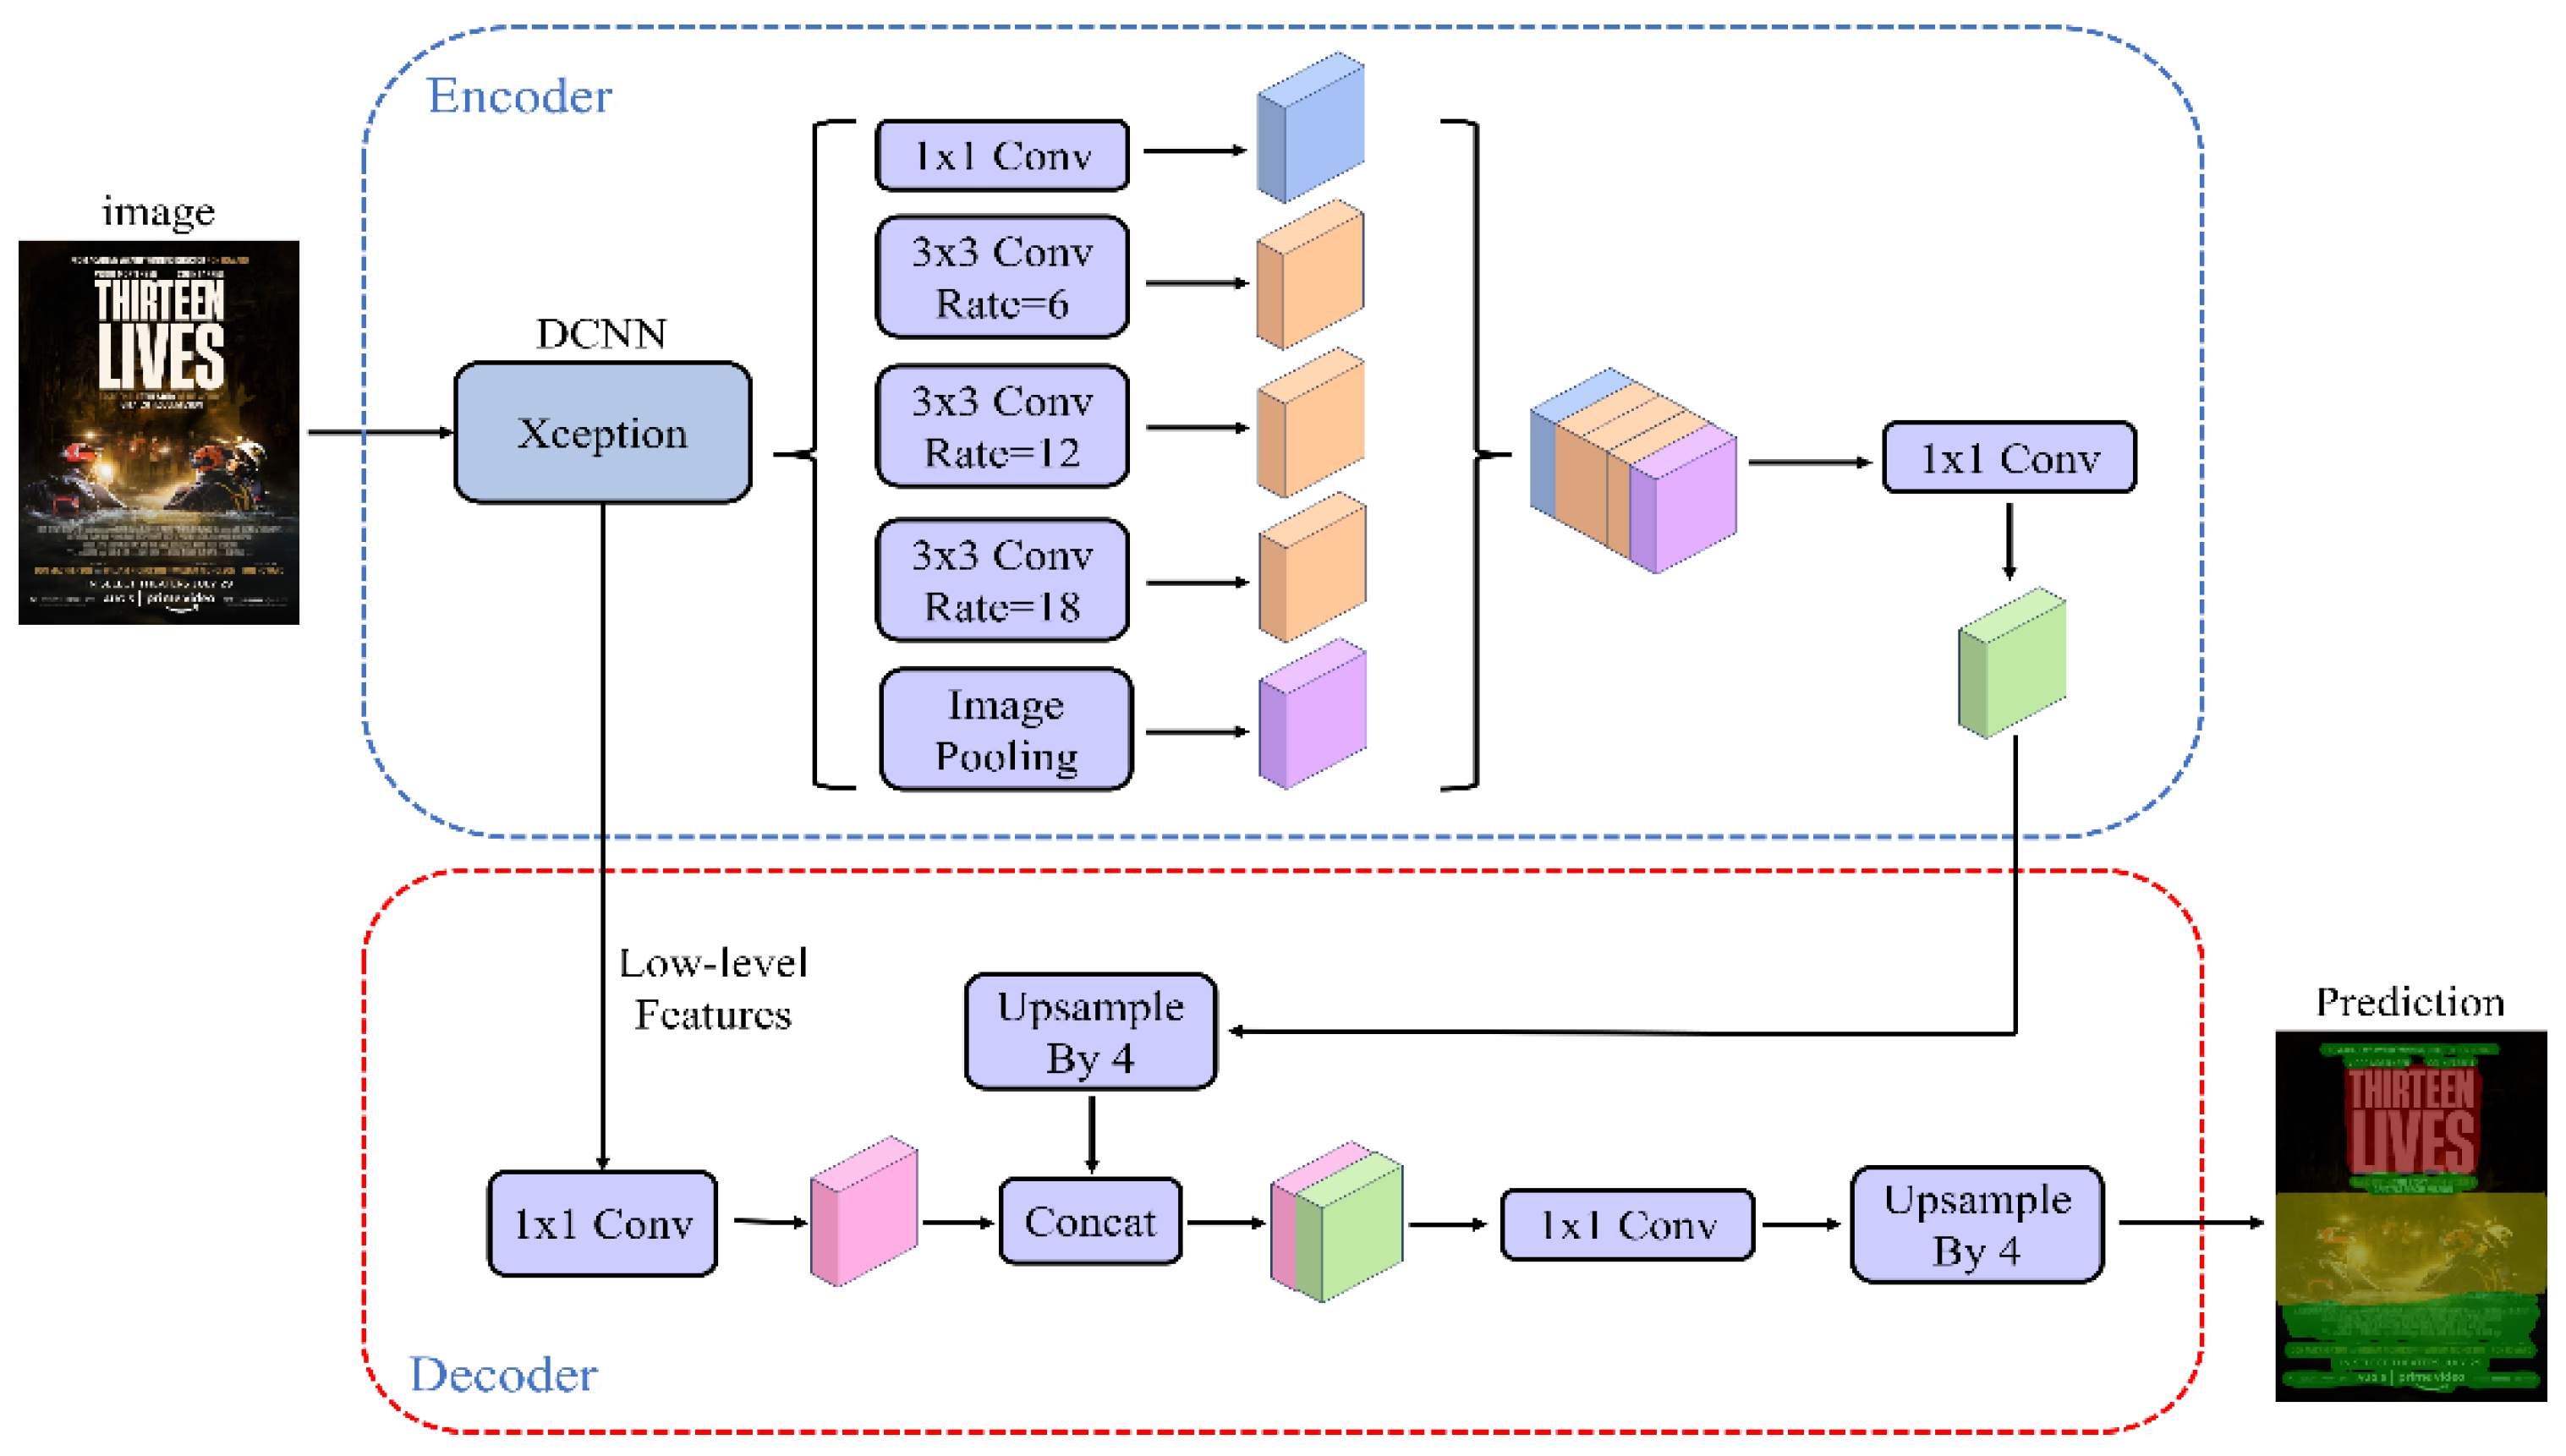
Figure 3.
Mobilenetv3 network structure diagram [16].
Figure 3.
Mobilenetv3 network structure diagram [16].
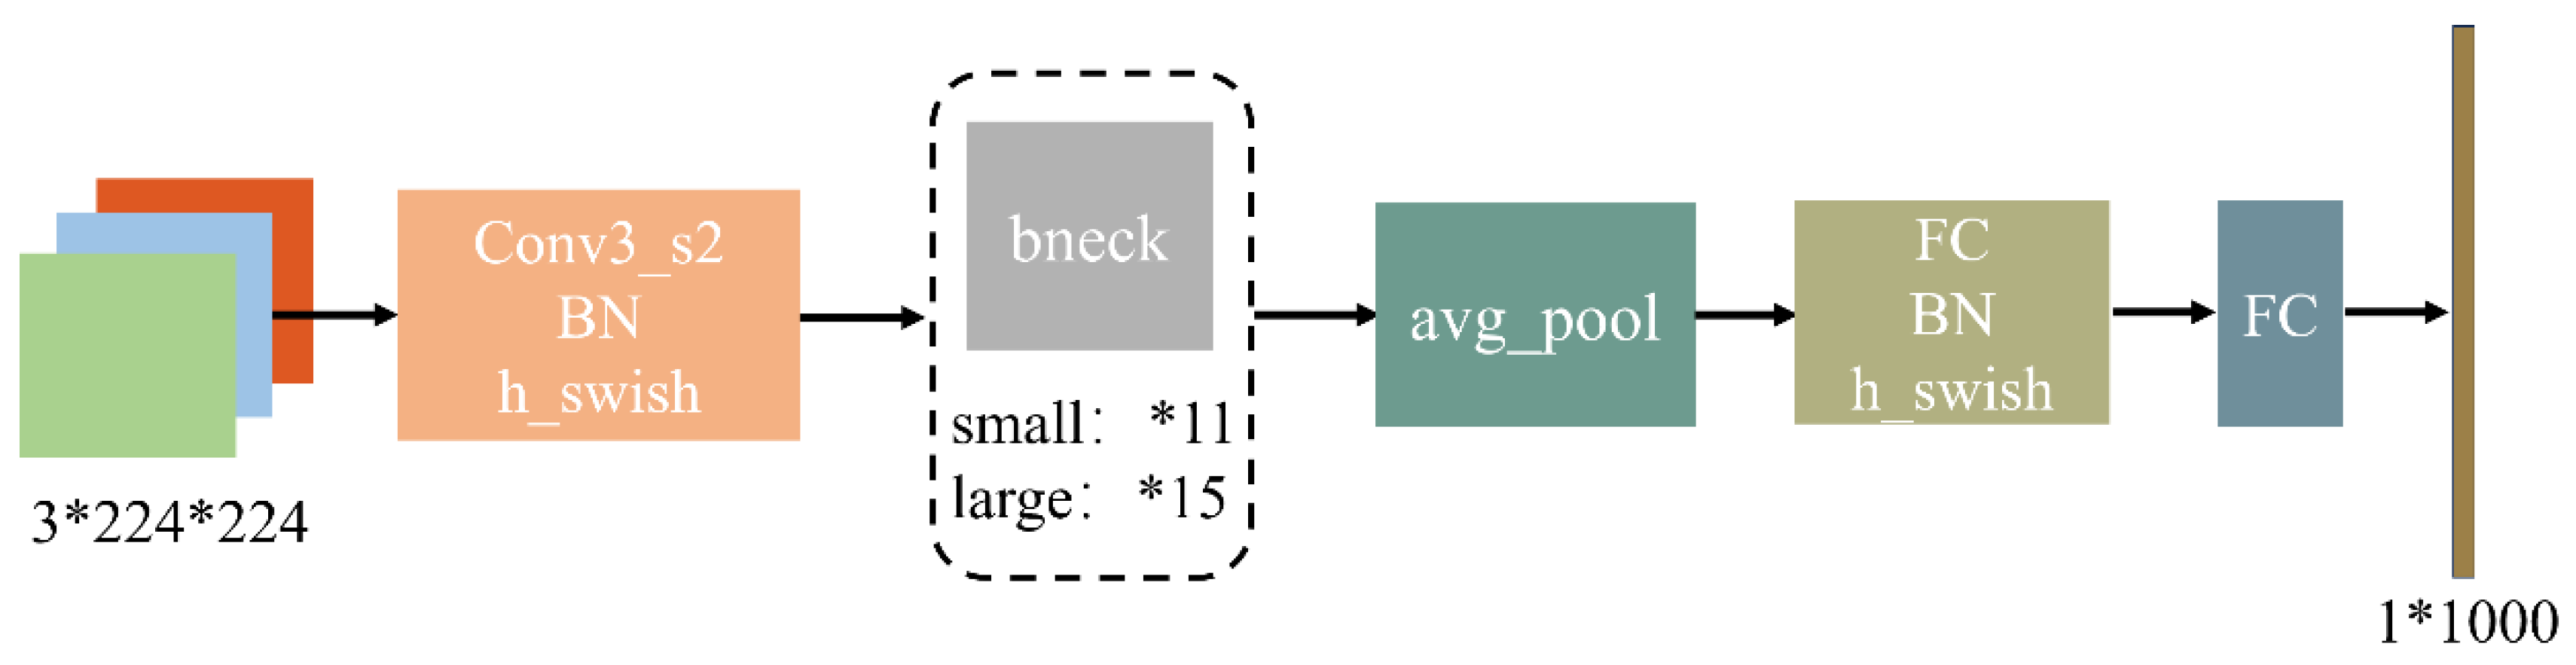
Figure 4.
Improved DeepLabv3+ Model Architecture.
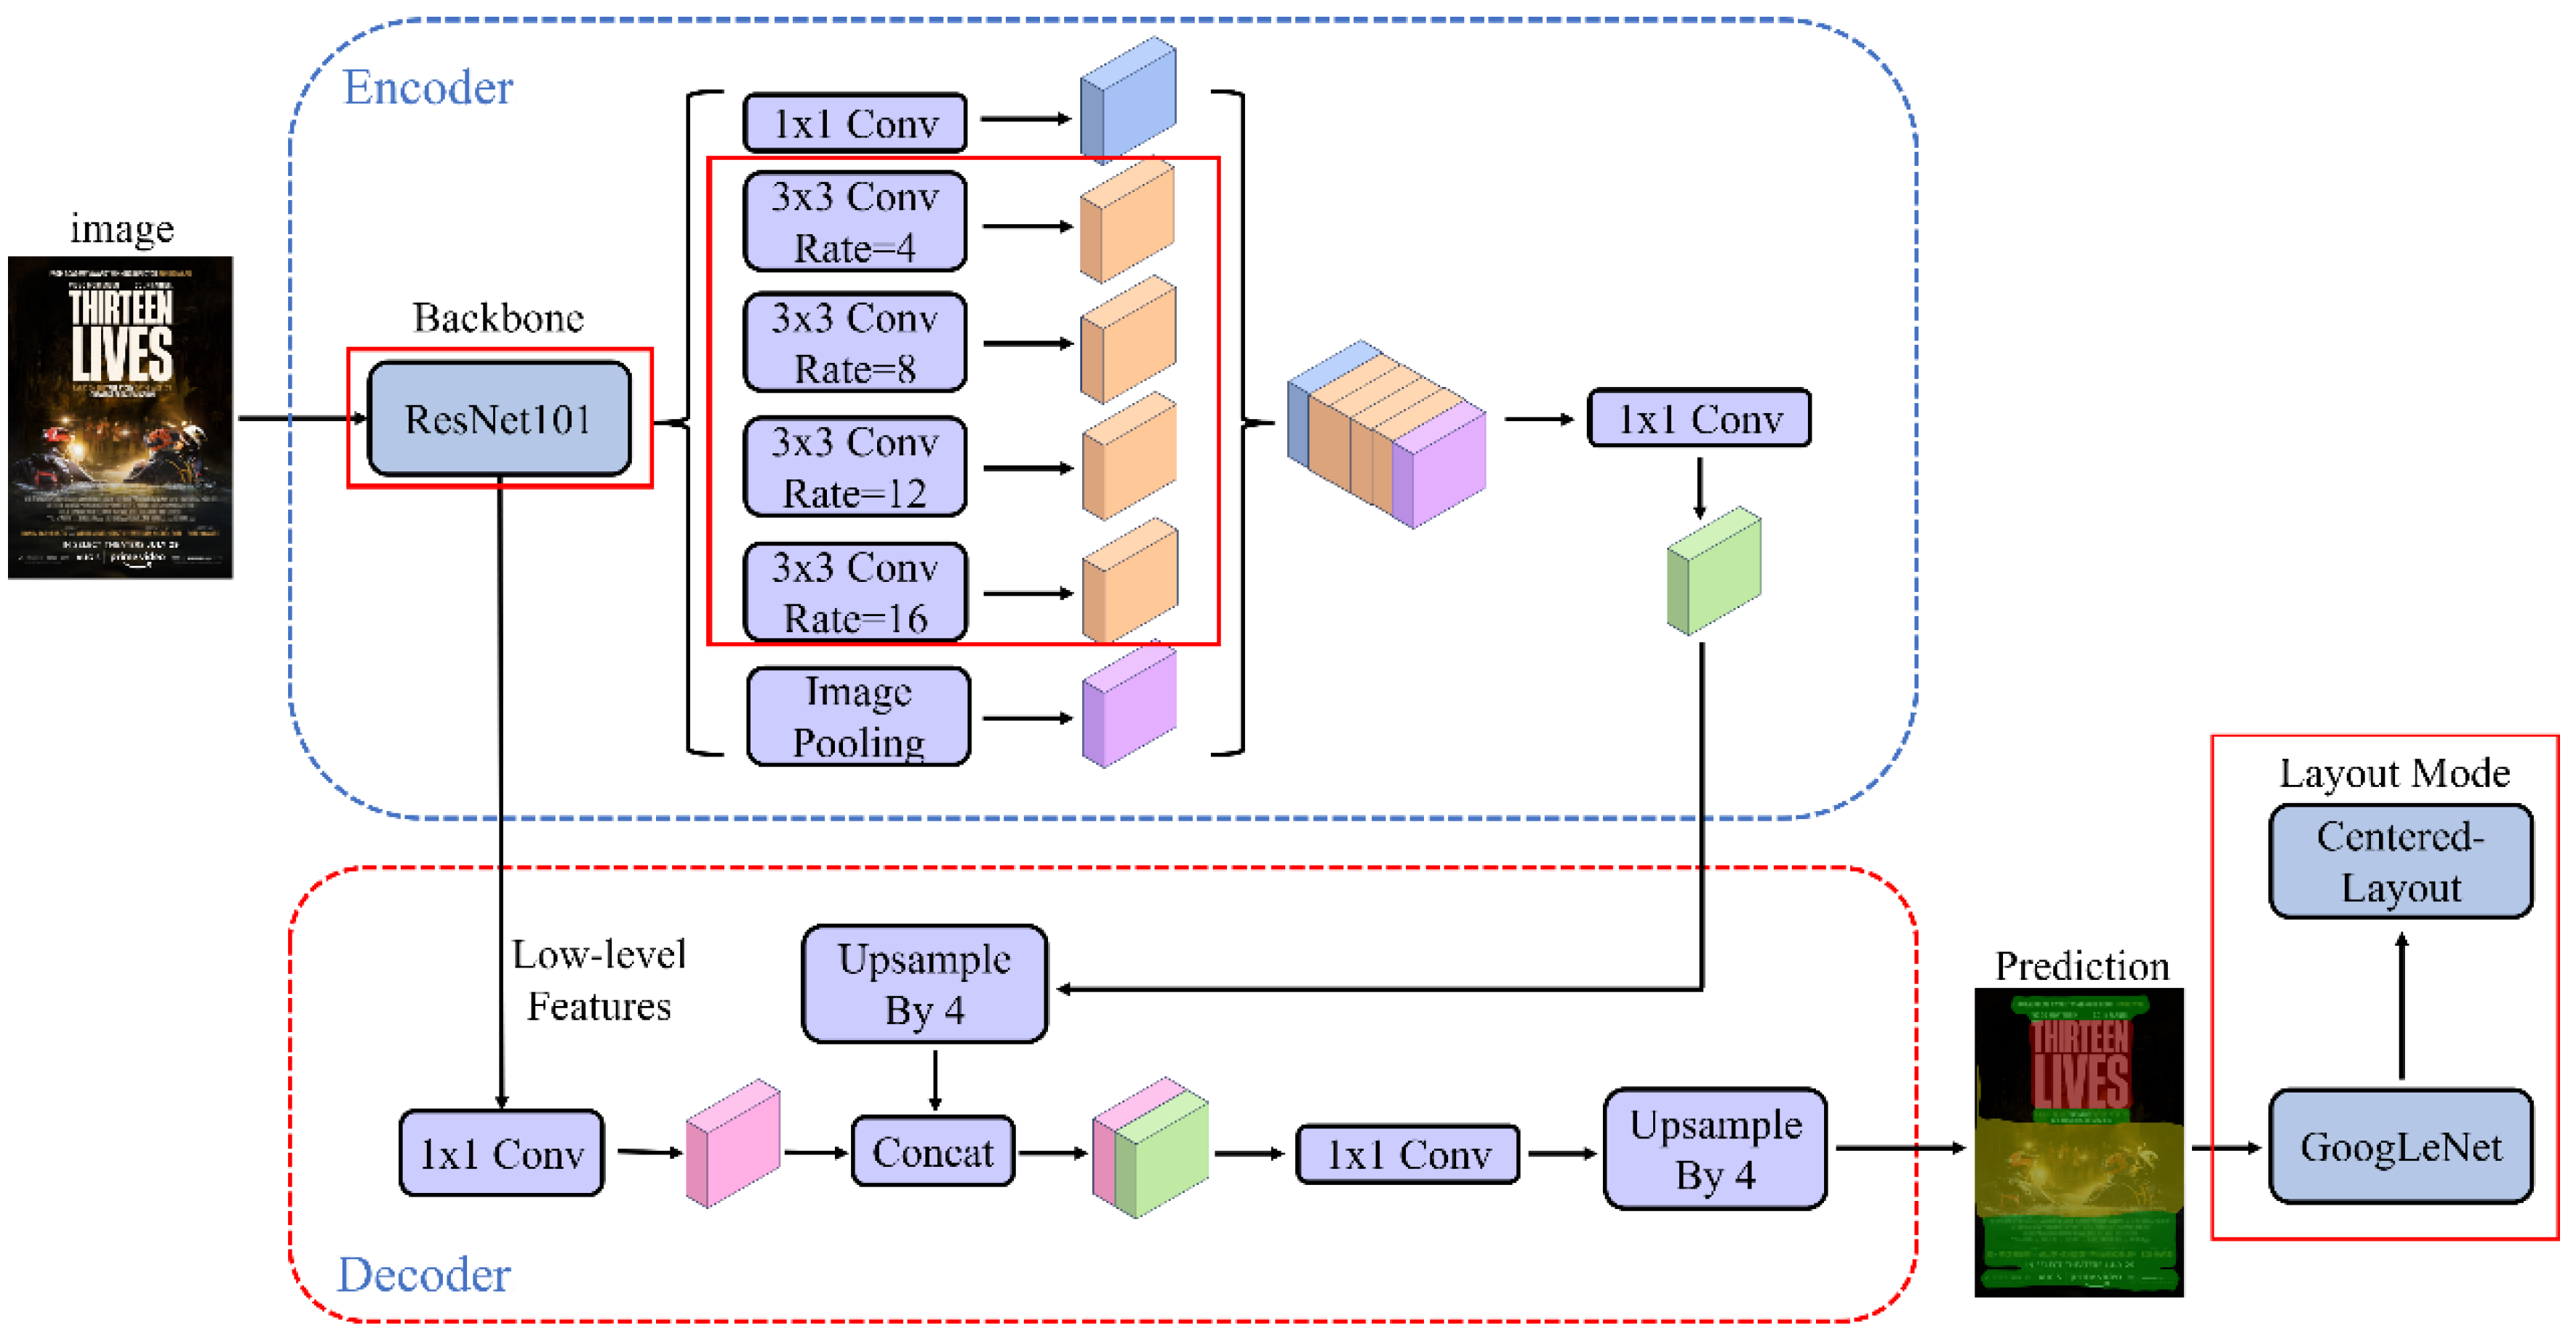
Figure 5.
Data Collection. (a) Sample Poster; (b) Split Label Diagram; (c) Label Split Effect Diagram.
Figure 5.
Data Collection. (a) Sample Poster; (b) Split Label Diagram; (c) Label Split Effect Diagram.
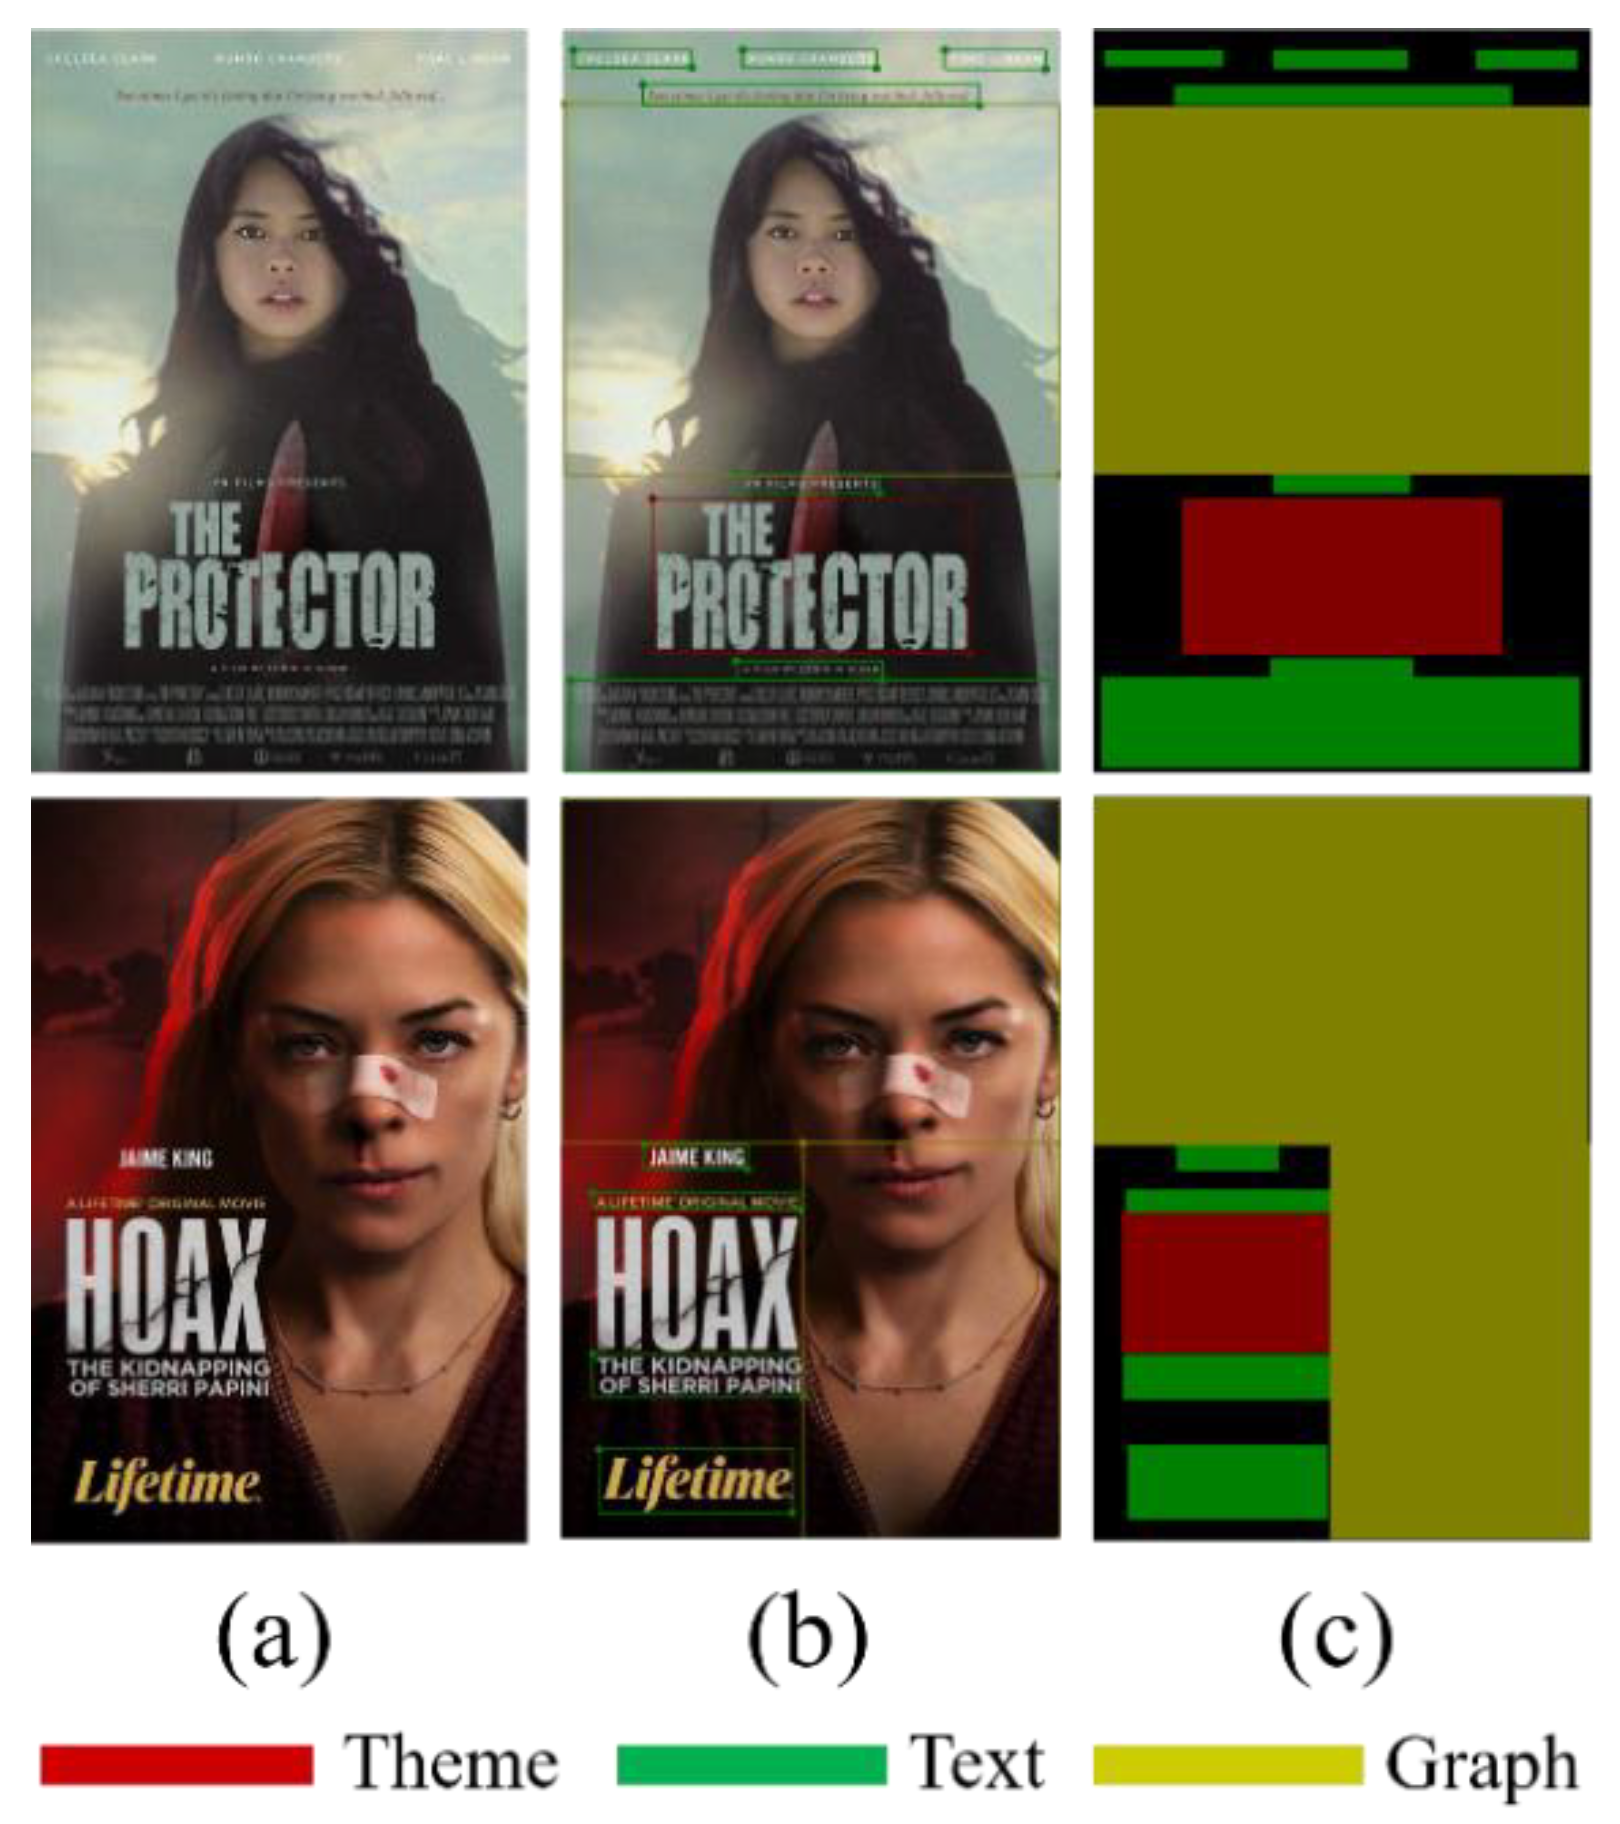
Figure 6.
Poster Layout Categorization Dataset Category Sample Distribution.
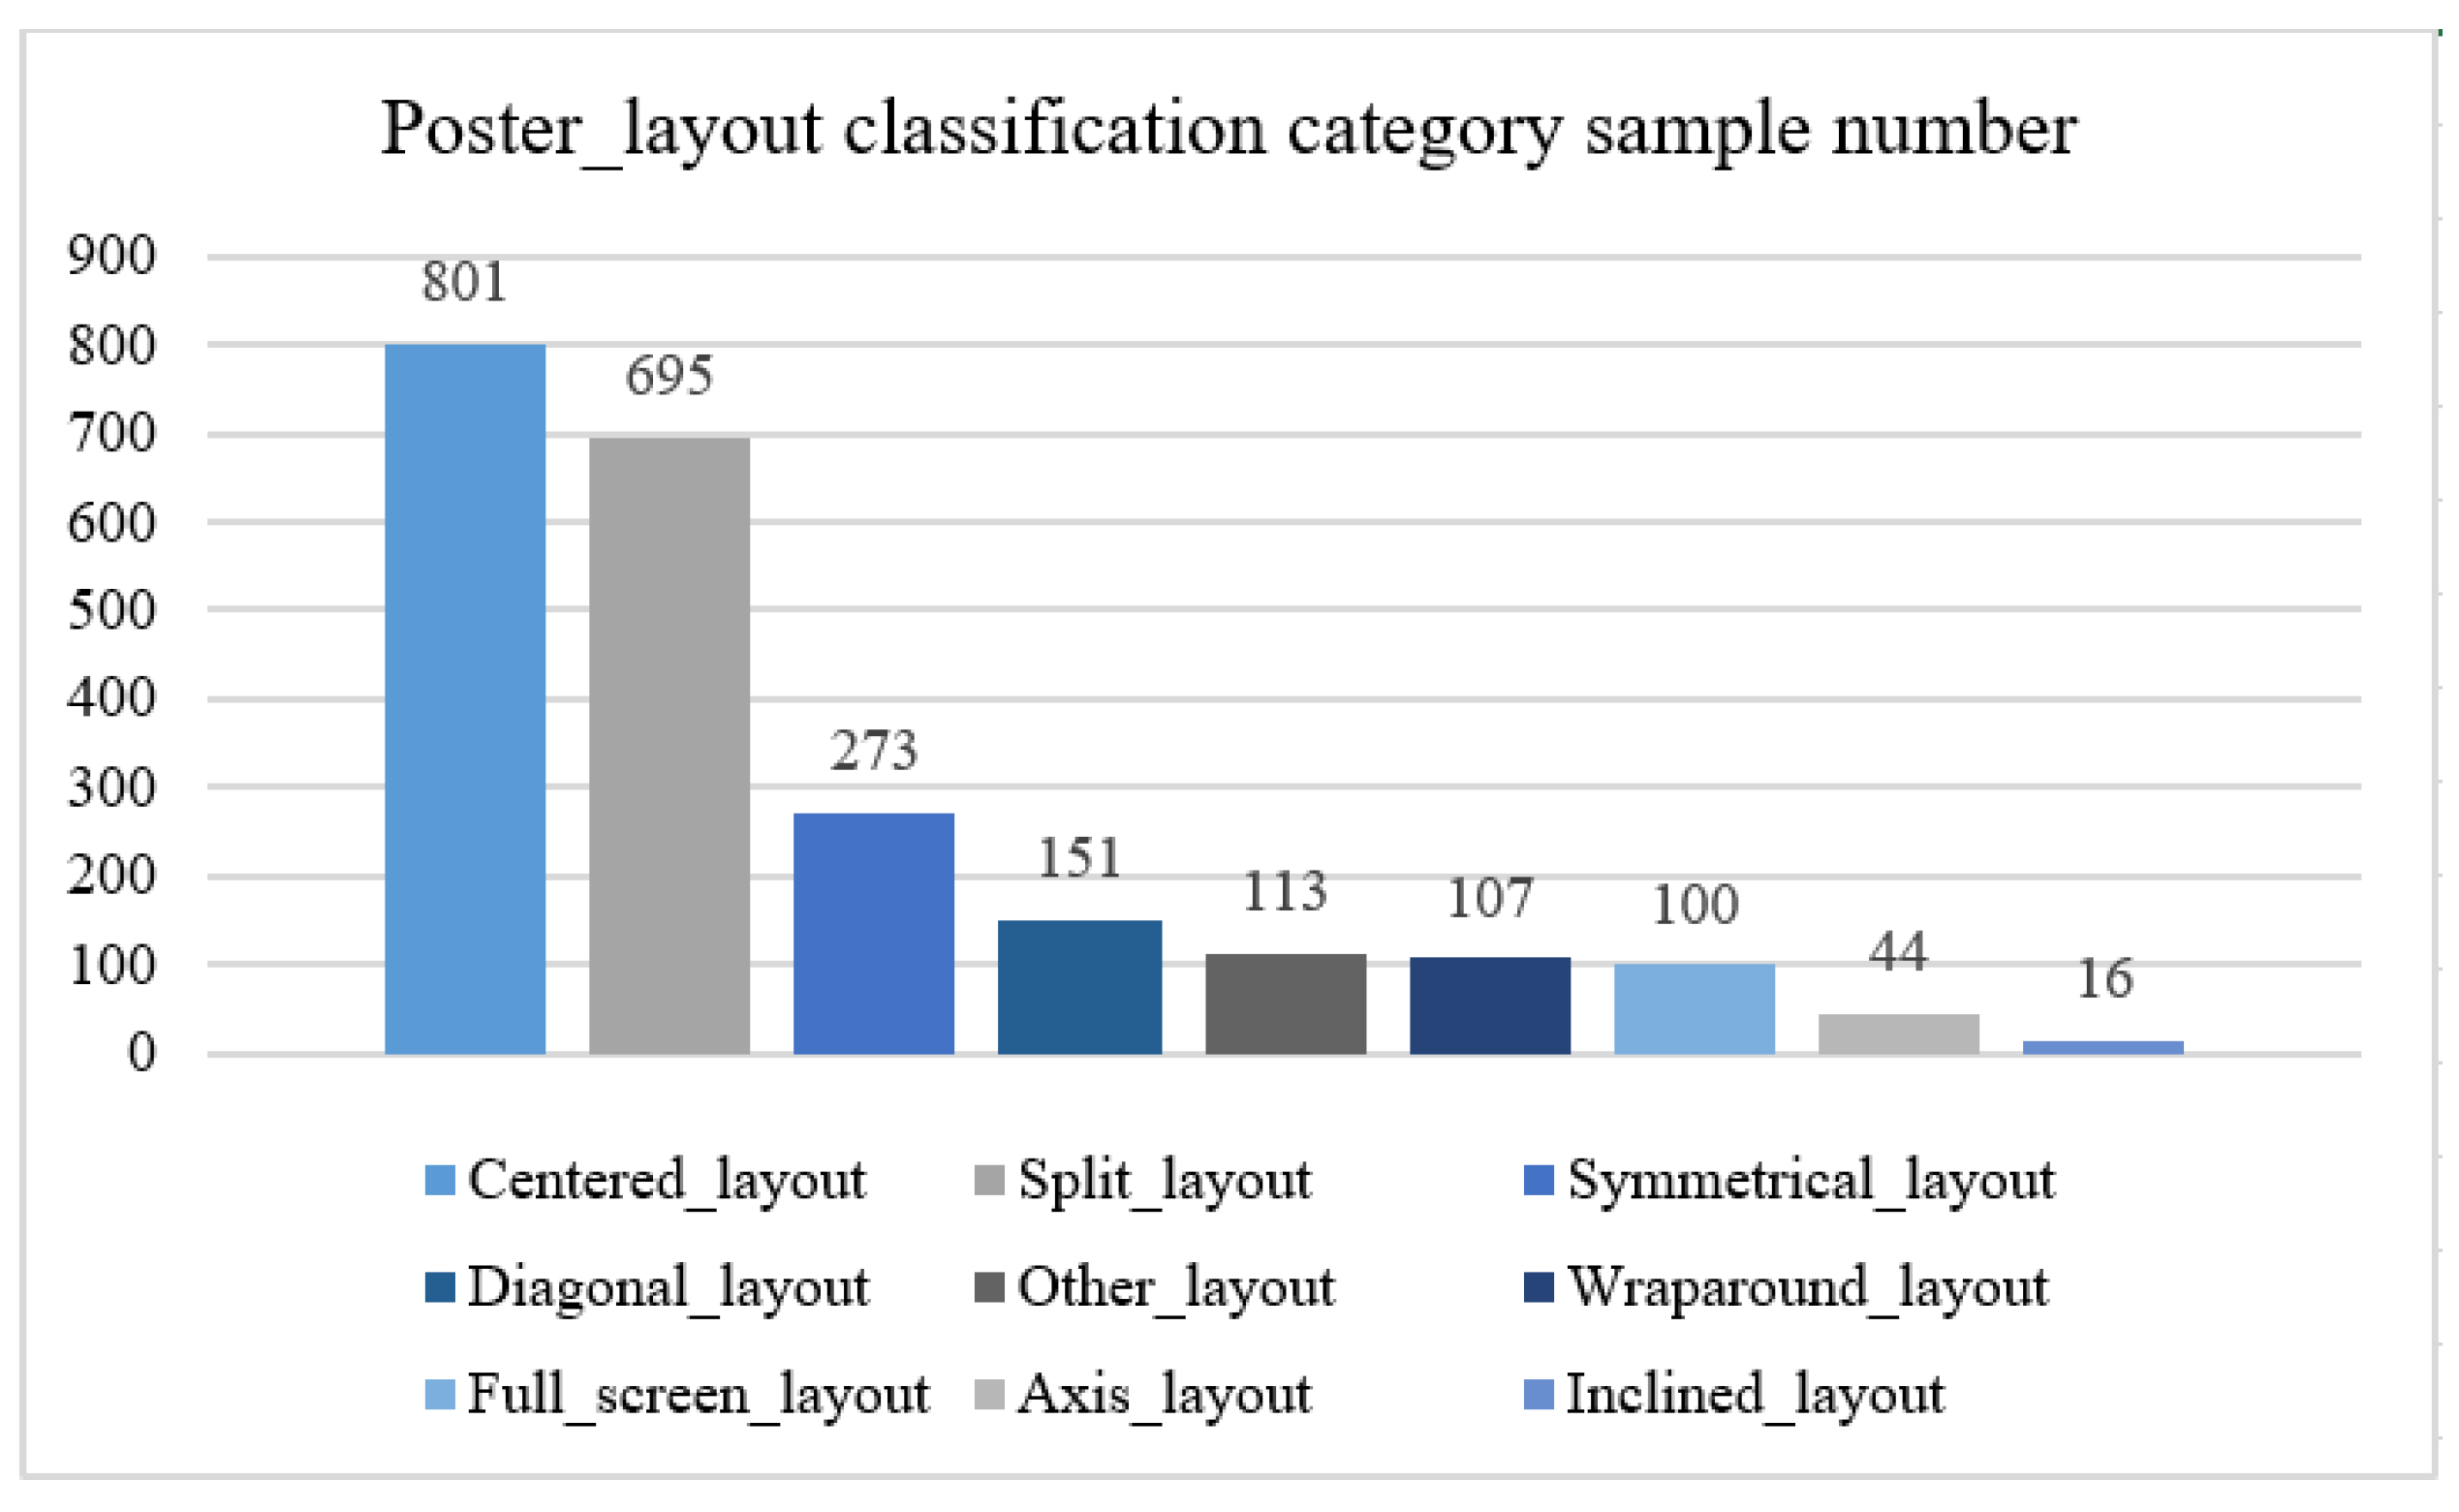
Figure 7.
Loss function variation curves of the training set and validator on three different models. (a) the improved DeepLabv3+ model in this paper; (b) the original DeepLabv3+ model; (c) the PSPNet+ResNet50 model).
Figure 7.
Loss function variation curves of the training set and validator on three different models. (a) the improved DeepLabv3+ model in this paper; (b) the original DeepLabv3+ model; (c) the PSPNet+ResNet50 model).
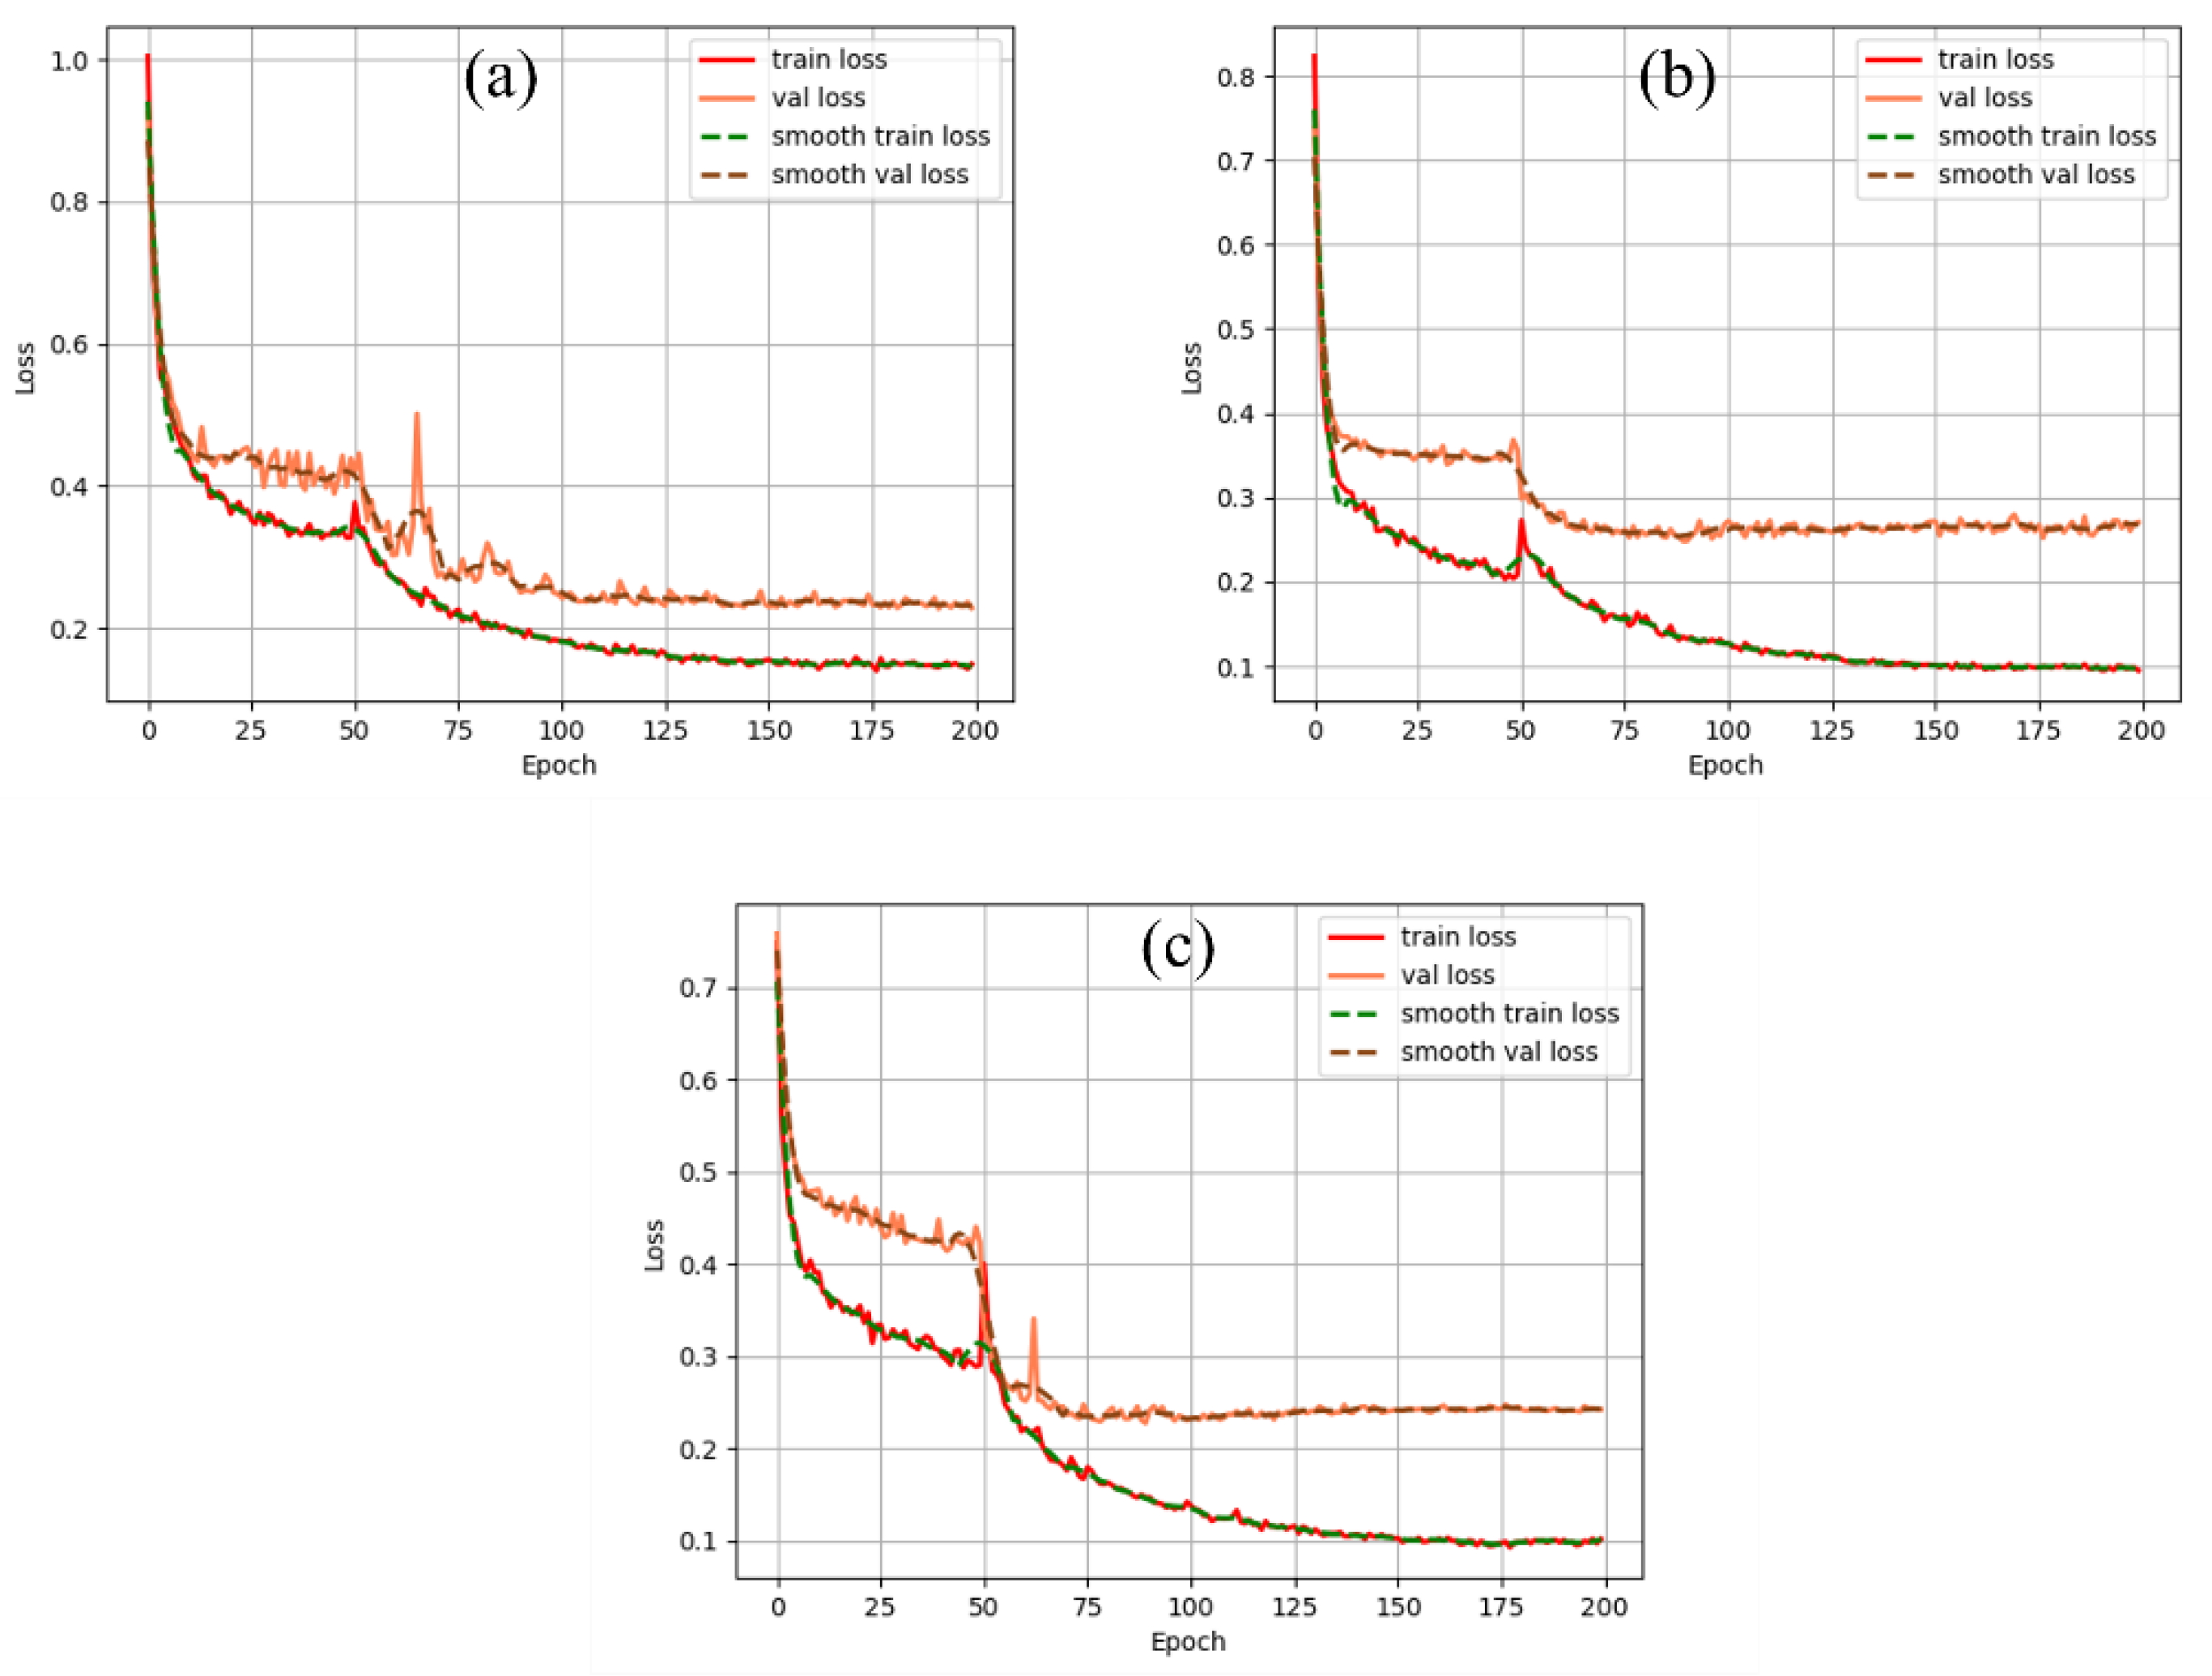
Figure 8.
Comparison of page segmentation test results.
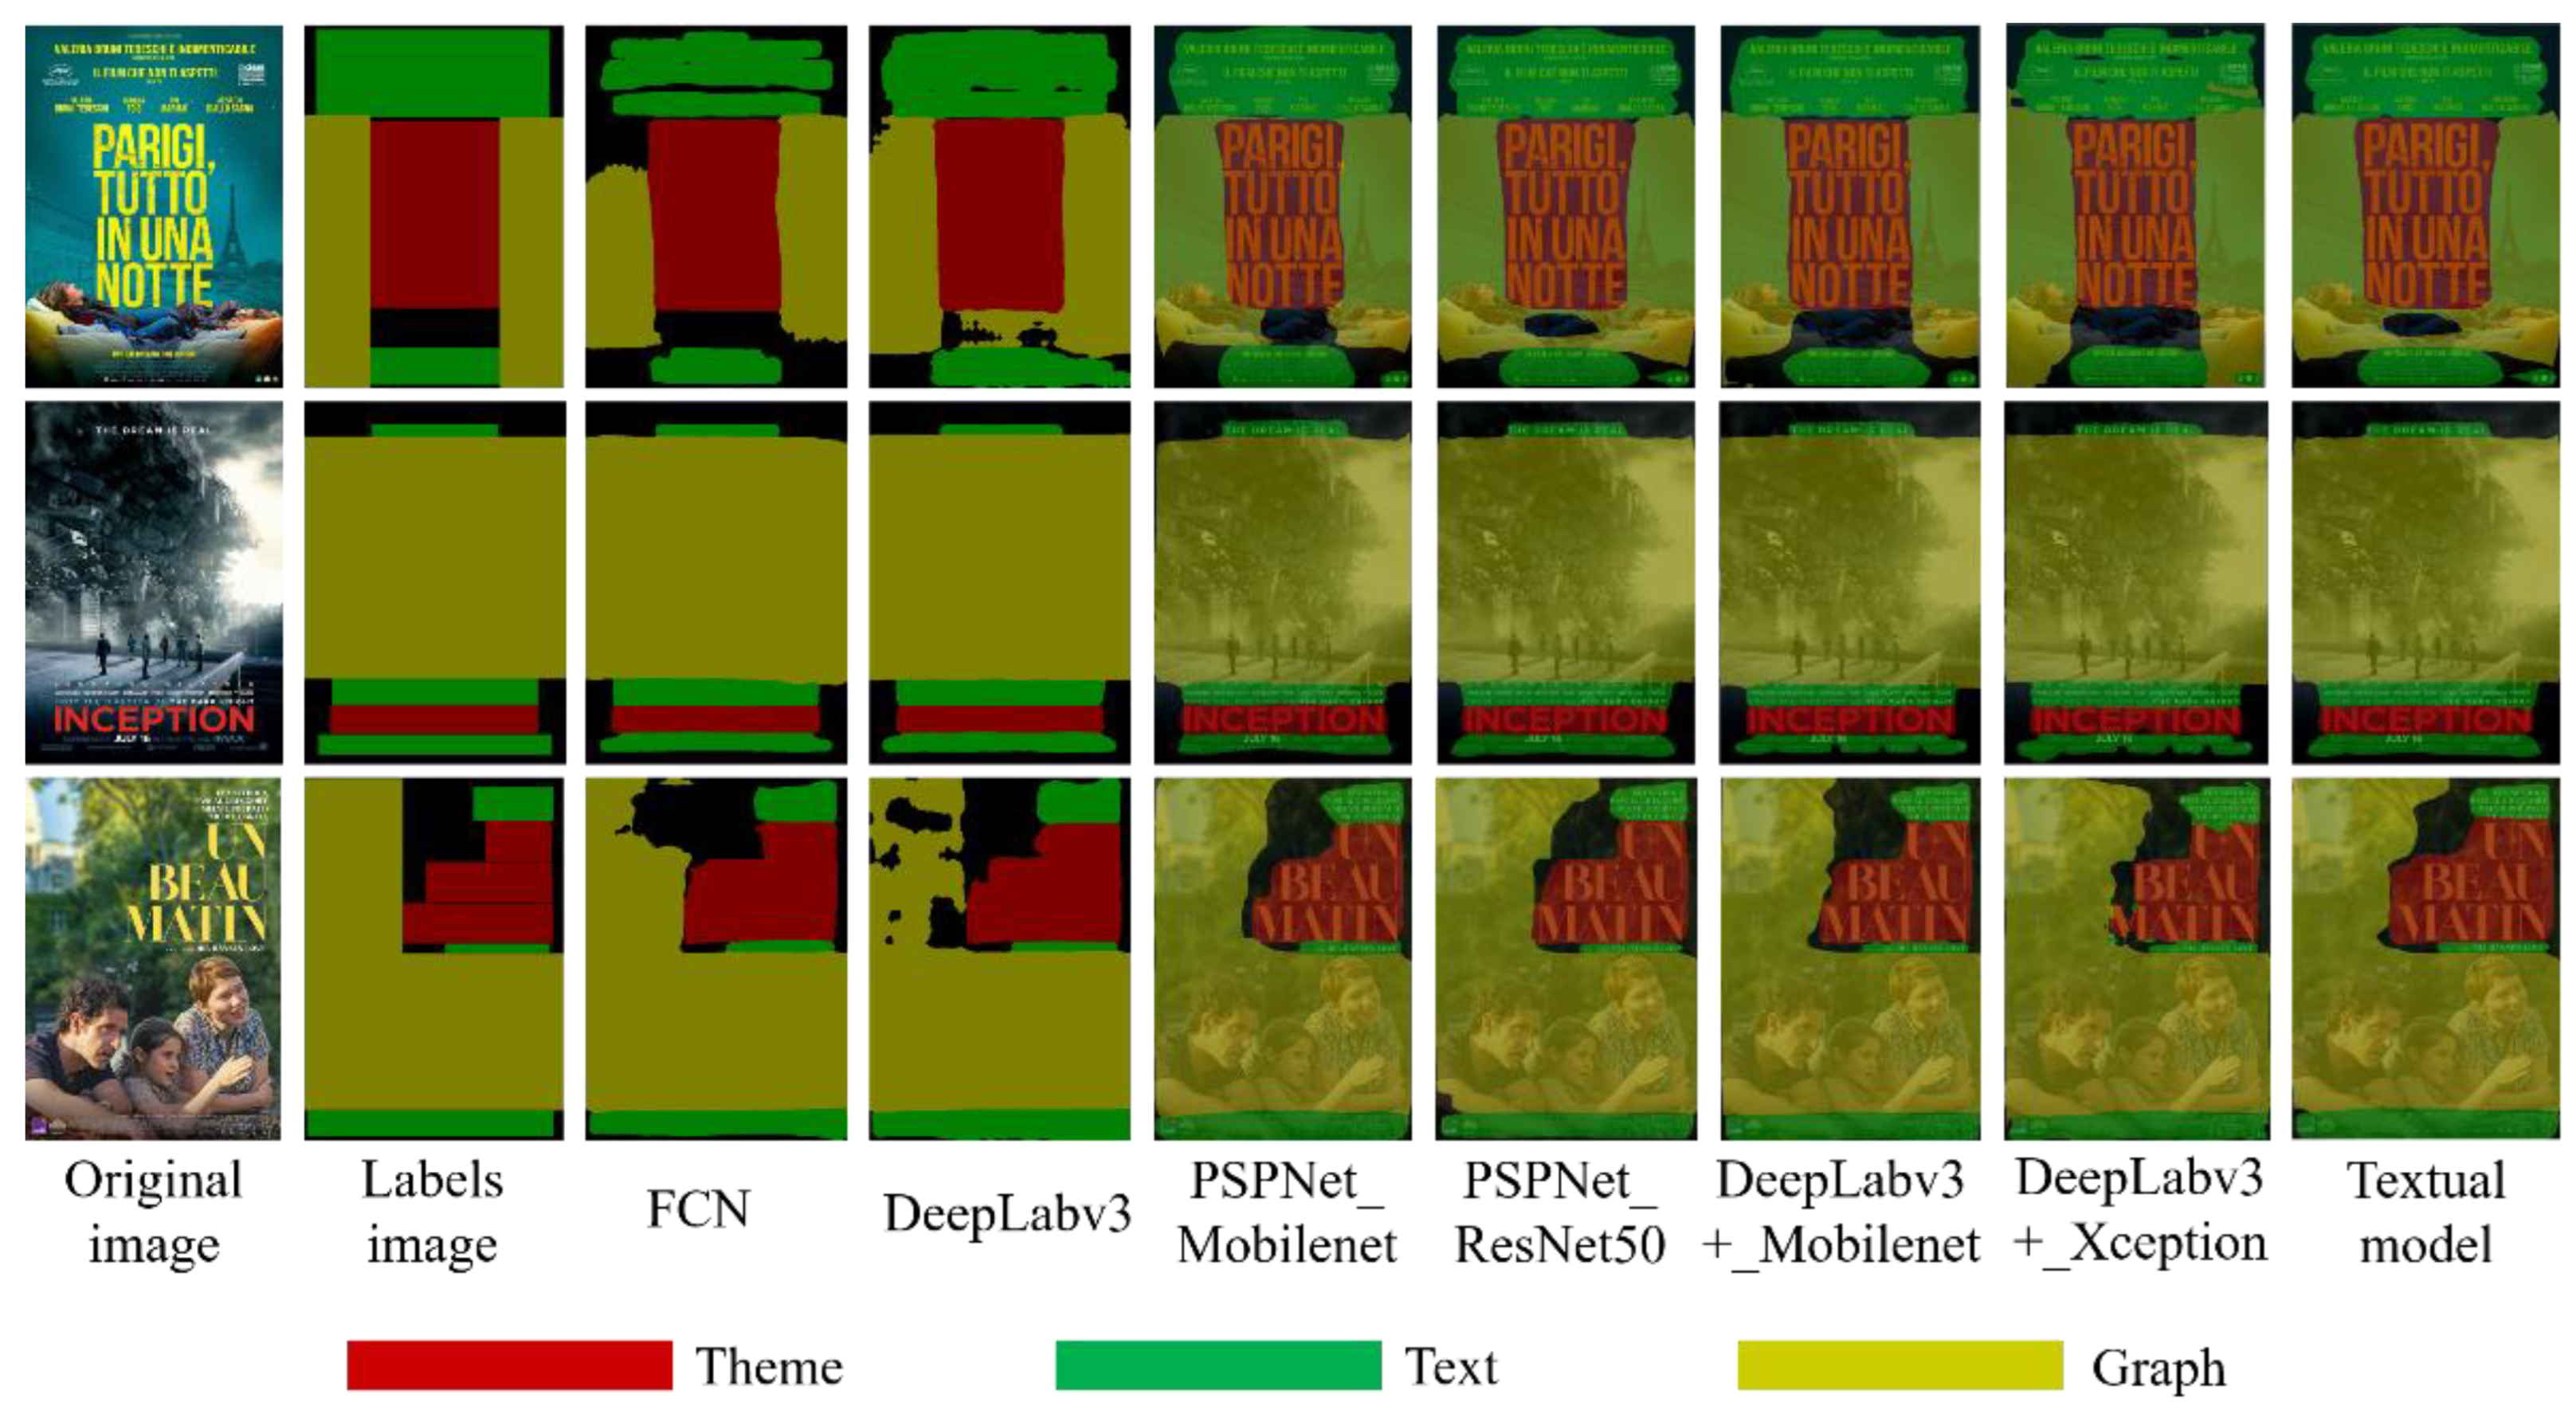
Figure 9.
Loss and accuracy variation curves for four classification models.
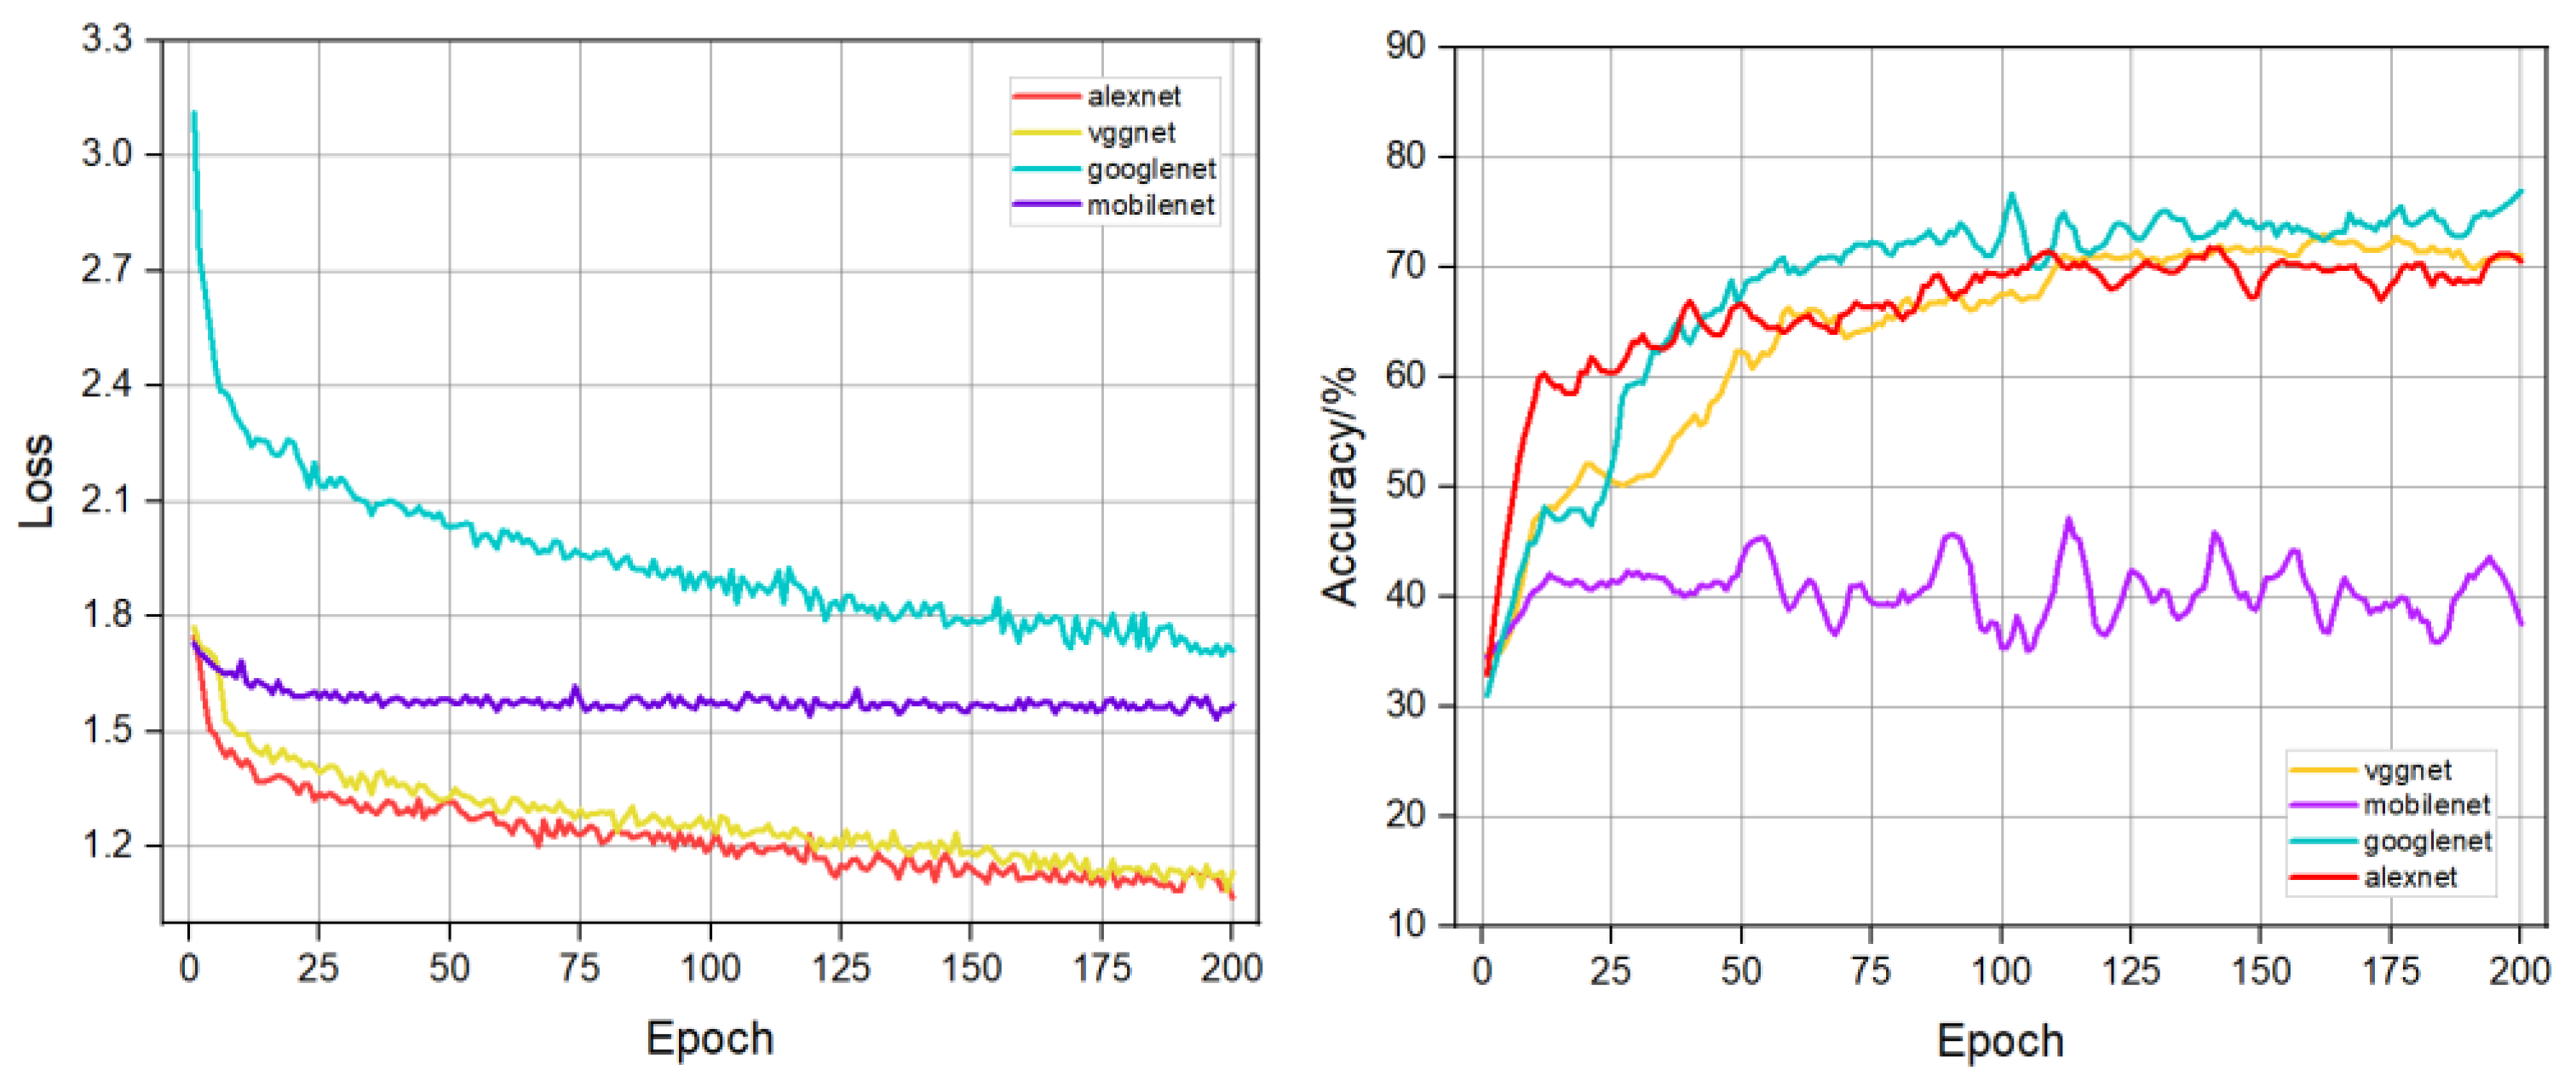

Table 1.
Poster segmentation dataset and classification dataset division.
| Dataset | Train | Val | Test |
|---|---|---|---|
| Poster Segmentation | 1610 | 460 | 230 |
| Poster_layout classification | 2080 | 220 | — |
Table 2.
Comparison of model results using different backbone feature extraction networks.
| Backbone | MIoU/% | Time/h |
|---|---|---|
| Xception | 71.09 | 25.10 |
| ResNet101 | 72.89 | 26.20 |
| Mobilenetv2 | 70.05 | 16.20 |
| Mobilenetv3-small | 75.60 | 15.09 |
Table 3.
Comparison experimental results of different models.
| Model | Backbone | MIoU/% | Time/h |
|---|---|---|---|
| FCN | ResNet101 | 73.00 | 15.54 |
| PSPNet | ResNet101 | 73.60 | 16.27 |
| DeepLabv3 | ResNet101 | 74.80 | 17.54 |
| DeepLabv3+ | Mobilenetv2 | 69.50 | 16.01 |
| Textual model | Mobilenetv3-small | 75.60 | 15.09 |
Disclaimer/Publisher’s Note: The statements, opinions and data contained in all publications are solely those of the individual author(s) and contributor(s) and not of MDPI and/or the editor(s). MDPI and/or the editor(s) disclaim responsibility for any injury to people or property resulting from any ideas, methods, instructions or products referred to in the content. |
© 2025 by the authors. Licensee MDPI, Basel, Switzerland. This article is an open access article distributed under the terms and conditions of the Creative Commons Attribution (CC BY) license (http://creativecommons.org/licenses/by/4.0/).
Copyright: This open access article is published under a Creative Commons CC BY 4.0 license, which permit the free download, distribution, and reuse, provided that the author and preprint are cited in any reuse.


