Submitted:
06 May 2025
Posted:
07 May 2025
You are already at the latest version
Preprints on COVID-19 and SARS-CoV-2
Abstract
Background: Previous research has indicated that COVID-19 vaccination can reduce mortality, but diminishing protection and side effects have also been demonstrated. We can, therefore, not rule out that countries’ vaccination rates have affected mortality differently over time. That is, as vaccines may reduce national mortality temporarily, we know less about long-term effects. Methods: To study the research question, I used Our World in Data from 39 high-income countries and analysed them from early 2021 to the end of 2023. My motive for analysing those countries was relative homogeneity, presumably relatively high data quality, and, most importantly, they provided relatively consistent data during the study period. Analyses were weighted for population size. Results: From the last half of 2021 to February-March 2022, all-cause mortality was relatively low in countries with relatively high vaccination rates, which indicates temporal protection. However, a similar association concerning mortality excluding COVID-19 counters that explanation but not ruled out as it was less marked than between vaccination and all-cause excess mortality. From the beginning of March 2022, the vaccine rollout had stabilized, and since then, to the end of 2023, the mortality was consistently higher the higher the countries’ vaccination rate. The association was robust when controlling for alternative explanations. Conclusions: COVID-19 vaccination may induce limited short-term protection against mortality, but the long-term effect appears detrimental. As the analyses controlled for alternative explanations concerning the vaccine’s detrimental long-term mortality effect, ecological fallacy is not a major threat to the study’s internal validity.
Keywords:
COVID-19 vaccine
; all-cause excess mortality
; mortality excluding COVID-19 deaths
; nation-level analysis
; long-term analysis
Introduction
Previous research has indicated that COVID-19 vaccination can reduce mortality [1,2,3], which aligns with a study by Matveeva and Shabalina [4], who, between October 2021 and January 2022, at a national level found lower mortality rates in high-vaccination countries than in low-vaccination countries. In contrast, other research has shown that the COVID-19 vaccines’ protection against mortality vanes [5], and as side effects have also been reported [6,7,8], can we rule out that a long-term detrimental effect may eventually dominate? That is, can we rule out that the consistent long-term excess mortality shown in studies [9,10], despite fewer COVID-19 deaths [10], can be due to the vaccine’s diminishing protection [5] and demonstrated side effects [6,7,8]?
In my opinion, explaining excess mortality in the wake of the pandemic [9,10] is perhaps one of the most pressing research questions today. Hence, since honest and transparent scholarly works should not ignore any important inquiry, whether comfortable or not, politically correct or not, aligning with established medical consensus or not, where the leading British Medical Journal, unfortunately, has shown such tendencies [11], I argue that the above research question, not only merits attention but also requires serious scrutiny.
To study it, I used the Our World in Data [12], which, to my knowledge, is the most comprehensive database available on the research topic. Also, it is transparent, being openly and freely available for everyone, and finally, the data are coherent, making cross-country comparisons feasible over time.
Our World in Data [12] includes statistics on numerous countries worldwide, and of these, I included 39 in the analyses. These are the EU-member countries, plus Norway, Iceland, Switzerland, the UK, Montenegro, Canada, USA, Chile, Australia, New Zealand, South Korea, and Israel (where data were omitted after the war started on October 7, 2023). They have a population of over one billion people. The selection of countries was not random or due to cherry-picking. On the contrary, I selected among countries ranked “Very high” on the Human Development Index scale by the UN in 2019 [13], which indicates relatively good data quality. Belonging to the same ranking group also indicates relatively homogenous data. However, the most important selection criterion was that for these 39 countries, the database provided consistent data over time, enabling the assessment of the link between COVID-19 vaccination and excess mortality in a long-term perspective. All analyses in this study were weighted for each country’s population size.
I acknowledge that there can be other explanations than the COVID-19 vaccine for the consistent long-term excess mortality shown in the literature [9,10]. For example, delays and perhaps even cancellations in diagnosing and treatment are good candidates [14]. Others are, necessary or not, the long-term effects of the lockdowns on nutritional and mental health for numerous people worldwide [15,16,17]. However, I partly account for these alternative explanations by controlling for different governments’ stringency concerning lockdowns, a “composite measure based on 9 response indicators including school closures, workplace closures, and travel bans” [18]. Also, I control for the countries’ score on the UN's Human Development Index [13] as a proxy for the ability to cope with delays in diagnosing and treatment in the wake of the pandemic. Another important control variable is cumulated excess mortality. It accounts for mortality deficit [19] as high cumulated excess mortality may lead to lower subsequent mortality, and vice versa. Finally, I control for each country’s median age and population size. Overall, controlling for numerous alternative explanations, one can argue that ecological fallacy, a “failure in reasoning that arises when an inference is made about an individual based on aggregate data for a group” [20], related to the Simpson paradox [21], is not a major threat to the study’s internal validity, and I elaborate further on the issue in the Discussion.
Research by Watson and colleagues [22], cited more than 1700 times, has claimed that the COVID-19 vaccine saved up to 20 million lives worldwide in 2021, but the calculations on which the number is based have severe limitations and counter other statistics. First, their study [22] is counterfactually based on theoretical and mathematical models of assumed vaccine effect concerning transmission and case-fatality rates, not empirical data. We now know that the vaccine effect wanes after a short time [5], and Pfizer, “at the speed of science”, has admitted that they did not even test it against transmission [23]. Second, I cannot see that the study accounts for eventual vaccine side effects, which have been demonstrated [6,7,8]. Third, in 2020, when we did not have a vaccine, the excess mortality worldwide was about five million people [24]. Assuming that up to 20 million lives were saved in 2021, it is unreasonable to assume that less than five million lives would have been saved in 2020 if we had a vaccine. I.e., it would have induced negative excess mortality, which is rationally unlikely. Fourth, assuming that up to 20 million more people would have died in the absence of the COVID-19 vaccine would have induced an extreme acceleration in cumulative excess mortality worldwide. Thus, as the excess mortality worldwide in 2021 was about 10-11 million [24], assuming that up to 20 million lives were saved due to the vaccine, the excess mortality that year in its absence would have been up to 30 million. I.e., up to six times higher excess mortality than in the previous year. However, such a pattern does not align with the steady increase in mortality observed before and during the early vaccine rollout [25]. Specifically, from the middle of November 2020 and later, the accumulated excess mortality worldwide, excluding China, which the study by Watson and colleagues also did [22], shows a stable increase in cumulative excess deaths [25]. Moreover, the second and most severe wave of COVID-19 deaths peaked around January 25, 2021 [25], before the vaccine rollout could have had a substantial worldwide effect with 1.13 doses per hundred people [12]. Coining those observations with theoretically assuming a strong acceleration in mortality during 2021 absent of vaccination does not align with knowledge from previous virus pandemics, showing that the pattern abates after the second wave [26,27].
Based on the arguments, it is unlikely that the COVID-19 vaccine saved up to 20 million lives in 2021, as suggested by Watson and colleagues [22]. As their study is cited more than 1700 times, its claim instead appears to have become an urban legend. My criticism aligns with what this study will show concerning the COVID-19 vaccine’s limited, temporal protective effect and long-term detrimental effect as a consistent agent on all-cause mortality. Below, I further elaborate on the study’s methodology and present empirical results. In the final section, I discuss the findings, address the study’s limitations, and suggest avenues for future research.
Methods
I have noted that Our World in Data [12] was used to study this paper’s research question. It provided data on the independent variable, the dependent variables, and the control variables. Shortly, I will explain how the 39 countries I analysed were selected among those ranked “Very high” on the Human Development Index scale by the UN in 2019 [13].
Initially, I carried out weekly analyses. For some countries, Our World in Data [12] reported data on different weekdays, and to synchronize, I rounded them to the nearest Sunday. As I have noted, all analyses in this study were weighted for each country’s population size.
The independent variable, COVID-19 vaccination, is a country’s per capita doses. Specifically, the number of doses per 100 people. If the vaccination rate for a country in, for instance, week 10 was 50 and 56 in week 13, the vaccination rate in week 11 was estimated to be 52 and 54 in week 12 in case of missing observations. The last observation on the vaccination rate for a country was used in the remaining analyses.
The primary dependent variable for this study is all-cause excess mortality. It is defined as “the ratio of the actual number of a country’s deaths in a specific week to an estimate of the expected number of deaths in that same country in the same week minus one and multiplied by 100” [28] p. 2. In other words, all-cause excess mortality is measured in percent. If it takes the value of 20 in a specific week, it implies that 20 percent more people died than expected, i.e., 20 percent excess mortality. Our World in Data [12] used regression estimates on pre-COVID-19 calculations between 2015 and 2019, capturing linear and weekly trends as a baseline for the analyses. The approach accounts for “seasonal variation in mortality and a yearly trend over recent years due to changing population structure or socio-economic factors” [29] p. 14.
In some analyses, I also applied excess mortality, excluding COVID-19 deaths, as a dependent variable. I estimated (a) the concept by using (b) weekly changes in cumulative excess mortality per million, (c) the smoothed curve in COVID-19 deaths per million per week, and (d) the original measure of all-cause excess mortality in the following equation: a=d*(b–c)/b. My motive for using the variable was to assess whether the association between COVID-19 vaccination and excess mortality, excluding COVID-19 deaths, converged or diverged with the association between COVID-19 vaccination and all-cause excess mortality. Assuming that the association between COVID-19 vaccination and all-cause excess mortality in a given week was negative, it may indicate a preventive effect because fewer people tended to die the higher the uptake rate. However, if the association converged concerning COVID-19 vaccination and excess mortality excluding COVID-19 deaths, the genuine preventive effect was less likely as the vaccine inherently does not protect against deaths excluding COVID-19.
The control variables are the governments’ stringency concerning lockdowns, the countries’ score on the UN’s Human Development Index, the cumulated excess mortality, each country’s median age, and population size. I explained the motive for the control variables in the Introduction and will apply them in the concluding analyses.
Results
Descriptive Statistics
Figure 1 shows some descriptive statistics. The red line shows COVID-19 vaccination doses per 100, with a one-week lag for all 39 countries included in the analyses. The vertical line marks the time when vaccine rollout roughly levelled off around March 6, 2022, i.e., the subsequent change with a one-week lag was less than one percent (except for one week later when the increase was just over one percent). The green line shows cumulated all-cause excess mortality, and it is worth noting that it continued to increase after the vaccination rollout levelled off and a decrease in COVID-19 deaths, which the blue line shows. Unnatural changes at the end concerning COVID-19 vaccination and all-cause cumulated excess mortality are due to missing data for some countries in certain weeks.
Regression Analyses I
Figure 2 shows weekly associations with 95 percent confidence intervals between log-transformed COVID-19 vaccination doses per 100 and all-cause excess mortality in the 39 countries from January 10, 2021, to the end of 2023 (for other countries among those ranked “Very high” on the Human Development Index scale by the UN in 2019, there were no data to be included in the analyses I present in Figure 2). The vaccination rate was included with a one-week lag (I also replicated the analyses with two- and four-week lags without altering any substantial conclusion). Log-transformation of vaccination rate provides better information about changes during rollout. For example, changes from 10 to 10.1 and 100 to 101 both give a one percent increase in vaccination rate. Log transformation also reduces problems with multicollinearity. Concerning interpretation, log transformation implies that if the y-axis shows –50, for example, a one percent increase in vaccination rate is associated with approximately .5 percent reduction in mortality [30].
I used robust regression with cluster-adjusted error terms, i.e., the method allows for dependence between error terms within countries. This is relevant since the same countries were included over time. The analysis includes interaction terms between the vaccination rate and the dummy time variable. Although multicollinearity cannot be ruled out, separate weekly measurements gave the same conclusion as Figure 2 shows. All analyses were done in Stata 17 [31]. The red horizontal line has been included to highlight values above and below zero. The red vertical line shows the point in time when vaccine rollout roughly levelled off around March 6, 2022, cf. my explanation above.
At the beginning of the vaccine rollout, where the older and comorbid were prioritized, Figure 2 shows higher mortality in countries with more doses per capita. The trend is consistent with a Norwegian study concluding that for nursing home residents, the vaccine “may in a few cases have contributed to accelerating an ongoing death process” [32] p. 3 - my translation.
From around the latter half of 2021 and the beginning of 2022, Figure 2 shows that all-cause excess mortality was markedly and significantly lower the higher the vaccination rate, which may indicate a protective effect. However, Figure 3, which adds data that exclude COVID-19 deaths, highlighted in purple, shows a fairly large coincidence with all-cause excess mortality (also here, I replicated the analyses with two- and four-week lags without altering any substantial conclusion). Since the vaccine does not protect against deaths that exclude COVID-19, I conclude that negative associations in the relevant period largely cannot be attributed to the vaccine. Nonetheless, the negative association is somewhat less for mortality that excludes COVID-19 and may accordingly indicate some temporary protection.
During two weeks, the association between vaccination rate and excess mortality, excluding COVID-19 deaths, gave large negative results. The reason is follow-up reporting of COVID-19 deaths and cumulative all-cause excess mortality in some weeks. Absent this, the possible temporary vaccine protection I have alluded to would have shown a lower magnitude.
From around March 6, 2022, marked by the vertical line, i.e., when the COVID-19 vaccine rollout roughly leveled off, we consistently observe a positive association between vaccination rate and excess mortality, significant in most weeks. The picture is the same for all-cause excess mortality and excess mortality, excluding COVID-19 deaths. This period is the subject of analyses that I will explain below.
Regression Analyses II
Figure 4A shows the association between average all-cause excess mortality and average COVID-19 vaccination doses per 100 with a one-week lag from March 6, 2022, to the end of 2023. The average COVID-19 vaccination doses per 100 is log-transformed using the natural logarithm. Figure 4A also shows the countries’ data plots, and the circles illustrate their population size. The data plots and the fitted line marked in red indicate a strong positive association, i.e., the higher the vaccination rate, the higher the all-cause excess mortality. Model A1 in Table 1 reports statistical details and shows that the vaccination rate explains almost 55 percent of the variation in all-cause excess mortality. Also, a beta-value of .739, reported in brackets, is high, and the regression coefficient is strongly significant (<.001).
Model A2, Table 1, includes the control variables stringency concerning lockdowns with a one-week lag, score on the UN's Human Development Index [13] as a proxy for the ability to cope with delays in diagnosing and treatment in the wake of the pandemic, cumulated excess mortality with a one week lag to account for mortality deficit [19], median age, and population size. I also took the averages of the control variables, and population size was finally log-transformed as, for instance, an increase of 10,000 people matters more in a small country than in a large one. Model A2 shows that no statistical conclusion is altered concerning the association between average all-cause excess mortality and average COVID-19 vaccination doses per 100 (Model A2 has only 38 observations as Montenegro during the period did not report data on stringency concerning lockdowns.)
The variables included in Model A3 were generated by stepwise regression, where a criterion for inclusion was a p-value lower than .1 (shortly, I will address the control variables). The variance inflation factor (VIF) concerning the independent variable COVID-19 vaccination takes a value of 1.51 in Model A3, which indicates that multicollinearity is not a problem (33).
Figure 4B is similar to Figure 4A, except the average COVID-19 vaccination doses per 100 variable is not log-transformed. The pattern in both figures is similar, illustrating a consistent association between average all-cause excess mortality and average COVID-19 vaccination doses per 100 with a one-week lag from March 6, 2022, to the end of 2023. Model B1 in Table 1 reports statistical details and shows even better results when the average COVID-19 vaccination doses per 100 is not log-transformed.
Model B2 includes the control variables, and Model B3 retains the parameters with p-values lower than .1 after stepwise regression. In those models, no conclusion is altered concerning the association between average all-cause excess mortality and average COVID-19 vaccination doses per 100. The variance inflation factor (VIF) concerning the independent variable COVID-19 vaccination takes a value of 1.27 in Model B3, which indicates that multicollinearity is not a problem [33].
The human development index control variable was significantly positive in both Models A3 and B3. The results imply that all-cause excess mortality has tended to be relatively high in countries scoring relatively high on the UN’s development index [13]. The result may be unintuitive as it indicates that human development issues explain increased all-cause excess mortality, which requires further investigation in future research. The median age control variable was significantly positive in Model A3, which indicates that the all-cause excess mortality has tended to be relatively high in countries with relatively old populations. The population size control variable was significantly negative in Model B3, which indicates that large countries have coped better with reducing all-cause mortality than small countries.
Discussion
Analysing 39 high-income countries, I found in this study that from the last half of 2021 to February-March 2022, all-cause mortality was relatively low in countries with relatively high COVID-19 vaccination rates (Figure 2). Similar findings were reported by Matveeva and Shabalina [4], and my findings further align with other research showing that COVID-19 vaccination can reduce mortality [1,2,3]. However, during the same period, mortality excluding COVID-19 deaths showed a similar pattern as all-cause mortality (Figure 3). That is, similar to all-cause mortality, mortality excluding COVID-19 deaths was also relatively low in countries with high COVID-19 vaccination rates, which counters the assumption of genuine protection. The reason is that the vaccine cannot protect against deaths that exclude COVID-19. Having said that, the pattern was somewhat less marked for mortality that excludes COVID-19 compared to all-cause mortality and may accordingly indicate some temporary genuine protection.
At the very beginning of the vaccine rollout, where the elderly and comorbid were prioritized, there was higher mortality in countries that had given more doses (Figure 2). The trend is consistent with a Norwegian study concluding that for nursing home residents, the vaccine “may in a few cases have contributed to accelerating an ongoing death process” [32] p. 3 - my translation. Another issue explaining the finding is that early batches induced many side effects [34,35].
From February-March 2022 to the end of 2023, the association between COVID-19 vaccination and all-cause excess mortality was consistently positively significant (Figure 2). The association between the countries’ averages from that period shows a similar picture (Figure 4 and Table 1, Models A1 and B1), which implies that the all-cause excess mortality was relatively high in countries with relatively high COVID-19 vaccination rates. The association also remained robust when controlling for alternative explanations (Table 1, Models A2, A3, B2, and B3. The long-term detrimental effects of the COVID-19 vaccine align with other research showing waning protection against mortality [5] and side effects [6,7,8]. Finally, the study’s findings may explain the consistent excess mortality reported in the literature [9,10] after COVID-19 deaths have peaked [10].
To my knowledge, this is the first study investigating the association between national-level COVID-19 vaccination and excess mortality spanning a time window of almost three years. The study adds insight to understanding the dynamics between those crucial concepts and how they change over time. Observing how the COVID-19 vaccine protects a limited period, which subsequently appears to induce a detrimental effect inducing increased mortality, merits attention, in my opinion.
Limitations and Future Research
Ideally, assessing how COVID-19 vaccination affected long-term mortality should have been carried out in double-blinded experimental designs, but to my knowledge, such research was unblinded after a relatively short time [7], making the approach impossible for follow-up studies. Therefore, without such data, I argue that this study’s approach represents the second-best option.
Nonetheless, the perhaps most likely inquiry against this study is that a national level of analysis may imply ecological fallacy, a “failure in reasoning that arises when an inference is made about an individual based on aggregate data for a group” [20], related to the Simpson paradox [21]. The limitations hinge on potential cross-level-, or omitted variable bias (36), i.e., a “difference between the expectation of an estimator from an ecological [e.g., nation-level] study and the individual-level parameter of interest” [37] p. 2, but the inclusion of relevant control variables in this study, accounts for the issue. Hence, I argue that ecological fallacy or the Simpson paradox are not major threats to internal validity, and Aarstad and Kvitastein [38] discuss the issue in detail. Moreover, the major dependent variable, all-cause excess mortality, was measured consistently using the same methodology across countries over time. Specifically, the data were measured compared to each country’s baseline numbers before the pandemic and were also seasonally adjusted [12,29]. Related to this, the independent variable and the control variables were also measured consistently across countries and across time, which further strengthens the study’s validity, I argue.
Moreover, as this study aimed to identify carriers of excess mortality, in its very nature, the level of analysis must be at an aggregate, e.g., national, level. Thus, researching excess mortality at a personal level is inherently impossible.
Nonetheless, I recommend future research to distinguish between different types of COVID-19 vaccines used on different individuals or groups of individuals as their profile concerning eventual preventive and side effects may vary. For instance, Norway suspended the AstraZeneca vaccine as early as May 2021 due to severe side effects reported [39].
Similarly, I encourage future research to distinguish how doses have been distributed across the population. For instance, a country may have had a high uptake, but the doses are concentrated on a relatively small percentage of the population, while another country may have had a low uptake, but the doses are relatively evenly distributed across the population. A limitation in my study is that it did not capture such eventual differences in vaccine distribution, which I encourage future research to investigate. Finally, research should aim to study how vaccination rates for different age groups may affect mortality among them differently.
References
- Lopez-Doriga Ruiz, P.; Gunnes, N.; Michael Gran, J.; Karlstad, Ø.; Selmer, R.; Dahl, J.; et al. Short-term safety of COVID-19 mRNA vaccines with respect to all-cause mortality in the older population in Norway. Vaccine. 2023, 41, 323–32. [Google Scholar] [CrossRef] [PubMed]
- Haas, E.J.; Angulo, F.J.; McLaughlin, J.M.; Anis, E.; Singer, S.R.; Khan, F.; et al. Impact and effectiveness of mRNA BNT162b2 vaccine against SARS-CoV-2 infections and COVID-19 cases, hospitalisations, and deaths following a nationwide vaccination campaign in Israel: an observational study using national surveillance data. Lancet. 2021, 397, 1819–29. [Google Scholar] [CrossRef] [PubMed]
- Bernal, J.L.; Andrews, N.; Gower, C.; Robertson, C.; Stowe, J.; Tessier, E.; et al. Effectiveness of the Pfizer-BioNTech and Oxford-AstraZeneca vaccines on covid-19 related symptoms, hospital admissions, and mortality in older adults in England: test negative case-control study. Bmj-British Medical Journal 2021, 373. [Google Scholar]
- Matveeva, O.; Shabalina, S.A. Comparison of vaccination and booster rates and their impact on excess mortality during the COVID-19 pandemic in European countries. Frontiers in Immunology. 2023, 14. [Google Scholar] [CrossRef]
- Nordstrom, P.; Ballin, M.; Nordstrom, A. Risk of infection, hospitalisation, and death up to 9 months after a second dose of COVID-19 vaccine: a retrospective, total population cohort study in Sweden. Lancet. 2022, 399, 814–23. [Google Scholar] [CrossRef]
- Faksova, K.; Walsh, D.; Jiang, Y.; Griffin, J.; Phillips, A.; Gentile, A.; et al. COVID-19 vaccines and adverse events of special interest: A multinational Global Vaccine Data Network (GVDN) cohort study of 99 million vaccinated individuals. Vaccine. 2024, 42, 2200–11. [Google Scholar] [CrossRef]
- Fraiman, J.; Erviti, J.; Jones, M.; Greenland, S.; Whelan, P.; Kaplan, R.M.; Doshi, P. Serious adverse events of special interest following mRNA COVID-19 vaccination in randomized trials in adults. Vaccine. 2022, 40, 5798–805. [Google Scholar] [CrossRef]
- Bhattacharjee, B.; Lu, P.; Monteiro, V.S.; Tabachnikova, A.; Wang, K.; Hooper, W.B.; et al. Immunological and Antigenic Signatures Associated with Chronic Illnesses after COVID-19 Vaccination. medRxiv, 2025; 2025.02.18.25322379. [Google Scholar]
- Ganan, D.; Paul, L.C.C.; Shuhei, N.; Chris Fook Sheng, N.; Nasif, H.; Akifumi, E.; Masahiro, H. Excess mortality during and after the COVID-19 emergency in Japan: a two-stage interrupted time-series design. BMJ Public Health. 2025, 3, e002357. [Google Scholar]
- Mostert, S.; Hoogland, M.; Huibers, M.; Kaspers, G. Excess mortality across countries in the Western World since the COVID-19 pandemic: 'Our World in Data' estimates of January 2020 to December 2022. BMJ Public Health. 2024, 2, e000282. [Google Scholar] [CrossRef]
- Kasper, P.K.; Ioana, C.; Taulant, M.; John, P.A.I. COVID-19 advocacy bias in the BMJ: meta-research evaluation. BMJ Open Quality. 2025, 14, e003131. [Google Scholar]
- Our World in Data. Coronavirus (COVID-19) Vaccinations 2024 [Available from: https://ourworldindata.org/covid-vaccinations.
- Conceição, P. Human development report 2020-the next frontier: Human development and the anthropocene. United Nations Development Programme: Human Development Report. 2020.
- Arahirwa, V.; Tyrlik, K.; Abernathy, H.; Cassidy, C.; Alejo, A.; Mansour, O.; et al. Impact of the COVID-19 pandemic on delays in diagnosis and treatment of tick-borne diseases endemic to southeastern USA. Parasites & Vectors. 2023, 16, 295. [Google Scholar]
- Liu, Y.; Ren, Y.; Liu, C.; Chen, X.; Li, D.; Peng, J.; et al. Global burden of mental disorders in children and adolescents before and during the COVID-19 pandemic: evidence from the Global Burden of Disease Study 2021. Psychological Medicine. 2025, 55, e90. [Google Scholar] [CrossRef] [PubMed]
- Rezaul Karim, K.M.; Tasnim, T. Impact of lockdown due to COVID-19 on nutrition and food security of the selected low-income households in Bangladesh. Heliyon. 2022, 8, e09368. [Google Scholar] [CrossRef]
- Dasgupta, S.; Robinson, E.J.Z. Impact of COVID-19 on food insecurity using multiple waves of high frequency household surveys. Scientific Reports. 2022, 12, 1865. [Google Scholar] [CrossRef] [PubMed]
- Our World in Data. Data on COVID-19 (coronavirus) by Our World in Data 2024 [Available from: https://github.com/owid/covid-19-data/tree/master/public/data.
- Pizzato, M.; Gerli, A.G.; La Vecchia, C.; Alicandro, G. Impact of COVID-19 on total excess mortality and geographic disparities in Europe, 2020–, 2023: a spatio-temporal analysis. The Lancet Regional Health – Europe. 2024, 44.
- Hsieh, J.J. Encyclopedia Britannica. Ecological fallacy 2017, September 4 [Available from: https://www.britannica.com/science/ecological-fallacy.
- Wagner, C.H. Simpson's Paradox in Real Life. The American Statistician. 1982, 36, 46–8. [Google Scholar] [CrossRef]
- Watson, O.J.; Barnsley, G.; Toor, J.; Hogan, A.B.; Winskill, P.; Ghani, A.C. Global impact of the first year of COVID-19 vaccination: a mathematical modelling study. The Lancet Infectious Diseases. 2022. [CrossRef]
- Goldin, M.; Fichera, A. Posts mislead on Pfizer COVID vaccine’s impact on transmission. Associated Press (AP) News. 2022 October 14.
- Our World in Data. Deaths, 1950 to 2023 2024 [Available from: https://ourworldindata.org/explorers/population-and-demography?indicator=Deaths&Sex=Both+sexes&Age=Total&Projection+scenario=None&country=OWID_WRL~CHN.
- Our World in Data. Coronavirus (COVID-19) Deaths 2024 [Available from: https://ourworldindata.org/covid-deaths.
- Taubenberger, J.K.; Morens, D.M. 1918 Influenza: the mother of all pandemics. Revista Biomedica. 2006, 17, 69–79. [Google Scholar] [CrossRef]
- Viboud, C.; Simonsen, L.; Fuentes, R.; Flores, J.; Miller, M.A.; Chowell, G. Global Mortality Impact of the 1957-1959 Influenza Pandemic. J Infect Dis. 2016, 213, 738–45. [Google Scholar] [CrossRef]
- Aarstad, J. Were the 2022 Summer Heatwaves a Strong Cause of Europe’s Excess Deaths? Climate. 2024, 12, 69. [Google Scholar] [CrossRef]
- Karlinsky, A.; Kobak, D. Tracking excess mortality across countries during the COVID-19 pandemic with the World Mortality Dataset. eLife. 2021, 10, e69336. [Google Scholar] [CrossRef]
- Yang, J. Interpreting regression coefficients for log-transformed variables. Cornell Statistical Consulting Unit. 2020, 83. [Google Scholar]
- StataCorp. Version 17. College Station, TX StataCorp LP; 2021.
- Wyller, T.B.; Kittang, B.R.; Ranhoff, A.H.; Harg, P.; Myrstad, M. Dødsfall i sykehjem etter covid-19-vaksine. Tidsskrift for Den norske legeforening. 2021, 141, 1–8. [Google Scholar] [CrossRef] [PubMed]
- O'Brien, R.M. A caution regarding rules of thumb for variance inflation factors. Qual Quant. 2007, 41, 673–90. [Google Scholar] [CrossRef]
- Manniche, V.; Schmeling, M.; Gilthorpe, J.D.; Hansen, P.R. Reports of Batch-Dependent Suspected Adverse Events of the BNT162b2 mRNA COVID-19 Vaccine: Comparison of Results from Denmark and Sweden. Medicina (Kaunas) 2024, 60. [Google Scholar] [CrossRef]
- Schmeling, M.; Manniche, V.; Hansen, P.R. Batch-dependent safety of the BNT162b2 mRNA COVID-19 vaccine. European Journal of Clinical Investigation. 2023, 53, e13998. [Google Scholar] [CrossRef]
- Rothman, K.J. A pictorial representation of confounding in epidemiolog1c studies. Journal of Chronic Diseases. 1975, 28, 101–8. [Google Scholar] [CrossRef]
- Loney, T.; Nagelkerke, N.J. The individualistic fallacy, ecological studies and instrumental variables: a causal interpretation. Emerging Themes in Epidemiology. 2014, 11, 18. [Google Scholar] [CrossRef]
- Aarstad, J.; Kvitastein, O.A. Is There a Link between the 2021 COVID-19 Vaccination Uptake in Europe and 2022 Excess All-Cause Mortality? Asian Pacific Journal of Health Sciences. 2023, 10, 25–31. [Google Scholar] [CrossRef]
- Solsvik, T.; Adomaitis, N. Norway drops AstraZeneca vaccine, J&J remains on hold. Reuters. 2021 May 12.
Figure 1.
Descriptive statistics.
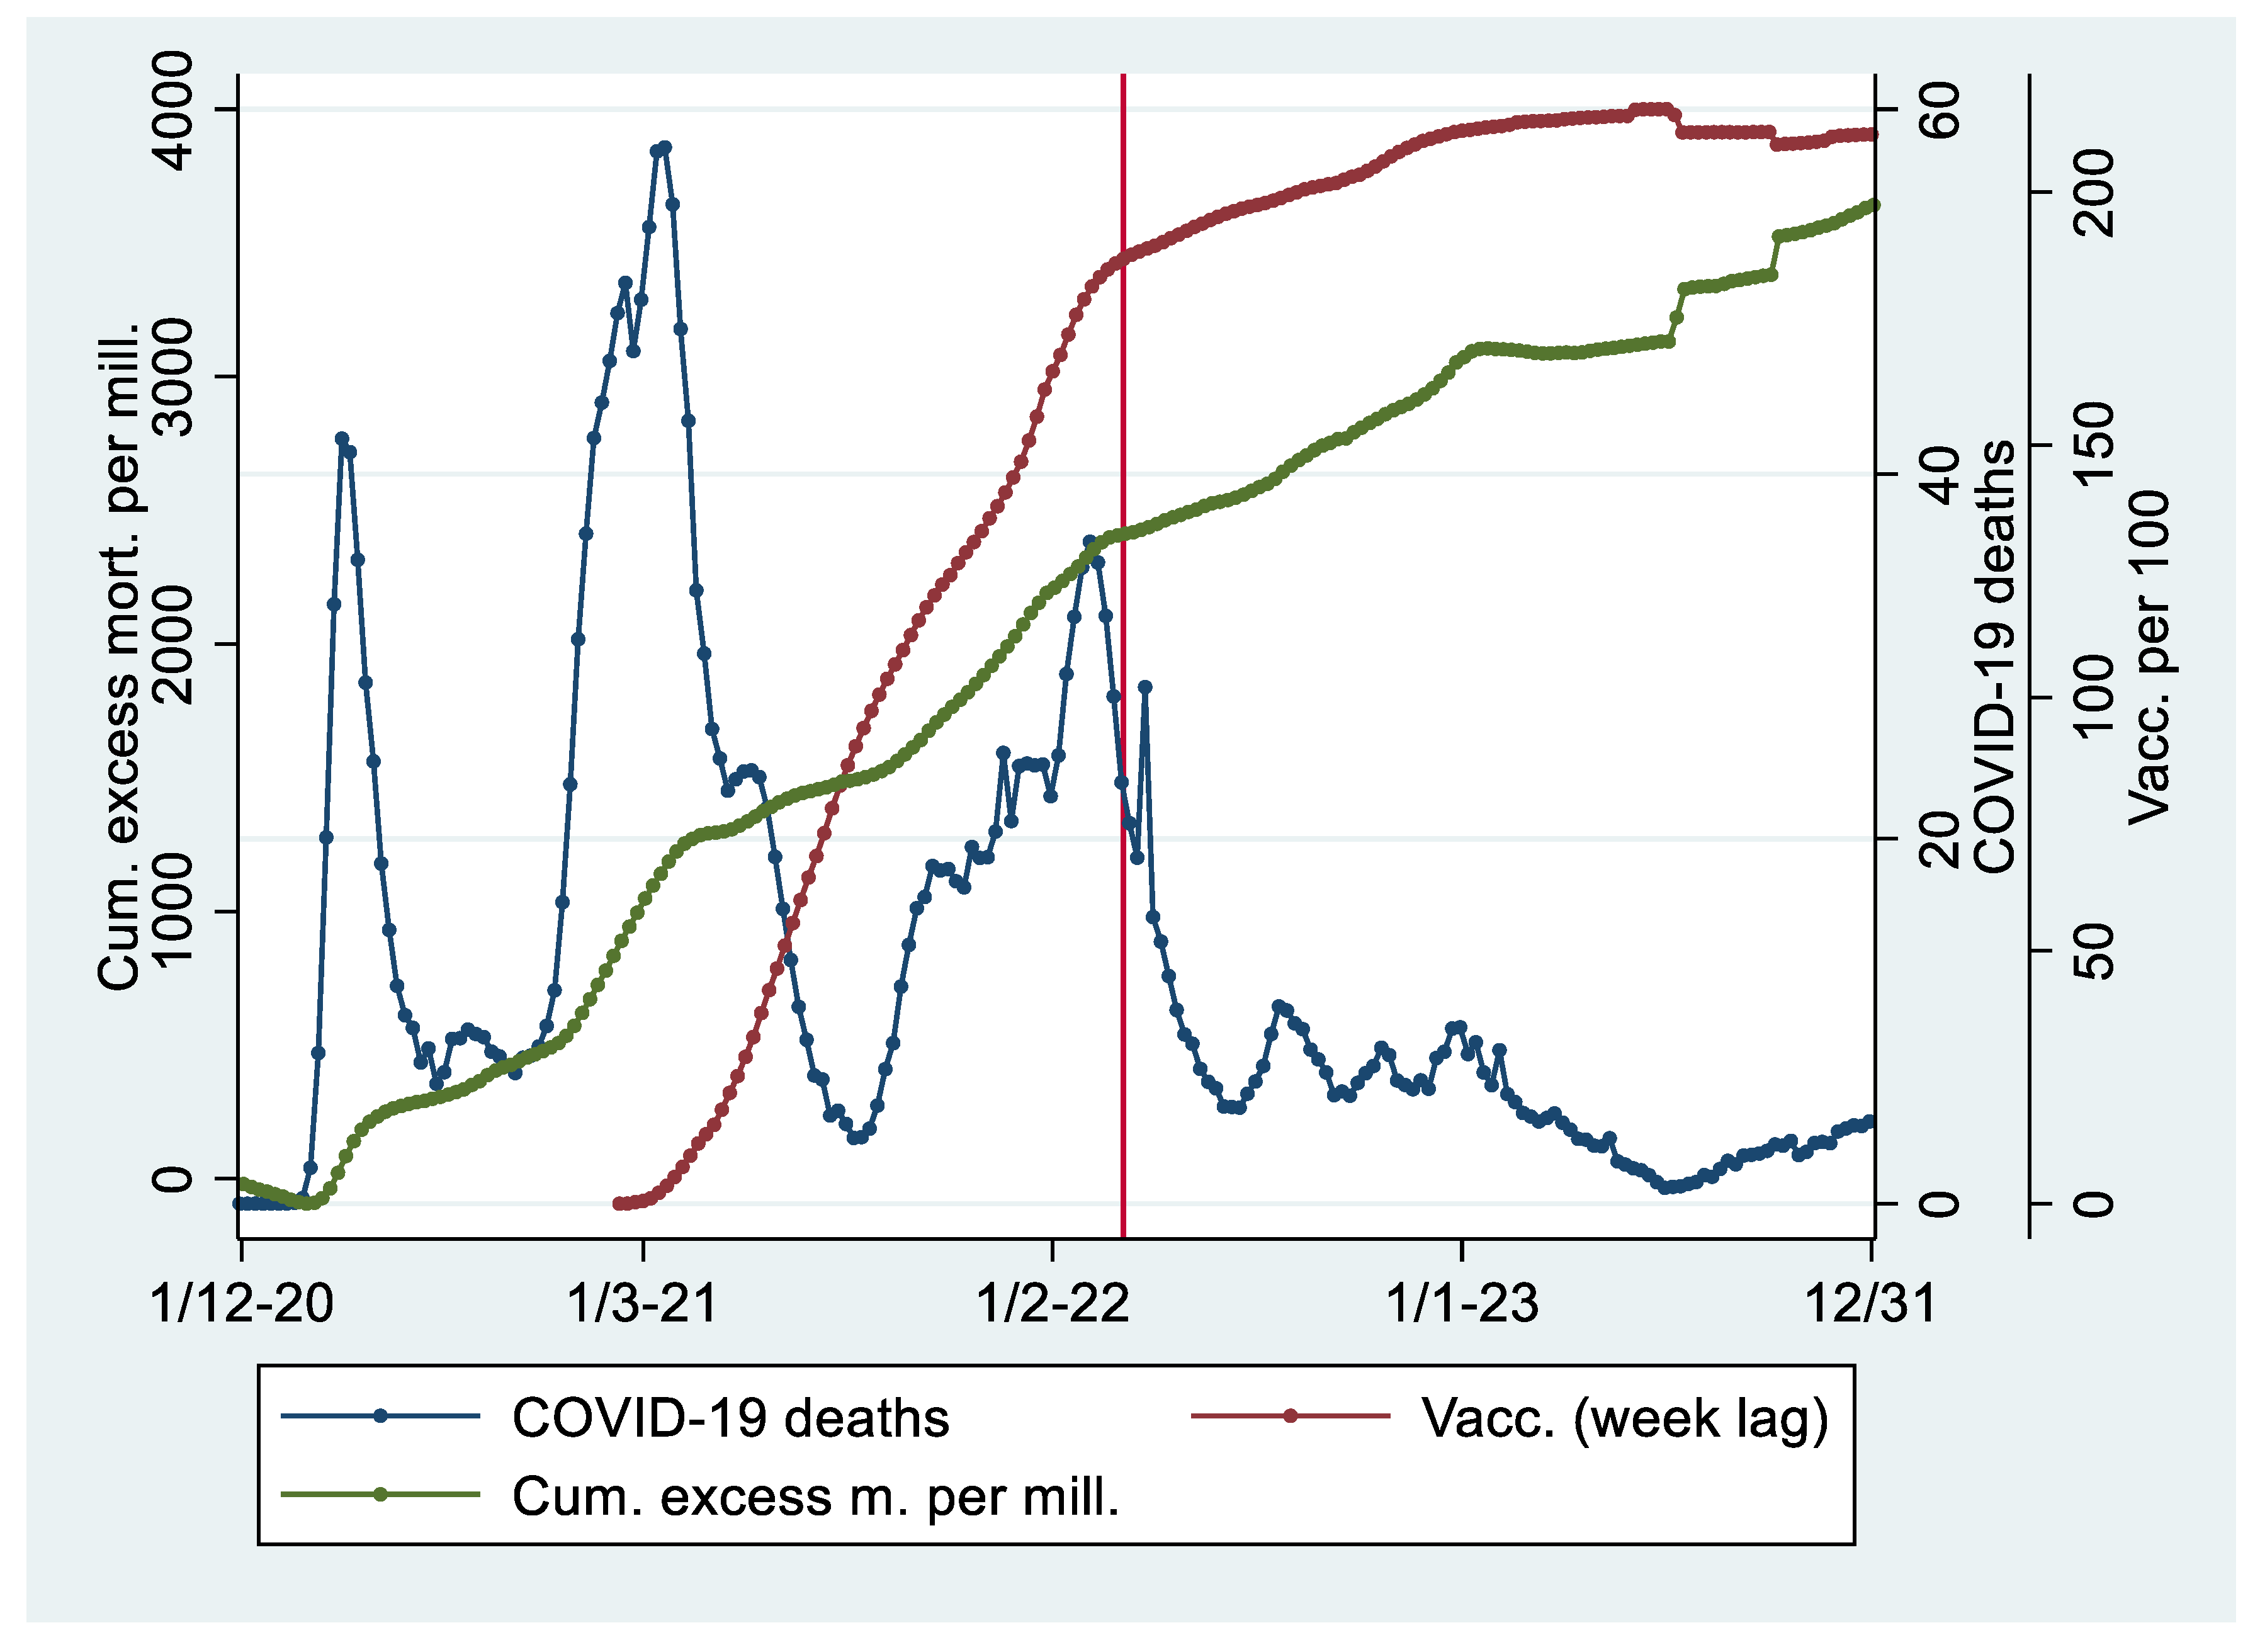
Figure 2.
Regression analysis with 95 percent confidence intervals showing weekly associations between COVID-19 vaccination doses per 100 (log-transformed using the natural logarithm with one week lag) and all-cause excess mortality. The analysis is weighted for population size.
Figure 2.
Regression analysis with 95 percent confidence intervals showing weekly associations between COVID-19 vaccination doses per 100 (log-transformed using the natural logarithm with one week lag) and all-cause excess mortality. The analysis is weighted for population size.
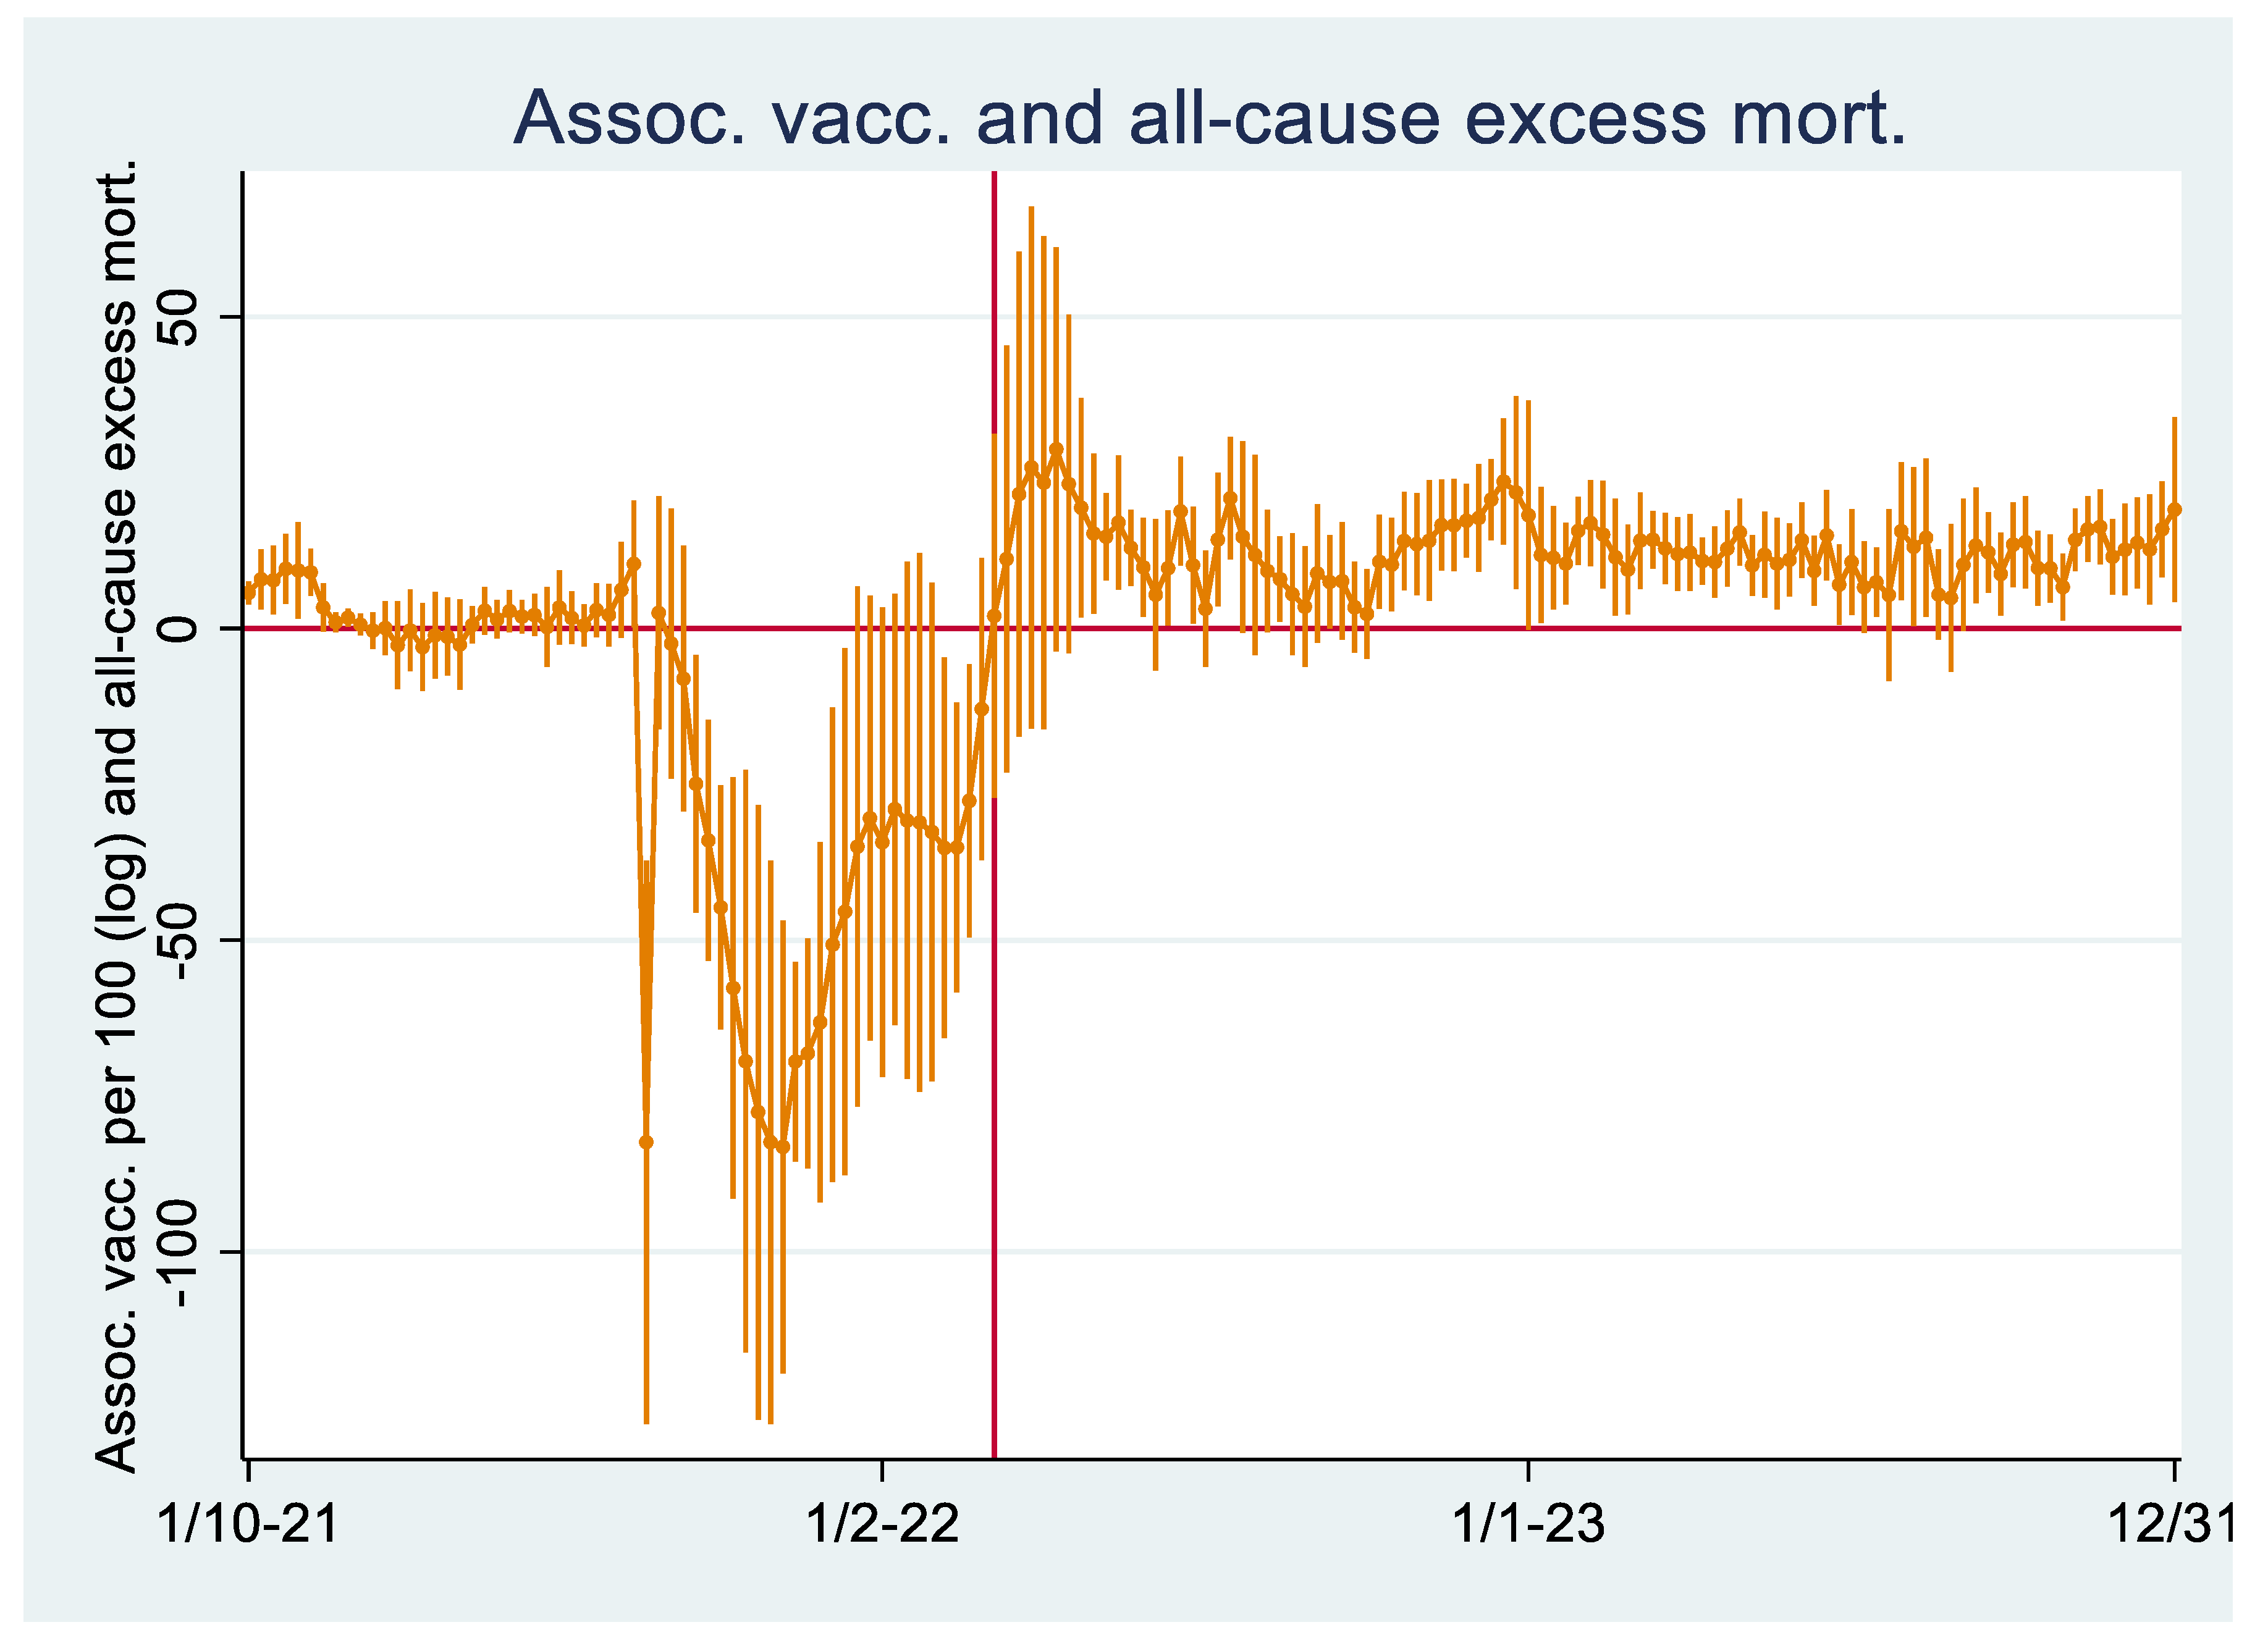
Figure 3.
Regression analysis with 95 percent confidence intervals showing weekly associations between COVID-19 vaccination doses per 100 (log-transformed using the natural logarithm with one week lag) and excess mortality. All-cause excess mortality is reported in orange colour, and excess mortality excluding COVID-19 deaths is reported in purple colour. The analyses are weighted for population size.
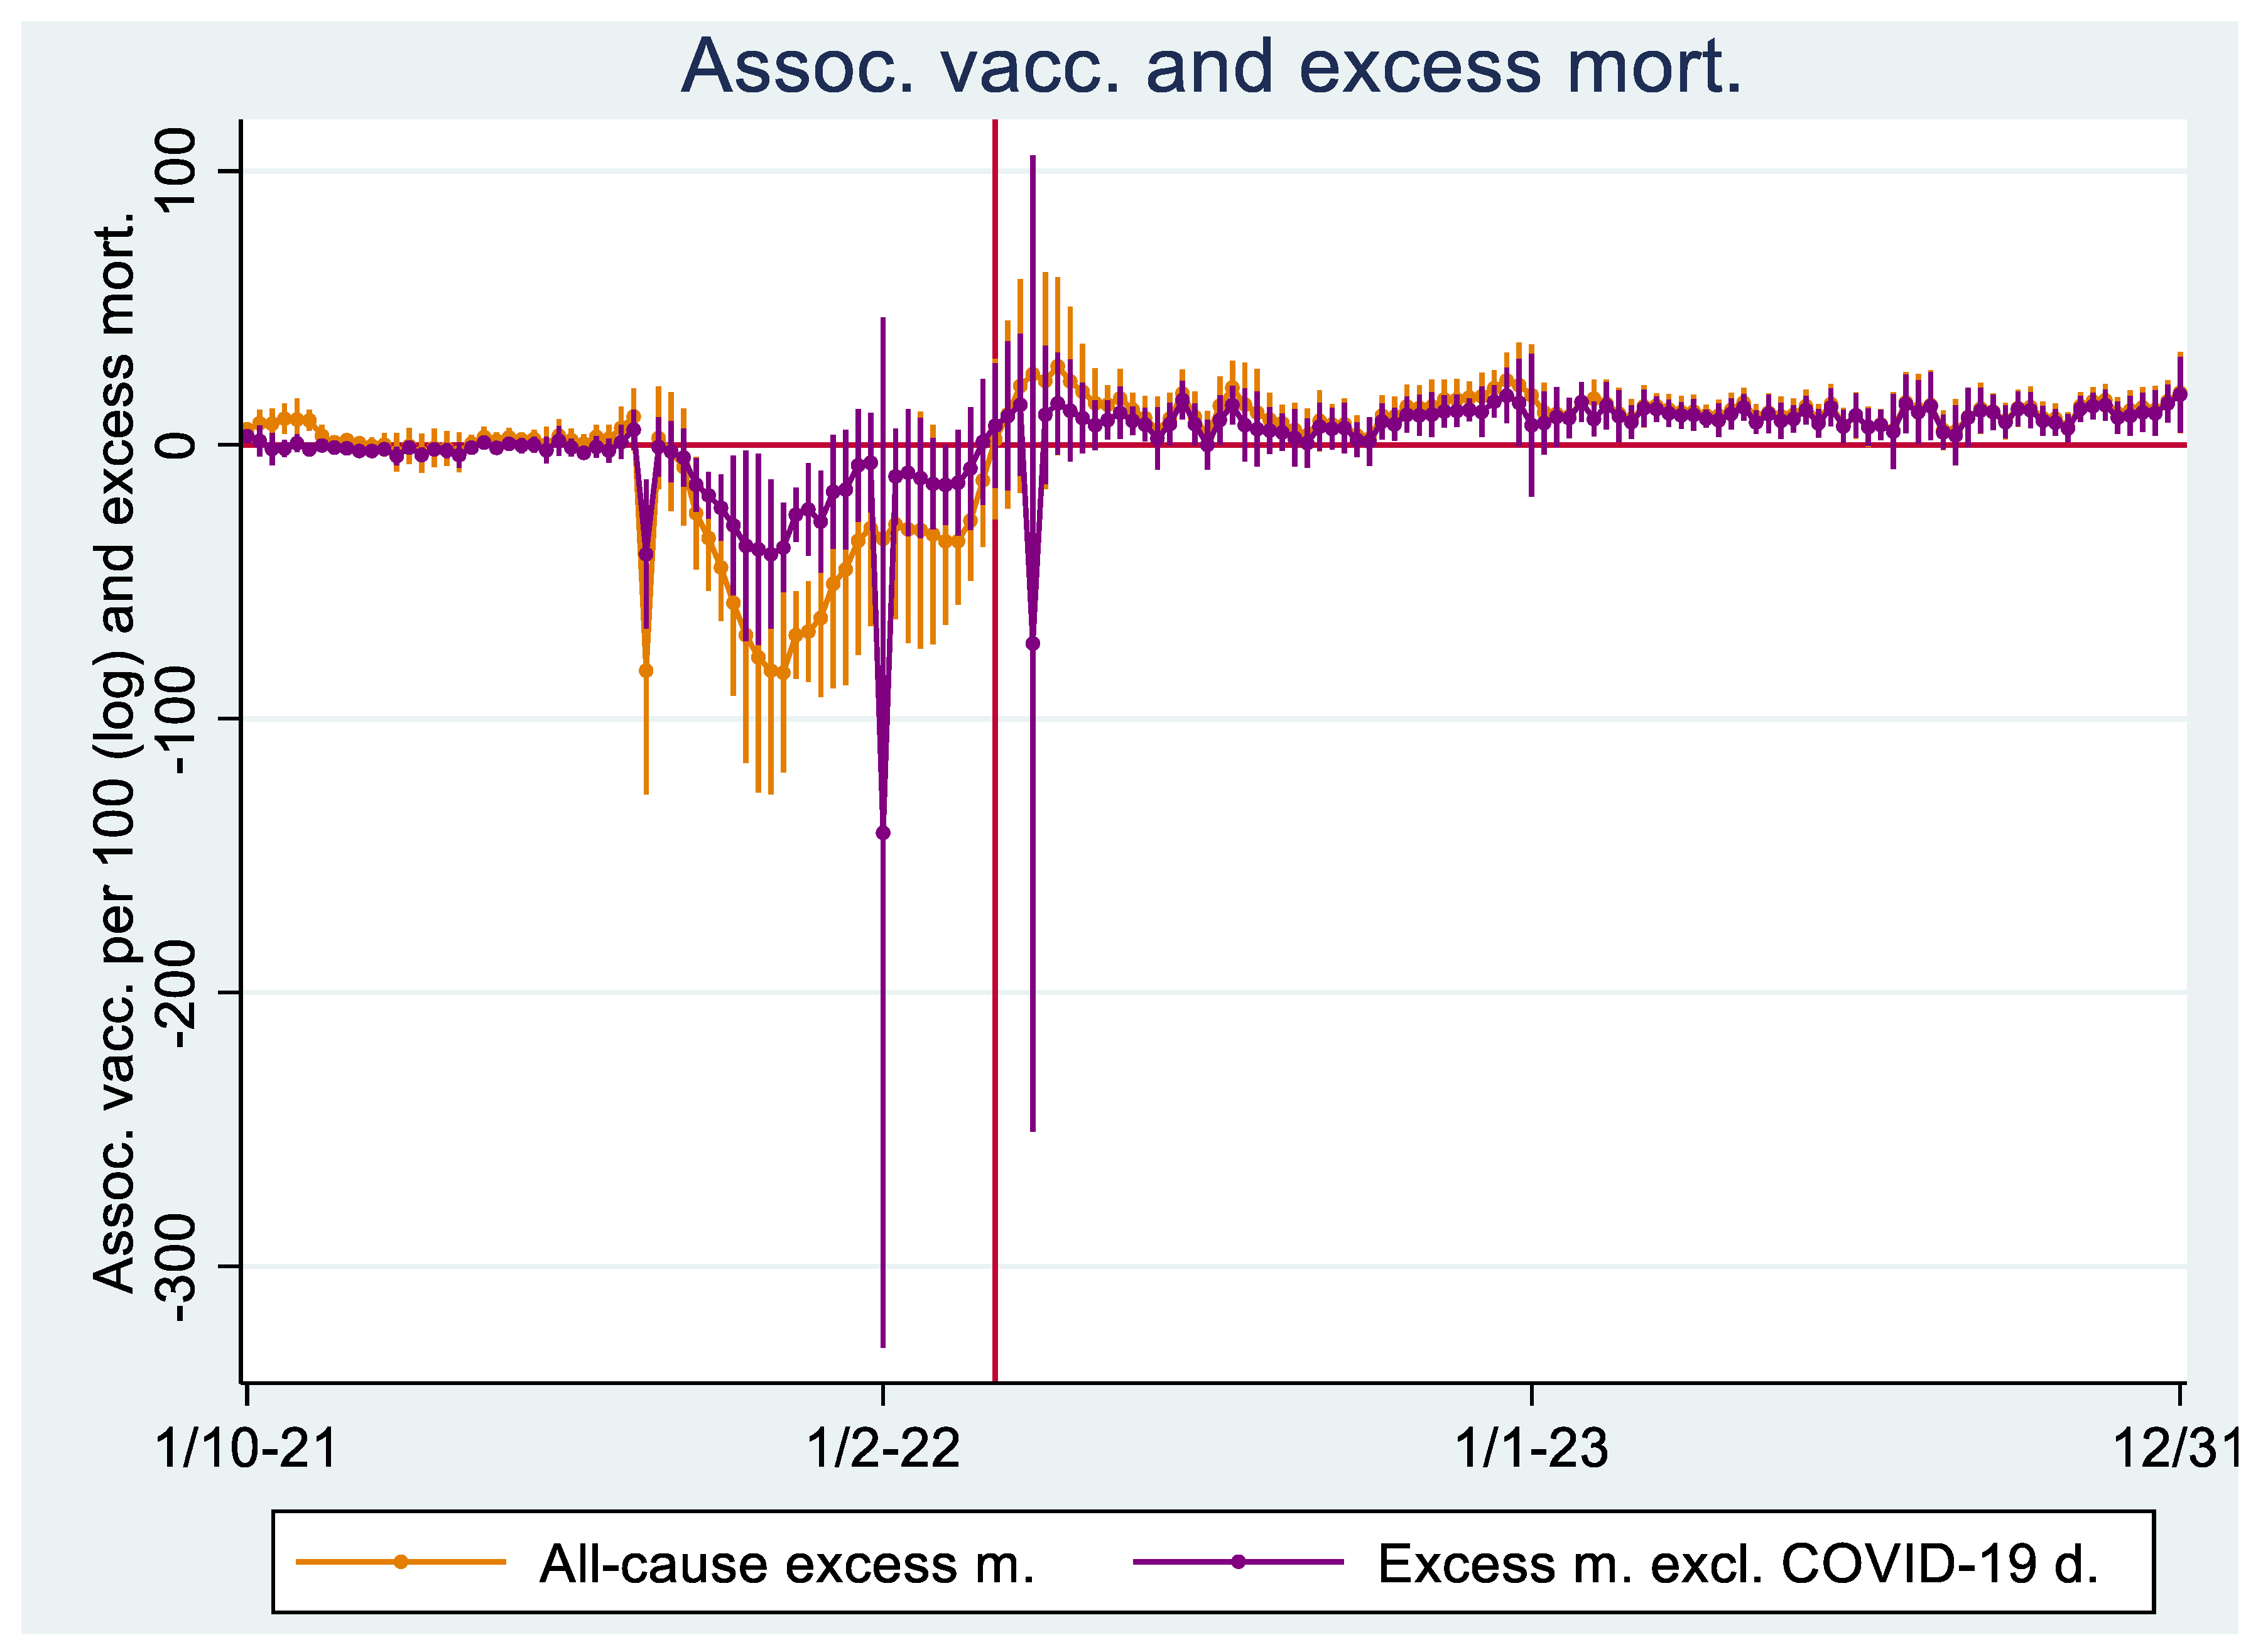
Figure 4.
A: Association between average all-cause excess mortality and average COVID-19 vaccination doses per 100 with one week lag from March 6, 2022, to the end of 2023. The average COVID-19 vaccination doses per 100 is log-transformed using the natural logarithm. B: Similar, except that average COVID-19 vaccination doses per 100 is not log-transformed. The analyses are weighted for population size.
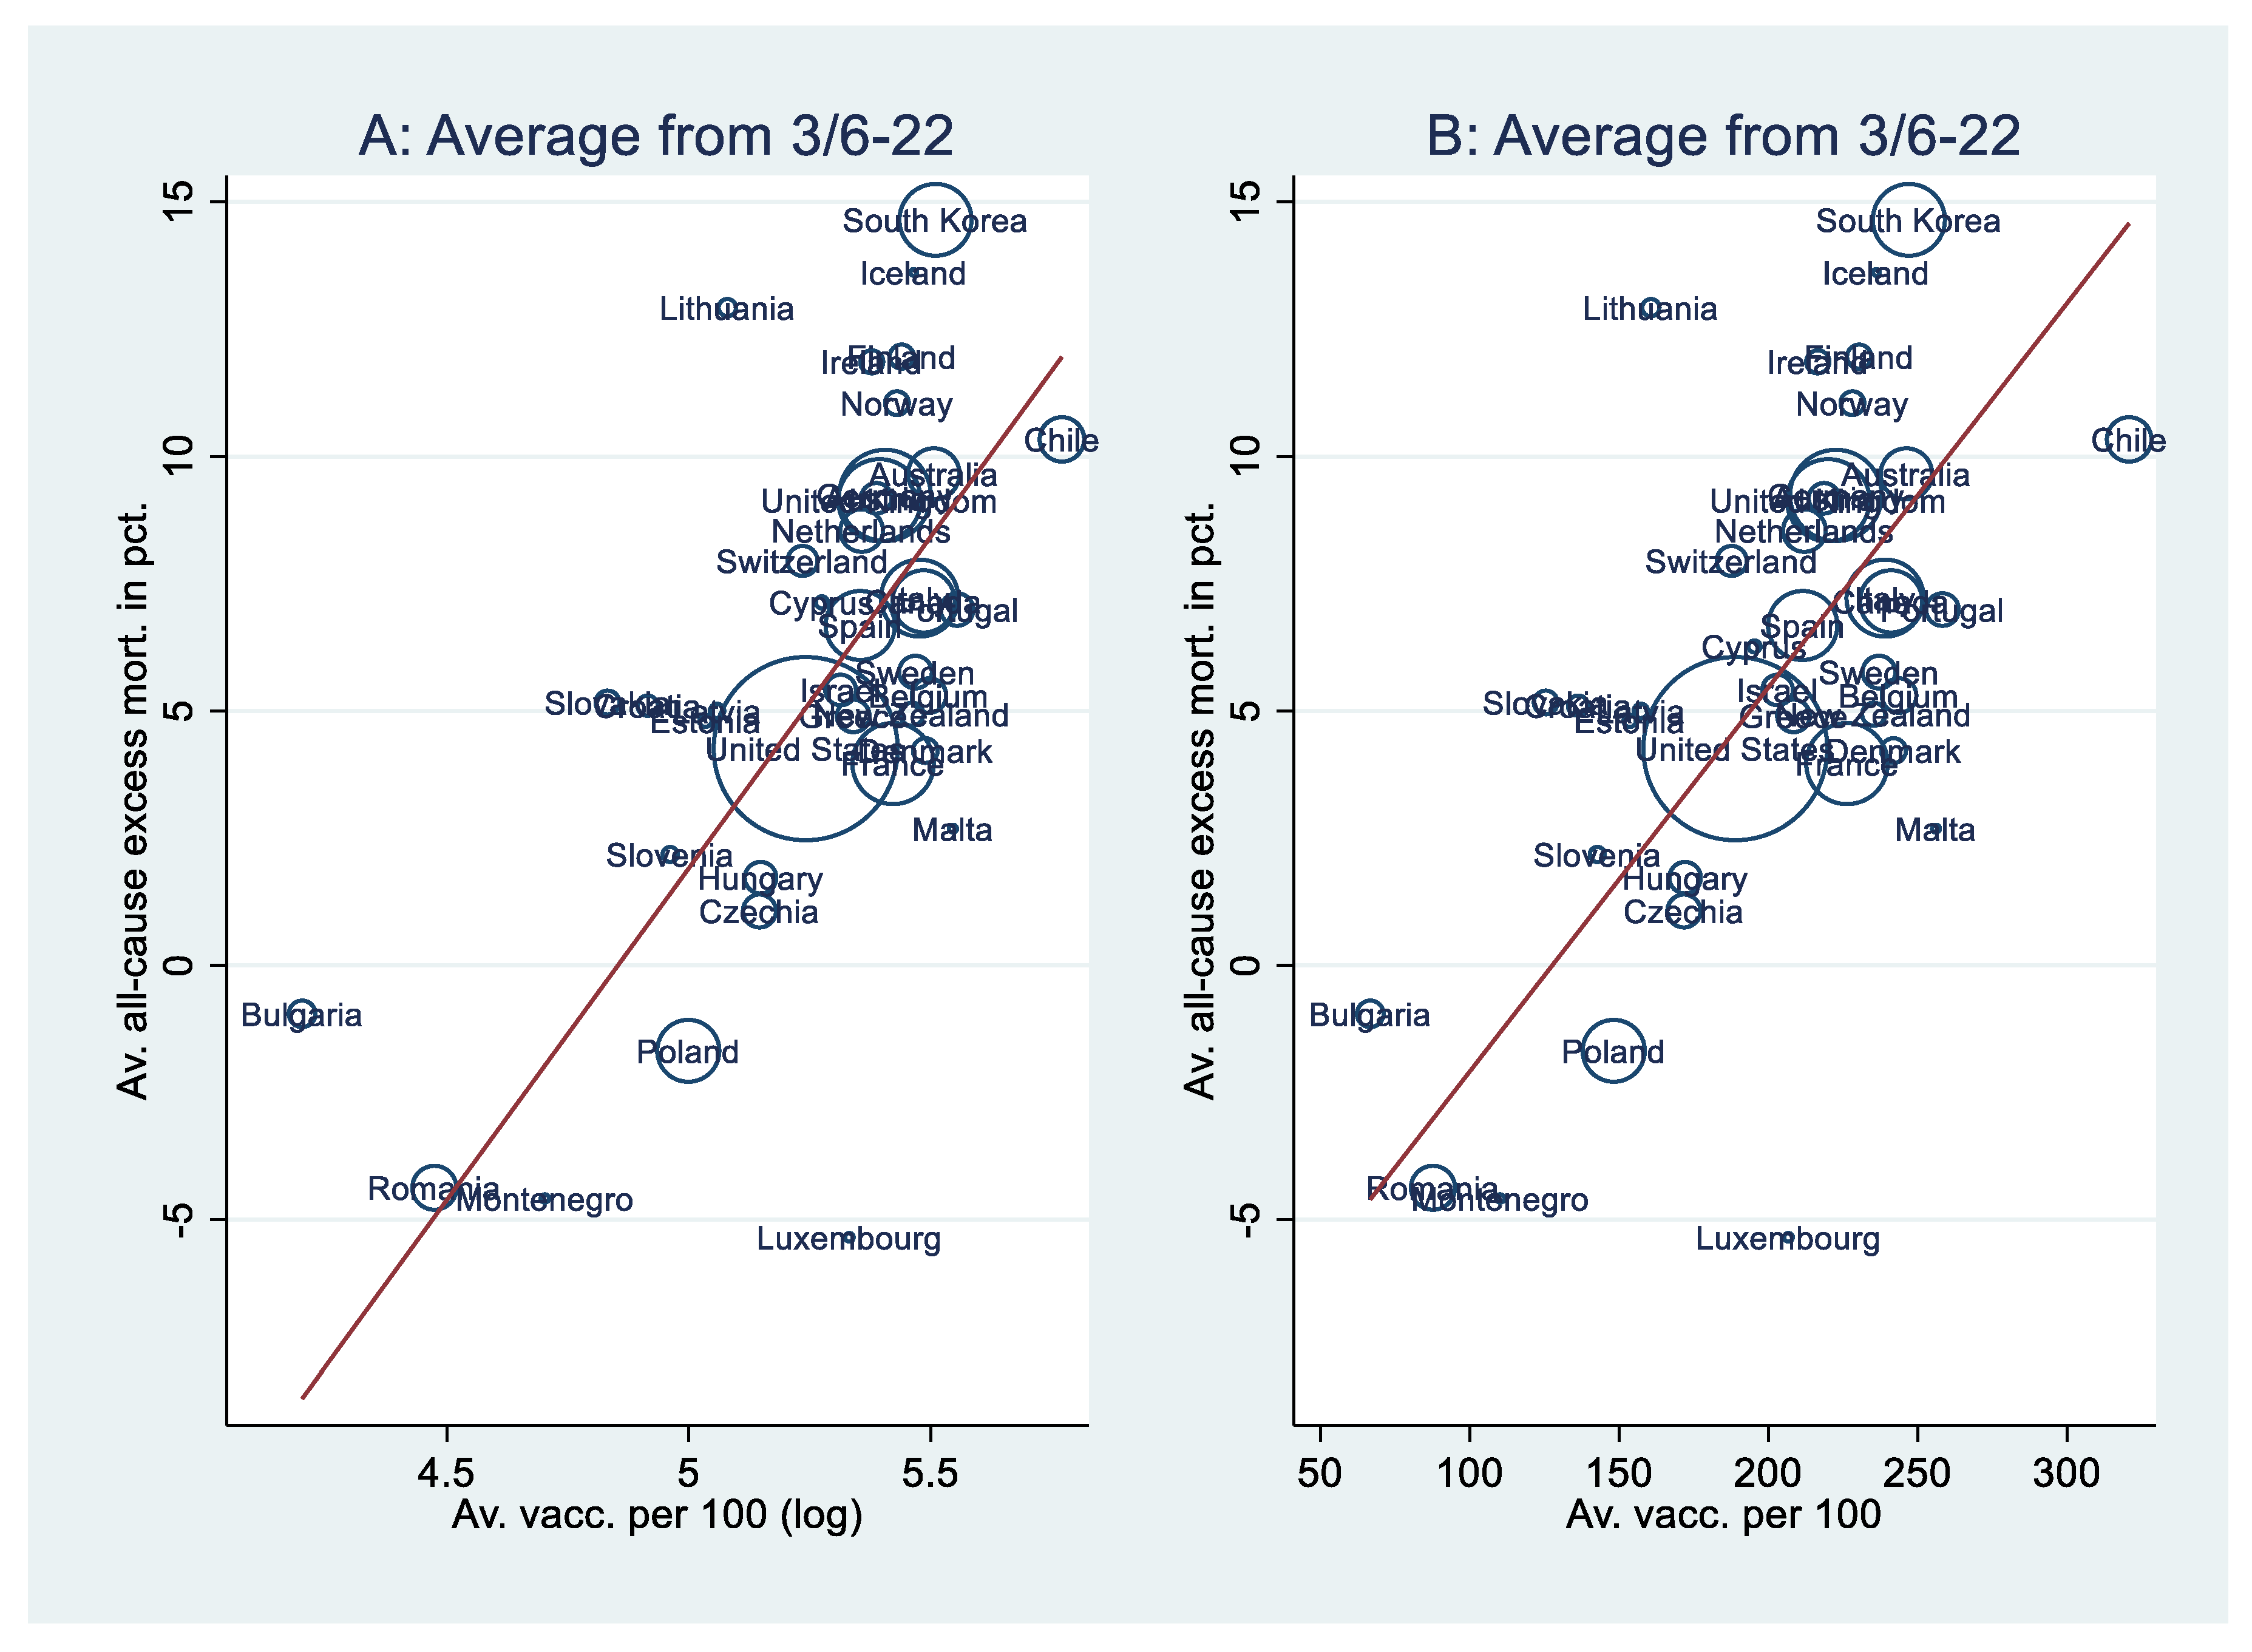

Table 1.
Regressions with robust standard errors weighted for population size. The dependent variable is all-cause mortality. .
Table 1.
Regressions with robust standard errors weighted for population size. The dependent variable is all-cause mortality. .
| Model | A1 | A2 | A3 | B1 | B2 | B3 |
|---|---|---|---|---|---|---|
| Constant | -63.3*** | -97.7*** | -72.2*** | -9.64** | -66.1** | -54.9*** |
| (-89.3, -37.3) | (-152, -43.5) | (-103, -40.7) | (-15.1, -4.15) | (-106, -26.6) | (-76.7, -33.2) | |
| Vacc. (log) | 13.0*** [.739] | 11.1*** [.631] | 10.2*** [.575] | |||
| (8.10, 18.0) | (5.41, 16.9) | (5.07, 15.2) | ||||
| Vacc. | .076*** [.752] | .067*** [.666] | .059*** [.590] | |||
| (.047, .104) | (.043, .090) | (.037, .082) | ||||
| Stringency | -.025 [-.048] | -.025 [-.048] | ||||
| (-.187, .136) | (-.158, .108) | |||||
| Hum. dev. | 49.8† [.370] | 38.2** [.284] | 62.8* [.467] | 42.9*** [.319] | ||
| (-5.86, 105) | (11.0, 65.4) | (11.9, 113) | (21.1, 64.8) | |||
| Cum. excess m. | 4.66e-4 [.165] | 6.28e-4 [.222] | ||||
| (-.001, .002) | (-.001, .002) | |||||
| Median age | .174 [.159] | .170 [.155] | .225* [.205] | |||
| (-.127, .476) | (-.106, .445) | (.029, .422) | ||||
| Population (log) | -.512 [-.185] | -.604** [-.219] | -.428 [-.155] | |||
| (-1.45, .429) | (-1.04, -.171) | (-1.29, .435) | ||||
| F-value | 28.6*** | 11.0*** | 14.0*** | 28.7*** | 13.3*** | 16.6*** |
| R-sq. | .546 | .642 | .611 | .566 | .687 | .669 |
| Adj. R-sq. | .533 | .573 | .578 | .554 | .627 | .637 |
| VIF | 1 | 2.69 | 1.51 | 1 | 2.30 | 1.27 |
| N | 39 | 38 | 39 | 39 | 38 | 39 |
All variables are weekly averages from March 6, 2022, to the end of 2023. Averages of vaccination, stringency, and cumulated all-cause excess mortality are measured with a one-week lag. Two-tailed tests of significance concerning the regression coefficients. † p < .10; * p < .05; ** p < .01; *** p< .001. 95 percent confidence intervals in parentheses. Beta-values in brackets. Analyses are weighed for average population size. The variance inflation factor (VIF) concerns the independent variable, per capita vaccination. .
Disclaimer/Publisher’s Note: The statements, opinions and data contained in all publications are solely those of the individual author(s) and contributor(s) and not of MDPI and/or the editor(s). MDPI and/or the editor(s) disclaim responsibility for any injury to people or property resulting from any ideas, methods, instructions or products referred to in the content. |
© 2025 by the authors. Licensee MDPI, Basel, Switzerland. This article is an open access article distributed under the terms and conditions of the Creative Commons Attribution (CC BY) license (http://creativecommons.org/licenses/by/4.0/).
Copyright: This open access article is published under a Creative Commons CC BY 4.0 license, which permit the free download, distribution, and reuse, provided that the author and preprint are cited in any reuse.


