Submitted:
15 April 2025
Posted:
15 April 2025
You are already at the latest version
Abstract
Background: Newborns are referred primary carnitine deficiency (PCD) when a low free carnitine (C0) concentration (< 10 μmol/L) is detected, leading to high false positive referrals. To improve the follow-up protocol for PCD, various acylcarnitines and the summations were comprehensively evaluated in the present study. Methods: A retrospective study was performed using samples due to low C0 concentration. Data were available for 72 patients with genetically confirmed PCD. Whereafter, C0 with the selected sum of (butyrylcarnitine (C4) + isovalerylcarnitine (C5)) was validated in an additional cohort study including about 80,000 samples. Results: In the discovery study, C4, acetylcarnitine (C2) and C5 exhibited significant discriminant power in distinguishing PCDs from NoPCDs. The area under the ROC curve (AUC) were 99.792% (C4), 98.715% (C2) and 98.620% (C5). The excellent performances in sensitivity, specificity, negative predictive value, positive predictive value (PPV) and accuracy indexes suggested that C4, C2 and C5 would be ideal auxiliary indicators in improving diagnostic performance of C0 for PCD. Multivariate ROC curve based exploratory analysis showed that C5, C4 and C2 were the most top-ranked features in differentiating PCDs from NoPCDs. AUC for C4+C5 was the highest with a cut-off required for 100% sensitivity at 0.181 μmol/L. In the validation cohort, adding C4+C5 in the NBS program could elevate PPV from 0.75% to 1.54%. Conclusions: Our work revealed that C4+C5 summation should be as the auxiliary quantization indicator to reduce false-positive results for PCD.
Keywords:
primary carnitine deficiency
; free carnitine
; acylcarnitine summation
; machine learning
; screening and diagnosis
; false-positive
; rare disease
Introduction
Primary carnitine deficiency (PCD, MIM 212140) is an autosomal recessive disorder caused by mutations in the SLC22A5 gene, encoding the Organic Cation Transporter Novel 2 (OCTN2) protein [1,2,3,4]. OCTN2 could maintain intracellular free carnitine (C0) concentrations at normal level by transporting carnitine into cells [5,6]. Carnitine is essential for transferring long-chain fatty acids from cytosol to mitochondria for subsequent beta oxidation [2,7,8]. Most PCD cases reported occur in infants and very young children. These patients often display an acute metabolic presentation with symptoms such as hypoketotic hypoglycemia, elevated ammonia levels in blood, organic acidosis, and sudden death [2,7,9]. Onset is extremely rare in adulthood and the clinical manifestations include progressive cardiomyopathy, myopathy, and encephalopathy due to hypoketotic hypoglycemia and hyperammonemia. The diagnosis and specific treatment of these age group may be delayed for years [10,11]. The incidence of PCD varies in different countries, depending on the studied population, ranging from 1:300 in the Faroe Islands to 1:20000-142,000 in Japan, Australia, or USA [7,10,12]. Many large-scale New Born Screening (NBS) studies have shown that PCD was the most prevalent fatty acid oxidation disorders in China, the incidence varying from 1:9,000 to 1:34,000 [12,13,14,15,16,17].
Early diagnosis and timely supplementation of L-carnitine in the neonatal period are essential to achieve optimal clinical outcomes [8,18]. PCD is diagnosed based on levels of C0 and acylcarnitines, genetic mutation and clinical symptoms [10,12,19,20]. C0 and acylcarnitines are in extremely decreased levels in PCD patient. However, transplacental transport of carnitine from mothers during pregnancy may lead to a low C0 level in neonates [12,21,22,23]. It is noteworthy that prematurity, malabsorption, malnutrition, and several inherited errors of metabolism, including organic acidemias and fatty acid oxidation defects, would lead to secondary carnitine deficiency [5,12,18,22]. These conditions represent pitfalls for the diagnosis and management of PCD neonates. Additionally, the current used MS/MS-based markers for PCD diagnosis had undesirable performances, leading to high rate of false positives and occasional false negatives [13,16]. Follow-up of false positives is challenging, requiring a long period of confirmatory testing, including carnitine transporter activity measurement in cultured fibroblasts and/or the SLC22A5 gene sequencing [15,23]. The prolonged uncertainty concerning the health of their newborns during this extensive assessment, can induce significant anxiety in the families regarded. A faster exclusion of PCD diagnosis may reduce harm by false-positive referrals. Consequently, several algorithms for PCD screening have been proposed, including: different thresholds for C0 and other biomarkers, molecular sequencing of SLC22A5 and functional confirmation by carnitine uptake assay on skin fibroblasts [24].
At present, only a few countries apply secondary biomarkers in order to decrease false positive rates for PCD [10,24]. Utilization the sum of propionylcarnitine (C3) and palmitoylcarnitine (C16) on dried blood spot (DBS) < 2 µmol/L, in addition to a cut-off value of C0 <10 µmol/L allowed significant reduction in scree-positive cases and did not increase false negative case [25,26]. The positive predictive value (PPV%) increased from 7.1 to 13.0 [25]. Whilst acylcarnitines and their summations may be promising markers for early differentiation of healthy newborns from PCD-affected newborns, information on acylcarnitines and their summations is limited. Furthermore, optimization of newborn screening indicators and improvement of PPV are major challenges faced by newborn screening. According to the "Consensus on Primary carnitine deficiency Screening, Diagnosis and Treatment" in China, neonates with C0 < 10 µmol/L or C0 of 10~15 µmol/L, accompanied by a variety of acylcarnitine reduction need to be recalled for review [27]. However, how to quantify multiple acylcarnitine levels is rarely reported in the literatures.
In the present study, performances of free carnitine, specific acylcarnitines and their summations were comprehensively investigated on a larger scale to identify more effective NBS markers for PCD deficiency. This study demonstrates that the sum of butyrylcarnitine (C4) and isovalerylcarnitine (C5) could be used as an auxiliary diagnostic indicator in early discriminative test for PCD.
Material and Methods
1.1. Research Subjects
The main objective of this study was to investigate the optimal auxiliary diagnostic indicators and significant changes in the acylcarnitines profiles of patients with PCD. A total of 72 PCD patients were recruited from 2003 to 2024. Detailed results of genomic confirmatory tests are listed in Supplementary Table 1. Infants with normal C0 level and had no clinical symptoms suggestive of metabolic disease were enrolled as the NonPCD group (n = 80). The utilities of C0 and various acylcarnitines and their summations in DBSs as markers for PCD were evaluated by comparing the data of the two groups.
To further validate the practicality of the selected auxiliary diagnostic indicators, an additional NBS cohort including 85,404 newborns were collected. Among them, 400 infants primarily displayed low C0 levels. Among them, 376 newborns were successfully recalled. Eventually, 3 newborns were diagnosed with PCD, yielding a PPV of 0.75% (3/400).
1.1. NBS Test for PCD
DBSs were collected from the heel pricks 72-120 h after birth. DBS samples were sent by cold chain transportation after natural air drying to Newborn Screening Center for tandem mass analysis. Both derivatized and underivatized methods were used for analyzing levels of amino acids, free carnitine, and acylcarnitines (API4000/API4500, Applied Biosystems, Foster City, CA) [17,28]. The C0 cut-off value in our Newborn Screening Center was 10-60 µmol/L. Newborns in the initial screening with positive results (C0 < 10 µmol/L) were recalled and reexamined. The suspected PCDs were referred for confirmatory SLC22A5 gene mutation analysis.
1.1. Confirmatory Tests for PCD
Genetic analysis for PCDs was conducted according to the methods described in previous research with minor modifications after receiving informed consent [4,17]. Genomic DNA was extracted from peripheral blood leukocytes. All exons and flanking intron regions containing SLC22A5 were amplified using a polymerase chain reaction and analyzed on an automated DNA sequencer (Applied Biosystems, ABI3700). The SLC22A5 gene mutations were analyzed using the Sanger sequencing. The mutations were identified using a normal human SLC22A5 sequence as a reference (NM_003060.4). Patients were diagnosed with PCD based on C0 levels, genetic mutations, and clinical symptoms. Newborns with two variants in the SLC22A5 gene were diagnosed with PCD. The suspected positives carrying one variant or not performing genetic testing but with persistently lower C0 values until therapy were diagnosed with PCD [17].
1.1. Statistics
The sample distribution was determined using the Kolmogorov-Smirnov normality test. For statistical comparisons, Student’s t-test or Mann-Whitney U-test followed by the post-hoc tests (Dunnett’s test) were utilized for the normal or non-normal distributed data, respectively.
ROC curves were generated to evaluate the sensitivity and specificity of free carnitine and various acylcarnitines and their summations as markers for PCD. Univariate and multivariate ROC curve analyses were performed in MetaboAnalyst 6.0. Multivariate ROC curves were performed based on three multivariate algorithms: SVM, PLS-DA, and RF. ROC curves were generated by Monte-Carlo cross validation (MCCV) using balanced sub-sampling. In each MCCV, two thirds of the samples (2/3) were used to evaluate the feature importance. The top important features were then used to build classification models. The established models were then validated on the samples that were left out (1/3). The procedure was conducted multiple times to generate the confidence interval and performance of each model.
AUC, fold changes (FC), p-values and false-discovery rate (FDR) were used to evaluate the significance of the respective acylcarnitines as potential diagnostic biomarkers. All the p-values were corrected by the false discovery rate using the Benjamin-Hochberg method. The adjusted p-value (q-value) of 0.05 was taken as a significant level.
Results
1.1. Diagnostic Performances of Currently Used Free Carnitine and Acylcarnitines for PCD
Supplementary Table 2 shows levels of C0 and individual acylcarnitine [acetylc- arnitine (C2), C3, C4, C5, caproylcarnitine (C6), caprylylcarnitine (C8), actinylcarni-tine (C10), lauroylcarnitine (C12), myristoylcarnitine (C14), C16, octadecylcarnitine(C18)] in DBSs in the present study. In the PCD (n = 72) versus the NoPCD (n = 80)population, the C0 median concentration [interquartile range (IQR)] was 5.839 [4.392 -7.201] and 26.418 [21.973-32.944] μmol/L, respectively (Supplementary Table 2).
The discriminant performances of C0 and individual acylcarnitines were investigated using Receiver operating characteristic (ROC) analysis (Table 1). The area under the curve (AUC) with the optimal cutoff was highest for C0 (100.000%), followed by C4 (99.792%), C2 (98.715%) and C5 (98.620%). This analysis evidenced that the currently used C0 is an optimal primary marker for PCD. The sensitivity, specificity, negative predictive value (NPV), PPV and accuracy indexes in Table 1 suggested that C4, C2 and C5 might be ideal auxiliary indicators in improving diagnostic performance of C0 for PCD.
Figure 1 shows the ROC curves and corresponding box plots of C0, C4, C2 and C5 in DBSs in the PCDs and NoPCDs. All of these markers could clearly distinguish PCDs from NoPCDs. Supplementary Figure. 1 presents ROC curves of the other specific acylcarnitines. Cluster heatmap and fold changes of free carnitine and specific acylcarnitines (Figure 1E,F) show that C0, C4, C2 and C5 had the most significant changes (q value < 10-25). C3 and C16 displayed lower levels in patients, with the q value < 10-20 and < 10-15, respectively.
1.1. Machine Learning-Assisted Identification of Candidate Acylcarnitines for PCD Diagnosis
Multivariate ROC curve based exploratory analysis was performed for identifying the optimal auxiliary diagnostic markers for PCD. ROC curve analyses were performed based on three multivariate algorithms: support vector machines (SVM), partial least squares discriminant analysis (PLS-DA), and random forests (RF). Figure 2 shows the average important features obtained from multivariate ROC curve based exploratory analysis. C5, C4 and C2 were identified as the most top-ranked features in all the three methods. The AUC for the diagnosis of PCD in the studied cohort ranged from 0.999 to 1, with confidence intervals (CI) of 0.996-1, 0.997-1 and 0.999-1. To mining features having the most optimal performance and suitability for PCD diagnosis, summations of the top 5 features (C4, C5, C2, C14, C3) were selected and evaluated in discriminating PCDs from NoPCDs.
1.1. Diagnostic Accuracy Evaluation of Acylcarnitines Summations for PCD
Supplementary Figure 2 shows box plots of acylcarnitines summations in DBSs. Supplementary Table 3 shows individual acylcarnitines summation levels (C4+C5, C4+C2, C4+C14, C4+C3, C5+C2, C5+C14, C5+C3, C2+C14, C2+C3, C14+C3, C4+C5+C2, C4+C5+C14, C4+C5+C3, C5+C2+C14, C5+C2+C3, C2+C14+C3, C4+C5+C2+C14, C5+C2+C14+C3, C4+C5+C2+C14+C3, C3+C16) in DBSs from PCDs and NoPCDs in the present study. Additionally, C3+C16, which is the current auxiliary indicator for PCD NBS, was also incorporated. According to the ROC analysis (Table 2), the C4+C5 had the highest AUC (99.983%), followed by C4+C5+C14 (99.948%), C4+C14 (99.887%), and C5+C14 (98.958%). Regarding sensitivity, the C4+C5, C4+C5+C14, and C4+C14 exhibited the sensitivity of 100.000%, followed by the C5+C14 with sensitivity of 97.222%. For specificity, the C4+C5 had the highest value of 98.750%, followed by the C4+C5+C14, C4+C14 and C5+C14 with specificities of 97.500%, 97.500% and 92.500%, respectively. Positive predictive values of C4+C5, C4+C5+C14, C4+C14 and C5+C14 were 98.673%, 97.297%, 97.297% and 92.105%, respectively. The negative predictive values were 100.000% for C4+C5, C4+C5+C14, and C4+C14. C4+C5 had the highest accuracy of 99.342%.
The ROC curves and the corresponding box plots of the C4+C5, C4+C5+C14, C4+C14 and C5+C14 are shown in Figure 3. ROC curves of the other various acylcarnitines summations are shown in Supplementary Figure 3. The notches of box plot for C4+C5 had the least overlap (Figure 3A), indicating the best classification power for PCDs and NoPCDs. Figure 3E,F shows the heatmap and fold changes of the various acylcarnitines summations in PCDs and NoPCDs. C4+C5, C4+C5+C14 and C4+C14 exhibited the most significant changes (q value < 10-25). C3+C16 showed a q value < 10-20.
Table 3 shows the diagnostic performances of the C4+C5, C4+C5+C14, C4+C14 and C5+C14 summations using optimal cutoffs determined by ROC analysis for PCD. The C4+C5 summation yielded false positive result in only one patient. The C4+C5+C14 and C4+C14 summations yielded false positive results in two patients. There were no false-negative results in C4+C5, C4+C5+C14, C4+C14 summation.
1.1. Validation and Application of Free Carnitine and C4+C5 Summation in PCD NBS
Based on the above results, in this part an additional NBS cohort program in Xinhua Hospital from 2021-2024 was utilized to assess the performance of C0 and C4+C5 summation in discriminating PCDs from NoPCDs. As shown in Table 4, the additional C4+C5 summation (< 0.181 μmol/L) utilization could elevate PPV from 0.75% to 1.54%, significantly reducing the false positives recalled (256 to 123). Among the 400 screening positives for PCD, up to 205 ones present C4+C5 summation above 0.181 µM. No one was PCD patient in this population.
Discussion
PCD screening in neonates has been widely implemented across the world [2,29,30,31]. However, NBS for PCD is well known to have an unsatisfactory PPV, ranging from 1.6% to 4.7% [31,32]. If C0 concentration is low at the initial screening, a second DBS sample is collected and newborns are only referred when the low C0 concentration persists [17]. However, this workflow comes at the cost of timeliness. Initial DBSs are usually obtained 72-170 h after birth and in the event the second test is requested, there is a further delay of 2-3 days before a newborn is referred. Additionally, false-positive outcomes in NBS could cause unnecessary anxieties for parents [33,34]. Hence, markers that have the best performances in sensitivity and specificity should be clarified in significantly reducing the false-positives in PCD screening. In the present study, the levels of specific acylcarnitines and C0 were firstly compared in the 152 DBSs. Besides C0, C4, C2 and C5 were also the most significantly down regulated markers (q < 10-25). Furthermore, the ROC analysis also showed that decreased C4, C2 and C5 levels exhibited highest discrimination value (AUC > 0.980). Multivariate exploratory ROC analysis based on three algorithms (SVM, RF and PLS-DA) was performed to further screen the most reasonable acylcarnitines signatures which could be utilized as the auxiliary quantitative diagnostic indicators for PCD. The ROC analysis showed that the top 3 acylcarnitines (C4, C2 and C5, Fig. 2) presented the highest discrimination value (AUC = 0.999-1). Next, C4+C5, C4+C2, C2+C5 and C4+C2+C5 summations were evaluated in the 72 PCDs. Decreased C4+C5 levels exhibited the highest discrimination value (AUC > 0.999).
Considering the clinical symptoms of PCD and the accessibility of effective medical management, both false-positive and false-negative results should be prevented. Table 3 summarizes performance of the C4+C5 with the optimal cutoff applied to 72 PCDs and 80 NoPCDs. The C4+C5 yielded only one false-positive and no false-negative result. Furthermore, performance of C4+C5 biomarker was evaluated in an additional NBS cohort including 85,404 infants. When using C0 < 10 µmol/L with C4+C5 < 0.181 µmol/L, the PPV increased to 1.54% (3/195). It is worth noting that 92 cases with mildly decreased C0 (9.0~10.0 µmol/L) and C4+C5 > 0.181 µmol/L were identified, and no abnormalities were found in 67 of them upon repeat testing (Table 4). Ones with mildly decreased C0 but C4+C5 > 0.181 µmol/L are less likely the PCD patients. Therefore, in the screening system, adding the screening criteria C4+C5 < 0.181 µmol/L can improve the positive predictive value, reduce the false positive rate, and might help differentiate secondary carnitine deficiency, thereby improving the performance of newborn screening.
We should also pay attention to false negatives in PCD neonatal screening [35]. In the NBS cohort study, 2 PCD cases had a C0 value of 8.525 µmol/L and 8.937 µmol/L at the initial screening, which was very easy to be missed. However, the corresponding C4+C5 value were 0.121 µmol/L and 0.104 µmol/L, respectively. Our previous research on “Genomic Sequencing as a First-Tier Screening Test and Outcomes of Newborn Screening” also confirmed one PCD patient whose C0 and C4+C5 values were 8.330 µmol/L and 0.120 µmol/L, respectively [36]. Therefore, it is important to pay attention to the recall of full-term neonates with a C0 critical value and C4+C5 < 0.181 µmol/L to reduce the rate of missed diagnosis. Even if the neonatal screening is negative, if the neonate is clinically suspected PCD, it still needs to be differentiated by tandem mass spectrometry. To further validate the performance of C4+C5 < 0.181 µmol/L as an additional screening indicator, retrospective analysis was conducted on newborns recruited for PCD screening from 2003 to 2024 in Xinhua Hospital. One false negative case (male) was reported, delivered at 38 weeks of gestation, weighing 3650 g at birth in 2016. Biochemical NBS screening showed that the C0 level was 11.637 µmol/L, not diagnosed with PCD in 2016. However, in 2019 this case exhibited clinical symptoms and SLC22A5 gene mutation analysis showed two variants (c.760C>T; c.1400C>G). And the initial screening mass data in 2016 showed that C4+C5 was 0.111 µmol/L. This false negative case would not be missed if the sum of C4+C5 was added in the NBS program. Based on the above results, sum of C4+C5 could be used as an effective auxiliary diagnostic indicator for PCDs with the lowest increase in false-positive and false-negative rates.
The added benefit of acylcarnitine summation in NBS has been reported previously in Guangzhou Newborn Screening Center, China. This research demonstrated that adding the quantitative biomarker C3+C16 < 2 µmol/L into the new born screening program could improve the PCD screen performance. However, in the present study population, using C3+C16 < 2 µmol/L yields 17 false positives and 5 false negatives (Table 3). Although utilizing the optimal cutoff of C3+C16 determined by ROC analysis (1.839 µmol/L), there was up to 12 false positives and 6 false negatives, respectively. The performance is obviously lower than C4+C5.
We acknowledge the limitations of using the C4+C5 summation as an additional discriminative tool for PCD. In the Genomic Sequencing Program, 29 989 infants recruited from 8 NBS centers throughout China, one PCD patient was not detected by genetic NBS but revealed by tandem mass spectrometry. This patient exhibited a C0 value of 6.65 µmol/L. The sum of C4+C5 was 0.190 µmol/L, slightly higher than the optimal cutoff (0.181 µmol/L) determined in the present study. Larger studies are necessary to validate the C4+C5 threshold. The other limitation of the present study was the lack of reference values for NBS program in PCD, except the currently used C0 level. The sum of (C4+C5)’s performance must be further validated using nationwide NBS data.
Conclusions
In this study, we performed a comprehensive evaluation on the diagnostic performances of specific acylcarnitine levels and various acylcarnitine summations using two PCD cohorts. Utilization of C0 < 10 µmol/L with C4+C5 < 0.181 µmol/L can effectively discriminate between true and false positive referrals for PCD, reducing time to diagnosis and mitigating the negative effects of a false positive referral. The performance of C0 plus C4+C5 would be further evaluated in the retrospective and prospective nationwide studies for PCD. The optimal and appropriate reference ranges would be established, improving differential PCD diagnosis with significant reduction of the false positivity and false negativity rates.
Supplementary Materials
The following supporting information can be downloaded at the website of this paper posted on Preprints.org. Figure S1: Performance of acylcarnitines in identifying patients with PCD; Figure S2: Box plots of acylcarnitines summations in dried blood specimens; Figure S3: ROCs of various acylcarnitines summations in dried blood specimens to diagnose PCDs; Table S1: Genetic variants of the PCD patients in the study cohort; Table S2: Levels of free carnitine and specific acylcarnitines in dried blood specimens (μmol/L); Table S3: Levels of various acylcarnitines summations in dried blood specimens (μmol/L).
Author Contributions
H.Z.: Conceptualization, Supervision, Validation, Data curation, Formal analysis, Investigation, Methodology, Visualization, Writing-original draft; S.C.: Project administration, Formal analysis, Visualization, Writing-review & editing, Investigation. Ting Chen: Methodology, Data curation; L.L.: Methodology, Data curation; W.Q.: Visualization, Validation, Writing- review & editing. H.Z.: Writing-review & editing. X.G.: Writing-review & editing. L.H.: Conceptualization, Investigation, Supervision.
Funding
This work was supported by grants from the Scientific research Project Plan of Shanghai Municipal Health Commission (No. 202140346) and the National Key Research and Development Program of China (No. 2016YFC0901505).
Institutional Review Board Statement
The study was approved by Ethics Committee of Xinhua Hospital Affiliated to Shanghai Jiaotong University School of Medicine (Approval No. XHEC-D-2025-016) and conducted in accordance with the principles of the Declaration of Helsinki.
Informed Consent Statement
Written informed consent was obtained from participants or their parents.
Data Availability Statement
The datasets used and analyzed in this study are available from the corresponding author on reasonable request.
Acknowledgments
We are grateful for the invaluable contributions of all the patients. We also express our sincere gratitude to all of the pediatricians who provided associated clinical data and samples. These are essential in successfully accomplishing this research.
Conflicts of Interest
The authors declare no conflicts of interest.
References
- Nez, J.I.; Tamai, I.; Oku, A. Primary systemic carnitine deficiency is caused by mutations in a gene encoding sodium ion-dependent carnitine transporte. Nature Genet. 1999, 21, 91–94. [Google Scholar] [CrossRef] [PubMed]
- Zhou, J.; Li, G.; Zeng, Y.; Qiu, X.; Zhao, P.; Huang, T.; Wang, X.; Luo, J.; Lin, N.; Xu, L. Screening primary carnitine deficiency in 10 million Chinese newborns: a systematic review and meta-analysis. Orphanet J. Rare Dis. 2024, 19, 248. [Google Scholar] [CrossRef] [PubMed]
- Crefcoeur, L.L.; Visser, G.; Ferdinandusse, S.; Wijburg, F.A.; Langeveld, M.; Sjouke, B. Clinical characteristics of primary carnitine deficiency: A structured review using a case-by-case approach. J. Inherit. Metab. Dis. 2022, 45, 386–405. [Google Scholar] [CrossRef] [PubMed]
- Han, L.; Wang, F.; Wang, Y.; Ye, J.; Qiu, W.; Zhang, H.; Gao, X.; Gong, Z.; Gu, X. Analysis of genetic mutations in Chinese patients with systemic primary carnitine deficiency. Eur. J. Med. Genet. 2014, 57, 571–575. [Google Scholar] [CrossRef]
- Koleske, M.L.; McInnes, G.; Brown, J.E.H. Functional genomics of OCTN2 variants informs protein-specific variant effect predictor for Carnitine Transporter Deficiency. Pro. Natl. Acad. Sci. USA 2022, 119, e2210247119. [Google Scholar] [CrossRef]
- Koepsell, H.; Daws, L.C. Organic Cation Transporters in Health and Disease. Pharmacol. Rev. 2019, 72, 253–319. [Google Scholar] [CrossRef]
- Loos, M.; Klampe, B.; Schulze, T.; Yin, X.; Theofilatos, K.; Ulmer, B.M.; Schulz, C.; Behrens, C.S.; van Bergen, T.D.; Adami, E.; et al. Human model of primary carnitine deficiency cardiomyopathy reveals ferroptosis as a novel mechanism. Stem Cell Rep. 2023, 18, 2123–2137. [Google Scholar] [CrossRef]
- Jolfayi, A.G.; Naderi, N.; Ghasemi, S.; Salmanipour, A.; Adimi, S.; Maleki, M.; Kalayinia, S. A novel pathogenic variant in the carnitine transporter gene, SLC22A5, in association with metabolic carnitine deficiency and cardiomyopathy features. BMC Cardiovasc. Disord. 2024, 24, 1. [Google Scholar] [CrossRef]
- Zhou, Y.; Liu, Y.; Shen, Y.; Xu, F.; Xu, F.; Huang, H.; Duan, J. A report of a pedigree with compound heterozygous mutations in the SLC22A5 gene. Front. Pediatr. 2023, 11, 985720. [Google Scholar] [CrossRef]
- Lefevre, C.R.; Labarthe, F.; Dufour, D.; Moreau, C.; Faoucher, M.; Rollier, P.; Arnoux, J.B.; Tardieu, M.; Damaj, L.; Bendavid, C.; et al. Newborn Screening of Primary Carnitine Deficiency: An Overview of Worldwide Practices and Pitfalls to Define an Algorithm before Expansion of Newborn Screening in France. Int. J. Neonatal Screen. 2023, 9, 6. [Google Scholar] [CrossRef]
- Guerrero Cervera, B.; Donoso Trenado, V.; Fernandez-Sellers, C.; Vila Clerigues, N.; Correcher Medina, P.; Zorio, E. Cardiomyopathy associated with primary carnitine deficiency in adults: lack of complete response in patients with delayed treatment initiation. Rev. Esp. Cardiol. (Engl Ed) 2024, 77, 265–267. [Google Scholar] [CrossRef] [PubMed]
- Ji, X.; Ge, Y.; Ni, Q.; Xu, S.; Xiong, Z.; Yang, L.; Hu, L.; Cao, Y.; Lu, Y.; Wei, Q.; et al. Primary carnitine deficiency: Estimation of prevalence in Chinese population and insights into newborn screening. Front. Genet. 2023, 14, 1304458. [Google Scholar] [CrossRef]
- Lin, Y.; Zhang, W.; Huang, C.; Lin, C.; Lin, W.; Peng, W.; Fu, Q.; Chen, D. Increased detection of primary carnitine deficiency through second-tier newborn genetic screening. Orphanet J. Rare Dis. 2021, 16, 149. [Google Scholar] [CrossRef]
- Lin, Y.; Lin, B.; Chen, Y.; Zheng, Z.; Fu, Q.; Lin, W.; Zhang, W. Biochemical and genetic characteristics of patients with primary carnitine deficiency identified through newborn screening. Orphanet J. Rare Dis. 2021, 16, 503. [Google Scholar] [CrossRef] [PubMed]
- Yang, X.; Li, Q.; Wang, F.; Yan, L.; Zhuang, D.; Qiu, H.; Li, H.; Chen, L. Newborn Screening and Genetic Analysis Identify Six Novel Genetic Variants for Primary Carnitine Deficiency in Ningbo Area, China. Front. Genet. 2021, 12, 686137. [Google Scholar] [CrossRef]
- Lin, Y.; Lin, C.; Lin, B.; Zheng, Z.; Lin, W.; Chen, Y.; Chen, D.; Peng, W. Newborn screening for fatty acid oxidation disorders in a southern Chinese population. Heliyon 2024, 10, e23671. [Google Scholar] [CrossRef] [PubMed]
- Chang, S.; Yang, Y.; Xu, F.; Ji, W.; Zhan, X.; Gao, X.; Chen, T.; Qiu, W.; Zhang, H.; Liang, L.; et al. Clinical, biochemical, and molecular genetic characteristics of patients with primary carnitine deficiency identified by newborn screening in Shanghai, China. Front. Genet. 2022, 13, 1062715. [Google Scholar] [CrossRef]
- Lin, Y.; Zheng, Z.; Lin, W.; Peng, W. Incorporating Next-Generation Sequencing as a Second-Tier Test for Primary Carnitine Deficiency. Mol. Genet. Genomic Med. 2024, 12, e70003. [Google Scholar] [CrossRef]
- Chen, Y.; Lin, Q.; Zeng, Y.; Qiu, X.; Liu, G.; Zhu, W. Gene spectrum and clinical traits of 10 patients with primary carnitine deficiency. Mol. Genet. Genomic Med. 2021, 9, e1583. [Google Scholar] [CrossRef]
- Wilcken, B.; Wiley, V.; Hammond, J. Screening Newborns for Inborn Errors of Metabolism by Tandem Mass Spectrometry. N. Engl. J. Med. 2003, 348, 2304–2312. [Google Scholar] [CrossRef]
- Crefcoeur, L.; Ferdinandusse, S.; van der Crabben, S.N.; Dekkers, E.; Fuchs, S.A.; Huidekoper, H.; Janssen, M.; Langendonk, J.; Maase, R.; de Sain, M.; et al. Newborn screening for primary carnitine deficiency: who will benefit? - a retrospective cohort study. J. Med. Genet. 2023, 60, 1177–1185. [Google Scholar] [CrossRef]
- Lin, W.; Wang, K.; Zheng, Z.; Chen, Y.; Fu, C.; Lin, Y.; Chen, D. Newborn screening for primary carnitine deficiency in Quanzhou, China. Clin. Chim. Acta 2021, 512, 166–171. [Google Scholar] [CrossRef] [PubMed]
- Lin, Y.; Xu, H.; Zhou, D.; Hu, Z.; Zhang, C.; Hu, L.; Zhang, Y.; Zhu, L.; Lu, B.; Zhang, T.; et al. Screening 3.4 million newborns for primary carnitine deficiency in Zhejiang Province, China. Clin. Chim. Acta 2020, 507, 199–204. [Google Scholar] [CrossRef]
- Crefcoeur, L.L.; Heiner-Fokkema, M.R.; Maase, R.E.; Visser, G.; de Sain-van der Velden, M.G.M. Assessment of carnitine excretion and its ratio to plasma free carnitine as a biomarker for primary carnitine deficiency in newborns. JIMD Reports 2022, 64, 57–64. [Google Scholar] [CrossRef]
- Tang, C.; Tan, M.; Xie, T.; Tang, F.; Liu, S.; Wei, Q.; Liu, J.; Huang, Y. Screening for neonatal inherited metabolic disorders by tandem mass spectrometry in Guangzhou. J. Zhejiang Univ. (Medical Sciences) 2021, 50, 463–471. [Google Scholar] [CrossRef] [PubMed]
- Huang, Y.L.; Tang, C.F.; Liu, S.C.; Sheng, H.Y.; Tang, F.; Jiang, X.; Zheng, R.D.; Mei, H.F.; Liu, L. Newborn screening for primary carnitine deficiency and variant spectrum of SLC22A5 gene in Guangzhou. Chin. J. Pediatr. 2020, 58, 476–481. [Google Scholar]
- Yang, R. Consensus on screening and diagnosis of primary carnitine deficiency. Natl. Med. J. China 2019, 99, 88–92. [Google Scholar]
- Wang, Z. Expert consensus on tandem mass spectrometry screening techniques for neonatal diseases. Chin. J. Lab. Med. 2019, 42, 89–97. [Google Scholar]
- McCandless, S.E.; Wright, E.J. Mandatory newborn screening in the United States: History, current status, and existential challenges. Birth Defects Res. 2020, 112, 350–366. [Google Scholar] [CrossRef]
- Therrell, B.L.; Padilla, C.D. Newborn screening in the developing countries. Curr. Opin. Pediatr. 2018, 30, 734–739. [Google Scholar] [CrossRef]
- Gallant, N.M.; Leydiker, K.; Wilnai, Y.; Lee, C.; Lorey, F.; Feuchtbaum, L.; Tang, H.; Carter, J.; Enns, G.M.; Packman, S.; et al. Biochemical characteristics of newborns with carnitine transporter defect identified by newborn screening in California. Mol. Genet. Metab. 2017, 122, 76–84. [Google Scholar] [CrossRef]
- Schiergens, K.A.; Weiss, K.J.; Röschinger, W.; Lotz-Havla, A.S.; Schmitt, J.; Dalla Pozza, R.; Ulrich, S.; Odenwald, B.; Kreuder, J.; Maier, E.M. Newborn screening for carnitine transporter defect in Bavaria and the long-term follow-up of the identified newborns and mothers: Assessing the benefit and possible harm based on 19 ½ years of experience. Mol. Genet. Metab. Rep. 2021, 28, 100776. [Google Scholar] [CrossRef]
- Tajima, G.; Aisaki, J.; Hara, K.; Tsumura, M.; Kagawa, R.; Sakura, F.; Sasai, H.; Yuasa, M.; Shigematsu, Y.; Okada, S. Using the C14:1/Medium-Chain Acylcarnitine Ratio Instead of C14:1 to Reduce False-Positive Results for Very-Long-Chain Acyl-CoA Dehydrogenase Deficiency in Newborn Screening in Japan. Int. J. Neonatal Screen. 2024, 10, 15. [Google Scholar] [CrossRef]
- Liu, N.; Xiao, J.; Gijavanekar, C.; Pappan, K.L.; Glinton, K.E.; Shayota, B.J.; Kennedy, A.D.; Sun, Q.; Sutton, V.R.; Elsea, S.H. Comparison of Untargeted Metabolomic Profiling vs Traditional Metabolic Screening to Identify Inborn Errors of Metabolism. JAMA Netw. Open 2021, 4, e2114155. [Google Scholar] [CrossRef]
- Lee, N.-C.; Tang, N.L.-S.; Chien, Y.-H.; Chen, C.-A.; Lin, S.-J.; Chiu, P.-C.; Huang, A.-C.; Hwu, W.-L. Diagnoses of newborns and mothers with carnitine uptake defects through newborn screening. Mol. Genet. Metab. 2010, 100, 46–50. [Google Scholar] [CrossRef] [PubMed]
- Chen, T.; Fan, C.; Huang, Y.; Feng, J.; Zhang, Y.; Miao, J.; Wang, X.; Li, Y.; Huang, C.; Jin, W.; et al. Genomic Sequencing as a First-Tier Screening Test and Outcomes of Newborn Screening. JAMA Netw. Open 2023, 6, e2331162. [Google Scholar] [CrossRef] [PubMed]
Figure 1.
ROC curves and corresponding box plots of (A) C0, (B) C4, (C) C2, and (D) C5. The notch indicates the 95% confidence interval around the median of each group. The optimal cutoff is indicated with a horizontal red line on the boxplot. The mean concentration of each group is indicated with a yellow diamond. (E) cluster heatmap and (F) fold changes of free carnitine and various acylcarnitines in dried blood specimens from PCDs and NoPCDs. PCD, primary carnitine deficiency; ROC, receiver operator characteristic; AUC, area under the curve; C0, carnitine; C2, acetylcarnitine; C3, propionylcarnitine; C4, butyrylcarnitine; C5, isovalerylcarnitine; C6, caproylcarnitine; C8, caprylylcarnitine; C10, actinylcarnitine, C12, lauroylcarnitine; C14, myristoylcarnitine; C16, palmitoylcarnitine; C18, octadecylcarnitine.
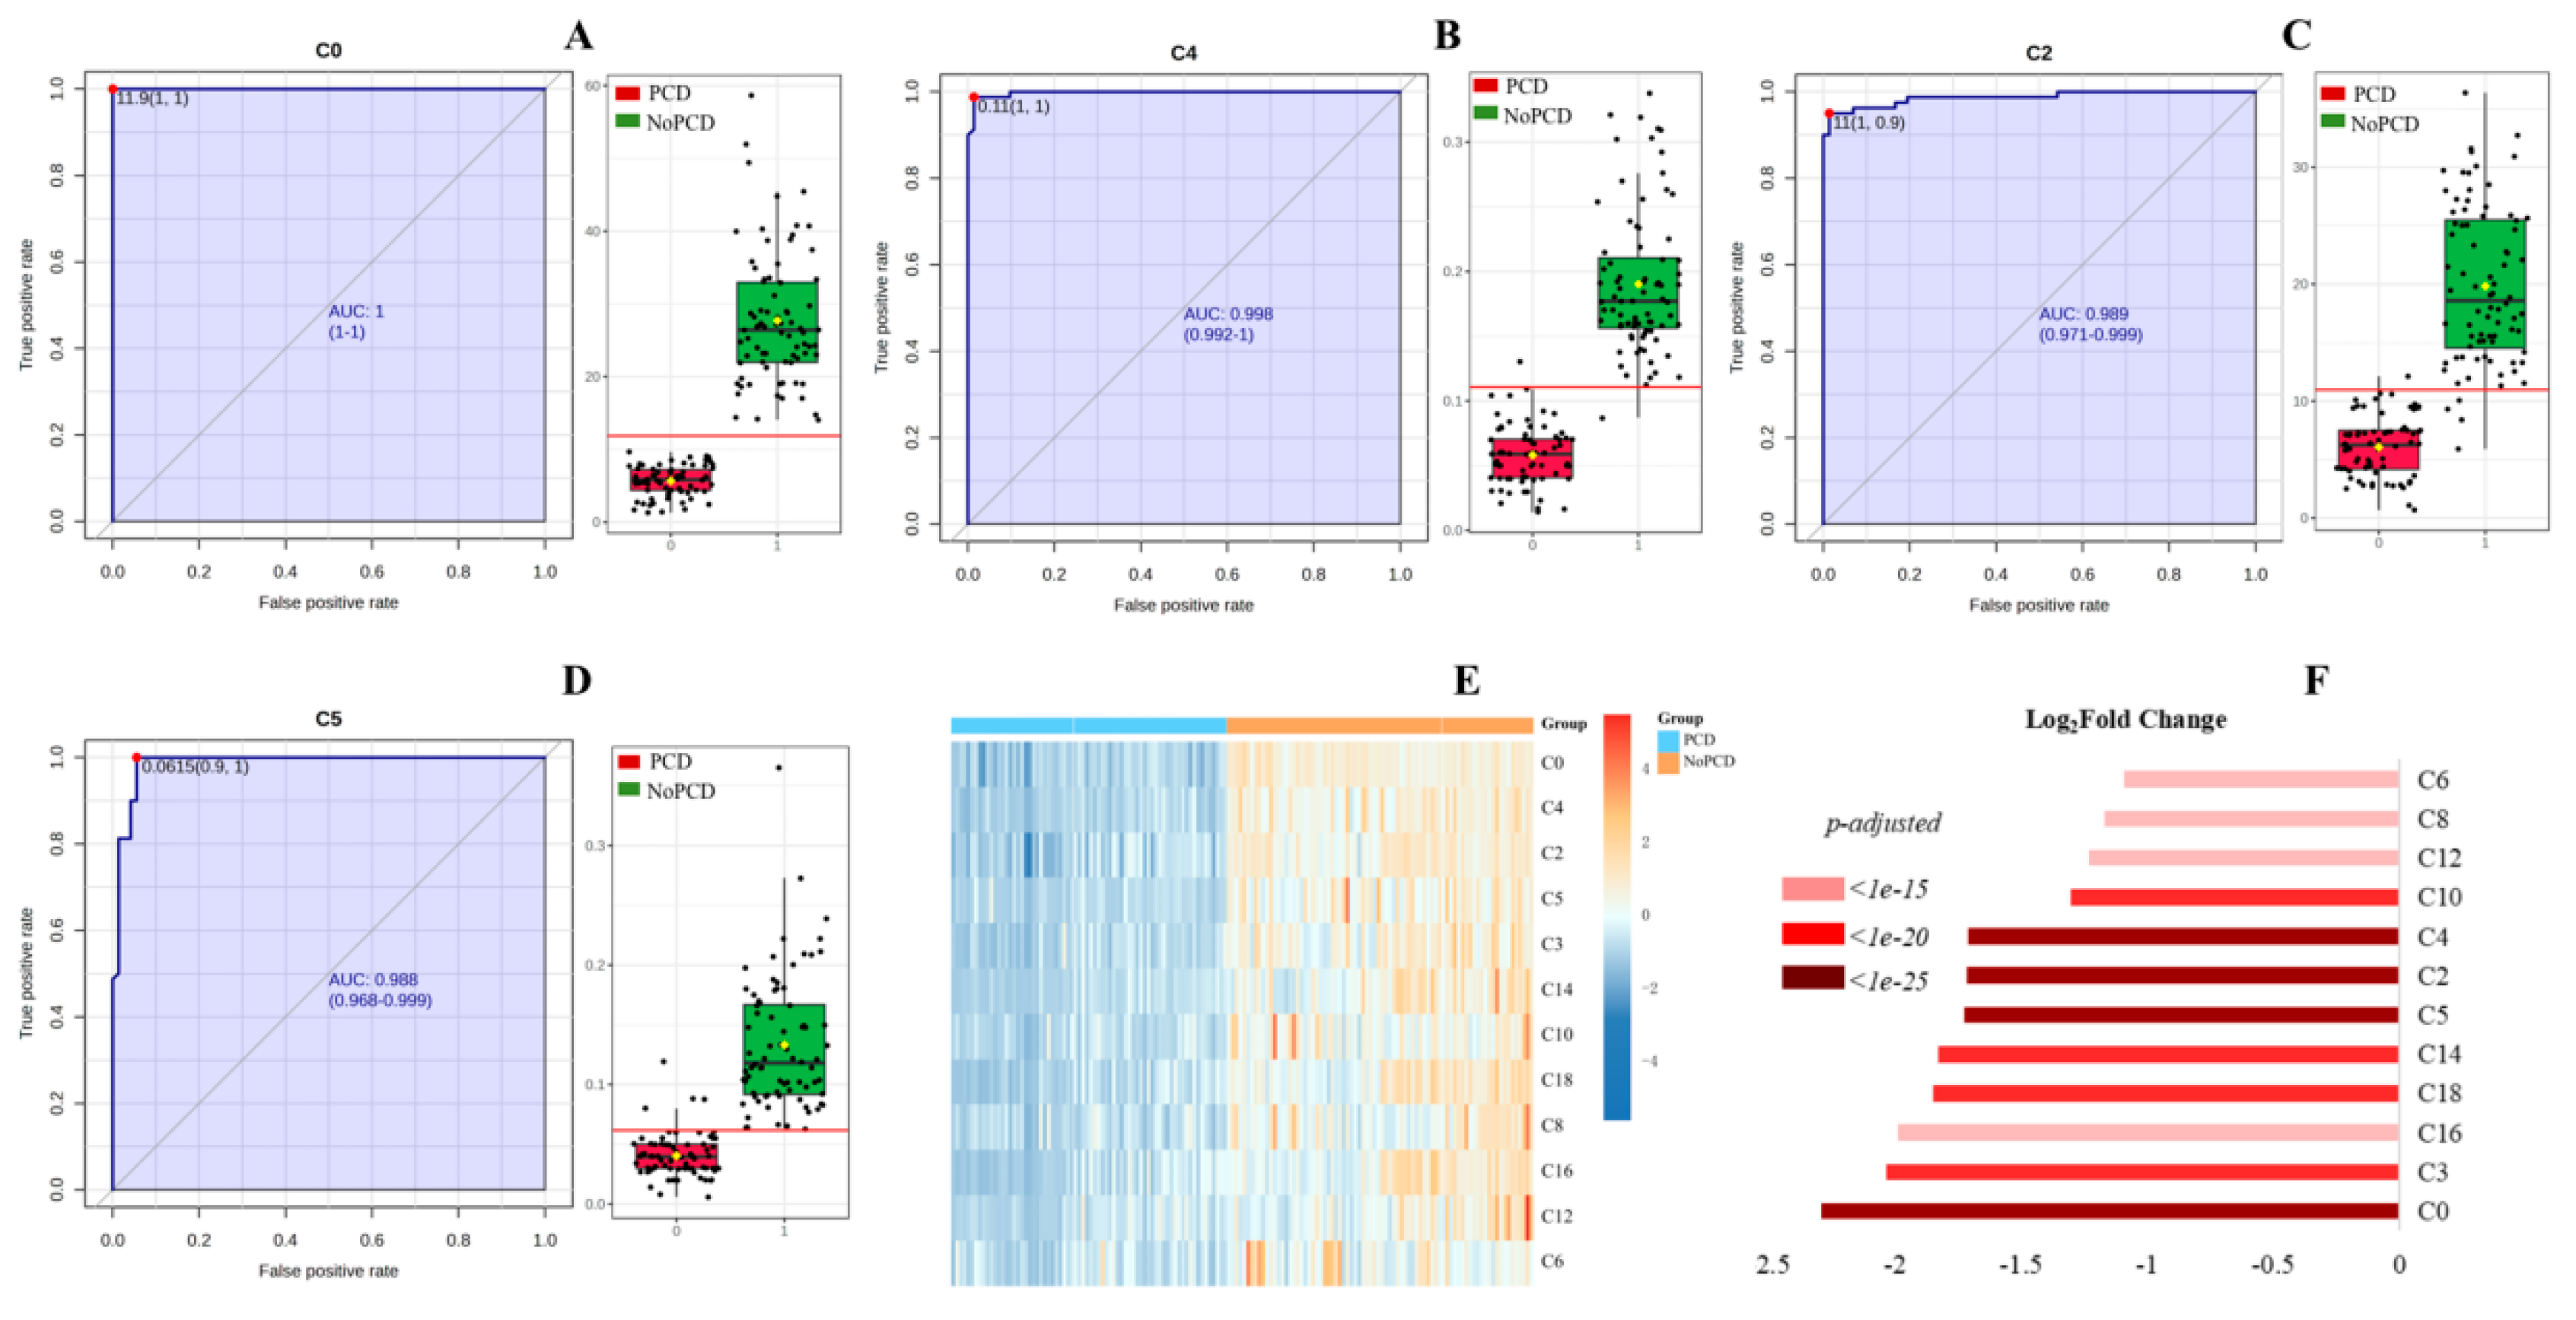
Figure 2.
Average important features obtained from multivariate ROC curve based exploratory analysis and the corresponding ROC curves of C5, C4 and C2. (A) linear surport vector machine-Linear SVM. (B) random forest-RF. (C) partial least square-discriminant analysis-PLS-DA. AUC, area under the curve; C2, acetylcarnitine; C3, propionylcarnitine; C4, butyrylcarnitine; C5, isovalerylcarnitine; C6, caproylcarnitine; C8, caprylylcarnitine; C10, actinylcarnitine, C12, lauroylcarnitine; C14, myristoylcarnitine; C16, palmitoylcarnitine; C18, octadecylcarnitine.
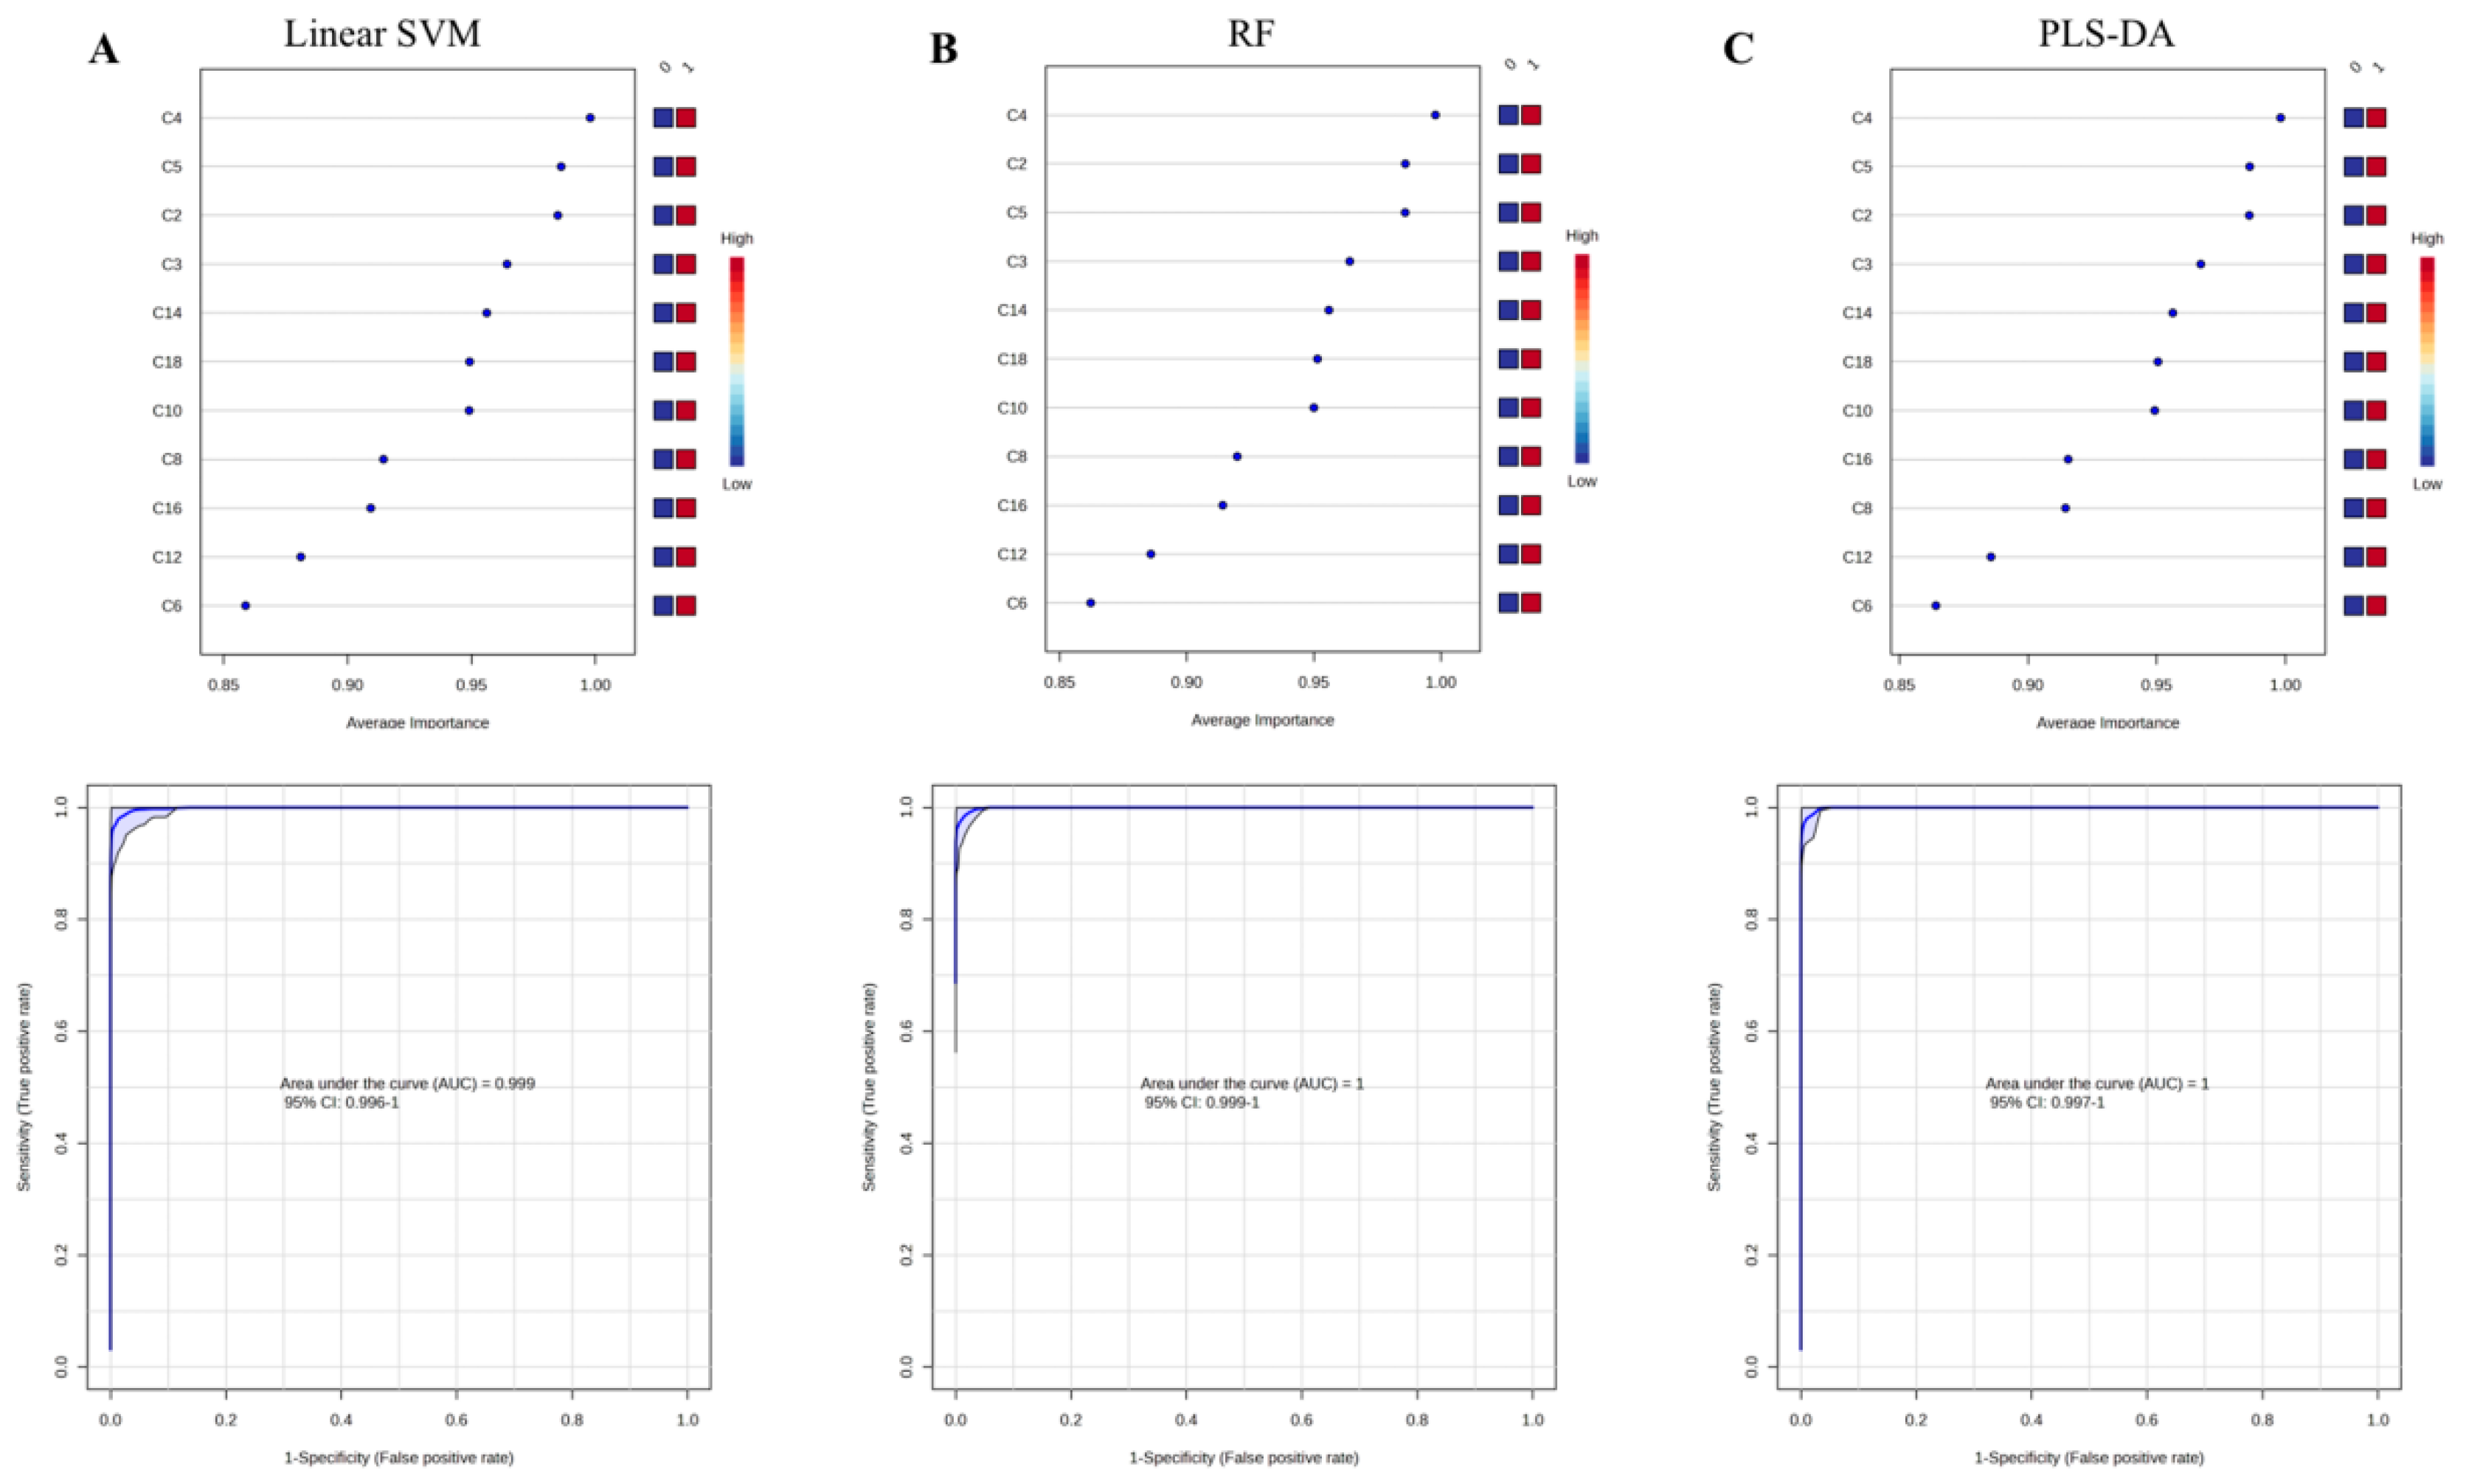
Figure 3.
ROC curves and box plots of (A) C4+C5, (B) C4+C5+C14, (C) C4+C14, and (D) C5+C14. The notch indicates the 95% confidence interval around the median of each group. The optimal cutoff is indicated with a horizontal red line on the boxplot. The mean concentration of each group is indicated with a yellow diamond. (E) cluster heatmap and (F) fold changes of specific various acylcarnitines summations in dried blood specimens from PCDs and NoPCDs. PCD, primary carnitine deficiency; ROC, receiver operator characteristic; AUC, area under the curve; C2, acetylcarnitine; C3, propionylcarnitine; C4, butyrylcarnitine; C5, isovalerylcarnitine; C14, myristoylcarnitine; C16, palmitoylcarnitine.
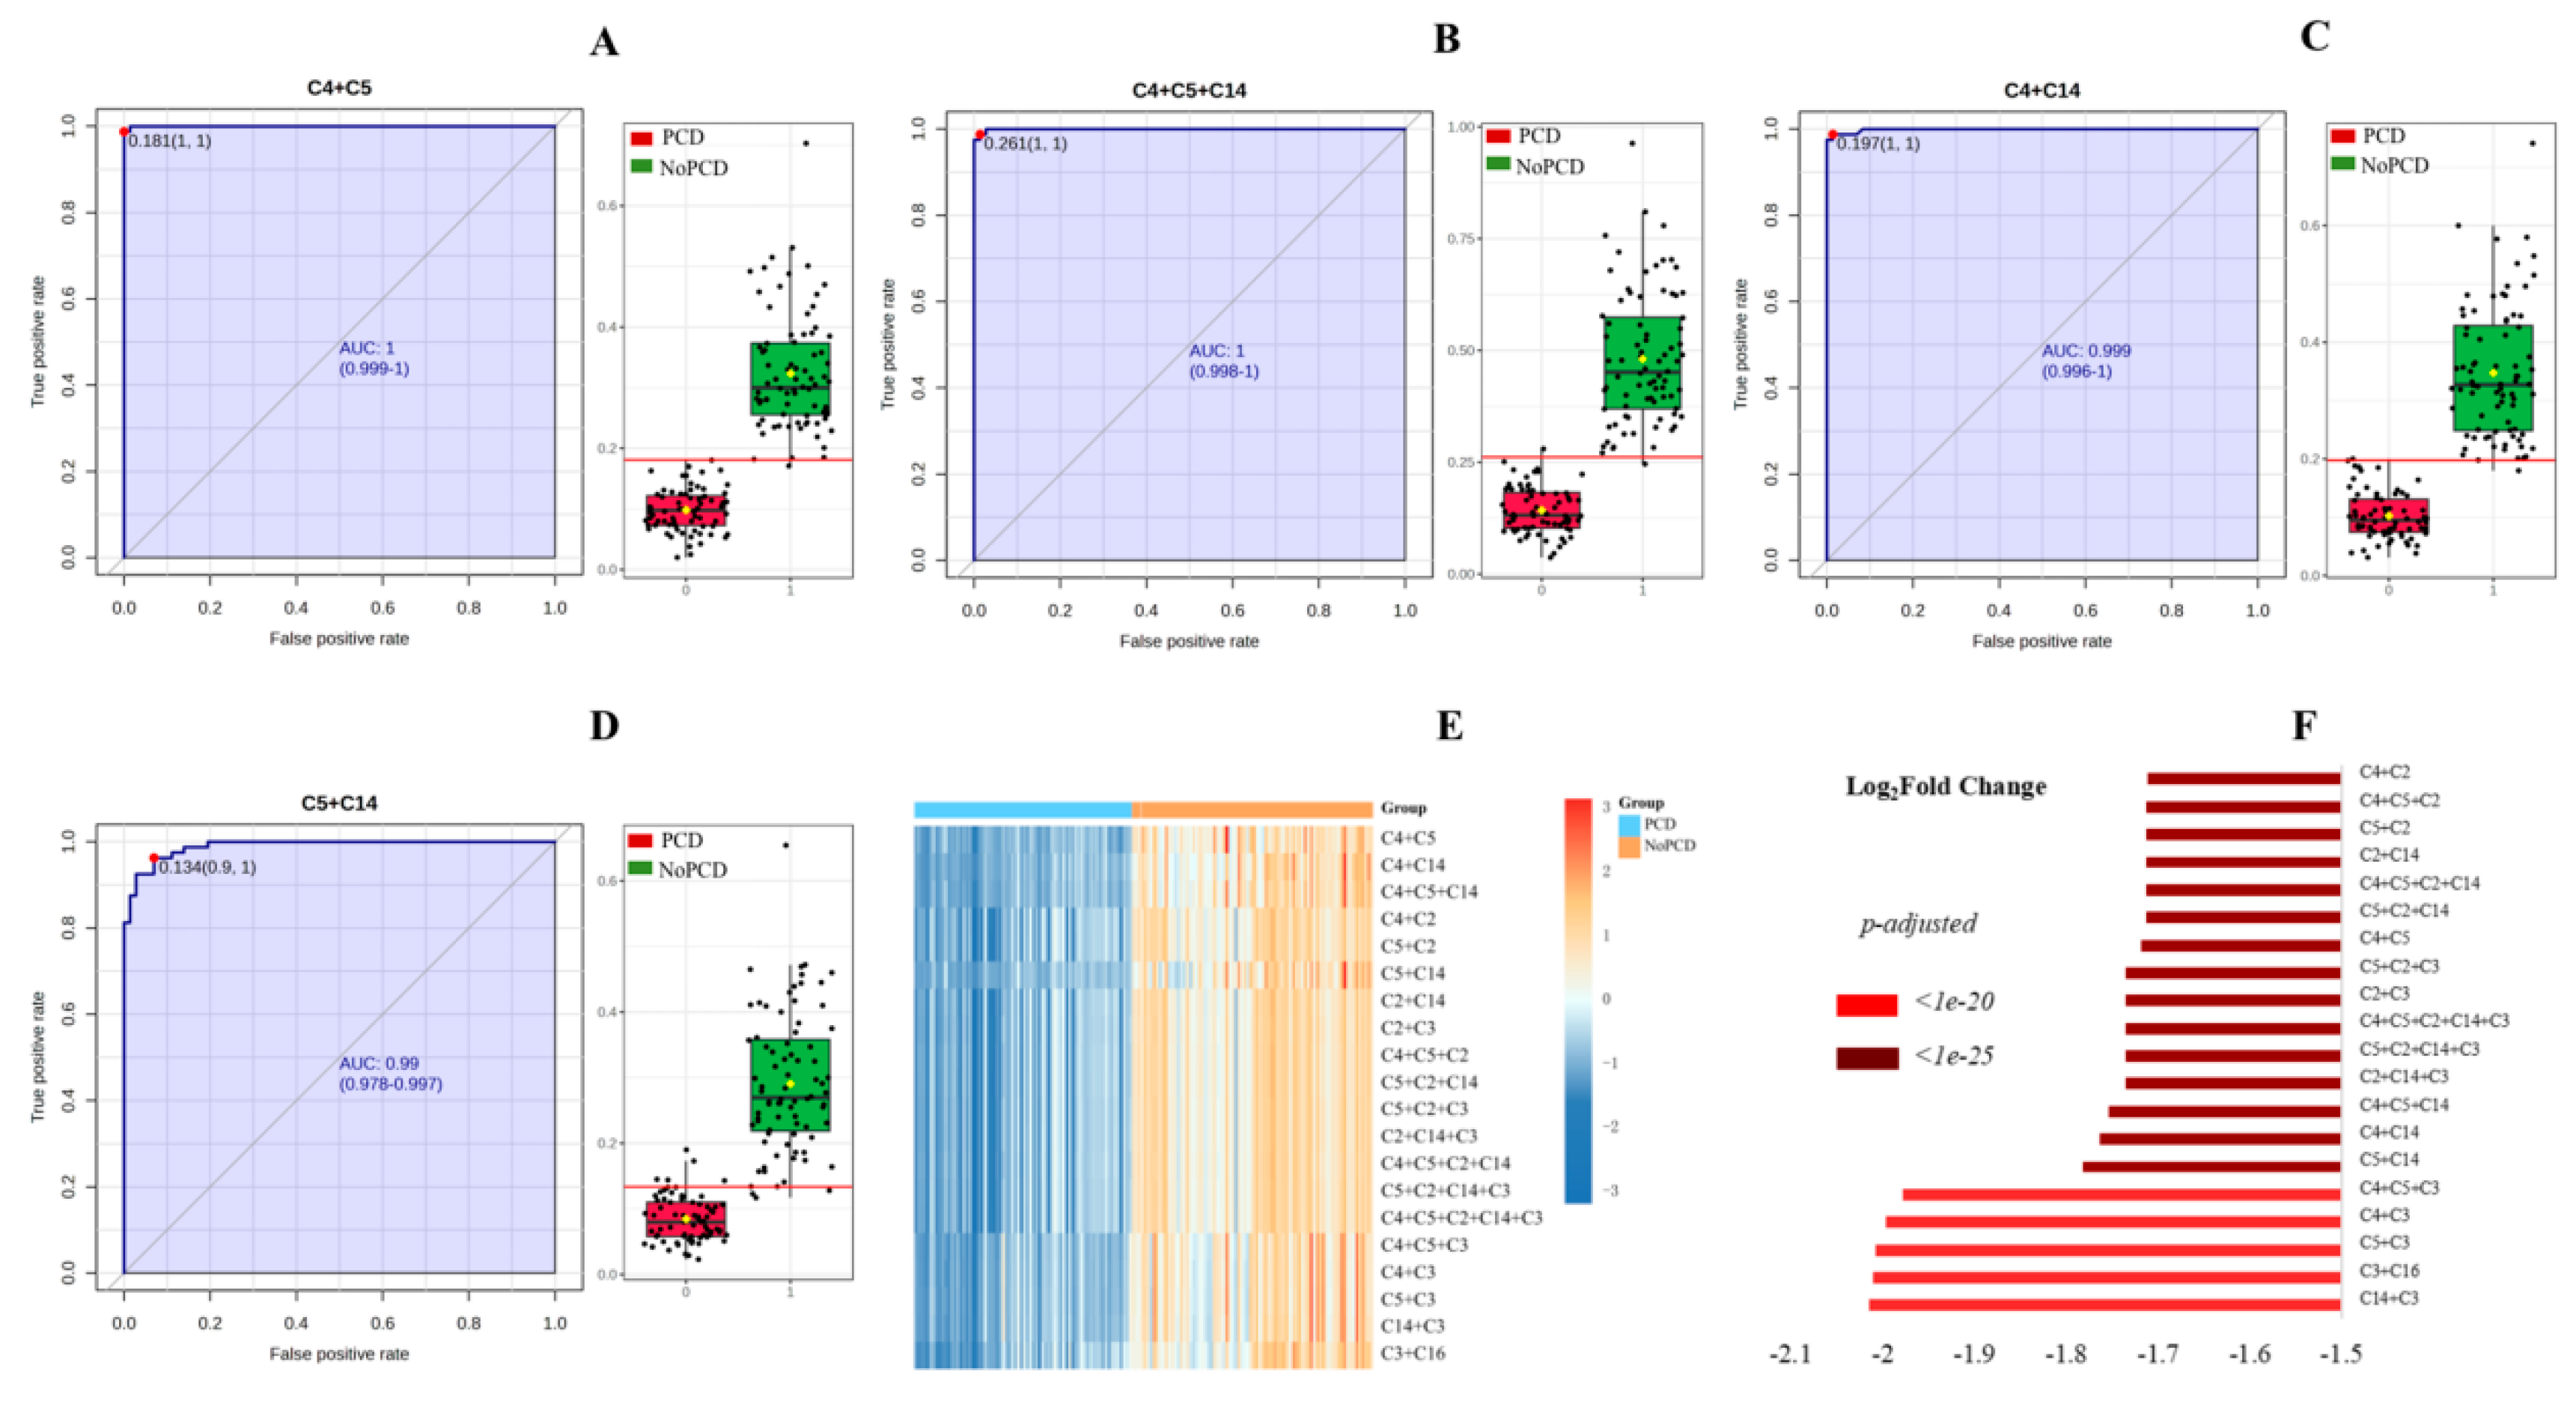

Table 1.
ROC analysis of free carnitine and specific acylcarnitines levels in dried blood specimens.
Table 1.
ROC analysis of free carnitine and specific acylcarnitines levels in dried blood specimens.
| Characteristic | Free Carnitine and Acylcarnitine | |||||||||||
|---|---|---|---|---|---|---|---|---|---|---|---|---|
| C0 | C2 | C3 | C4 | C5 | C6 | C8 | C10 | C12 | C14 | C16 | C18 | |
| AUC (%) | 100.000 | 98.715 | 96.753 | 99.792 | 98.620 | 86.623 | 92.274 | 95.200 | 88.168 | 95.738 | 91.319 | 95.095 |
| Best Cut-off Value (μmol/L) | 11.854 | 10.973 | 0.882 | 0.111 | 0.063 | 0.043 | 0.035 | 0.042 | 0.046 | 0.077 | 0.583 | 0.305 |
| Sensitivity (%) | 100.000 | 98.611 | 95.833 | 98.611 | 94.444 | 76.389 | 75.000 | 81.944 | 83.333 | 91.667 | 72.222 | 83.333 |
| Specificity (%) | 100.000 | 95.000 | 85.000 | 98.750 | 100.000 | 82.500 | 97.500 | 96.250 | 78.750 | 87.500 | 95.000 | 91.250 |
| Negative Predictive Value (%) | 100.000 | 98.701 | 95.775 | 98.750 | 95.238 | 79.518 | 81.250 | 85.556 | 84.000 | 92.105 | 79.167 | 85.882 |
| Positive Predictive Value (%) | 100.000 | 94.667 | 85.185 | 98.611 | 100.000 | 79.710 | 96.429 | 95.161 | 77.922 | 86.842 | 92.857 | 89.552 |
| Accuracy (%) | 100.000 | 96.711 | 90.132 | 98.684 | 97.368 | 79.605 | 86.842 | 89.474 | 80.921 | 89.474 | 84.211 | 87.500 |
AUC, area under the curve; C0, carnitine; C2, acetylcarnitine; C3, propionylcarnitine; C4, butyrylcarnitine; C5, isovalerylcarnitine; C6, caproylcarnitine; C8, caprylylcarnitine; C10, actinylcarnitine, C12, lauroylcarnitine; C14, myristoylcarnitine; C16, palmitoylcarnitine; C18, octadecylcarnitine.
Table 2.
ROC analysis of specific various acylcarnitines summations in dried blood specimens.
| Acylcarnitines summations | AUC (%) | Best Cut-off Value (μmol/L) | Sensitivity (%) | Specificity (%) | Negative Predictive Value (%) | Positive Predictive Value (%) | Accuracy (%) |
|---|---|---|---|---|---|---|---|
| C4+C5 | 99.983 | 0.181 | 100.000 | 98.750 | 100.000 | 98.630 | 99.342 |
| C4+C5+C14 | 99.948 | 0.281 | 100.000 | 97.500 | 100.000 | 97.297 | 98.684 |
| C4+C14 | 99.887 | 0.201 | 100.000 | 97.500 | 100.000 | 97.297 | 98.684 |
| C5+C14 | 98.958 | 0.151 | 97.222 | 92.500 | 97.368 | 92.105 | 94.737 |
| C4+C5+C2+C14+C3 | 98.872 | 11.792 | 98.611 | 96.250 | 98.718 | 95.946 | 97.368 |
| C5+C2+C3 | 98.854 | 11.598 | 98.611 | 96.250 | 98.718 | 95.946 | 97.368 |
| C4+C5+C2+C14 | 98.837 | 11.201 | 98.611 | 95.000 | 98.701 | 94.667 | 96.711 |
| C5+C2+C14+C3 | 98.837 | 11.691 | 98.611 | 96.250 | 98.718 | 95.946 | 97.368 |
| C2+C3 | 98.819 | 11.502 | 98.611 | 96.250 | 98.718 | 95.946 | 97.368 |
| C4+C5+C2 | 98.811 | 11.117 | 98.611 | 95.000 | 98.701 | 94.667 | 96.711 |
| C2+C14+C3 | 98.811 | 11.595 | 98.611 | 96.250 | 98.718 | 95.946 | 97.368 |
| C5+C2 | 98.750 | 11.019 | 98.611 | 95.000 | 98.701 | 94.667 | 96.711 |
| C5+C2+C14 | 98.750 | 11.099 | 98.611 | 95.000 | 98.701 | 94.667 | 96.711 |
| C4+C2 | 98.733 | 11.070 | 98.611 | 95.000 | 98.701 | 94.667 | 96.711 |
| C2+C14 | 98.733 | 11.053 | 98.611 | 95.000 | 98.701 | 94.667 | 96.711 |
| C4+C5+C3 | 97.986 | 0.764 | 84.722 | 100.000 | 87.912 | 100.000 | 92.763 |
| C4+C3 | 97.457 | 0.984 | 95.833 | 87.500 | 95.890 | 87.342 | 91.447 |
| C5+C3 | 97.274 | 0.937 | 95.833 | 88.750 | 95.946 | 88.462 | 92.105 |
| C14+C3 | 97.083 | 0.961 | 95.833 | 86.250 | 95.833 | 86.250 | 90.789 |
| C3+C16 | 96.215 | 1.839 | 91.667 | 85.000 | 91.892 | 84.615 | 88.158 |
ROC, receiver operator characteristic; AUC, area under the curve; C2, acetylcarnitine; C3, propionylcarnitine; C4, butyrylcarnitine; C5, isovalerylcarnitine; C14, myristoylcarnitine; C16, palmitoylcarnitine.
Table 3.
Assesment of the C4+C5, C4+C5+C14, C4+C14 and C5+C14 summations using optimal cutoffs determined by ROC analysis.
Table 3.
Assesment of the C4+C5, C4+C5+C14, C4+C14 and C5+C14 summations using optimal cutoffs determined by ROC analysis.
| Indicator: C4+C5 < 0.181 μmol/L | Indicator: C4+C5+C14 < 0.281 μmol/L | |||||||||
| PCD | Data Available | Positive | Negative | Sensitivity | PCD | Data Available | Positive | Negative | Sensitivity | |
| 72 | 72 | 0 | 1 | 72 | 72 | 0 | 1 | |||
| NoPCD | Data Available | Positive | Negative | Specificity | NoPCD | Data Available | Positive | Negative | Specificity | |
| 80 | 1 | 79 | 0.988 | 80 | 2 | 78 | 0.975 | |||
| PCD + NoPCD | Positive predictive value | Negative predictive value | PCD + NoPCD | Positive predictive value | Negative predictive value | |||||
| 0.986 | 1 | 0.973 | 1 | |||||||
| Indicator: C4+C14 < 0.201 μmol/L | Indicator: C5+C14 < 0.151 μmol/L | |||||||||
| PCD | Data Available | Positive | Negative | Sensitivity | PCD | Data Available | Positive | Negative | Sensitivity | |
| 72 | 72 | 0 | 1 | 72 | 70 | 2 | 0.972 | |||
| NoPCD | Data Available | Positive | Negative | Specificity | NoPCD | Data Available | Positive | Negative | Specificity | |
| 80 | 2 | 78 | 0.975 | 80 | 6 | 74 | 0.925 | |||
| PCD + NoPCD | Positive predictive value | Negative predictive value | PCD + NoPCD | Positive predictive value | Negative predictive value | |||||
| 0.973 | 1 | 0.923 | 0.974 | |||||||
| Indicator: C3+C16 < 1.839 μmol/L | Indicator: C3+C16 < 2.000 μmol/L | |||||||||
| PCD | Data Available | Positive | Negative | Sensitivity | PCD | Data Available | Positive | Negative | Sensitivity | |
| 72 | 66 | 6 | 0.917 | 72 | 67 | 5 | 0.931 | |||
| NoPCD | Data Available | Positive | Negative | Specificity | NoPCD | Data Available | Positive | Negative | Specificity | |
| 80 | 12 | 68 | 0.850 | 80 | 17 | 63 | 0.788 | |||
| PCD + NoPCD | Positive predictive value | Negative predictive value | PCD + NoPCD | Positive predictive value | Negative predictive value | |||||
| 0.846 | 0.919 | 0.798 | 0.926 | |||||||
C3, propionylcarnitine; C4, butyrylcarnitine; C5, isovalerylcarnitine; C14, myristoylcarnitine; C16, palmitoylcarnitine.
Table 4.
Application of the C0 level and C4+C5 summation using optimal cutoffs determined by ROC analysis in NBS from 2021-2024.
Table 4.
Application of the C0 level and C4+C5 summation using optimal cutoffs determined by ROC analysis in NBS from 2021-2024.
| Indicators ( μmol/L) | Screening Positive(N) | Recall (N) | Recall Negative (N) | Recall Positive (N) | Confirmed (N) | Positive Predictive Value (%) |
|---|---|---|---|---|---|---|
| C0 < 10 | 400 | 376 | 256 | 120 | 3 | 0.75 |
| C0 < 10 & C4+C5 < 0.181 | 195 | 185 | 123 | 62 | 3 | 1.54 |
| C0 < 10 & C4+C5 > 0.181 | 205 | 188 | 133 | 55 | 0 | NA |
| 9 < C0 < 10 & C4+C5 > 0.181 | 92 | 88 | 67 | 21 | 0 | NA |
| 8.5 < C0 < 10 & C4+C5 < 0.181 | 83 | 76 | 58 | 18 | 2 | NA |
ROC, receiver operator characteristic; C0, carnitine; C4, butyrylcarnitine; C5, isovalerylcarnitine.
Disclaimer/Publisher’s Note: The statements, opinions and data contained in all publications are solely those of the individual author(s) and contributor(s) and not of MDPI and/or the editor(s). MDPI and/or the editor(s) disclaim responsibility for any injury to people or property resulting from any ideas, methods, instructions or products referred to in the content. |
© 2025 by the authors. Licensee MDPI, Basel, Switzerland. This article is an open access article distributed under the terms and conditions of the Creative Commons Attribution (CC BY) license (http://creativecommons.org/licenses/by/4.0/).
Copyright: This open access article is published under a Creative Commons CC BY 4.0 license, which permit the free download, distribution, and reuse, provided that the author and preprint are cited in any reuse.


