
Submitted:
12 April 2025
Posted:
15 April 2025
You are already at the latest version
Preprints on COVID-19 and SARS-CoV-2
Abstract
This research offers an in-depth examination of the financial consequences of the COVID-19 pandemic in Italy for small and medium-sized Food and Beverages Processing enterprises (SMEs) operating in the food and beverage sector. Leveraging financial and managerial data from the AIDA database, the study investigates both the immediate disruptions caused by the health crisis and the recovery patterns observed in its aftermath, aiming to clarify the sector's resilience and vulnerabilities.The analysis draws on an original sample of 1,600 SMEs, observed over a five-year span (2019–2022), with classifications based on firm size and geographical distribution. A range of financial performance indicators—including Return on Equity (ROE), Return on Investment (ROI), debt ratio, and production value per employee—was used to assess the evolution of corporate health before, during, and after the pandemic.The findings show a substantial downturn in profitability in 2020, with ROE plummeting most sharply in northern Italy (–147%), while southern areas and islands were less severely affected (–49%). ROI patterns revealed strained investment efficiency, with incomplete recovery by 2022. The debt ratio exceeded 70% during the height of the crisis, indicating strong reliance on external funding, although signs of gradual improvement emerged in 2023—especially among firms in the north. EBITDA, after contracting by 10% in 2020, experienced a significant rebound the following year, despite rising production costs, such as an 8.3% increase in labor expenses by 2022.A deeper examination reveals that smaller firms faced the greatest pressures during the crisis but demonstrated notable recovery potential by the end of the observation period. The strength of enterprises in northern Italy—both in terms of capital structure and post-pandemic resilience—underscores the role of regional factors in shaping economic recovery. The study ultimately highlights significant disparities in performance by firm size and location, emphasizing the need for targeted policies that promote long-term financial sustainability and improve sectoral preparedness for future shocks.
Keywords:
Food and Beverage processing
; Small Medium Industries
; post-pandemic recovery
; Italy
; COVID-19
; resilience
1. Introduction
The food and beverage processing industry (hereafter, FBP) is defined by the Eu as the industry that transforms agricultural products into food or beverages and plays a crucial role in ensuring food security, economic stability, and sustainable development within the EU. FBP also contributes to nearly a quarter of the country’s GDP, and it is considered a ‘stable employer and a key job provider’ confirming its strategic relevance within the manufacturing landscape. FBP is a prominent contributor to the industrial system of the European Community – along with other manufacturing sectors such as the automotive and industrial equipment (data and trend’ report, 2024 edition, www.fooddrinkeurope.eu).
As shown in Figure 1, the sector comprises approximately 304,000 enterprises and employs around 4.7 million individuals, making it the leading manufacturing industry in terms of employment. Contributing €249 billion annually in added value, the sector is primarily driven by small and medium-sized enterprises (SMEs), which represent 99% of the total and maintain strong ties to their local territories and communities. This upward trend has been sustained over several years, supported by continuous investment in modernization and innovation. Capital expenditures are primarily allocated to advanced machinery, updated equipment, infrastructure for agricultural use, and renewable energy systems—with the latter representing the most rapidly expanding area of interest for both public and private stakeholders.
For it answer the physiological needs of people, FBP production has a more uniform development than the other manufacturing sectors; nevertheless, it witnessed a sharp decline due to the pandemic, and the consequent lockdown’ demand fall. In this landscape, SMEs play a leading role: 99,2% of the whole FBP is made of small and medium industries (300.000 companies out of 304.000), providing half of the jobs and around 40% of the turnover (www.fooddrinkeurope.eu).
In Italy, FBP is the third sector for employment in manufacturing, with a turnover of €179,4 billion in 2022 for 52.414 companies; as of 2023, the industry reached a turnover of approximately €193 billion, accounting for 15.6% of the total manufacturing output, thereby confirming its position as one of the most vital and resilient segments of the national productive system. During the first ten months of 2024, food exports reached a record high of €47.4 billion—marking a 9% increase over 2023 and a remarkable 56.3% growth over the last five years (www.s-ge.com)– increasing both production volume (+1.4%) and value added (+3.5%).
Between 2015 and 2023, the sector experienced a cumulative revenue growth of 42.3%, underscoring its structural expansion and long-term development potential (Fondazione Metes, 2023). This performance is the result of a stable and positive trend throughout the pre-pandemic years, followed by an even more accelerated expansion during the post-COVID recovery phase.
The following Figure 1 presents the evolution of the industry’s revenue index over the observed period, disaggregated into contributions from the domestic and international markets. While domestic demand maintained a relatively steady progression, the international component emerged as the primary growth driver, with export revenues rising by 72.1% in 2023 compared to 2015. This remarkable increase highlights the growing competitiveness and internationalization of Italian food and beverage enterprises, which have increasingly succeeded in positioning their products in foreign markets.
The chart not only confirms the consistent upward trajectory of the sector’s revenues, but also reveals two important dynamics: a gradual, sustained growth during the initial years, and a clear acceleration following the pandemic. The latter can be interpreted as both a sign of recovery and a transformation of market strategies, with firms increasingly focusing on innovation, product quality, and global market integration.
This evolution is also reflected in the financial performance of SMEs within the industry, many of which managed to adapt quickly to external shocks by reorganizing production models and investing in digitalization, supply chain optimization, and export channels. The synergy between these internal transformations and external market opportunities has made the Italian food and beverage industry a case study in resilience, strategic agility, and regional competitiveness.
According to the most recent sector data (2022, just after the Pandemic emerged) for Italy, the food and beverage sector count 52,414 active businesses (with approximately 468,000 workers – employees count for 85% of whom). Enterprises with less than 10 employees (so called Micro-enterprises) represent approximately 85% of all businesses in Italy and provide employment to 28.5% of the national workforce. In contrast, large enterprises—those with 250 or more employees—are relatively rare, comprising less than 2% of all companies, according to data from the Italian National Institute of Statistics (ISTAT, www.istat.it).
Some recent studies help to explain the resilience of food supply chains and industries to various disruptions (such as pandemics or geopolitical crises) through data observation of a panel of food firms (for instance, Costa et al, 2024 use data from 120 food firms, to demonstrate that Lean and Lean Six Sigma practices significantly contribute to adaptive performance and operational continuity.
To better understand the internal dynamics of the food and beverage industry — this study concentrates on the specific characteristics of the industries of small and medium size (SMIs): Academic literature describes SMEs as more adaptable and resilient in the face of market disruptions than the large ones (Zutshi et al., 2021). The analysis draws on financial performance data from Italian SMEs in this sector, with the aim of assessing the economic impact of the COVID-19 pandemic and identifying patterns of recovery in the years that followed.
2. Methodology
This research is based on financial data from an original sample of 1,600 small and medium-sized enterprises (SMEs) operating in the Italian food and beverage sector. The selection was carried out in collaboration with the national association representing the agri-food industry SMEs (www.unionalimentari.it). The dataset, drawn from the AIDA database, spans a five-year period (2019–2023), enabling a comparative assessment of the pre-pandemic period, the COVID-19 crisis, and the subsequent recovery phase. As 2023 dataset is particularly fragmented at the time of this analysis, the study will consider the 2019-2022 period.
To provide a well-rounded view of the sector, the sample is segmented according to firm size and geographical distribution. To simplify our analysis, the Italian Region are divided into in three main areas– The North includes the regions of Aosta Valley, Piedmont, Liguria, Lombardy, Trentino, Veneto, Friuli and Emilia Romagna; the South encompasses the southern regions and the islands, namely Abruzzo, Molise, Campania, Apulia, Basilicata, Sicily and Sardinia. The Central area, according to the classification adopted—which aligns with the standard regional breakdowns used in national ISTAT surveys—comprises a smaller number of regions: Marche, Lazio, Tuscany and Umbria.
As illustrated in Table 2, approximately 55% of the firms have fewer than five employees, while 58% of the businesses placed in Southern and Islands. A significant concentration of companies is observed in Campania, Puglia, and Sicily, highlighting the regional dimension of the sector and its relevance in southern territories.
The analysis is guided by a central research question: Has the COVID-19 period weakened SMEs? Secondly, we aim to investigate whether significant differences emerge across categories—specifically, in the performance of small versus medium-sized enterprises, and across different geographical areas.
The study is structured in two main parts to provide a comprehensive overview of the performance of the companies in the sample. The first part focuses on outlining the trends of key financial indicators over the 2019–2022 period, disaggregated by both geographical area (three macro-regions) and company size:
- ROE (Return on Equity)
- ROI (Return on Investment)
- Debt Ratio
- EBIDTA
The work intends to provide a comprehensive view of the industry during the period under examination: for this reason, the financial indicators analysis should also incorporate the employee dynamics as a key measure of business development over time.
Trend analysis was carried out through the application of statistical and regression techniques to uncover patterns of resilience over time. To enhance the reliability of the results and avoid distortions in average values, certain data refinements were implemented. Specifically, outlier values were excluded from the sample using the standard deviation method. This approach aligns with methodologies commonly adopted by Italian public institutions, such as Unioncamere Lombardia in its regional economic analyses. It was preferred over the Interquartile Range (IQR) method, which tends to eliminate a larger number of data points, potentially reducing sample robustness. The use of standard deviation also ensures consistency with officially recognized regional evaluation practices.
From an interpretive standpoint, the analysis of selected indicators revealed atypical results within the subgroup of firms with more than 50 employees. These irregularities are primarily attributable to the limited presence of such firms in the dataset, as they represent only 3% of the total sample.
3. Results
The results of the analysis for each indicator are detailed in the following paragraphs.
Data examination makes clear the challenges of 2020 are evident and clearly reflected in the sharp decline of the first index under exam, ROE index, across all firm categories and regions. The following Table 3 reports the average index by firm size and area. A brief recovery began at the end of 2020 and continued through 2021, the momentum slowed markedly in 2022. This deceleration can be partly attributed to external pressures, including soaring input costs and significant volatility in energy markets.
The most pronounced contraction occurred in Northern Italy, where the average ROE fell by 147% in 2020, resulting in negative profitability levels. Conversely, firms based in Southern Italy — which comprise 55% of the total sample—demonstrated relatively stronger return on capital throughout the period. In fact, the data suggest that the South consistently outperformed the North in terms of ROE, maintaining a more favorable investment return environment despite broader macroeconomic stressors.
Interestingly, the profitability-divide between the North and South remained fairly stable across the four-year span, with both regions following parallel trends. When evaluating performance by firm size, the results reveal a nuanced picture. While smaller enterprises were more vulnerable to the economic disruptions caused by the pandemic, larger firms showed a higher degree of resilience, better withstanding market shocks and preserving financial returns more effectively.
Table 4 focus on ROI (Return on Investments), and it highlight an overall deterioration in ROI over the four-year observation period. Geographically, ROI trends reflect those observed for ROE in both Northern and Southern Italy including the islands—showing inefficiencies that emerged in 2020, followed by a recovery in the subsequent two years. However, this recovery remains insufficient to restore pre-COVID levels and even declines again in 2022. The Center appears consistently inefficient, with positive but very low ROI values only in 2019, and negative values in the following three years—with a notable decline in 2021.
The breakdown of ROI across different firm size categories yields particularly valuable insights. A clear pattern emerges: the larger the company, the greater its capacity to withstand external economic shocks. The sample can broadly be divided into two major groups. On one hand, smaller enterprises—those employing up to 15 people and constituting approximately 83% of the total sample—were hit hardest by the downturn in 2020. However, these firms demonstrated a remarkable rebound in 2021, with recovery continuing into 2022, though with varying trajectories between micro and small firms. Despite this rebound, overall profitability for these groups remained low in absolute terms. In fact, the smallest firms only returned to a positive ROI in the final year of observation, following two particularly challenging years.
On the other hand, firms with more than 15 employees—representing roughly 17% of the sample—exhibited a different dynamic. These larger companies, although more resilient initially, showed a gradual decline in their investment returns. Over time, their ROI approached critical levels, signaling a substantial weakening in their ability to generate value from business investments. This erosion is particularly concerning, as it nears the break-even point where investment activity ceases to yield tangible economic benefits.
The debt ratio, calculated as the ratio of total liabilities to equity, offers a dynamic measure of financial leverage and exposure to third-party capital. Table 5 provides the average debt ratios for each firm category, highlighting structural financial dependencies across size groups.
A lower debt ratio is generally associated with stronger financial stability, as it reflects limited reliance on external sources of financing. While a ratio between 25% and 50% is typically seen as optimal, exceeding this range often signals a growing dependence on borrowed capital. In the case of the businesses under analysis—particularly within the food and beverage sector—the data outlined in the accompanying table show a consistently high reliance on debt financing. Throughout the period examined, debt levels remained elevated, with ratios surpassing 70% across the board and peaking above 80% in Central Italy during the 2020–2021 period.
Although the pandemic brought increased attention to the sector’s structural reliance on external capital, no substantial improvement in financial independence was observed. On the contrary, overlapping crises undermined firms’ capacity to reduce their financial leverage. Large enterprises initially managed to lower their debt exposure, but this progress was partially reversed by 2022. Regionally, firms in Northern Italy experienced a moderate but steady increase in debt levels, yet remained more financially balanced than other areas. In contrast, the South and the Islands demonstrated more consistent debt patterns, even outperforming the North in 2022. Central Italy remained the most financially strained region, especially during 2020 and 2021, although early signs of recovery emerged in 2023, starting from a position of high indebtedness.
Looking at firm size, the data underline the heightened financial fragility of smaller enterprises. Micro-firms experienced a significant rise in debt levels in 2020, pointing to a heavier reliance on credit to cope with the crisis. However, gradual improvements were observed over the following two years, suggesting efforts to regain financial equilibrium. Medium and larger enterprises displayed greater stability in debt levels, showing a notable reduction in 2020. Yet, this positive trend was reversed in 2021, with leverage returning to levels seen before the pandemic. Although a slight improvement was recorded again in 2022, it was insufficient to mark a clear shift toward financial consolidation.
EBITDA is the last indicator examined in this analysis. It measures the ability of a firm's core operations to generate profitability, excluding the effects of interest, taxes, depreciation, and amortization. The indicator is first presented as an average value per category, calculated across all firms within each group. Subsequently, it is expressed as unit EBITDA, derived as the average per-employee EBITDA value within each company and aggregated by firm size or regional category.
Average EBITDA experienced a notable decline across all firm sizes and geographic areas in 2020 but showed a complete rebound by 2021, with continued growth into 2022. The figures for 2022 are particularly relevant, as they signal a phase of stabilization following the sharp recovery of 2021—a year similar to 2020 results and that was characterized by strong efforts to close the pre-pandemic performance gap and by persistent inflationary pressures that extended into the following year.
EBITDA performance is also closely linked to labor dynamics. Between 2019 and 2022, the sector recorded a 23% increase in employment at the national level. These developments are further detailed in Table 6, which breaks down employment trends across different firm categories.
Northern Italy shows the strongest employment growth, with a 23,4% increase in 2019-2022, likely reflecting its higher firm density and earlier access to recovery measures. The South and Islands, and the Center, experienced a good expansion, albeit slightly less than the North, confirming resilience among smaller and mid-sized firms. In detail, the Center shows more modest growth, consistent with prior findings indicating financial fragility and higher debt exposure in this area.
Also, the highest employment growth occurred in large enterprises (50+ employees) with a 37.3% increase, indicating their significant contribution to post-pandemic job recovery. Medium-sized firms (16–50 employees) also expanded steadily, reflecting stable growth capacity. Micro and small enterprises (1–15 employees) appear to be the most fragile, with a slower growth (around 10% as the two categories average), possibly due to more limited financial and structural resources during recovery.
If the number of employees rose, so did the cost for workers, due to a huge inflation rate in the Country: companies granted annual wage increases (6.5% nationwide on average, between 2019 and 2022). Such a rise had a significant negative impact on the EBIDTA. For a better understanding of the trend under exam considering the above-mentioned reasons, the following table presents EBITDA per employee.
Table 7 illustrates a consistent improvement among smaller firms—particularly those with 1 to 15 employees—highlighting their relative adaptability and operational resilience. In contrast, larger enterprises, especially those employing more than 50 workers, encountered greater difficulties in 2022, likely influenced by inflexible cost structures and heightened inflationary pressures. On a regional level, Northern Italy maintained its leadership position, while the South and Islands began to show signs of strain following an initially stable recovery.
The financial overview is further enriched by an analysis of workforce dynamics. Although the dataset’s average firm size was previously discussed, Table 8 expands on this by tracing annual and cumulative trends in human resource growth between 2019 and 2022. The data indicate that smaller enterprises, despite being the most impacted by the 2020 health crisis, recorded the most significant employment gains over the full period—an average increase of 24%. This trend underscores their gradual but sustained recovery. In comparison, larger firms undertook more aggressive hiring between 2020 and 2021, reflecting a rapid response in the immediate post-crisis phase.
This table reveals a strong post-COVID labor market rebound, especially in Southern Italy both among very small and very large enterprises. Smaller firms are showing resilience and adaptive growth, while larger firms remain key drivers of employment expansion, despite recent stabilization. Medium-sized firms appear to be more cautious, reflecting greater sensitivity to cost and economic fluctuations.
4. Findings
The results reveal marked differences in performance across both regions and firm sizes within the sample. Financial indicators, particularly Return on Equity (ROE) and Return on Investment (ROI), reflect the profound impact of the 2020 economic shock. ROE declined sharply—most notably in Northern Italy, where it fell by 147%, yielding negative returns. Although a partial recovery occurred in 2021, particularly among micro-enterprises (1–5 employees), the rebound was not evenly distributed. Southern Italy, while initially less impacted, demonstrated comparatively stronger performance over time, with ROE returning to pre-pandemic levels by 2022. Firm size proved a significant factor: larger companies (50+ employees) showed greater resilience at first but experienced a decline in return on investment in later years, whereas smaller firms progressively regained profitability, albeit from a lower base.
The ROI trends supported these observations, indicating that most firm categories improved after 2020. However, only medium-sized enterprises (16–50 employees) sustained consistently positive ROI throughout the observed period. A notable exception emerged in Central Italy, where ROI remained negative for three consecutive years—underscoring persistent challenges within that region.
Debt ratio data reinforced concerns regarding financial fragility. In all categories, debt levels exceeded 70%, peaking above 80% in Central Italy during 2020–2021. This highlights a structural dependence on external financing. By 2022, companies in the North exhibited signs of improvement in managing financial leverage, while Central Italy continued to show high vulnerability. Smaller enterprises, despite some progress, still faced significant financial pressure.
The EBITDA analysis provided further insight into operational performance. The sector experienced a pronounced contraction in 2020, followed by a gradual recovery in 2021 and relative stabilization in 2022. Nonetheless, rising labor costs—averaging +6.5% between 2019 and 2022, with a peak of +8.3% in 2022—negatively influenced EBITDA per employee. Micro-enterprises (1–5 employees) showed steady improvement in per-capita EBITDA, signaling adaptability and control over operating costs. In contrast, larger firms (50+ employees), despite higher overall efficiency, saw a sharp decline in EBITDA per employee in 2022—possibly due to rigid cost structures and limited flexibility in responding to inflationary pressures.
Labor dynamics further contextualize the financial narrative. Between 2019 and 2023, employment grew significantly across all firm sizes, with the South and micro-enterprises showing the highest cumulative increases (+25% and +24%, respectively). Interestingly, larger firms (50+ employees) also expanded their workforce by 38%, reaffirming their role in job creation. Meanwhile, medium-sized firms (6–50 employees) adopted a more cautious expansion strategy, likely reflecting tighter financial margins and investment constraints.
Overall, the data highlight a recovery marked by resilience but also deepening asymmetries based on geography and firm size. Micro-enterprises, though initially more vulnerable, exhibited promising recovery trajectories. Larger firms, despite early stability, began encountering challenges related to efficiency and cost control in the later stages. These findings reinforce the importance of tailored policy interventions, sensitive to both regional and structural differences, to enhance long-term resilience and competitiveness in the sector.
5. Conclusion
This study provides a detailed assessment of the resilience of Italian FBP SMIs over a four-year span, tracing the financial performance trend before and after the COVID-19 crisis. Drawing on a large and geographically diverse dataset, it sheds light on how different segments of the sector navigated and recovered from the pandemic-induced disruption.
The results underline the adaptability of smaller firms, which, despite initial setbacks, achieved notable recovery over time. Conversely, firms in Central Italy remained more exposed, with slower recovery and sustained financial fragility. Larger companies, while initially more robust, faced growing challenges related to operational efficiency as the economic environment evolved.
These insights offer valuable guidance for policymakers, business leaders, and scholars, emphasizing the need for differentiated strategies based on firm size and regional context. Future research should explore long-term financial sustainability and the design of targeted resilience frameworks, capable of supporting SMEs across various economic scenarios and better preparing the sector for future disruptions.
Moreover, to overcome one of the current study’s limitations—namely the underrepresentation of large firms (50+ employees, only 3% of the sample)—future analyses could benefit from a more balanced comparison with a dedicated sample of larger enterprises to enhance the scope and robustness of the findings.
References
- Nakat, Zeina, and Christelle Bou-Mitri. "COVID-19 and the food industry: Readiness assessment." Food control 121 (2021): 107661. [CrossRef]
- Naseer S., Khalid S. et al., COVID-19 outbreak: Impact on global economy, in Frontiers in Public Health, Volume 10 – 2022, DO| . [CrossRef]
- Rinaldi, M., Bottani, E. (2023). How did COVID-19 affect logistics and supply chain processes? Immediate, short and medium-term evidence from some industrial fields of Italy. International Journal of Production Economics, 262, 108915. [CrossRef]
- Zutshi, A., Mendy, J., Sharma, G. D., Thomas, A., & Sarker, T. (2021). From challenges to creativity: enhancing SMEs’ resilience in the context of COVID-19. Sustainability, 13(12), 6542. [CrossRef]
- Berardi, F. (2022). La supply-chain ai tempi del Covid-19: due anni dopo il primo impatto [The Supply Chain in the Time of Covid-19: Two Years After the First Impact]. Politecnico di Torino. Retrieved from https://webthesis.biblio.polito.it/22621/.
- Bellomi, G. (2023). Analisi del settore automotive e impatti del COVID-19 sulle scelte dei consumatori [Analysis of the Automotive Sector and the Impact of COVID-19 on Consumer Choices]. Università di Pavia. Retrieved from https://unitesi.unipv.it/bitstream/20.500.14239/26072/1/TESI%20GABRIELE%20BELLOMI.pdf.
- Falavigna, G., & Ippoliti, R. (2023). Sostegni alle imprese durante la pandemia da Covid-19: il caso del settore manifatturiero nel Mezzogiorno. Economia Pubblica, (3), 111–145. Retrieved from https://www.rivisteweb.it/doi/10.1432/113853.
- Fondazione Hume. (n.d.). Il “boom” dei prezzi e l'impatto del lockdown: l'Italia rischia ora la “tempesta perfetta”. Retrieved from https://www.fondazionehume.it/economia/il-boom-dei-prezzi-e-limpatto-del-lockdown-litalia-rischia-ora-la-tempesta-perfetta/.
- Tricarico, M. (2021). La behavior-based safety per il contenimento del contagio da SARS-CoV-2 nell'industria manifatturiera [Behavior-Based Safety for COVID-19 Containment in Manufacturing]. Politecnico di Milano. Retrieved from https://www.politesi.polimi.it/handle/10589/195473.
- Naseer, S., Khalid, S., Parveen, S., Abbass, K., Song, H., & Achim, M. V. (2023). COVID-19 outbreak: Impact on global economy. Frontiers in public health, 10, 1009393. [CrossRef]
- Vlachos, I. (2024). The COVID-19 pandemic impact on supply chains: a systematic literature review. International Journal of Logistics Systems and Management, 48(1), 17-66. [CrossRef]
- Timpanaro, G., Foti, V. T. (2024). Recovery and resilience of rural farms in sicily (Italy): The CoVid-19 pandemic and the Russia-Ukraine conflict. Journal of Rural Studies, 112, 103485. [CrossRef]
- Fondazione Metes, www.fondazionemetes.it, last access 2025/03/20.
- Food and Drink Europe, www.fooddrinkeurope.eu/, last access 2025/03/20.
- International Monetary Fund, www.imf.org last access 2025/03/20.
- Barile, D., Secundo, G., & Del Vecchio, P. (2024). Food 4.0 for competing during the COVID-19 pandemic: experimenting digitalization in family firms. European Journal of Innovation Management, 27(4), 1381-1402. [CrossRef]
Figure 1.
EU food and Drinks Industry Figures. Source: Data and Trend, 2024 edition, www.fooddrinkeurope.eu).
Figure 1.
EU food and Drinks Industry Figures. Source: Data and Trend, 2024 edition, www.fooddrinkeurope.eu).
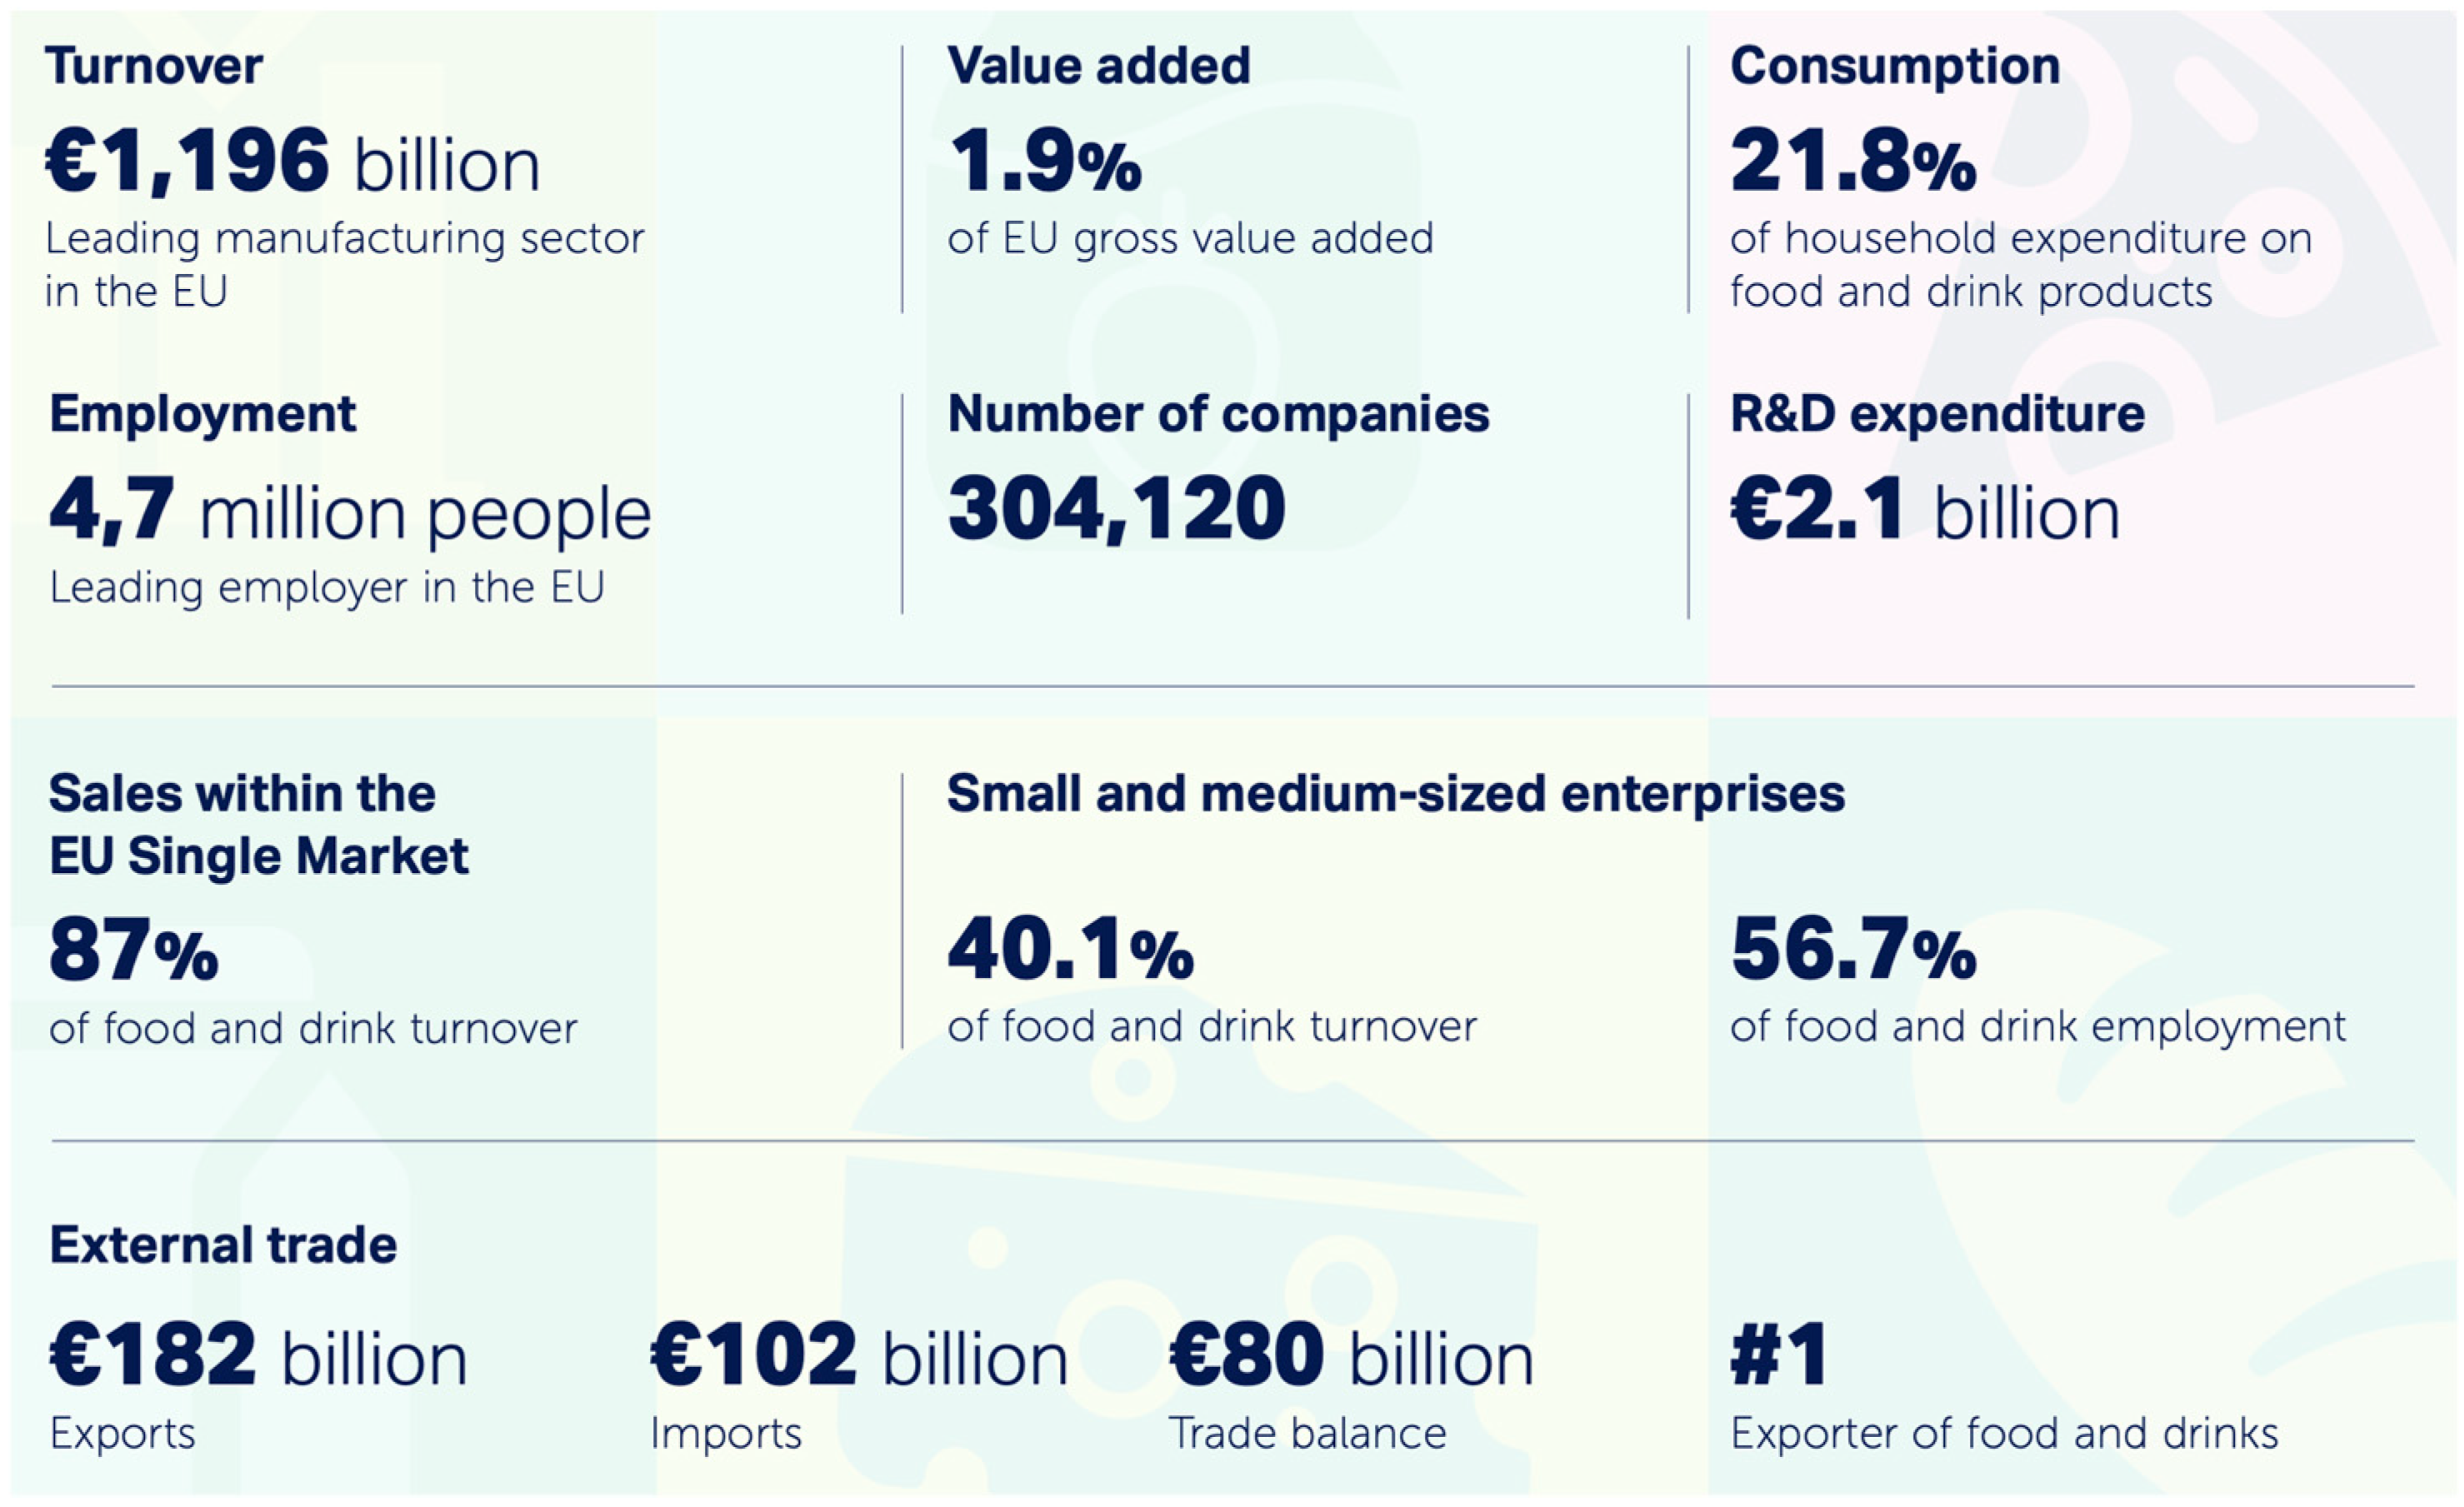

Table 2.
Sample distribution by business size and geographical location.
| areas | North | Center | South + islands | total Sample | |
| total Sample | 27% | 15% | 59% | 100% | |
| business size (number of employees) | 01 - 05 | 45% | 61% | 58% | 55% |
| giu-15 | 29% | 28% | 28% | 28% | |
| 16 - 50 | 20% | 10% | 11% | 13% | |
| 50 | 6% | 1% | 2% | 3% | |
Table 3.
ROE average by categories.
| ROE | NORTH | CENTER | SOUTH+ISLANDS | 1-5 employees | 6-15 employees | 16-50 employees | 50+ employees |
| 2019 | 6,81 | 9,12 | 11,75 | 6,91 | 10,79 | 12,46 | 14,35 |
| 2020 | -3,2 | 6,25 | 5,98 | 1,75 | 7,58 | 9,71 | 11,71 |
| 2021 | 6,34 | 8,21 | 11,88 | 8,6 | 12,25 | 12,22 | 12,06 |
| 2022 | 2,16 | 8,15 | 7,85 | 5,29 | 11,07 | 12,76 | 4,05 |
Table 4.
ROI average.
| ROI | NORTH | CENTER | SOUTH+ISLANDS | 1-5 employees | 6-15 employees | 16-50 employees | 50+ employees |
| 2019 | 3,75 | 1,44 | 4,56 | 3,54 | 3,98 | 4,83 | 5,9 |
| 2020 | -0,25 | -0,89 | 1,26 | -1,45 | 1,57 | 3,48 | 4,99 |
| 2021 | 1,68 | -2,22 | 2,52 | -0,53 | 3,36 | 3,01 | 4,97 |
| 2022 | 0,96 | -1,6 | 2,08 | 0,64 | 2,51 | 1,84 | 1,28 |
Table 5.
Debt ratio average.
| Debt ratio | NORTH | CENTER | SOUTH+ISLANDS | 1-5employees | 6-15employees | 16-50employees | 50+employees |
| 2019 | 73,07 | 78,43 | 74,53 | 74,75 | 75,43 | 72,01 | 70,78 |
| 2020 | 73,77 | 80,17 | 74,5 | 76,66 | 74,23 | 70,58 | 67,45 |
| 2021 | 73,81 | 81,63 | 74,87 | 76,89 | 73,9 | 71,85 | 67,96 |
| 2022 | 75,01 | 78,63 | 74,51 | 75,6 | 74,62 | 71,54 | 69,46 |
Table 7.
EBIDTA (average).
| EBIDTA | NORTH | CENTER | SOUTH+ISLANDS |
1-5 employees |
6-15 employees |
16-50 employees |
50+ employees |
| 2019 | 435.023 | 164.860 | 214.878 | 48.577 | 192.490 | 576.201 | 1.876.494 |
| 2020 | 376.619 | 123.479 | 205.001 | 39.065 | 176.258 | 544.077 | 1.627.451 |
| 2021 | 447.251 | 165.030 | 235.861 | 47.855 | 217.075 | 631.587 | 1.904.052 |
| 2022 | 463.431 | 180.727 | 210.514 | 58.291 | 224.540 | 604.479 | 1.553.830 |
Table 6.
workforce in the sample.
| workforce | NORTH | CENTER | SOUTH+ISLANDS |
1-5 employees |
6-15 employees |
16-50 employees |
50+ employees |
| 2019 | 12.090 | 3.490 | 13.264 | 5.199 | 7.128 | 9.384 | 7.133 |
| 2020 | 12.595 | 3.695 | 13.940 | 5.206 | 7.062 | 9.876 | 8.086 |
| 2021 | 13.731 | 3.860 | 15.064 | 5.484 | 7.551 | 10.448 | 9.172 |
| 2022 | 14.914 | 4.028 | 15.563 | 5.788 | 7.768 | 11.153 | 9.796 |
| % CHANGE 2019-2022 | 23,4% | 15,4% | 17,3% | 11,3% | 9% | 18,9% | 37,3% |
Table 7.
EBIDTA (average) per worker.
|
EBIDTA per worker |
NORTH | CENTER | SOUTH+ISLANDS |
1-5 employees |
6-15 employees |
16-50 employees |
50+ employees |
| 2019 | 25.521 | 16.573 | 21.176 | 10.680 | 18.300 | 20.671 | 24.569 |
| 2020 | 21.764 | 12.642 | 20.250 | 9.132 | 16.697 | 18.717 | 20.881 |
| 2021 | 25.259 | 17.106 | 22.980 | 11.571 | 19.865 | 20.686 | 22.422 |
| 2022 | 24.138 | 17.949 | 19.605 | 13.183 | 20.003 | 19.063 | 16.756 |
Table 8.
workforce in the sample.
| workers | 2019 vs 2020 | 2020 vs 2021 | 2021 vs 2022 |
| NORTH | 4% | 9% | 9% |
| CENTER | 6% | 4% | 4% |
| SOUTH+ISLANDS | 5% | 8% | 3% |
| 1-5 employees | 0% | 5% | 6% |
| 6-15 employees | -1% | 7% | 3% |
| 16-50 employees | 5% | 6% | 7% |
| 50+ employees | 13% | 13% | 7% |
Disclaimer/Publisher’s Note: The statements, opinions and data contained in all publications are solely those of the individual author(s) and contributor(s) and not of MDPI and/or the editor(s). MDPI and/or the editor(s) disclaim responsibility for any injury to people or property resulting from any ideas, methods, instructions or products referred to in the content. |
© 2025 by the authors. Licensee MDPI, Basel, Switzerland. This article is an open access article distributed under the terms and conditions of the Creative Commons Attribution (CC BY) license (http://creativecommons.org/licenses/by/4.0/).
Copyright: This open access article is published under a Creative Commons CC BY 4.0 license, which permit the free download, distribution, and reuse, provided that the author and preprint are cited in any reuse.


