Submitted:
13 April 2025
Posted:
14 April 2025
You are already at the latest version
Abstract
Purpose: To show how various patients of African descent possess principal superior-temporal and inferior-temporal retinal nerve fiber layer (RNFL) bundle peaks that are anatomically shifted relative to the optical coherence tomography (OCT) normative database majority. This anatomical discrepancy may present as false-positive thinning on RNFL deviation maps thereby appearing like early glaucomatous damage. Observations: Three patients of African descent presented with cup-to-disc ratios of 0.6 or higher and were flagged with bilateral retinal nerve fiber layer thinning in superior-temporal and/or inferior-temporal RNFL sectors relative to the Cirrus OCT normative database population. Thinning on RNFL deviation maps in all three patients showed wedge-defects that traveled towards the superior-temporal and inferior-temporal vulnerability zones of the disc. However, all three patients demonstrated bilateral robust macular ganglion cell thicknesses and had automated visual fields inconsistent with glaucoma. Inspection of the RNFL in these patients showed their principal superior-temporal and inferior-temporal nerve bundle peaks were shifted more vertically and less temporally relative to the database population. Conclusion: As OCT becomes more common in early glaucoma detection, it may be important to recognize how the RNFL anatomy of some patients of African descent differs relative to the normative database majority. All three of the patients in our series had high-risk appearing superior-temporal and/or inferior-temporal RNFL ‘thinning’ attributable to anatomical shifting of these bundle peaks. This may result in improper flagging of sectors known to be vulnerable in early glaucoma thereby increasing the likelihood of misdiagnosis, particularly if ganglion cell thickness is not concurrently inspected.
Keywords:
retinal nerve fiber layer (RNFL)
; optical coherence tomography (OCT)
; normative database
Introduction
While identification of glaucomatous optic neuropathy in advanced cases is often clinically apparent on fundoscopy, distinguishing between early glaucoma and glaucoma suspects can be more difficult [1]. To aid in diagnosis, optical coherence tomography (OCT) imaging use has increased significantly in recent years [2]. OCT compares a patient’s retinal nerve fiber layer (RNFL) and ganglion cell thickness against an age-matched normative database. Those with glaucoma should theoretically have RNFL sector(s) flagged as thin relative to the ‘healthy’ normative database population. Sectors between the 1st and 5th percentiles are coded as yellow and those below the 1st percentile are coded as red [3]. Sectors in early to moderate stage glaucoma patients that are flagged relative to the normative population with highest frequency are where the principal superior-temporal and inferior-temporal RNFL bundles enter the disc after arcing around/through the macula [4,5]. These typically equate to the 11, 12, 6 and 7 clock hour locations in the right eye and the 12, 1, 5, and 6 hours in the left eye [5,6,7,8]. Looking for thinning in these particular sectors relative to the normative database can be useful when progression analysis is not yet available for a patient.
Unfortunately, the OCT imaging of individuals possessing normal anatomical variants not well represented within the normative data can be flagged despite the absence of true disease [9]. Hood points out these anatomical variations in healthy eyes can produce apparent abnormalities in the location of the arcuate nerve fiber bundles, which can lead to false-positives [4]. To lower the risk of these false-positives leading to misdiagnoses, Mwanza and Hood both advocate for combining multiple individual parameters and test results to improve diagnostic sensitivity and specificity [1,4]. Hood advocates towards using two primary rules or features for diagnosing early-moderate glaucoma based off OCT deviation maps. The first glaucomatous feature to look for is an arcuate or wedge-like defect (shown as red or yellow on the deviation map) extending towards the superior and/or inferior disc region(s) [4]. These defects are most likely to be on the temporal half of said disc region(s), paralleling the high-risk clock hour sectors of the so called inferior and superior vulnerability zones [5]. Hood’s second rule is that, when the ganglion cell and retinal nerve fiber layer deviation maps are simultaneously inspected, the abnormal flagged region should cross the vertical midline, preferably in an arcuate pattern [4]. Ganglion cell defects associated with glaucoma often appear in an arcuate to crescent shape and correlate topographically with peripapillary RNFL defects in the same hemisphere [10].
The three patients in this series were assessed at an urban teaching clinic and all gave consent for publication of their clinical information. No identifiable health information was included in this case report. All patients were African-American and had mildly myopic refractions. All had eye pressures within normal range without any IOP-lowering therapies or procedures. No anterior segment or gonioscopy findings were indicative of secondary glaucoma. OCT images were acquired with a Zeiss Cirrus, while automated 24-2 threshold visual fields were conducted on a Zeiss Humphrey Field Analyzer. To illustrate the importance of recognizing the limitations of current normative database comparisons in glaucoma diagnosis, the RNFL of these patients was flagged in high-risk areas satisfying Hood’s first rule. Analysis of these patients’ RNFL required concurrent inspection of ganglion cell deviation maps to ensure no correlative thinning diagnostic of glaucoma.
Case Series
The findings in all three patients are summarized in Table 1.
Case 1
A 59-year-old African American male with no family history of glaucoma presented for a comprehensive eye exam. Best corrected visual acuities measured 20/20 in each eye with the following refractions: -1.25-0.75 x070 right eye and -1.25-1.25 x 070 left eye. Goldmann measured 21 mm Hg in each eye at 9 am. Central corneal thickness measured 536 um and 532 um in the right and left eyes. Gonioscopy revealed open angles with 2+ pigmentation of the posterior trabecular meshwork of both eyes. Pupils were equal, round and reactive without a relative afferent pupillary defect. Slit lamp exam showed no endothelial pigmentation nor iris transillumination defects; 1+ nuclear sclerosis was observed bilaterally. Dilated fundus exam showed stereoscopic cup-to-disc ratios of 0.6 round in each eye with no focal rim notching. The posterior pole and peripheral retina were healthy and otherwise unremarkable (Figure 1C,D).
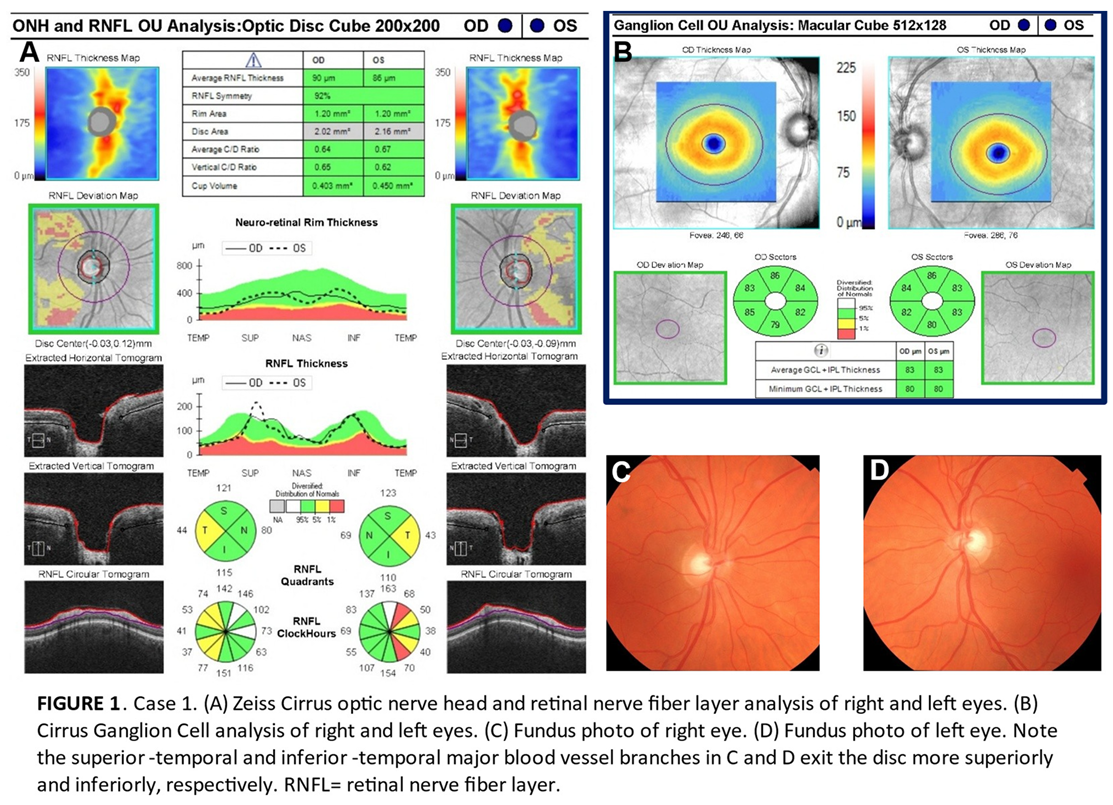
Cirrus optical coherence tomography showed bilateral superior-temporal and inferior-temporal arcuate defects on the retinal nerve fiber layer deviation map (Figure 1A). The following high glaucoma risk clock hours were flagged relative to the normative database: 11 and 7 of the right eye and 1 and 5 of the left eye. Ganglion cell analysis did not show any thinning relative to the normative database/deviation map (Figure 1B). Automated visual fields did not show any glaucomatous defects in either eye. A discussion of the importance of long-term glaucoma risk monitoring with the patient occurred. He agreed to return in a year for a comprehensive exam with the possibility of repeat imaging within two years.
Case 2
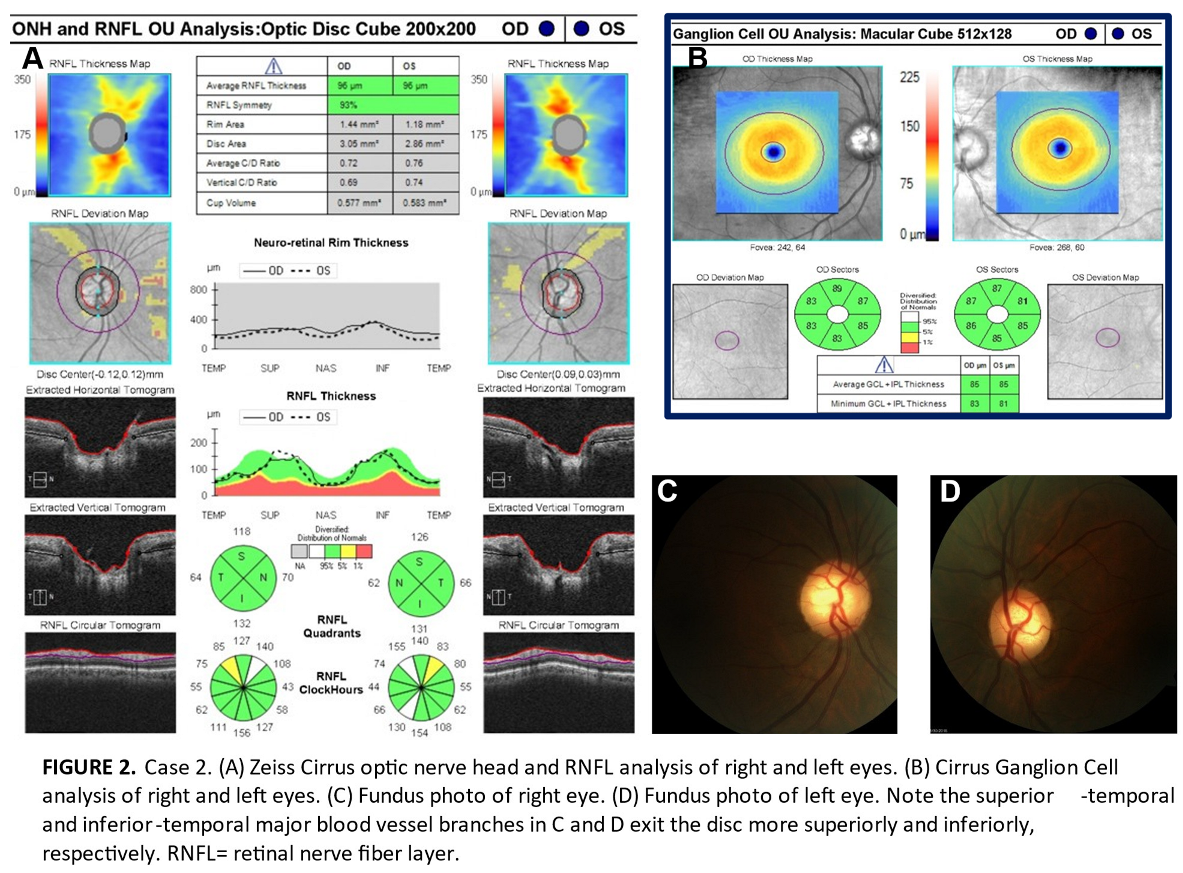
A 63-year-old African American male with a family history of glaucoma presented for a comprehensive eye exam. Best corrected visual acuities measured 20/20 in each eye with the following refractions: -1.50 sphere right eye and -1.75 sphere left eye. Goldmann measured 19 mm Hg in the right eye and 18 mmHg in the left eye at 9 am. Central corneal thickness measured 527 um and 522 um in the right and left eyes. Gonioscopy revealed open angles with 2+ pigmentation of the posterior trabecular meshwork of both eyes. Pupils were equal, round and reactive without a relative afferent pupillary defect. Slit lamp exam showed no endothelial pigmentation nor iris transillumination defects; 1+ nuclear sclerosis was observed bilaterally. Dilated fundus exam showed stereoscopic cup-to-disc ratios of 0.65 round in the right eye and 0.7 vertically/0.6 horizontally in the left eye with no focal rim notching bilaterally. The posterior pole and peripheral retina were unremarkable in both eyes (Figure 2C,D). Cirrus optical coherence tomography showed bilateral superior-temporal arcuate defects on the retinal nerve fiber layer deviation map (Figure 2A). The following high-risk clock hours were flagged relative to the normative database: 1 of the right eye and 11 of the left eye. Ganglion cell analysis did not show any thinning relative to the normative database/deviation map (Figure 2B). Automated visual fields did not show any glaucomatous defects in either eye. A discussion of the importance of long-term glaucoma risk monitoring with the patient occurred. He agreed to return in a year for a comprehensive exam with the possibility of repeat imaging within two years.
Case 3
A 55-year-old African American female with a family history of glaucoma presented for their annual comprehensive eye exam. This patient was established and had been monitored closely with visual fields for ten years by a recently-retired provider because of cup-to-disc asymmetry. Maximum untreated intraocular pressure was 22 mmHg in the right and 21 mmHg in the left. Central corneal thickness had previously measured 541 um and 543 um in the right and left eyes while gonioscopy had shown open angles with 1-2+ posterior trabecular meshwork pigmentation in both eyes. Automated visual fields had been stable on guided progression analysis in each eye (Figure 3C,E).
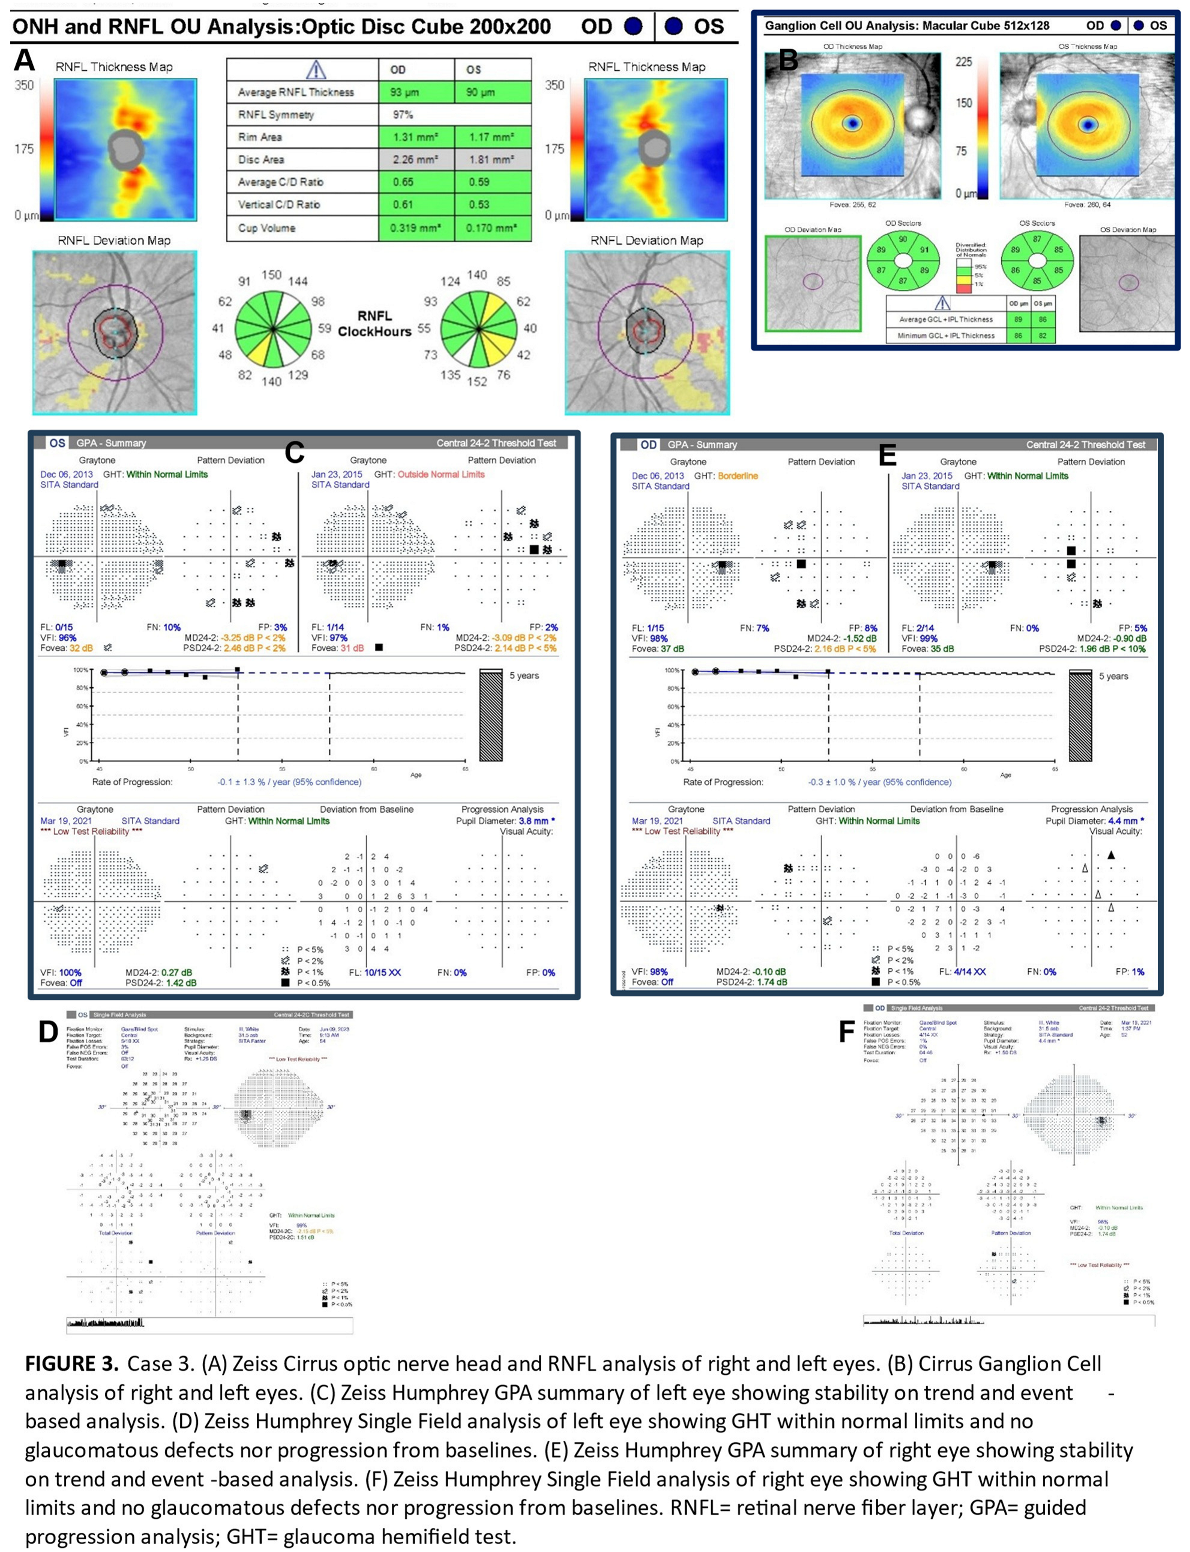
Best corrected visual acuity measured 20/20 with the following refractions: -1.25 sphere of the right eye and -1.50 sphere of the left eye. Pupils were equal, round and reactive without a relative afferent pupillary defect. Slit lamp exam showed no endothelial pigmentation nor iris transillumination defects; 1+ nuclear sclerosis was observed in the right eye and a clear posterior chamber intraocular implant was observed in the left eye. Goldmann that day measured 16 mmHg bilaterally. Dilated fundus exam showed stereoscopic cup-to-disc ratios of 0.65 round in the right eye and 0.5 round in the left eye. Baseline optical coherence tomography showed bilateral thinning relative to the normative database inferior-temporally more so than superior-temporally (Figure 3A). Ganglion cell thickness was not flagged and robust in each eye (Figure 3B). Repeat automated visual fields were clean; no evidence of progression was noted in either eye (Figure 3D, F). A discussion of the importance of long-term glaucoma risk monitoring with the patient occurred. She agreed to return in a year for a comprehensive exam with the possibility of repeat imaging within two years.
Discussion
All three patients exhibited thinning on the RNFL deviation map as well as clock hour sectors in superior-temporal or inferior-temporal locations which are vulnerable in early glaucomatous loss thereby meeting the criteria of Hood’s first rule (Figures 1A, 2B and 3A). However, we believe these patients do not have glaucoma for four reasons. First, there is no ganglion cell thinning. It follows that there is no thinning on deviation maps that crosses the vertical midline (Hood’s second rule), nor is there ganglion cell thinning that correlates with the trajectory of RNFL thinning (Figures 1B, 2B and 3B) [4]. Second, glaucoma usually onsets (at least somewhat) asymmetrically between both eyes [11]. Therefore, the symmetry of the nerve fiber layer thinning between the right and left eyes in each case also suggests that there is more likely an anatomical discrepancy compared to the normative database [9]. Third, clinically robust superior and inferior neuroretinal rims without focal thinning that would not be expected in glaucoma. This was seen in all three cases and is shown on the fundus photos of Cases 1 and 2 (Figures 1C,D and 2C,D) [11]. While we do not have fundus photos to attach for Case 3, the Humphrey automated visual field guided progression analysis shows no evidence of progressive field loss over time (Figure 3C–F).
Disc area tends to be larger in those of African versus Caucasian descent. However, even after adjusting for the effect of disc area, Knight noted statistically significant differences between races for all Cirrus measured optic nerve head and RNFL parameters (except for rim area) [12]. The same was true for Girkin who with confocal scanning laser ophthalmoscopy found that residual optic disc structural differences still persisted following adjustment of disc area size [13]. These anatomical differences mean it is important to consider that utilizing normative database color codes in black patients may result in glaucoma over-diagnosis in some and under-diagnosis in others [3]. It is important to acknowledge that commercially available optical coherence tomography devices include only a minority of patients of African descent in their normative database [14]. For example, the Zeiss Cirrus database of 282 healthy subjects is made up of only 18% black patients [3]. As a result of these database limitations, it is not surprising that both KhalafAllah and Moghimi separately reported that RNFL thickness in patients of African descent has a lower diagnostic performance in accurately diagnosing glaucoma compared to patients of European descent [15,16]. These findings were found to be consistent on the Spectralis (Heidelberg) and Cirrus (Zeiss) per KhalafAllah as well as the Avanti (Optovue) per Moghimi. This is unfortunate as glaucoma disproportionately impacts individuals of African ancestry; both in incidence and risk of resulting blindness [17]. Black patients may also develop glaucoma earlier in life [18].
Racial variation as it relates to the Cirrus normative database is supported by studies completed by Addis and Nousome [3,18]. For example, we noted from Addis’ data that 8.2% of African American eyes had a temporal quadrant flagged, while only 1.3% had a nasal quadrant flagged by Cirrus OCT [3]. In a study of minority populations under-represented in the Cirrus normative database, Nousome reviewed high quality Cirrus data from ‘healthy’ patients. This participant group was composed of 2,843 Chinese Americans, 1,979 Mexican Americans and 1,311 African Americans. The diversity among participants coupled with the large sample size allowed us to draw the following conclusions regarding RNFL bundle distributions from their RNFL thickness plots. First, Chinese Americans had statistically significant greater overall RNFL thicknesses than African Americans and Mexican Americans. Secondly and important to our series, Mexican Americans (and even more so Chinese Americans) had statistically significantly relatively thicker temporal quadrants than African Americans. Third, African Americans had greater RNFL thickness than Mexican Americans at superior-nasal and inferior-nasal clock hour sectors. Fourth, African Americans had non-statistically significantly greater RNFL thickness than Chinese Americans at 12 o’clock [18].
The separate studies by Addis and Nousome are consistent with the authors’ anecdotal clinical observations and hypothesis that the principle superior-temporal and inferior-temporal arcuate bundle peaks in black patients commonly appear to enter the disc more vertically (or less temporally), resulting in a greater inter-arterial angle compared to other races (namely whites and East-Asians). Because this is a small nonrandomized series, the true extent of this ‘bundle shift’ within this population subset is unknown and requires further study with a large sample size. Nonetheless, if proven, the possible implication of our case series is that existing RNFL thicknesses coded by Cirrus OCT are likely to over-diagnose peripapillary thinning in sectors in or adjacent to the temporal quadrant in black patients. These adjacent sectors include the superior temporal and inferior temporal areas commonly associated with early-moderate glaucomatous thinning.
To further illustrate our ‘bundle shift’ hypothesis, we outlined the peak RNFL thickness map bundles of one of the authors. This author is white, has healthy appearing discs, roughly average axial lengths, and has an RNFL and ganglion cell analysis that was not flagged as thin anywhere relative to the Cirrus database (Figure 4A, B). The thickest points (warmest colors) of the author’s RNFL bundles (or ‘wings’) in each eye were outlined to serve as a demonstration of an expected RNFL thickness profile relative to the normative database. The outline was then copied and pasted onto the corresponding eyes of Cases 1 through 3 in that order (Figure 4C–E). In Figure 4C–E, areas within the outline that do not contain the expected warm colors of the thick principle superior-temporal and inferior-temporal bundle peaks appear flagged relative to the normative database on the underlying deviation maps. This helps illustrate that the eyes of the African American patients in this series had principle bundle peaks that extended more superiorly (or superior-nasally) and inferiorly (or inferior-nasally) compared to the author (and likely by extension, the normative database). In other words, the superior-temporal and inferior-temporal peaks of these black patients appeared more verticalized.
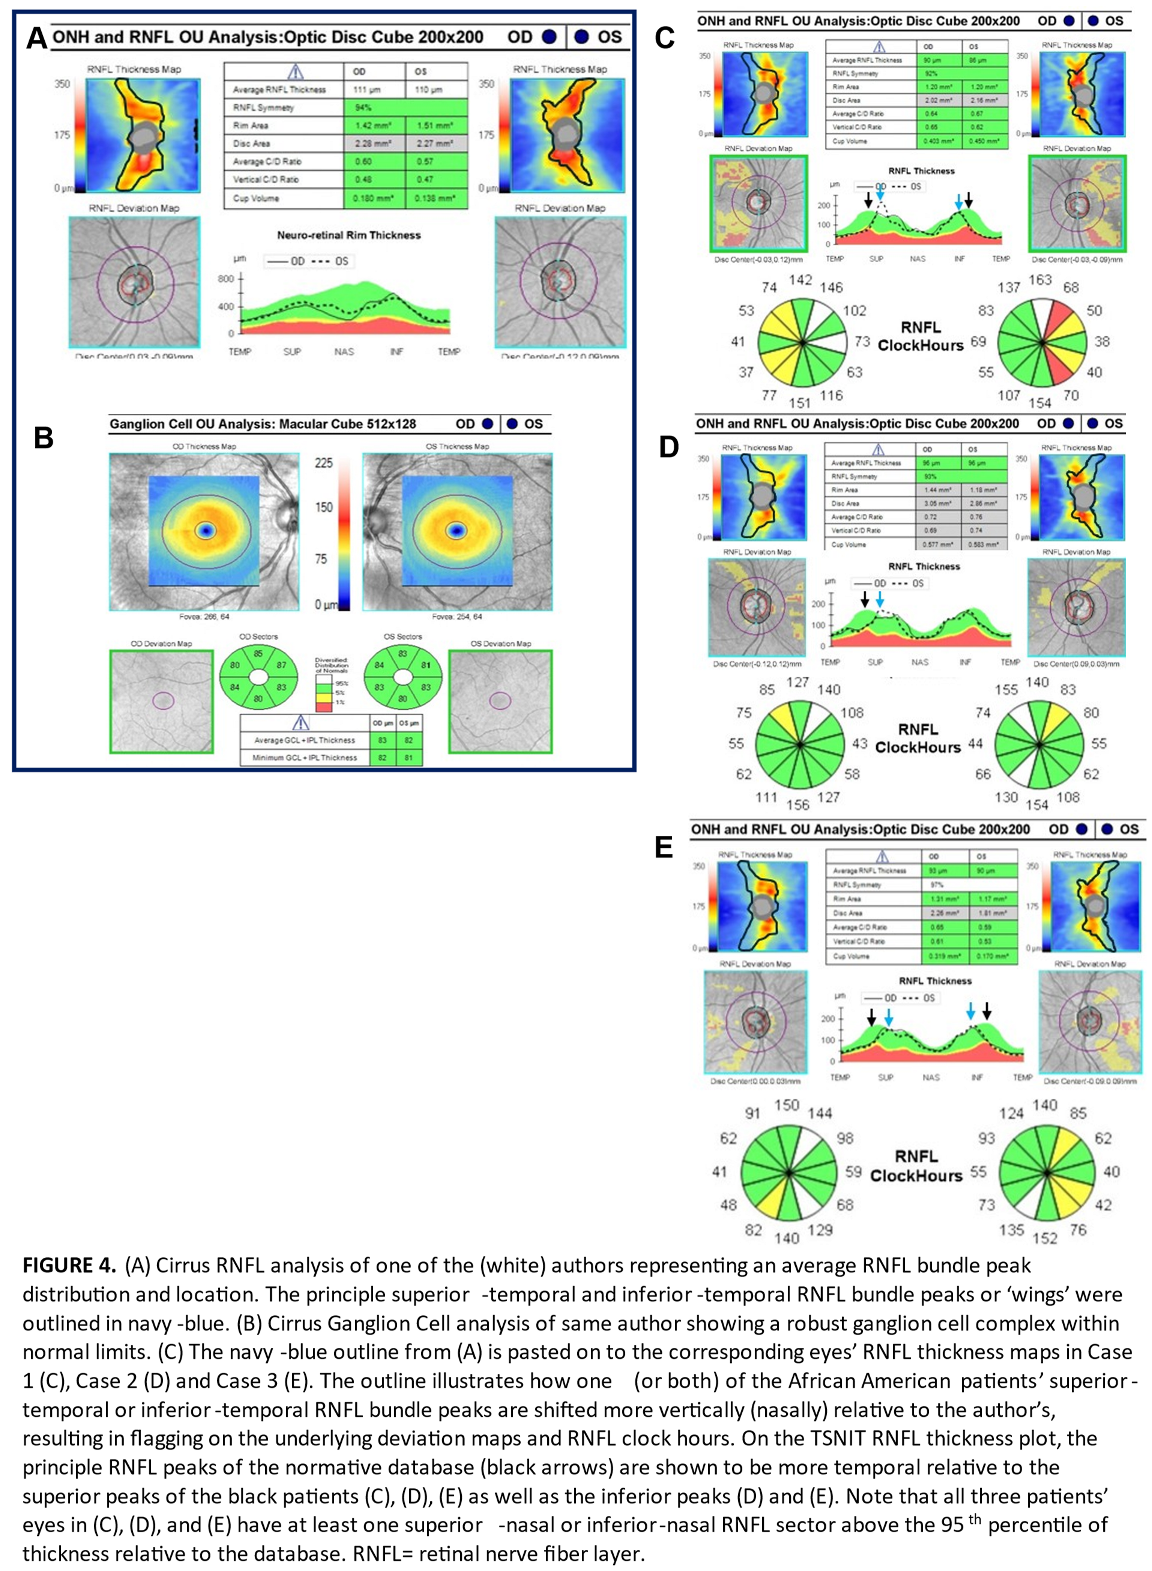
It is important to remember that these peaks roughly coincide with the locations of the major superior-temporal and inferior-temporal vessel branches at the optic disc. While these vessels do contribute some thickness to the RNFL measurement, they are thought to form along the points of highest axonal distribution during development [19]. In other words, if blood vessel distribution and by extension nerve fiber bundles, are located at a different retinal position than expected by the tomography machine, retinal locations on healthy eyes that are thinner due to anatomy (and not glaucoma) might be flagged as abnormal [20]. This has been found to be true in axial myopes where RNFL bundles peaks are commonly shifted temporally thereby yielding false-positive thinning in non-temporal sectors in healthy, eyes [19,21]. Our mildly myopic African American patients had a RNFL bundle shift in the vertical (or in other words nasal) direction as evidenced by their superior-temporal and inferior-temporal major vessel branches arising from the disc more superiorly and inferiorly. This is seen most prominently in the fundus photos of case 1 (Figure 1C, D) as well as all three cases’ RNFL deviation maps, which helpfully feature blood vessel outlines (Figures 1A, 2A, 3A). The more verticalized principle bundle peaks may be expected to yield (or compensate) with thicker RNFL in non-temporal sectors. This is shown in Figure 4C–E where there is at least one superior-nasal or inferior-nasal nerve fiber layer sector that is above the 95th percentile of thickness relative to the normative database.
To our knowledge, this possible shift in peak bundle location in patients of African descent relative to the non-black majority normative database has not been specifically addressed or questioned in the literature yet, particularly when it comes to issues of false-positive ‘red-disease’ [9]. Further actual well-designed and controlled study is called for to scientifically validate or refute this bundle shift hypothesis in black patients. Our case series is limited by the very small sample size of non-randomly selected subjects without any controls or standardization. In other words, ours is simply too small a sample to draw reliable conclusions regarding a population. Even if our hypothesis is confirmed for African Americans, further study is also required for other populations of African descent. As our patients were all low myopes (in which case you may expect if anything a mild temporal bundle shift), we suspect the vertical/nasal bundle shift in our series is not related to refractive error. However, accounting for refractive error in future studies, given the correlation with inter-arterial bundle angle decreasing with increasing axial length, is also likely important to consider. Further, we did not measure axial length in our patients.
This discussion regarding variation in RNFL anatomy and parameters has triggered interest in race-specific normative databases [12]. Per Realini, consideration of ethnic origin in construction of RNFL normative limits may be helpful for diagnosis and management of glaucoma [22]. However, Realini also notes it is ‘unclear how best to define ethnic groups in practical and useful ways that support everyday clinical practice’. For example, does ‘African descent’ encompass Africans, Afro-Caribbeans, North Africans, African Americans and the increasing number of multiracial patients with some African descent? [22]. These questions from experts such as Realini illustrate the complexity in addressing this problem appropriately. One possible way to improve generalizability may be to expand a given normative database with improved ethnic sampling. Nakayama notes that diversity is critical for promoting generalizability of results. Further, it would be more equitable and accessible to not have to ‘upgrade’ to an expanded database (more relevant to a given patient) at additional cost [14]. For now, it is important for clinicians to be aware that normative databases have limitations with respect to numbers of healthy anatomical variants and minority populations. This may put these populations at risk of false-positive ‘red disease’ [9]. It follows that utilization of ganglion cell analysis, visual fields, and accurate clinical inspection of the optic nerve rim tissue are all very crucial [4,5,9]. These practices are even more vital given the prevalence of physiological cupping in the black population that is sometimes misdiagnosed as glaucoma [13,17].
Conclusion
As optical coherence tomography becomes more common in early glaucoma detection, it may be important to recognize how the nerve fiber anatomy of some black patients differs relative to the normative database majority. All three of the African American patients in our series had high-risk appearing superior-temporal and/or inferior-temporal ‘thinning’ on nerve fiber deviation maps that was attributed to shifting of the superior temporal and inferior temporal bundle peaks. This may result in improper flagging of sectors that are vulnerable in early glaucoma thereby increasing the likelihood of misdiagnosis, particularly if ganglion cell thickness is not concurrently inspected. Since this is a small, non-randomized case series, the extent of this ‘bundle shift’ in the black population is unknown and requires further study.
References
- Mwanza, J.C.; Warren, J.L.; Budenz, D.L. Utility of combining spectral domain optical coherence tomography structural parameters for the diagnosis of early glaucoma: a mini-review. Eye Vis (Lond) 2018, 5, 9. [Google Scholar] [CrossRef] [PubMed]
- Bussel, I.I.; Wollstein, G.; Schuman, J.S. OCT for glaucoma diagnosis, screening and detection of glaucoma progression. Br J Ophthalmol 2014, 98 Suppl 2, ii15–19. [Google Scholar] [CrossRef] [PubMed]
- Addis, V.; Chan, L.; Chen, J.; et al. Evaluation of the Cirrus high-definition OCT normative database probability codes in a black American population. Ophthalmol Glaucoma 2022, 5, 110–118. [Google Scholar] [CrossRef] [PubMed]
- Hood, D.C.; La Bruna, S.; Tsamis, E.; et al. Detecting glaucoma with only OCT: Implications for the clinic, research, screening, and AI development. Prog Retin Eye Res 2022, 90, 101052. [Google Scholar] [CrossRef] [PubMed]
- Hood, D.C. Improving our understanding, and detection, of glaucomatous damage: An approach based upon optical coherence tomography. Prog Retin Eye Res 2017, 57, 46–75. [Google Scholar] [CrossRef] [PubMed]
- Retinal nerve fiber layer analysis in glaucoma. In: Budenz, DL, ed. Atlas of Optical Coherence Tomography for Glaucoma. Switzerland: Elsevier; 2020; pp.31–35.
- Mwanza, J.C.; Oakley, J.D.; Budenz, D.L.; Anderson, D.R. Cirrus Optical Coherence Tomography Normative Database Study Group. Ability of cirrus HD-OCT optic nerve head parameters to discriminate normal from glaucomatous eyes. Ophthalmology 2011, 118, 241–248.e1. [Google Scholar] [CrossRef] [PubMed]
- Hwang, Y.H.; Kim, Y.Y. Glaucoma diagnostic ability of quadrant and clock-hour neuroretinal rim assessment using cirrus HD optical coherence tomography. Invest Ophthalmol Vis Sci 2012, 53, 2226–2234. [Google Scholar] [CrossRef] [PubMed]
- Chong, G.T.; Lee, R.K. Glaucoma versus red disease: imaging and glaucoma diagnosis. Curr Opin Ophthalmol 2012, 23, 79–88. [Google Scholar] [CrossRef] [PubMed]
- Susanna RJr Vessani, R.M. New findings in the evaluation of the optic disc in glaucoma diagnosis. Curr Opin Ophthalmol 2007, 18, 122–128. [Google Scholar] [CrossRef] [PubMed]
- Knight, O.J.; Girkin, C.A.; Budenz, D.L.; et al. Cirrus OCT normative database study group. Effect of race, age, and axial length on optic nerve head parameters and retinal nerve fiber layer thickness measured by Cirrus HD-OCT. Arch Ophthalmol 2012, 130, 312–318. [Google Scholar] [CrossRef] [PubMed]
- Girkin, C.A.; McGwin GJr McNeal, S.F.; DeLeon-Ortega, J. Racial differences in the association between optic disc topography and early glaucoma. Invest Ophthalmol Vis Sci 2003, 44, 3382–3387. [Google Scholar] [CrossRef] [PubMed]
- Nakayama, L.F.; Zago Ribeiro, L.; de Oliveira, J.A.E.; et al. Fairness and generalizability of OCT normative databases: a comparative analysis. Int J Retina Vitreous 2023, 9, 48. [Google Scholar] [CrossRef] [PubMed]
- KhalafAllah, M.T.; Zangwill, L.M.; Proudfoot, J.; et al. Racial differences in diagnostic accuracy of retinal nerve fiber layer thickness in primary open-angle glaucoma. Am J Ophthalmol 2024, 259, 7–14. [Google Scholar] [CrossRef] [PubMed]
- Moghimi, S.; Zangwill, L.M.; Hou, H.; et al. Comparison of peripapillary capillary density in glaucoma patients of African and European descent. Ophthalmol Glaucoma 2021, 4, 51–62. [Google Scholar] [CrossRef] [PubMed]
- Girkin, C.A. Differences in optic nerve structure between individuals of predominantly African and European ancestry: Implications for disease detection and pathogenesis. Clin Ophthalmol 2008, 2, 65–69. [Google Scholar] [CrossRef] [PubMed]
- Nousome, D.; Mckean-Cowdin, R.; Richter, G.M.; et al. Retinal nerve fiber layer thickness in healthy eyes of black, Chinese, and Latino Americans: A population-based multiethnic study. Ophthalmology 2021, 128, 1005–1015. [Google Scholar] [CrossRef] [PubMed]
- Hood, D.C.; Fortune, B.; Arthur, S.N.; et al. Blood vessel contributions to retinal nerve fiber layer thickness profiles measured with optical coherence tomography. J Glaucoma. 2008, 17, 519–528. [Google Scholar] [CrossRef] [PubMed]
- Wang, M.; Jin, Q.; Wang, H.; Li, D.; et al. The Interrelationship between refractive error, blood vessel anatomy, and glaucomatous visual field loss. Transl Vis Sci Technol 2018, 7, 4. [Google Scholar] [CrossRef] [PubMed]
- Leung, C.K.; Yu, M.; Weinreb, R.N.; et al. Retinal nerve fiber layer imaging with spectral-domain optical coherence tomography: a prospective analysis of age-related loss. Ophthalmology. 2012, 119, 731–737. [Google Scholar] [CrossRef] [PubMed]
- Realini, T.; Zangwill, L.M.; Flanagan, J.G.; et al. Normative databases for imaging instrumentation. J Glaucoma 2015, 24, 480–483. [Google Scholar] [CrossRef] [PubMed]

Table 1.
Ocular Findings in Cases 1 through 3.
| Case 1 | Case 2 | Case 3 | |
| Refraction/BCVA | -1.25-0.75 x070 20/20 OD -1.25-1.25x070 20/20 OS |
-1.50 SPH 20/20 OD -1.75 SPH 20/20 OS |
-1.25 SPH 20/20 OD -1.50 SPH 20/20 OS |
| Anterior Segment Findings | No endothelial pigmentation on cornea OU No iris transillumination defects OU |
||
| Gonioscopy | Open to CBB 360 with 2+ pigmentation of PTM OU | ||
| Lens Status | 1+ NS OU | 1+ NS OU | 1+ NS OD; PCIOL OS |
| Maximum Untreated Goldmann Pressure | 21 mmHg OD; 21 mmHg OS | 19 mmHg OD; 18 mmHg OS | 22 mmHg OD; 21 mmHg OS |
| Central Corneal Thickness | 536 um OD; 532 um OS | 527 um OD; 522 um OS | 541 um OD; 543 um OS |
| Cup to Disc Ratio (Clinically) | 0.6 round OU | 0.65 round OD 0.7V/0.6H OS |
0.65 round OD 0.50 round OS |
| Wedge like Thinning on RNFL Deviation Maps | ST & IT OU | ST OU | IT greater than ST OU |
| High Risk RNFL Clock Hour Sectors Flagged | 11 & 7 OD; 1 & 5 OS | 1 OD; 11 OS | 7 OD and 1 & 5 OS |
| GCA (Cirrus) | Healthy & robust; no thinning relative to normative database OU | ||
| 24-2 Visual Field | No glaucomatous defects OU | ||
BCVA = best corrected visual acuity; CBB = ciliary body band; GCA = ganglion cell complex; H = horizontal; IT = inferior-temporal; NS = nuclear sclerosis; OD = right eye; OU = both eyes; OS = left eye; PCIOL = posterior chamber intraocular lens; PTM = posterior trabecular meshwork; RNFL = retinal nerve fiber layer; SPH = spherical; ST = superior-temporal.
Disclaimer/Publisher’s Note: The statements, opinions and data contained in all publications are solely those of the individual author(s) and contributor(s) and not of MDPI and/or the editor(s). MDPI and/or the editor(s) disclaim responsibility for any injury to people or property resulting from any ideas, methods, instructions or products referred to in the content. |
© 2025 by the authors. Licensee MDPI, Basel, Switzerland. This article is an open access article distributed under the terms and conditions of the Creative Commons Attribution (CC BY) license (http://creativecommons.org/licenses/by/4.0/).
Copyright: This open access article is published under a Creative Commons CC BY 4.0 license, which permit the free download, distribution, and reuse, provided that the author and preprint are cited in any reuse.


