
Submitted:
18 March 2025
Posted:
21 March 2025
You are already at the latest version
Preprints on COVID-19 and SARS-CoV-2
Abstract
(1) Background: This study investigated the determinants of COVID-19 mortality and its temporal trends within São Paulo state’s Regional Health Departments (DRS) to inform the development of targeted public health interventions. (2) Methods: Utilizing an ecological study design, we analyzed confirmed COVID-19 cases and deaths (February 2020 – December 2021) obtained from the COVID Panel, incorporating relevant social and health indicators. The Generalized Additive Model for Location, Scale, and Shape (GAMLSS) was used to identify key determinants, and temporal trends in mortality and vaccination rates were analyzed across each DRS. (3) Results: The average mortality rate was 32.0 deaths per 100,000 inhabitants (median 67.9). Higher chronic disease mortality was associated with lower COVID-19 mortality. However, increased proportions of older adults in urban areas, and higher vaccination rates correlated with increased COVID-19 mortality. (4) Conclusions: COVID-19 mortality in São Paulo is shaped by a complex interplay of behavioral, economic, demographic, and environmental factors. Region-specific public health policies should consider these factors, along with geographic, socioeconomic, and budgetary contexts, to effectively address health disparities across the state’s DRS.
Keywords:
COVID-19
; mortality indicators
; epidemiology
1. Introduction
COVID-19 has emerged as one of the most devastating public health crises of the 21st century, leading to numerous fatalities and widespread suffering globally [1]. The course of this pandemic can be characterized by distinct phases, starting from a period of limited understanding regarding the etiopathogenesis of the disease, progressing to the acquisition of epidemiological knowledge, and culminating in the formulation of public policy recommendations [2]. The disease had major impacts on the structure and organization of health systems and services around the world because the need for investments and reorganization of services to face COVID-19 brought losses in meeting other health demands [3]. Moreover, regions characterized by higher levels of social inequalities have experienced greater difficulties in managing the disease, having high incidence and mortality rates [1]. During the peak transmission period of COVID-19, various policies were implemented to mitigate the spread of the virus [2]. These measures included promoting social mobility restrictions, physical distancing, lockdowns, and, more recently, the widespread availability of COVID-19 vaccines, accompanied by efforts to expand vaccination. In the first two years of the pandemic, Brazil implemented various strategies to control COVID-19 [4]. Among these, the strategy used in São Paulo, the most economically developed state with the largest population in Brazil, stands out, called “Contingency Plan of the State of São Paulo for Human Infection by the new Coronavirus - SARS-CoV-2”. In short, the São Paulo Contingency Plan was prepared and constantly updated in relation to the state’s response level to COVID-19 and aspects related to the management of the outbreak, implying the establishment of sanitary measures, epidemiological commitments and the organization of services for the execution and follow-up of planned pandemic response actions [4]. The Contingency Plan of São Paulo utilized the division of the 17 Regional Health Departments (DRS) of the state to assess and compare the disease’s progression [5]. The DRS are responsible for coordinating health management activities, acting on the public policies of the government of the state of São Paulo and promoting intersectoral articulation with municipalities and civil society organizations. Given its economic, social and political diversity, the state of São Paulo exhibits significant heterogeneity in terms of COVID-19 transmission [6]. Analyzing data across the entire territory tends to generate incorrect conclusions and, for this reason, working based on health region, like the DRS becomes more appropriate since they have some particularities; where the tradition of building regionalized policies, the dynamics of population movement, geographical characteristics, socioeconomic conditions, budgetary conditions and participation in the different Regional Health Care Networks is practiced. Political and management strategies are essential in addressing the challenges arising from COVID-19 and ensuring the efficient functioning of the health system. Although this topic is of paramount importance for strengthening the Unified Health System (SUS), no studies were found in the literature that have addressed the subject from the perspective of the DRS in São Paulo, considering the repercussions of the disease in the state. Thus, this study aimed to identify the determinants of COVID-19 mortality and temporal trend in each DRS of the state of São Paulo.
2. Materials and Methods
This is an ecological study conducted in São Paulo state, located in the Southeast region of Brazil [7]. São Paulo state encompasses 645 municipalities and, in 2021, had an estimated population of 46,649,132 inhabitants, with a population density of 186.48 inhabitants/km² [7]. The state of São Paulo is administratively divided into 17 DRS, each covering all municipalities in the state. For this study, the unit of analysis was the subdivision of the state into these 17 DRS regions, as depicted in Figure 1: DRS I - Grande São Paulo, DRS II - Araçatuba, DRS III - Araraquara, DRS IV - Baixada Santista, DRS V - Barretos, DRS VI - Bauru, DRS VII - Campinas, DRS VIII - Franca, DRS IX - Marília, DRS X - Piracicaba, DRS XI - Presidente Prudente, DRS XII - Registro, DRS XIII - Ribeirão Preto, DRS XIV - São João da Boa Vista, DRS XV - São José do Rio Preto, DRS XVI - Sorocaba e DRS XVII - Taubaté.
The study period was 2020-2021, encompassing the first reported COVID-19 case in Brazil and allowing for an assessment of first and second-dose vaccine coverage [8]. (The nationwide COVID-19 vaccination campaign began in January 2021.) Data collection on mortality from COVID-19, along with health and social indicators, was conducted in April 2022. COVID-19 data were obtained from the State’s System of Data Analysis Foundation (SEADE) [9]; vaccination data came from DATASUS [10]; and population data were sourced from the Brazilian Institute of Geography and Statistics (IBGE) [7]. The Gini index, sourced from DATASUS, according to the World Bank, is a measure of income or consumption distribution within an economy. It indicates the extent to which the distribution deviates from perfect equality, with a Gini index of 0 representing perfect equality and an index of 1 indicating perfect inequality. Table 1 presents the variables collected and their respective data sources.
Inclusion criteria specified confirmed COVID-19 cases and deaths between February 2020 and December 2021, encompassing all municipalities and residents (urban and rural). Incidence and mortality rates were calculated by dividing the number of cases and deaths by the population of each municipality (using population estimates for 2020 and 2021), then multiplying by 100. Data analysis included exploratory descriptive analyses (minimum, maximum, mean, median, and boxplots). A logarithmic transformation was applied to the mortality rate to address asymmetry and outliers, using Box-Cox transformations [11,12]. Determinants of COVID-19 mortality were investigated using Generalized Additive Models for Location, Scale, and Shape (GAMLSS) [13], examining the association between the mortality rate (dependent variable) and various social and health indicators (independent variables) at the municipal level. GAMLSS, with its analytical flexibility and diverse probability distributions, allowed modeling of up to four parameters for improved data fit [13]. The model, represented by the vector , with density function , where and k = 1,2,3,4, used monotonic link functions to relate parameters to independent variables:
The selection of the model used the Generalized Akaike Information Criterion (GAIC) [14], defined as , where is the likelihood function, b is the penalty parameter and represents the degrees of freedom (for AIC, ). An asymmetric t distribution (type 2) [15] was chosen due to the non-Gaussian distribution of the data, employing an identity link function. The adequacy of the model was assessed using diagnostic charts and the Kolmogorov-Smirnov test. Twenty municipalities with significant data missing were excluded. Time series charts illustrate trends in deaths, mortality rates, and vaccination coverage in DRS. Ethical approval was obtained (Research Ethics Committee) and RStudio (version 4.2.1) was used for all analyzes.
3. Results
Between February 2020 and December 2021, the estimated average mortality rate from COVID-19 was 32.0 deaths per 100,000 inhabitants, with a median of 67.9 deaths per 100.000 inhabitants, as shown in table 2 below. We observed that the population aged between 15 and 60 years old corresponded to an average of 69.9 percent and a median of 65.4 percent of the total population. The urban population in the state of São Paulo represented, on average, 84.85 percent. The Gini index, which measures income distribution, had an average value of 0.4586, with a median very close to 0.457, indicating moderate income inequality in the state. In terms of COVID-19 vaccination covered, the average percentage of the immunized population in the state was 90.76 percent, with a median of 84.36 percent. Table 2 presents the detailed results of the descriptive analysis conducted in the study.
Figure 2 displays the distribution of the median number of COVID-19 cases and deaths according to DRS in the state of So Paulo and thethe regions with the highest median number of cases were: DRS I - Grande São Paulo, DRS IV - Baixada Santista, DRS VII - Campinas, DRS XVI - Sorocaba and DRS XVII - Taubaté. Similarly, DRS I - Grande São Paulo and DRS IV - Baixada Santista had the highest median number of deaths. To ensure a more robust analysis and mitigate the influence of outliers, the median was chosen over the mean for the descriptive comparison, as it is not affected by aberrant values.
Regarding the GAMLSS result, variables such as deaths from chronic diseases (V2), the percentage of the population aged 61 years or older (V5), the percentage of the urban population (V9) and COVID-19 vaccination (V11) demonstrated statistical significance, as shown in Table 3.
It was observed that a 1 percent increase in deaths from chronic non-communicable diseases is associated with a relative decrease of 74.59 percet in the mortality rate from COVID-19. Additionally, for each 1 percent increase in the percentage of the older adult population, a relative increase of 8.62 percent in the COVID-19 mortality rate can be expected. Furthermore, it was identified that for every 1 percent increase in the proportion of urban population, a relative increase of 2.38 percent in the mortality rate due to COVID-19 can be expected. Lastly, a 1 percent increase in the COVID-19 vaccine may result in a relative increase of 2.72 percent in the COVID-19 mortality rate. The Kolmogorov-Smirnov test, which was applied to the model’s residuals to test the assumption of normality, presented statistics D = 0.038567 and p-value = 0.3491. Based on these results, it can be concluded that the model fit was adequate, as the residuals followed a normal distribution. Figure 3 provides graphs that support the conclusion that the assumptions about the residuals of the presented model were satisfied, further confirming the model’s adequacy.
Figure 4 demonstrates that in the DRS with higher mortality rates, such as DRS XVI - Sorocaba and DRS XVII - Taubaté, there was indeed greater COVID-19 vaccination. This observation aligns with the results obtained from the GAMLSS analysis.
4. Discussion
This study aimed to identify the determinants of COVID-19 mortality and temporal trends across São Paulo state’s Regional Health Departments (DRS) [6]. Using GAMLSS, we found that higher mortality from chronic non-communicable diseases was associated with a lower COVID-19 mortality rate. Conversely, increases in the older adult population, urban populations, and COVID-19 vaccination were associated with higher COVID-19 mortality. Globally, COVID-19 continues to cause significant mortality, exacerbated by emerging variants [16]. In Brazil, particularly São Paulo state, certain regions were disproportionately affected. From February 2020 to December 2022, Brazil reported 34,542,868 cases and 691,810 deaths, representing incidence and mortality rates of 17,069 and 329.2 per 100,000 inhabitants, respectively [17]. São Paulo reported even higher rates (13,622.2 and 385.2 per 100,000, respectively) during this period. Among São Paulo’s DRS, DRS I (Grande São Paulo) and DRS IV (Baixada Santista) recorded the highest numbers of cases and deaths. DRS I, encompassing 39 municipalities including the state capital, and DRS IV, with nine municipalities including the major port city of Santos, experienced the greatest impacts [5,18]. The first imported COVID-19 case in Brazil was confirmed in São Paulo on February 26, 2020, followed by the first death on March 12, 2020 [9]. By April 2020, all DRS had reported cases and deaths [9]. The high mortality in DRS I and IV may be attributed to these regions’ status as economic centers, with large populations and extensive healthcare infrastructure leading to greater demand for services [18]. The spread of COVID-19 from São Paulo’s capital towards the interior, particularly noticeable in the first year, followed major highways, connecting the capital to coastal and interior regions [18]. This study’s findings align with existing knowledge regarding COVID-19’s clinical pathophysiology and the influence of various factors on mortality. Higher mortality from chronic non-communicable diseases (NCDs) correlated with lower COVID-19 mortality rates. Individuals with NCDs (hypertension, diabetes, respiratory, and cardiovascular diseases) have been linked to more severe COVID-19 outcomes and higher mortality [19,20,21]. Meta-analyses identified COPD, cardiovascular diseases, hypertension, and diabetes as strong predictors of severe COVID-19, particularly for hospitalized patients [22,23]. Other conditions (cancer, asthma, liver disease, HIV/AIDS) were also associated with poor outcomes [24]. The CDC indicated that individuals with NCDs face a greater risk of severe COVID-19 outcomes or death [25,26,27]. This bidirectional relationship means that pre-existing conditions can worsen due to COVID-19, and these conditions can exacerbate COVID-19 severity, increasing hospitalization duration and mortality [28,29]. This ecological study is subject to ecological fallacy; thus, the associations identified cannot be directly generalized to individuals. Our analysis showed that an 8.62 percent relative increase in COVID-19 mortality is associated with a 1 percent increase in the older adult population [30,31]. Studies in Brazil and globally showed higher COVID-19 incidence in adults, but higher mortality in older adults, particularly those with comorbidities [30,31]. Another Brazilian study reported mortality rates of 8-9percent for those aged 60-79 and 14.8percent for those 80+, significantly higher than the overall average (2-3 percent) [31]. This highlights the increased risk of death in older adults with comorbidities. A 2.38 percent relative increase in COVID-19 mortality is associated with a 1 percent increase in the urban population [32]. This aligns with CDC findings showing a 30 percent higher age-adjusted death rate in large metropolitan areas compared to medium-sized urban areas [31]. This highlights the influence of population density and connectivity on viral spread. The spread of SARS-CoV-2 is linked to human mobility and connectivity, especially in globally connected cities with airports [16,33]. The speed of contagion and spatial spread of COVID-19 vary depending on factors such as population density and distribution [34,35]. Social distancing measures are crucial in managing outbreaks, especially in densely populated areas [35,36]. Higher social exposure correlates with higher incidence and mortality [37]. Urban centers are implicated in COVID-19 spread [37], due to increased connectivity and population density. While vaccination is crucial in reducing mortality, our GAMLSS analysis revealed a positive association between vaccination and mortality. However, this counterintuitive finding is likely due to the January 2021 start of Brazil’s nationwide vaccination campaign, meaning that a large portion of our study period (2020-2021) had zero vaccination coverage [38,39]. This zero coverage likely confounds our results. Further research focusing on the post-vaccination period is necessary. The uneven distribution of COVID-19 deaths in Brazil, with five states accounting for 81 percent of all deaths, underscores geographic and social disparities [40]. Brazil’s vaccination campaign began in January 2021, while the UK began in December 2020 [39]. Manaus, Brazil, quickly became an epicenter after the start of vaccination, with the rapid spread of the Gamma variant overwhelming its health system [40]. The increased vaccine allocation to Amazonas in response highlights the impact of pre-existing vulnerabilities on the spread of the disease. This increased vaccination in the hardest hit areas likely reduced vaccine hesitancy in these populations [39]. This study’s limitations include the inherent challenges of ecological fallacy, as aggregated data limits individual-level inferences. Data limitations, with missing information in some municipalities, might also affect the conclusions. These potential issues (underreporting or delayed diagnoses) highlight the need for continuous monitoring and reporting efforts at the local level. Further research using different methodological approaches is needed to fully understand the complex epidemiological dynamics of COVID-19 across Brazil. Studies identifying specific factors associated with negative COVID-19 outcomes are crucial for informing public health policies, strengthening healthcare systems, and improving patient care.
5. Conclusions
In view of the findings, it is crucial to consider various factors when identifying the subgroups with the highest risk of complications and mortality from COVID-19, These factors include requires the consideration of behavioral factors (such as smoking, alcohol consumption, physical activity, among others), genetic makeup, family history, economic factors such as income and access to health care, demographic factors (such as age, gender, race, etc.) and environmental factors. Given the diverse characteristics and specificities of both individuals and regions, it is essential to develop regionalized policies and consider population dynamics, geographical features, socioeconomic conditions and budgetary constraints. These factors play crucial roles in studying the evolution and progression of the disease. This study sheds light on the situation of Covid-19 in Brazilian Health Regions, which are divided into DRS. Health Regions serve as organizational units that share cultural, economic and social identities, communication networks and common infrastructure. They also pool resources and inputs within the SUS (Unified Health System), aligning with the principle of decentralization and integrating the organization, planning, and execution of health actions and services in Brazil. Therefore, this study is the first to analyze COVID-19 at the regional level, providing insights into the most severely affected regions during the pandemic. It can inform policy adjustments, programs, and actions in response to the epidemiological situation. Moreover, the study may serve as a reference for future research on other health issues, promoting equity by addressing inequalities and meeting the diverse needs that arise within the daily lives of Regional Health Departments (DRS).
Author Contributions
Conceptualization: T. P. Barbosa, R. A. Arcêncio; Methodology: T. P. Barbosa; Software: T. P. Barbosa, F. S. J. Paiva; Validation: T. P. Barbosa, J. B. Alonso, R. A. Arcêncio; Formal analysis: T. P. Barbosa; Investigation: T. P. Barbosa; Resources: T. P. Barbosa; Data curation: T. P. Barbosa, F. S. J. Paiva; Writing—original draft preparation: T. P. Barbosa; Writing—review and editing: T. P. Barbosa, T. Z. Berra, A. C. V. Ramos, F. S. J. Paiva, J. B. Alonso, T. K. A. Teibo, J. S. T. Araújo, A. F. Tártaro, R. A. Arcêncio; Visualization: T. P. Barbosa, T. Z. Berra, A. C. V. Ramos, F. S. J. Paiva, J. B. Alonso, T. K. A. Teibo, J. S. T. Araújo, A. F. Tártaro, R. A. Arcêncio; Supervision: R. A. Arcêncio; Project administration: T. P. Barbosa. All authors have read and agreed to the published version of the manuscript.
Funding
This research was funded in part by the Coordenação de Aperfeiçoamento de Pessoal de Nível Superior - Brasil (CAPES) (Finance Code 001) and FAPESP (Process 2021/08263-7; Social Thermometer for COVID-19). The CAPES project (Process 88887.657730/2021-01; COVID-19 Social Thermometer) also provided funding.
Institutional Review Board Statement
This study was approved by the Research Ethics Committee (CEP) of the School of Nursing of Ribeirão Preto at the University of São Paulo (EERP/USP) under Ethical Appreciation Presentation Certificate (CAAE) No. 32210320.1.3001.5393. The entire research was conducted in accordance with Resolution No. 466, dated December 12, 2012, from the National Health Council, adhering to the relevant ethical and scientific principles.
Data Availability Statement
Conflicts of Interest
The authors declare no conflicts of interest.
References
- Barbosa, T. P., Costa, F. B., Ramos, A. C. V., Berra, T. Z., Arroyo, L. H., Alves, Y. M., Santos, F. L., & Arcêncio, R. A. (2022). Morbimortalidade por COVID-19 associada a condições crônicas, serviços de saúde e iniquidades: evidências de sindemia. Revista Panamericana de Salud Pública, 46(1), 1. Available from. [CrossRef]
- Arcêncio, R. (2021). Reiterando o sentido da epidemiologia social na compreensão das desigualdades e avanço da equidade em tempos da COVID-19. ihmt. Available from: https://anaisihmt.com/index.php/ihmt/article/view/375.
- Lima Kubo, H. K., Campiolo, E. L., Ochikubo, G. T., & Batista, G. (2020). Impacto da pandemia do COVID19 no serviço de saúde: uma revisão de literatura. Interamerican Journal of Medicine and Health, 3. Available from. [CrossRef]
- Secretaria de Estado da Saúde de São Paulo. (2020). Plano de Contingência do Estado de São Paulo para a Infecção Humana pelo novo Coronavírus (SARS-CoV-2). Available from: https://www.saude.sp.gov.br/resources/ccd/homepage/covid-19/versao_final_finalplano_de_contigencia_03_04_rev_3.pdf.
- Secretaria de Estado da Saúde de São Paulo. (2012). Estado de São Paulo, segundo Departamentos de Saúde. Available from: https://www.saude.sp.gov.br/ses/institucional/departamentos-regionais-de-saude/regionais-de-saude.
- Secretaria da Saúde. (2023). Departamentos Regionais de Saúde - Secretaria da Saúde - Governo do Estado de São Paulo. Available from: https://saude.sp.gov.br/ses/institucional/departamentos-regionais-de-saude/ [cited 2023 Oct 5].
- IBGE. (2022). São Paulo | Cidades e Estados | IBGE. Available from: https://www.ibge.gov.br/cidades-e-estados/sp.html.
- Butantan. (2022). Vacinação contra COVID-19 no Brasil completa 1 ano com grande impacto da CoronaVac na redução de hospitalizações e mortes. Available from: https://butantan.gov.br/noticias/vacinacao-contra-covid-19-no-brasil-completa-1-ano-com-grande-impacto-da-coronavac-na-reducao-de-hospitalizacoes-e-mortes.
- Brasil. Fundação Sistema Estadual de Análise de Dados (SEADE). (2022). Dados Abertos. Available from: https://github.com/seade-R/dados-covid-sp.
- Brasil. Ministério da Saúde. DATASUS. (2022). COVID-19 - Vacinação. Available from: https://opendatasus.saude.gov.br/dataset/covid-19-vacinacao/.
- Cleveland, W. S., & Grosse, E. (1991). Computational methods for local regression. Statistics and Computing, 1(1), 47–62. Available from. [CrossRef]
- Box, G. E., & Cox, D. R. (1964). An analysis of transformations. Journal of the Royal Statistical Society: Series B (Methodological), 26(2), 211–243. Available from. [CrossRef]
- Heller, G. Z., Stasinopoulos, M. D., Rigby, R. A., & Bastiani, F. D. (2019). Distributions for Modeling Location, Scale, and Shape: Using GAMLSS in R. Taylor & Francis Group.
- Akaike, H. (1974). A new look at statistical model identification. IEEE Transactions on Automatic Control, 19(6), 716–723. Available from. [CrossRef]
- Azzalini, A., & Capitanio, A. (2003). Distributions generated by perturbation of symmetry with emphasis on a multivariate skew t-distribution. Journal of the Royal Statistical Society: Series B (Statistical Methodology), 65(2), 367–389. Available from. [CrossRef]
- World Health Organization (WHO). (2020). Coronavirus Disease (COVID-19) Situation Reports. Available from: https://www.who.int/emergencies/diseases/novel-coronavirus-2019/situation-reports.
- Barbosa, I. R., Galvão, M. H. R., Souza, T. A. de, Gomes, S. M., Medeiros, A. de A., & Lima, K. C. de. (2020). Incidence of and mortality from COVID-19 in the older Brazilian population and its relationship with contextual indicators: an ecological study. Revista Brasileira de Geriatria e Gerontologia, 23(1). Available from: https://www.scielo.br/pdf/rbgg/v23n1/pt_1809-9823-rbgg-23-01-e200171.pdf.
- Lorenz, C., Ferreira, P. M., Masuda, E. T., Lucas, P. C., Palasio, R. G., Nielsen, L., ... & Carvalhanas, T. R. (2021). COVID-19 no estado de São Paulo: a evolução de uma pandemia. Revista Brasileira de Epidemiologia, 24. Available from. [CrossRef]
- Gold, M. S., Sehayek, D., Gabrielli, S., Zhang, X., McCusker, C., & Ben-Shoshan, M. (2020). COVID-19 and comorbidities: a systematic review and meta-analysis. Postgraduate Medicine, 132(8), 749–755. Available from. [CrossRef]
- Wang, Z., Deng, H., Ou, C., Liang, J., Wang, Y., Jiang, M., & Li, S. (2020). Clinical symptoms, comorbidities and complications in severe and non-severe patients with COVID-19. Medicine, 99(48), e23327. Available from. [CrossRef]
- Jain, V., & Yuan, J. M. (2020). Predictive symptoms and comorbidities for severe COVID-19 and intensive care unit admission: a systematic review and meta-analysis. International Journal of Public Health, 65(5), 533–546. Available from. [CrossRef]
- Kumar, A., Arora, A., Sharma, P., Anikhindi, S. A., Bansal, N., Singla, V., ... & Srivastava, A. (2020). Is diabetes mellitus associated with mortality and severity of COVID-19? A meta-analysis. Diabetes & Metabolic Syndrome: Clinical Research & Reviews, 14(4), 535–545. Available from. [CrossRef]
- Sentongo, P., Ssentongo, A. E., Heilbrunn, E. S., Ba, D. M., & Chinchilli, V. M. (2020). Association of cardiovascular disease and 10 other pre-existing comorbidities with COVID-19 mortality: A systematic review and meta-analysis. PLOS ONE, 15(8), e0238215. Available from. [CrossRef]
- The Lancet. (2020). COVID-19: a new lens for non-communicable diseases. The Lancet, 396(10252), 649. Available from. [CrossRef]
- Clark, A., Jit, M., Warren-Gash, C., Guthrie, B., Wang, H. H., Mercer, S. W., ... & et al. (2020). Global, regional, and national estimates of the population at increased risk of severe COVID-19 due to underlying health conditions in 2020: a modelling study. The Lancet Global Health, 8(8), e1003–e1017. Available from. [CrossRef]
- Azarpazhooh, M. R., Morovatdar, N., Avan, A., Phan, T. G., Divani, A. A., Yassi, N., ... & Di Napoli, M. (2020). COVID-19 pandemic and burden of non-communicable diseases: An ecological study on data of 185 countries. Journal of Stroke and Cerebrovascular Diseases, 29(9), 105089. Available from. [CrossRef]
- Kluge, H. H., Wickramasinghe, K., Rippin, H. L., Mendes, R., Peters, D. H., Kontsevaya, A., & Breda, J. (2020). Prevention and control of non-communicable diseases in the COVID-19 response. The Lancet, 395(10238), 1678–1680. Available from. [CrossRef]
- Richardson, S., Hirsch, J. S., Narasimhan, M., Crawford, J. M., McGinn, T., Davidson, K. W., ... & et al. (2020). Presenting characteristics, comorbidities, and outcomes among 5700 patients hospitalized with COVID-19 in the New York City area. JAMA, 323(20), 2052. Available from. [CrossRef]
- Shahid, Z., Kalayanamitra, R., McClafferty, B., Kepko, D., Ramgobin, D., Patel, R., ... & Jain, R. (2020). COVID-19 and older adults: What we know. Journal of the American Geriatrics Society, 68(5), 926–929. Available from. [CrossRef]
- Barbosa, I. R., Galvão, M. H., Souza, T. A., Gomes, S. M., Medeiros, A. D., & Lima, K. C. (2020). Incidence of and mortality from COVID-19 in the older Brazilian population and its relationship with contextual indicators: an ecological study. Revista Brasileira de Geriatria e Gerontologia, 23(1). Available from. [CrossRef]
- Curtin, S. C., & Heron, M. (2022). COVID-19 death rates in urban and rural areas: United States, 2020. NCHS Data Brief, no 447. Hyattsville, MD: National Center for Health Statistics. Available from: . [CrossRef]
- Mecha López, R. (2021). Review of: Méndez Gutiérrez del Valle, R. (2020). Besieged by the pandemic. From collapse to reconstruction: geographic notes. Espacio Tiempo y Forma. Series VI, Geography, 14, 227–232. Available from. [CrossRef]
- Guimarâes, R. B., Catão, R. D., Martinuci, O. D., Pugliesi, E. A., & Matsumoto, P. S. (2020). O raciocínio geográfico e as chaves de leitura da Covid-19 no território brasileiro. Estudos Avançados, 34(99), 119–140. Available from. [CrossRef]
- De Castro Leiva, G., Dos Reis, D. S., & Filho, R. D. (2020). Estrutura urbana e mobilidade populacional: implicações para o distanciamento social e disseminação da Covid-19. Revista Brasileira de Estudos de População, 37, 1–22. Available from. [CrossRef]
- Velavan, T. P., & Meyer, C. G. (2020). The COVID-19 epidemic. Tropical Medicine & International Health, 25(3), 278–280. Available from. [CrossRef]
- Lau, H., Khosrawipour, V., Kocbach, P., Mikolajczyk, A., Schubert, J., Bania, J., ... & Khosrawipour, T. (2020). The positive impact of lockdown in Wuhan on containing the COVID-19 outbreak in China. Journal of Travel Medicine, 27(3). Available from. [CrossRef]
- Sathler, D., & Leiva, G. (2022). A cidade importa: urbanização, análise regional e segregação urbana em tempos de pandemia de Covid-19. Revista Brasileira de Estudos de População, 39, 1–30. Available from. [CrossRef]
- Couto, M. T., Barbieri, C. L., & Mattos, C. C. (2021). Considerações sobre o impacto da covid-19 na relação indivíduo-sociedade: da hesitação vacinal ao clamor por uma vacina. Saúde e Sociedade, 30(1). Available from. [CrossRef]
- Orellana, J. D., Cunha, G. M., Marrero, L., Leite, I. D., Domingues, C. M., & Horta, B. L. (2022). Mudanças no padrão de internações e óbitos por COVID-19 após substancial vacinação de idosos em Manaus, Amazonas, Brasil. Cadernos de Saúde Pública, 38(5). Available from. [CrossRef]
- Orellana, J. D., Cunha, G. M., Marrero, L., Horta, B. L., & Leite, I. D. (2020). Explosão da mortalidade no epicentro amazônico da epidemia de COVID-19. Cadernos de Saúde Pública, 36(7). Available from. [CrossRef]
Figure 1.
Regional health departments in the state of São Paulo.
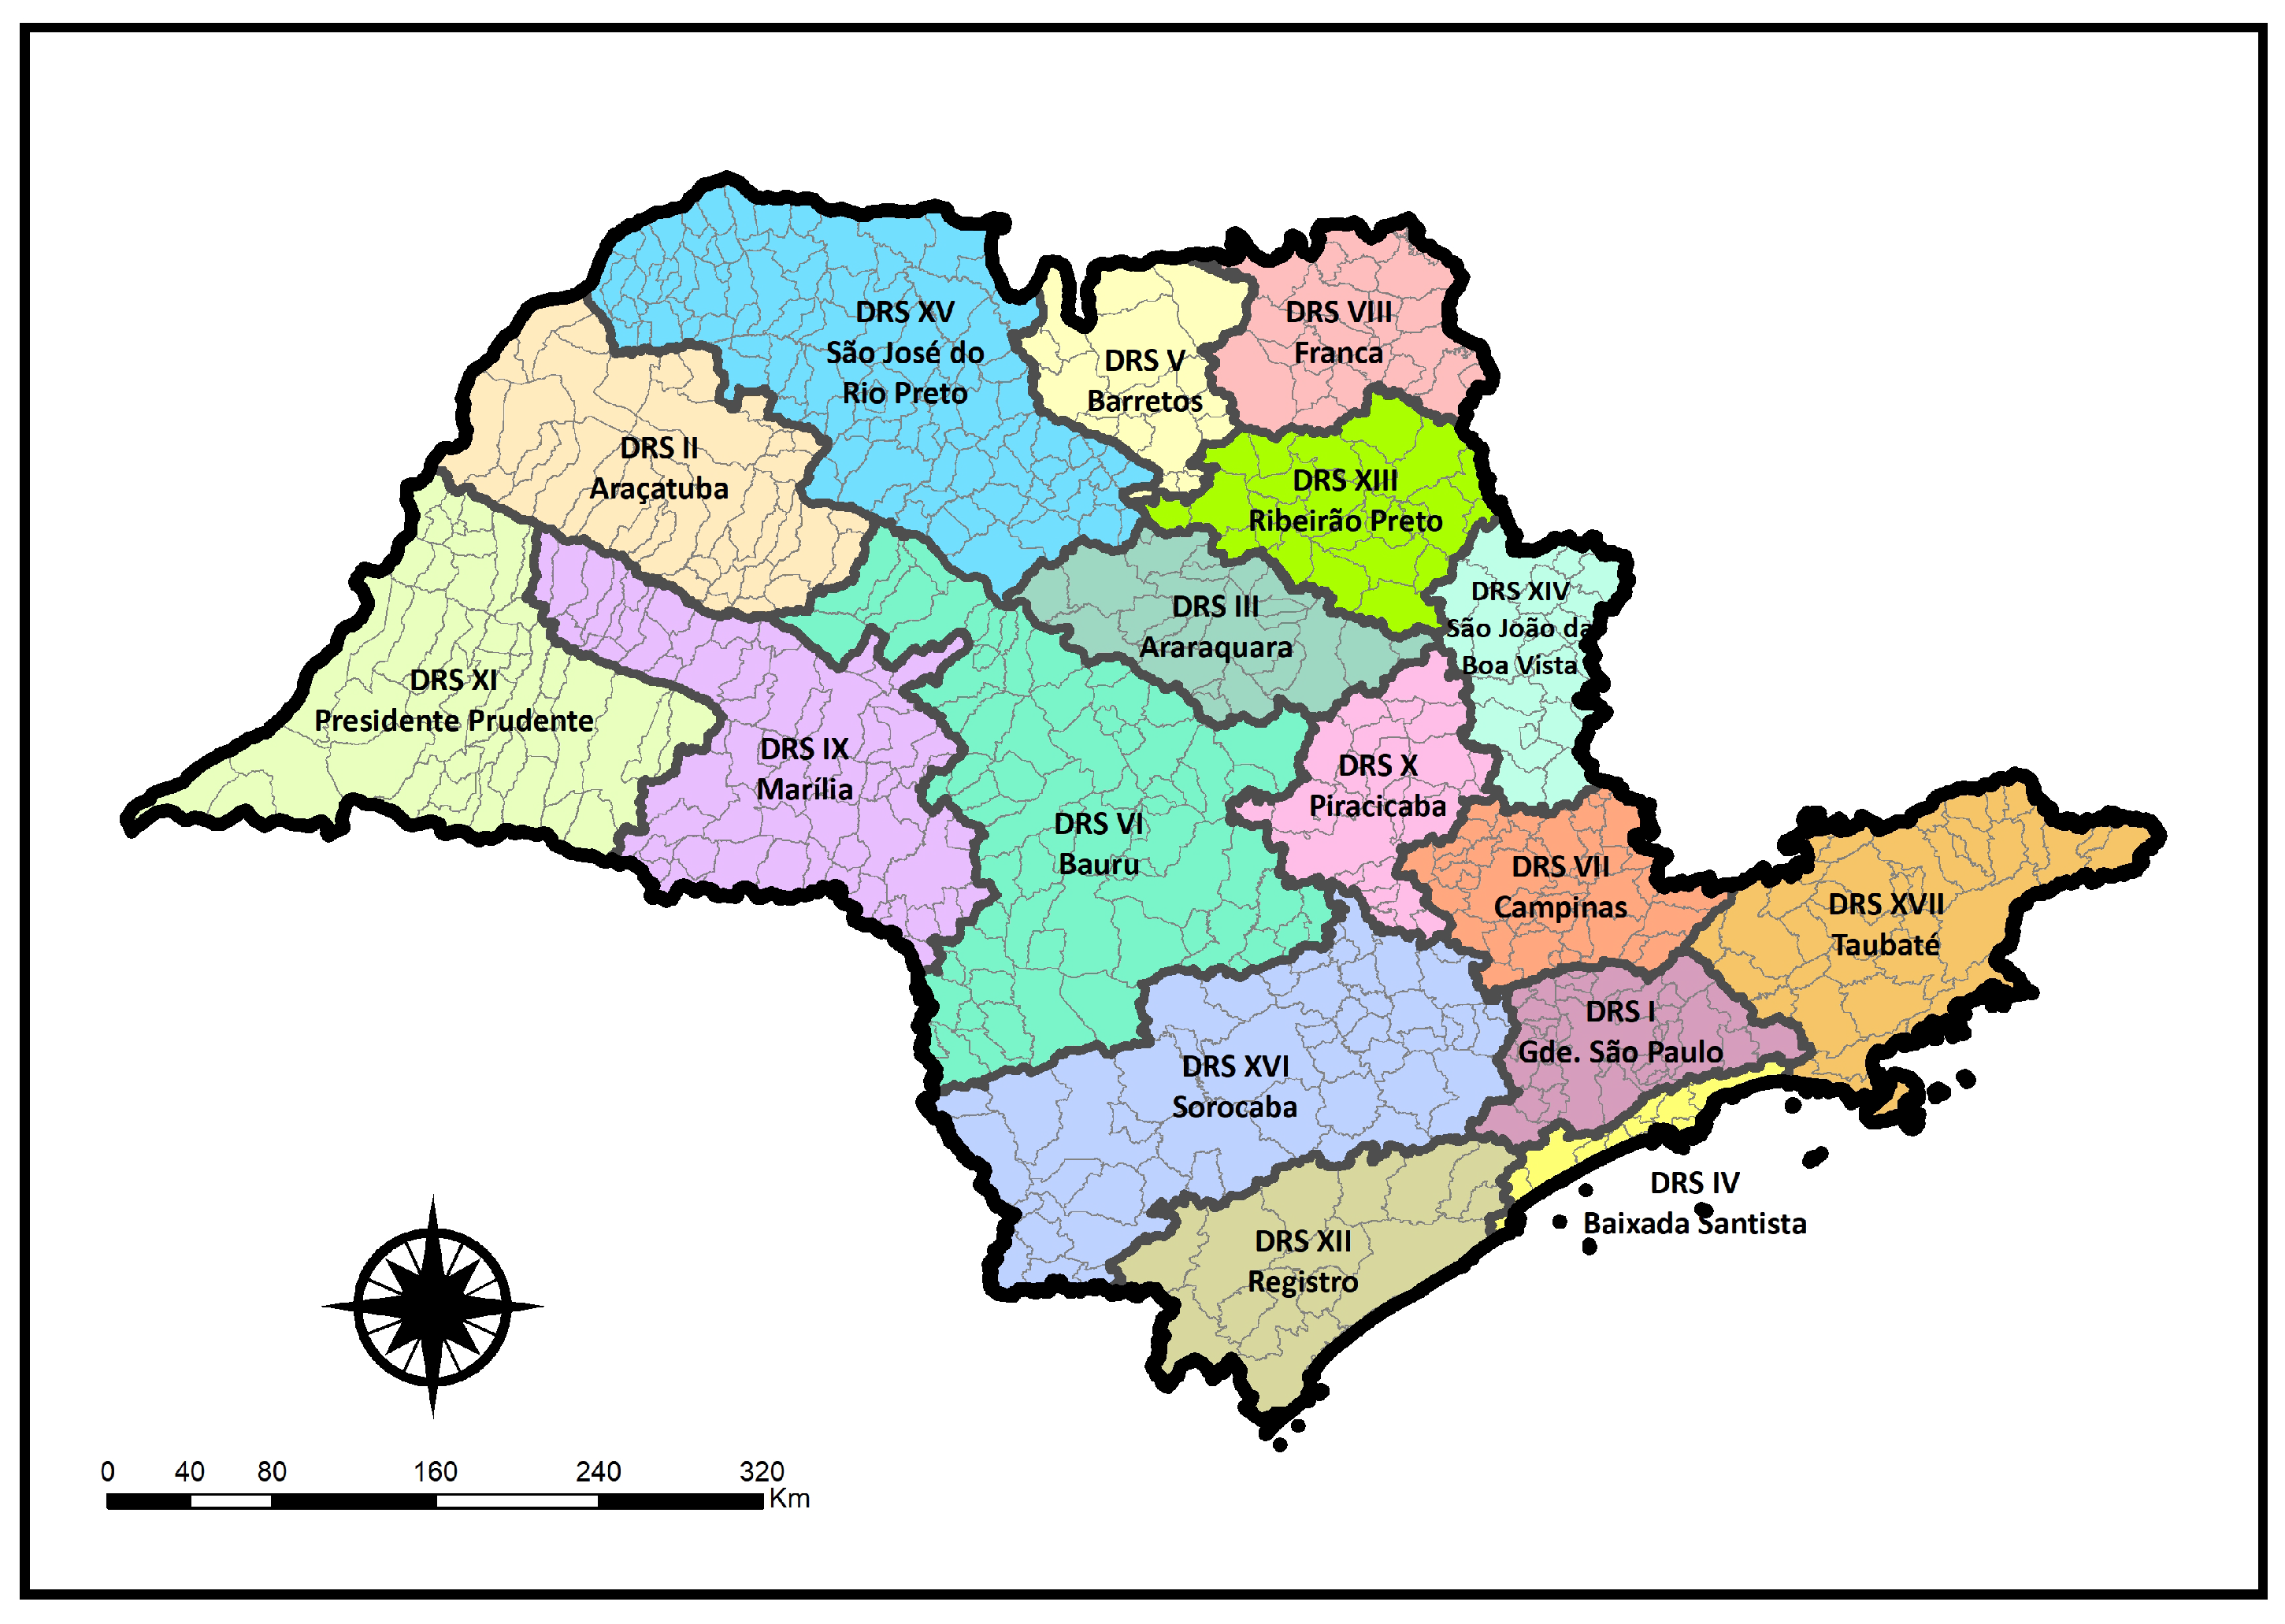
Figure 2.
Distribuição da mortalidade por COVID-19 por região de saúde, Estado de São Paulo (2020–2021).
Figure 2.
Distribuição da mortalidade por COVID-19 por região de saúde, Estado de São Paulo (2020–2021).
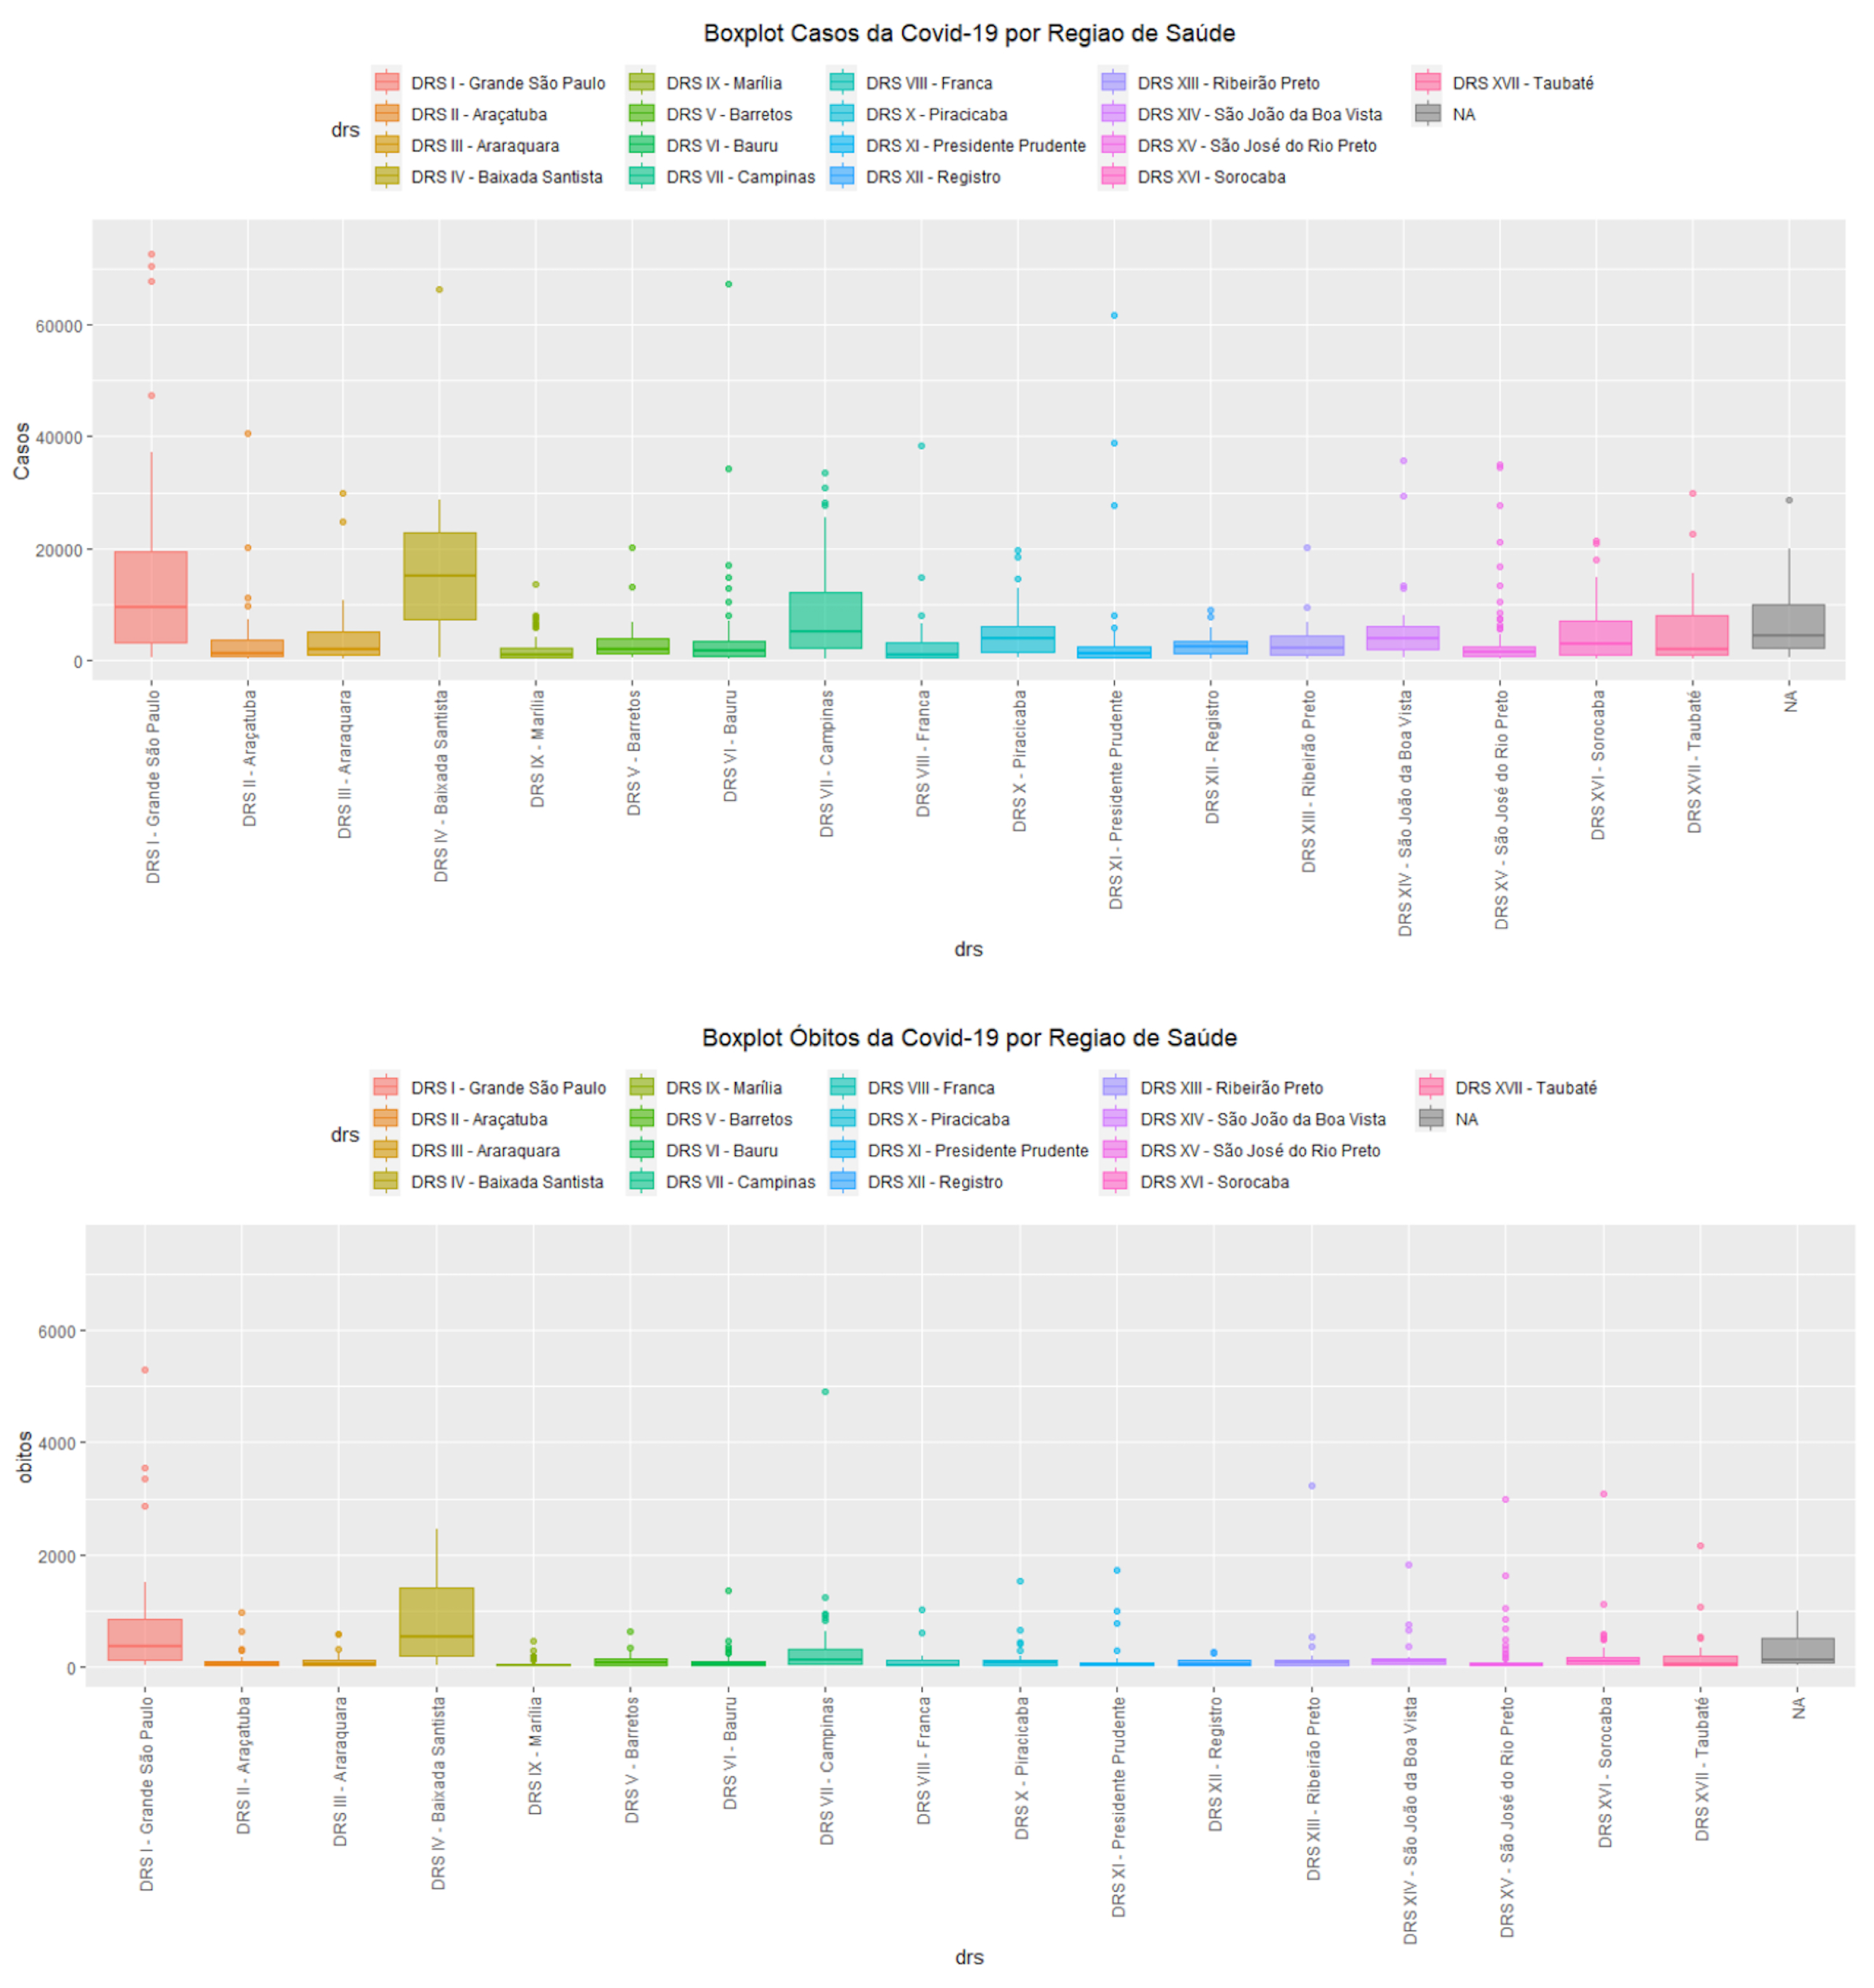
Figure 3.
Diagnostic graphics of the adjusted model
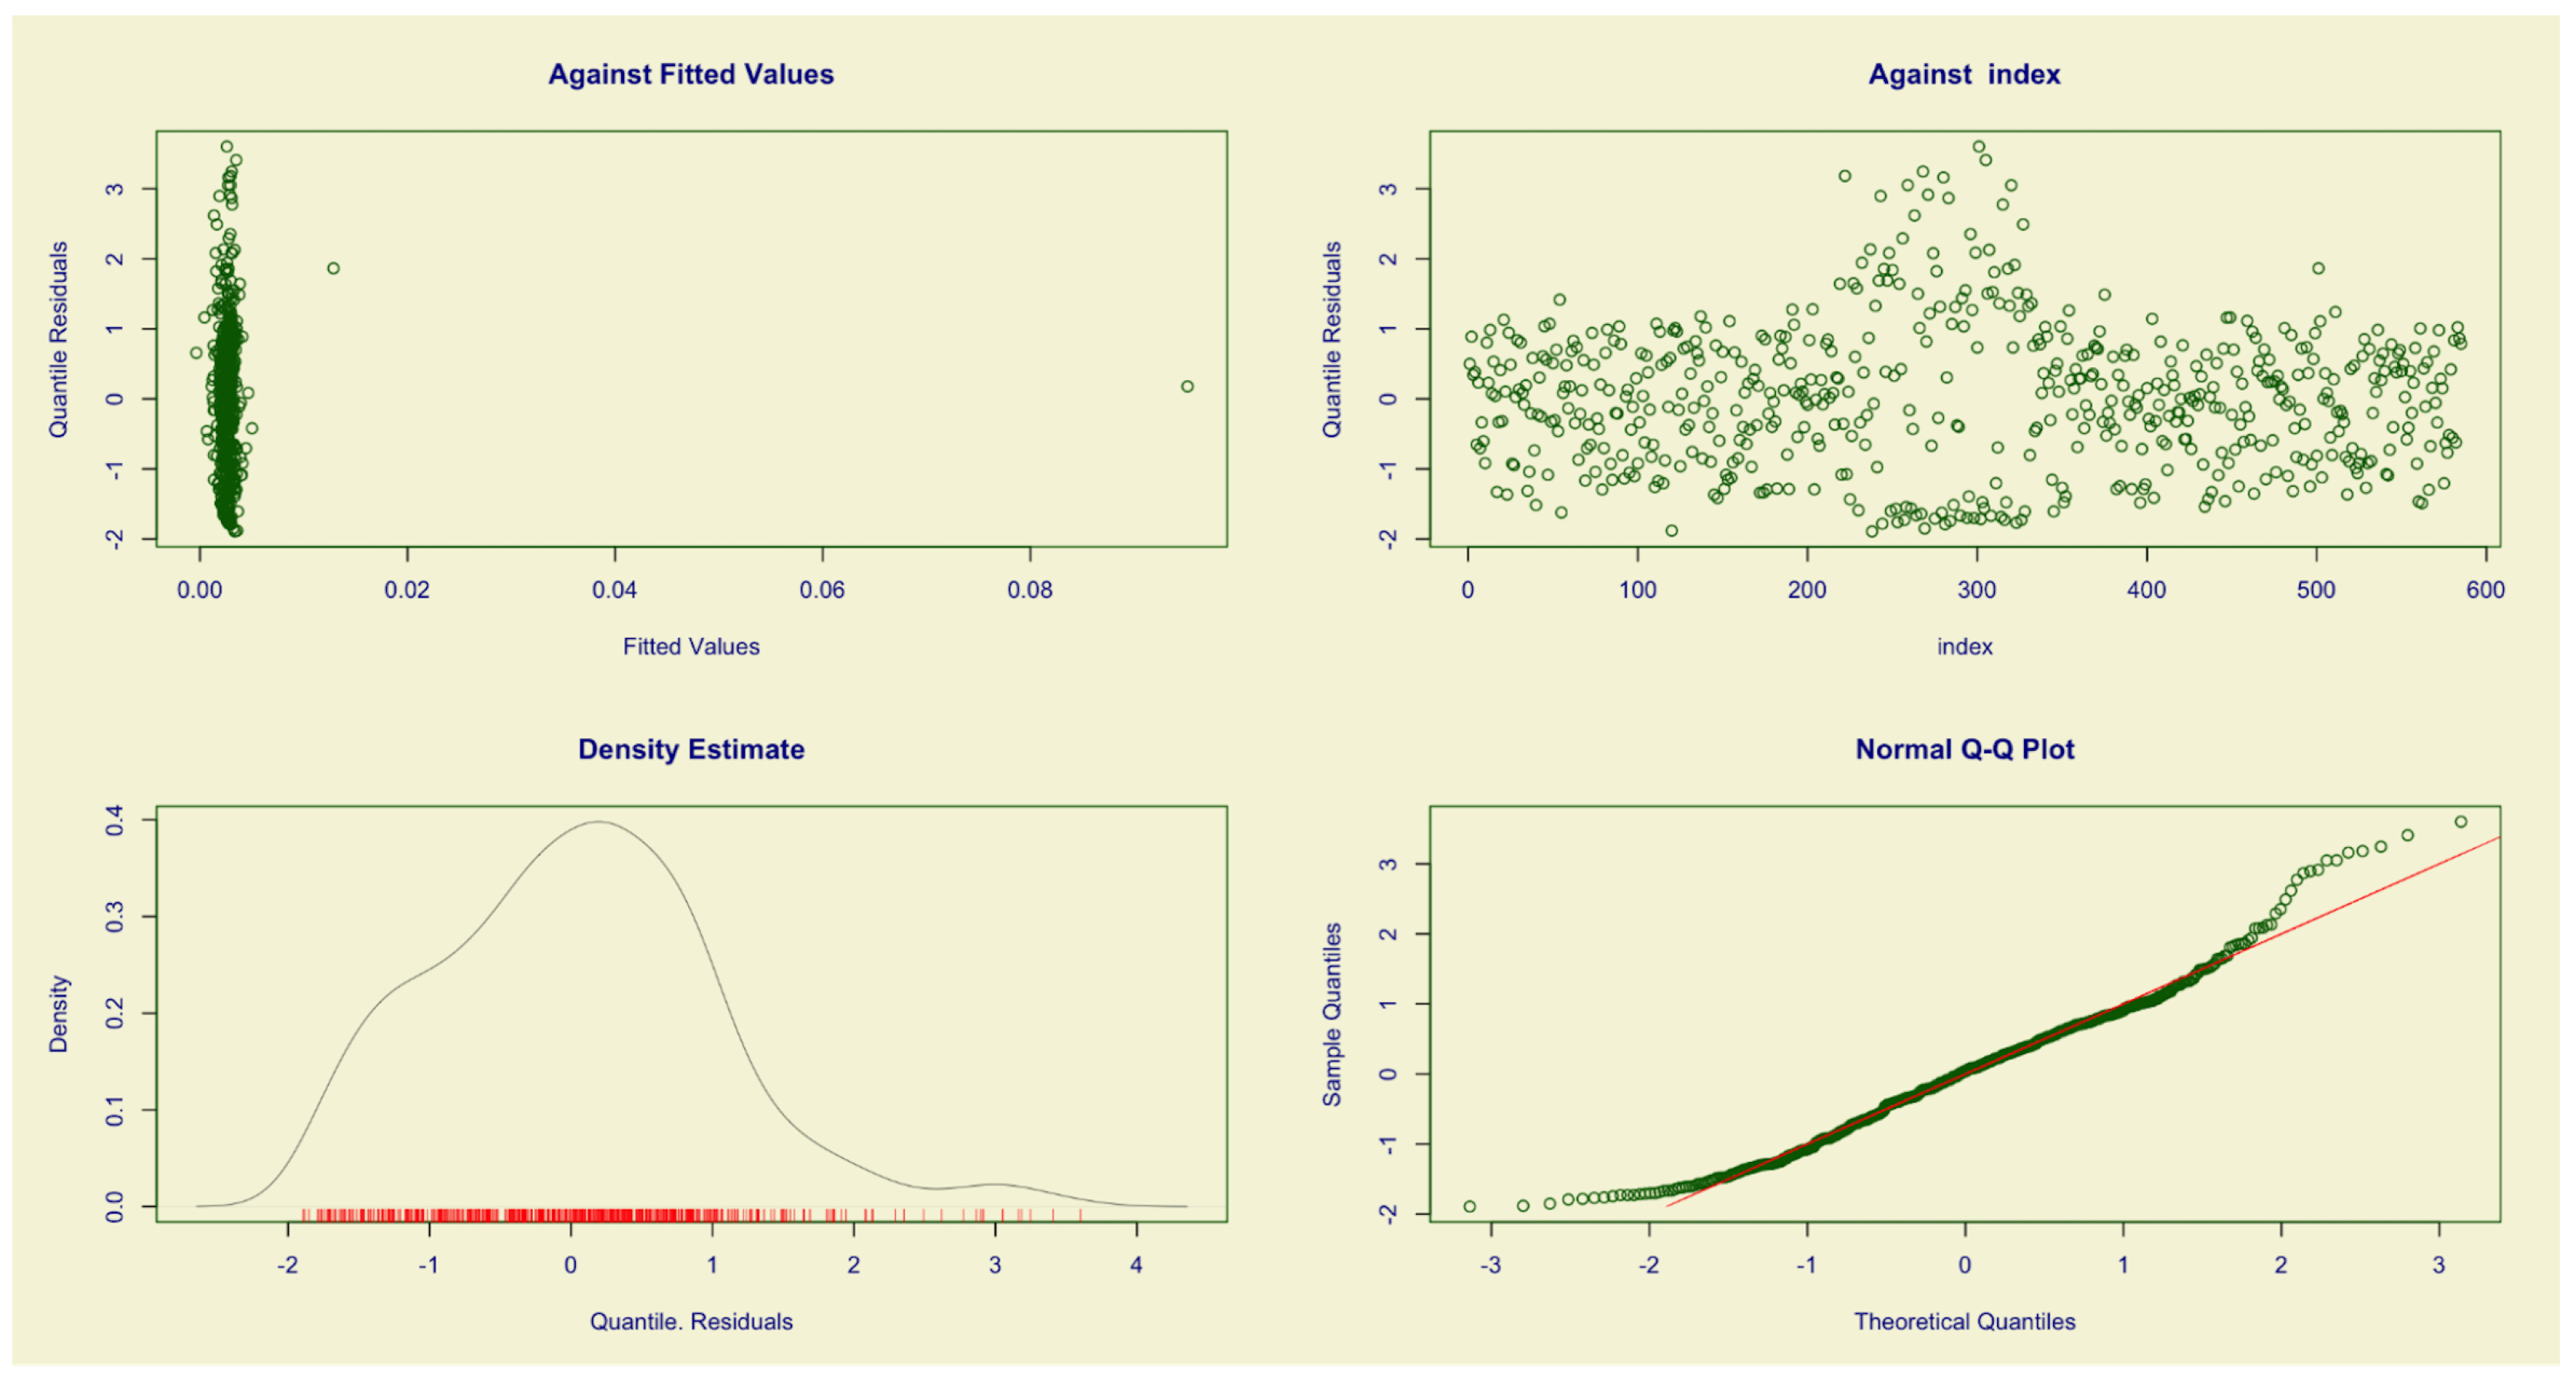
Figure 4.
Time series analysis of COVID-19 mortality rates (per 100,000 inhabitants) and vaccination coverage (first and second doses) across DRS.
Figure 4.
Time series analysis of COVID-19 mortality rates (per 100,000 inhabitants) and vaccination coverage (first and second doses) across DRS.
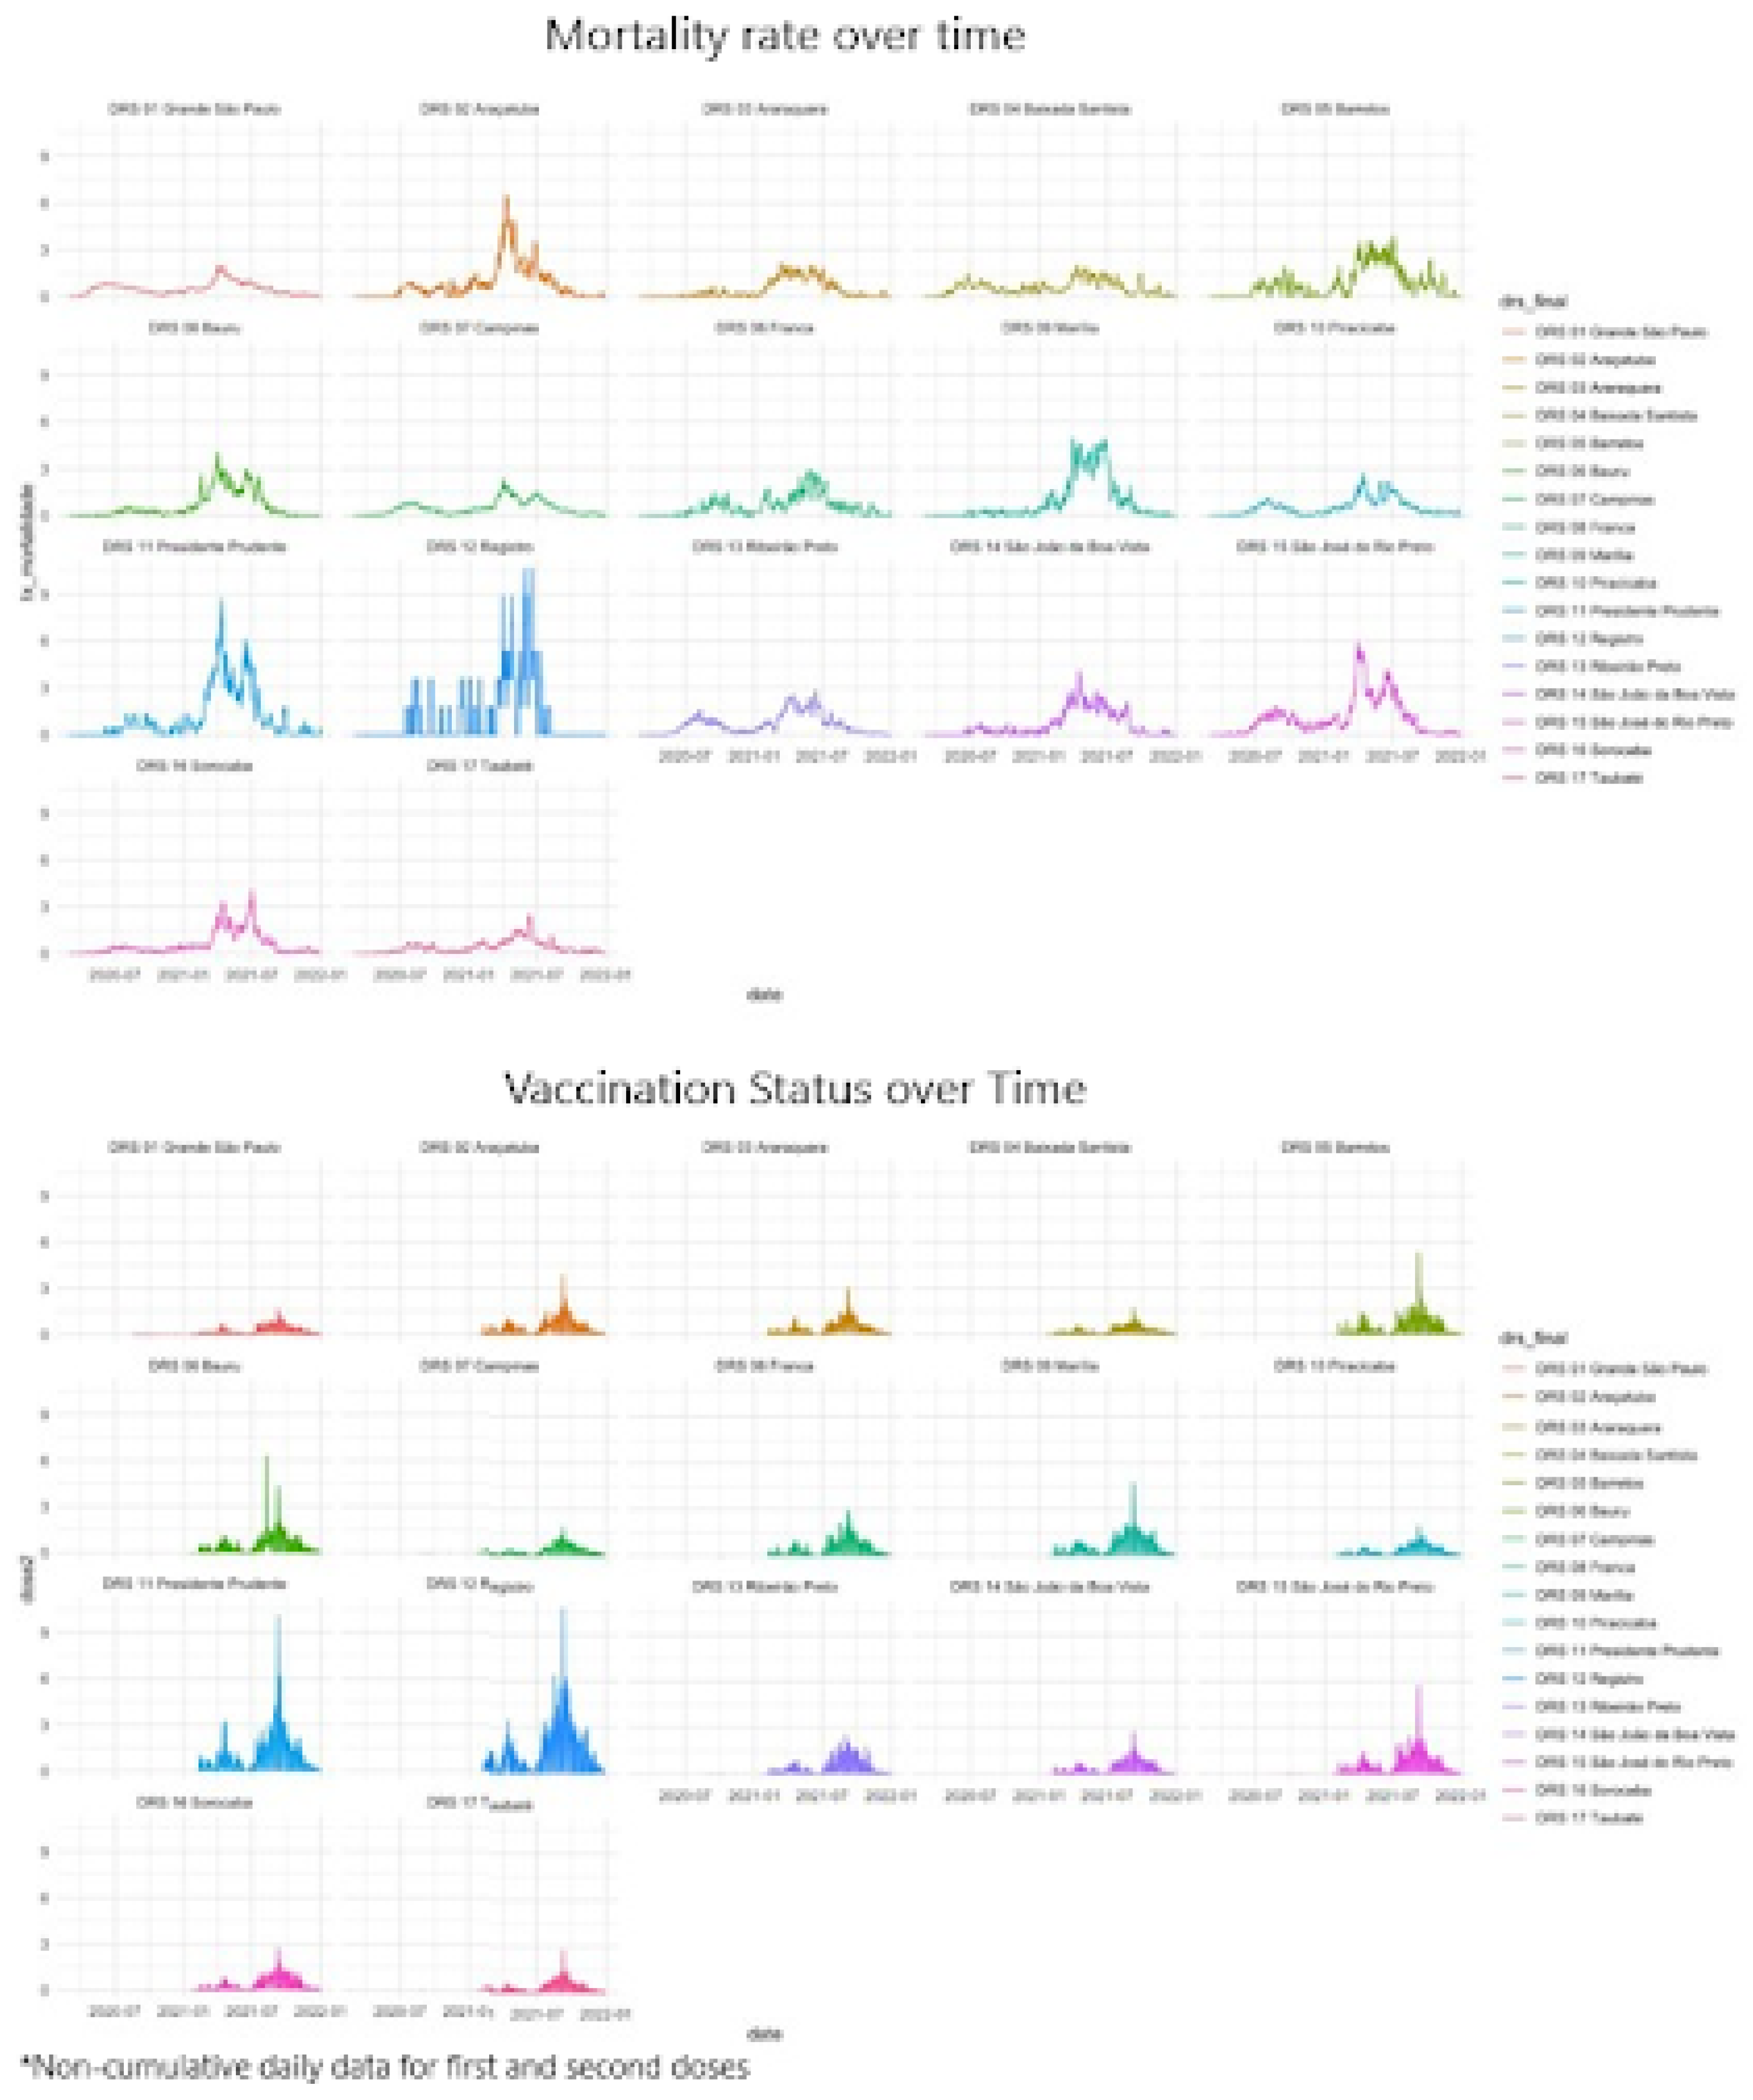

Table 1.
Study variables categorized by dimension and data source.
| Dimension | Variables | Data Source |
|---|---|---|
| COVID-19 | COVID-19 mortality rate per 100,000 inhabitants | SEADE |
| Health Indicators | Applied doses (COVID-19 vaccines; 1st and 2nd doses) | DATASUS |
| Deaths from non-communicable chronic diseases | DATASUS | |
| Social Indicators | General population | IBGE |
| Population by age group | SEADE | |
| Urban population | IBGE | |
| Gini index | DATASUS |
Table 2.
Descriptive analysis of dependent and independent variables (February 2020–December 2021).
| Variable | Min | Median | Average | Max |
|---|---|---|---|---|
| Mortality rate per 100,000 inhabitants | 0 | 0.0032 | 0.0067 | 0.4979 |
| Deaths from chronic non-communicable diseases (% of total population) | 0 | 0.0019 | 0.0197 | 0.8615 |
| Population aged 0-14 years (% of total population) | 7.40 | 21.44 | 21.31 | 30.49 |
| Population aged 15-60 years (% of total population) | 57.09 | 65.38 | 68.91 | 2177.64 |
| Population aged 61+ years (% of total population) | 6.15 | 13.04 | 13.12 | 25.02 |
| Urban population (% of total population) | 24.90 | 88.7 | 84.85 | 100 |
| Gini index (range 0-1) | 0 | 0.4573 | 0.4586 | 0.6858 |
| COVID-19 Vaccination Coverage | 0.10 | 84.36 | 90.76 | 2986.84 |
Note: V2 = Deaths from non-transmissible chronic diseases; V3 = Percentage of population aged 0-14 years; V4 = Percentage of population aged 15-60 years; V5 = Percentage of population aged 61+ years; V9 = Percentage of urban population; V10 = Gini index (World Bank calculation estimate divided by 100); V11 = COVID-19 vaccination (calculation of total applied doses of the second vaccine dose divided by population 100).
Table 3.
Final model adjusted to identify factors associated with mortality from COVID-19 in São Paulo State.
Table 3.
Final model adjusted to identify factors associated with mortality from COVID-19 in São Paulo State.
| Variable | Estimate | Std. Error | t value | P value | Relative Increase (%) |
|---|---|---|---|---|---|
| (Intercept) | -2.28 | 0.671 | -3.391 | 0.000743 *** | - |
| V2 | -1.37 | 0.653 | -2.091 | 0.036939 * | -74.59 |
| V4 | 0.0002 | 0.0008 | 0.246 | 0.805826 | - |
| V5 | 0.0827 | 0.0169 | 4.902 | 1.23e-06 *** | 8.62 |
| V9 | 0.0235 | 0.0036 | 6.572 | 1.11e-10 *** | 2.38 |
| V10 | -0.930 | 0.871 | -1.068 | 0.286068 | - |
| V11 | 0.0268 | 0.0044 | 6.075 | 2.25e-09 *** | 2.72 |
Note: V2 = Deaths from non-transmissible chronic diseases; V3 = Percentage of population aged 0-14 years; V4 = Percentage of population aged 15-60 years; V5 = Percentage of population aged 61+ years; V9 = Percentage of urban population; V10 = Gini index (World Bank calculation estimate divided by 100); V11 = COVID-19 vaccination (calculation of total applied doses of the second vaccine dose divided by population 100).
Disclaimer/Publisher’s Note: The statements, opinions and data contained in all publications are solely those of the individual author(s) and contributor(s) and not of MDPI and/or the editor(s). MDPI and/or the editor(s) disclaim responsibility for any injury to people or property resulting from any ideas, methods, instructions or products referred to in the content. |
© 2025 by the authors. Licensee MDPI, Basel, Switzerland. This article is an open access article distributed under the terms and conditions of the Creative Commons Attribution (CC BY) license (http://creativecommons.org/licenses/by/4.0/).
Copyright: This open access article is published under a Creative Commons CC BY 4.0 license, which permit the free download, distribution, and reuse, provided that the author and preprint are cited in any reuse.


