Submitted:
20 January 2025
Posted:
21 January 2025
You are already at the latest version
Abstract
In this research, the personality traits of individuals were studied at the intersection of human resource management, psychology, and neuroscience using experimental research methodologies. The study’s foundation lies in exploring how personality traits relate to workplace interpersonal dynamics, integrating theoretical and methodological frameworks from these three fields. Recent studies in management have focused on interpersonal communication patterns. Therefore, this research aims to examine the personality traits that negatively impact organizational relationships by correlating them with the behavioral patterns of individuals across different age groups. In the management studies, the personality traits identified in the “Five Factor Model” that categorized into positive and negative groups based on their contextual influences. As for Neuroscience, it examines the triggers of positive and negative behaviors using the “Neuropsychological model of emotion (NME)”. The distinct feature of our study lies in integrating models from these fields and applying neuropsychological techniques to explore workplace relationships.The psychological anxiety levels of participants in response to the stimuli were observed through alpha and beta wave activity in the prefrontal regions of the brain’s left and right hemispheres.The reliability of the proposed model was evaluated, yielding a result of 82.6.
Keywords:
Five- Factor Model(FFM)
; Neuropsychological Model of Emotion(NME)
; Independent Component Analysis(ICA)
1. Introduction
The relationship between individuals and groups reflects the status of relationships within an organization. Therefore, the way individuals within a group unite and cooperate directly influences the organization’s objectives [1], productivity, and cultural patterns. Positive organizational relationships create an environment in which people’s attitudes and psychological states are also positive, leading to higher productivity, performance, and organizational health. This forms the foundation for smooth organizational operations and growth [2]. However, conflict in group relationships or misunderstandings among employees working in different departments negatively impact organizational performance [3]. These relationship-related issues are linked to generational behavior differences. It is essential to study the communication styles and relationship patterns of groups that make up the workforce to implement effective human resource policies, so such studies play a vital role in the development of organizational behavior and culture. As per Karl Mannheim’s “Imprint Hypothesis”, individual behaviors are influenced by their surrounding social, educational and technological experiences [4]. However, the study of personality traits is systematized and explained by theories such as Louis Goldberg’s “Personality Trait Theory”, Raymond Cattell’s “Five-Factor Model” and Carl Jung’s “Theory of Personality” [5] [6]. In “Personality Trait Theory” models have identified personality traits in a systematic way that are essential for statistical analysis in psychology and management. However these models have limitations when applied to neuropsychology due to the difference in methodologies. Psychological research uses surveys and testing methods, while neuropsychology relies on experimental measurements. The “Five-Factor Model” is a suitable framework for studying the interaction patterns between individuals and groups. Therefore, using the “Five-Factor Model” the study identified and analyzed workplace interaction styles that induce emotional responses [7]. In essence, this model was utilized to categorize negative actions in workplace interactions involving colleagues, managers, and leadership which are considered to trigger anxiety in individuals. The study explains the brain’s response to such anxiety using neuroscientific methods. In neuroscience, brain activity is often studied in connection with psychological states, depending on an individual’s psychological condition, the brain generates waves of specific frequencies. Each type of brain wave reflects unique physical and psychological characteristics, and the variations in these waves are linked to emotions and behaviors. The location of brainwave activity is defined by the 10-20 system, initially modeled by Hans Berger [8]. The 10-20 model enables the measurement of brainwave activity through electrodes placed at designated points across the brain. The method of analyzing recorded brainwave data differs from measurement methods, as they examine the interaction patterns of the right and left hemispheres of the brain. The connection between brain hemispheres and psychological states has been established through experimental studies by Burrhus F. Skinner, Patricia K. Casper, and Edward D. Hopkins. Marion Heller and Edward Nitschke further demonstrated that emotional responses differ between the left and right hemispheres of the brain [9]. These researchers found that the brain’s alpha and beta waves are inversely correlated with positive and negative emotional states, leading to the formulation of the “positive and negative emotion model” [10]. In this study, we applied Marion Heller and Edward Nitschke’s theories to explain how negative workplace interactions identified using the “Five-Factor model” contribute to individual anxiety. Negative stimuli (such as negative workplace interactions) were used in this experimental study to observe their effects on behavior and psychology. When participants view the stimulus video, according to Roger Sperry’s theory, distinct waves are activated at specific locations in the cerebral cortex. These waves reflect how individuals perceive the content of the negative stimuli and experience anxiety [11]. Since anxiety indicated a negative psychological state, we referenced theories by Burrhus F.Skinner, Patricia K.Casper, Edward D.Hopkins, Marion Heller, and Edward Nischke to interpret the relationship between brainwave patterns and the right and left hemispheres of the brain activity during emotional distress [9]. EEG (electroencephalogram) is an equipment that is used to measure brainwave activity, allowing us to study these relationships scientifically. In line with the “Imprint Hypothesis”, we compared levels of anxiety across age groups. Participants in the study were categorized into age groups Y and Z. Statistical analysis of workplace-induced anxiety patterns was conducted and compared to generational behavior patterns described in the “Imprint Hypothesis”. The findings indicate that failing to incorporate generational behavior patterns into human resource policies can lead to workforce shortages [12]. Currently, human resource policies are dominated by leadership and management from Generation Y, while the workforce primarily consists of Generation Z employees. Organizational leaders and managers must adopt flexible strategies that consider generational psychological characteristics, workplace conflicts, employee satisfaction, and retention. The study is grounded in the premise that investigating the relationships between these factors along with generational psychological characteristics using neuroscience methods is essential. The participants selected for the study were employees from a single organization, varying in age, experience, skills, and education. Personal information about the participants was recorded in compliance with relevant laws and regulations and securely stored in a closed database. Since the study involved neuropsychological data, ethical approval for the experiment was obtained from the Academic Council of the University of the Humanities.
2. Theoretical and Experimental Research Methodology
2.1. Theory of Generational Sociology
The core concept of this theory is that each generation is defined by a group of individuals tied to a specific period. These individuals are influenced by the societal ideologies, changes, and innovations they experience in their environment. Factors such as family structure, behavior, culture, and ideology play a significant role in shaping how individuals perceive and respond to societal norms. By experiencing these shared characteristics, people of a particular era are exposed to similar ideas, beliefs, and education, making them identifiable as a single generation. The “Imprint Hypothesis” explains the specific types and differences in individual personality traits. Meanwhile, Robert McCrae’s empirical studies highlight how personality traits evolve during the developmental process, as described through the Five-Factor Model [13]. The theories of Karl Mannheim and Robert McCrae intersect in their emphasis on individual personality traits, as confirmed by the findings of this study. However, considering the “Imprint Hypothesis” and the “Five-Factor Model” as fully correlated may result in overly narrow interpretations during the research process. From this, it becomes possible to explain personality changes through generational segmentation. This explanation forms the basis for hypothesizing that the negative emotional patterns of Generation Y and Generation Z are distinct from each other.
2.2. Theory of the Five Factor Model
In 1980, the Five-Factor Model was introduced by Louis Goldberg and later developed further by Robert McCrae and Paul Costa. This theory is distinguished in the field of management for not only addressing personality traits but also incorporating psychological patterns. However, the Five-Factor Model is widely utilized beyond management and is commonly applied in the field of psychology. The Five-Factor Model is based on five dimensions that describe individual personality traits:
- Openness to Experience
- Conscientiousness
- Extraversion
- Agreeableness
- Neuroticism
The model is considered well-suited for explaining personality traits and psychological patterns through empirical research methods. Consequently, this study applied the Five-Factor Model’s dimensions to examine and identify negative behaviors in the workplace. Negative behaviors are found to influence individual psychological states, serving as the foundation for the emergence of negative emotional patterns.
2.3. Theory of Positive and Negative Emotions
Changes in behavior and psychological patterns are directly linked to brain wave activity, as highlighted in neuroscience. Therefore, explaining the neurophysiological reactions occurring in the brain during emotional states is crucial. The physiological responses associated with emotions in the brain were first explained through the “James-Lange Theory”, proposed by William James and Carl Lange in the 1880s [14]. These physiological reactions are often interpreted based on the frequency of brain electrical waves. Researchers such as Hans Berger (1929), Aleksandra (2021), Yanqiang (2022), and Yossi (2019) have studied the generation of electrical waves in the brain during emotional states. Their studies empirically demonstrated that five types of brain waves are generated on the cerebral cortex when an individual’s psychological state changes. These waves—delta, theta, alpha, beta, and gamma—reflect different emotional patterns. When negative emotions arise in the brain, there is a correlation between alpha and beta waves. Specifically, when a calm individual experiences anxiety, the activity of alpha waves decreases while beta wave activity increases. Researchers Marion Heller and Edward Nitschke examined these correlations and proposed the “Neuropsychological Model of Emotion”, which explains the patterns of positive and negative emotions, including anxiety. Their research found that the brain’s electrical waves change significantly during the perception of anxiety, with the most pronounced activity occurring in the frontal lobes of the brain. This finding was confirmed through empirical studies.
2.4. The Model Proposed During the Research Process
The differences in specific behaviors across generations have been discussed in management studies. These intergenerational differences suggest the potential for the development of unique personality traits that define individuals. Studying and comparing generational traits can support human resource managers in fostering positive interpersonal dynamics within organizations. Nowadays, examining generational theories reveals how personality traits and attitudes toward society vary, as evidenced by employment patterns. Emotional responses to organizational culture, managerial tasks, and workplace relationships differ across generations. Thus, it is essential to compare generational differences and apply management science-based strategies in human resource practices. Management and psychology must investigate generational behaviors and psychological patterns in detail, which forms the goal of this research. Achieving this goal requires identifying the intersections of theories from management, psychology, and neuroscience. For this purpose, a model was developed to explore these intersections.
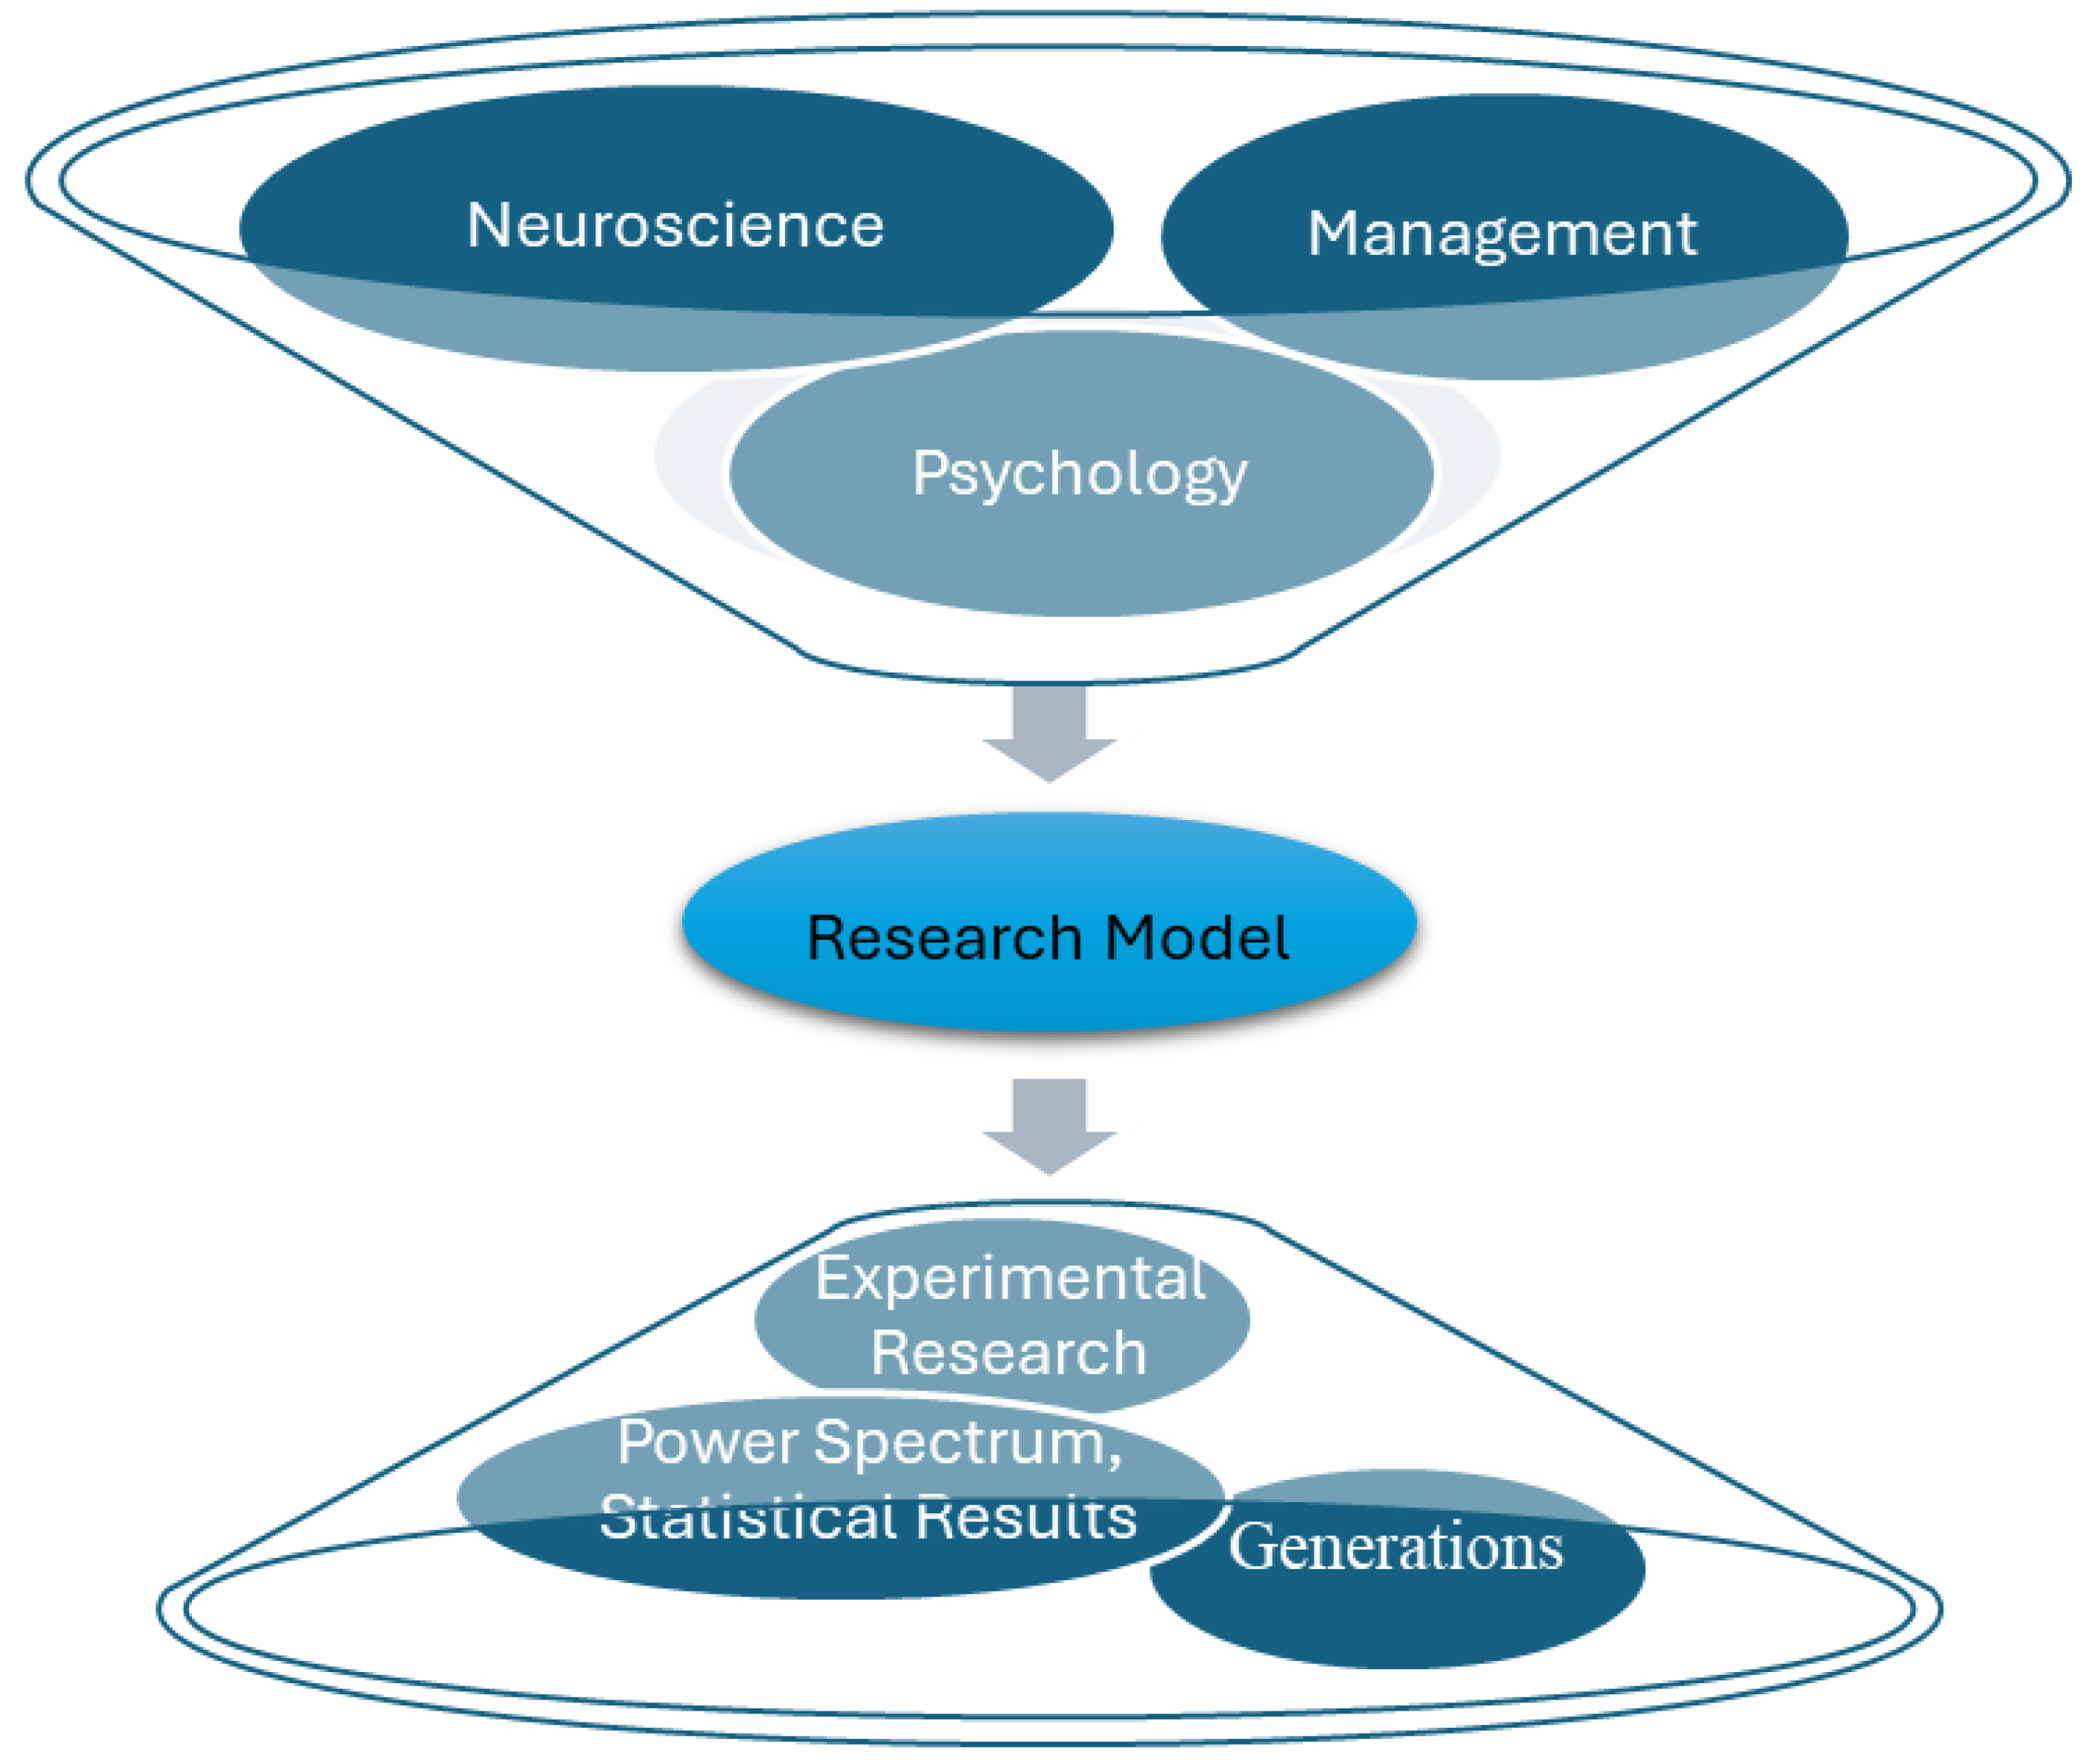
Figure 1.
Modeling of Interdisciplinary Research Work
The study of individual personality traits and patterns is a critical concern across these scientific fields. Moreover, recognizing generational personality traits is highly significant in today’s human resources field. Therefore, this research was directed toward the human resource sector, focusing on how negative emotions might be triggered by workplace interactions and conflicts, based on experimental studies. To explain interpersonal differences and behaviors theoretically, this study utilized the Imprint Hypothesis, which plays an essential role in categorizing generational differences in personality traits. Generational personality traits were linked to individual personality traits, making it necessary to explore the negative aspects of the Five-Factor Model’s dimensions. Using experimental methods, this study examined how these negative traits influence individual psychological states. The experimental model is illustrated in Figure 2. Negative descriptions from the five dimensions of the Five-Factor Model were used to identify workplace conflicts and negative interactions, which served as stimuli for the participants. The negative emotional responses of participants were analyzed in detail using neuropsychological methods, identifying patterns of anxiety. When participants experienced a psychological shift after viewing the stimuli, specific brain waves were generated on the cerebral cortex at particular frequencies. These electrical waves allowed researchers to determine negative emotional patterns based on activity around the frontal regions of the right and left brain hemispheres. Neuroscience defines emotional patterns through the Neuropsychological Model of Emotion, which explains psychological states during anxiety based on brain waves.
The correlation between alpha and beta waves in the frontal regions of the right and left hemispheres explains states of psychological anxiety. When participants experienced anxiety from the stimuli, alpha wave activity decreased on the right side, while beta wave activity increased on the left. These wave changes are explained by linking them to shifts in wave amplitudes.
3. Experimental Results
When an individual psychologically perceives a given situation, neurophysiological waves are generated in the brain, which are linked to patterns of positive and negative emotions. To explore changes in psychological patterns, we selected negative actions from the dimensions outlined in the Five-Factor Model. Consequently, when participants viewed the stimuli, the interaction of neural cells in their brains resulted in the generation of alpha and beta waves in the frontal region. The correlation between alpha and beta waves is most prominently observed during states of anxiety. Negative emotional patterns, specifically anxiety, are most strongly generated in the frontal lobe region of the brain. Electrodes were positioned on the frontal region of the brain based on this finding. This placement aligns with the increased wave activity in the frontal lobe during anxious states. The electrode placement was guided by Herbert Jasper’s model. By completing these steps systematically, the conditions for conducting experimental measurements were established. Brain physiological data were transferred from TeleScan to MATLAB for processing [15]. The electrodes placed on the brain were classified by the right and left hemispheres. Electrodes on the left hemisphere were FP1 and F3; midline electrodes were FPz and Fz; and electrodes on the right hemisphere were FP2 and F4. Specifically, during brain responses, electrical impulses generated by neural interactions were discussed in the theoretical section. When the brain responds, the interaction of numerous neurons generates electrical impulses that propagate as energy, creating potential differences around the cerebral cortex. These potential differences exhibit positive and negative values and are measured in microvolts. This principle is referred to as the Dipole Theory. Based on this theory, a mapping of how electrical waves propagate and evolve in the participant’s brain while viewing the stimulus was developed [16]. Dipole positioning was determined according to Herbert Jasper’s 10/20 EEG electrode placement system. In the experiment, dipoles were used to model the recorded wave concentrations and brain mapping in two and three dimensions. Wave propagation values were visualized by categorizing voltage: red indicated positive voltage, while blue indicated negative voltage. This classification could be observed following the Independent Component Analysis (ICA).
3.1. Results of the Experimental Spectrum Analysis
To record brain wave activity, the frontal lobe of the brain was selected, and neurophysiological data were measured using the EEG international xx/xx electrode placement standard. Specific electrode placements chosen included FP1, FP2, FPz, F1, F2, Fz, and Oz. Additionally, GND and Ref electrodes were placed behind the ears. The activation of brain electrical waves was interpreted using the Neuropsychological Model of Emotion, which focuses on positive and negative emotions. This model was discussed in the theoretical section. The electrodes placed on the brain were categorized into right and left hemispheres. Electrodes for the left hemisphere included FP1 and F3, midline electrodes included FPz and Fz, and electrodes for the right hemisphere included FP2 and F4 [17]. During the video stimulus, the alpha and beta wave activations in the brain of one participant were processed using machine learning methods. The results are shown in the figure below. Specifically, it was noted that the electrical impulses generated during brain responses differ based on neural interactions. The impulses exhibit polarity, being either positive or negative. Electrical impulses around the brain’s dipole region [18] were classified based on voltage: red indicates positive voltage, while blue indicates negative voltage. These classifications were visualized using the results of the Independent Component Analysis (ICA) processing.
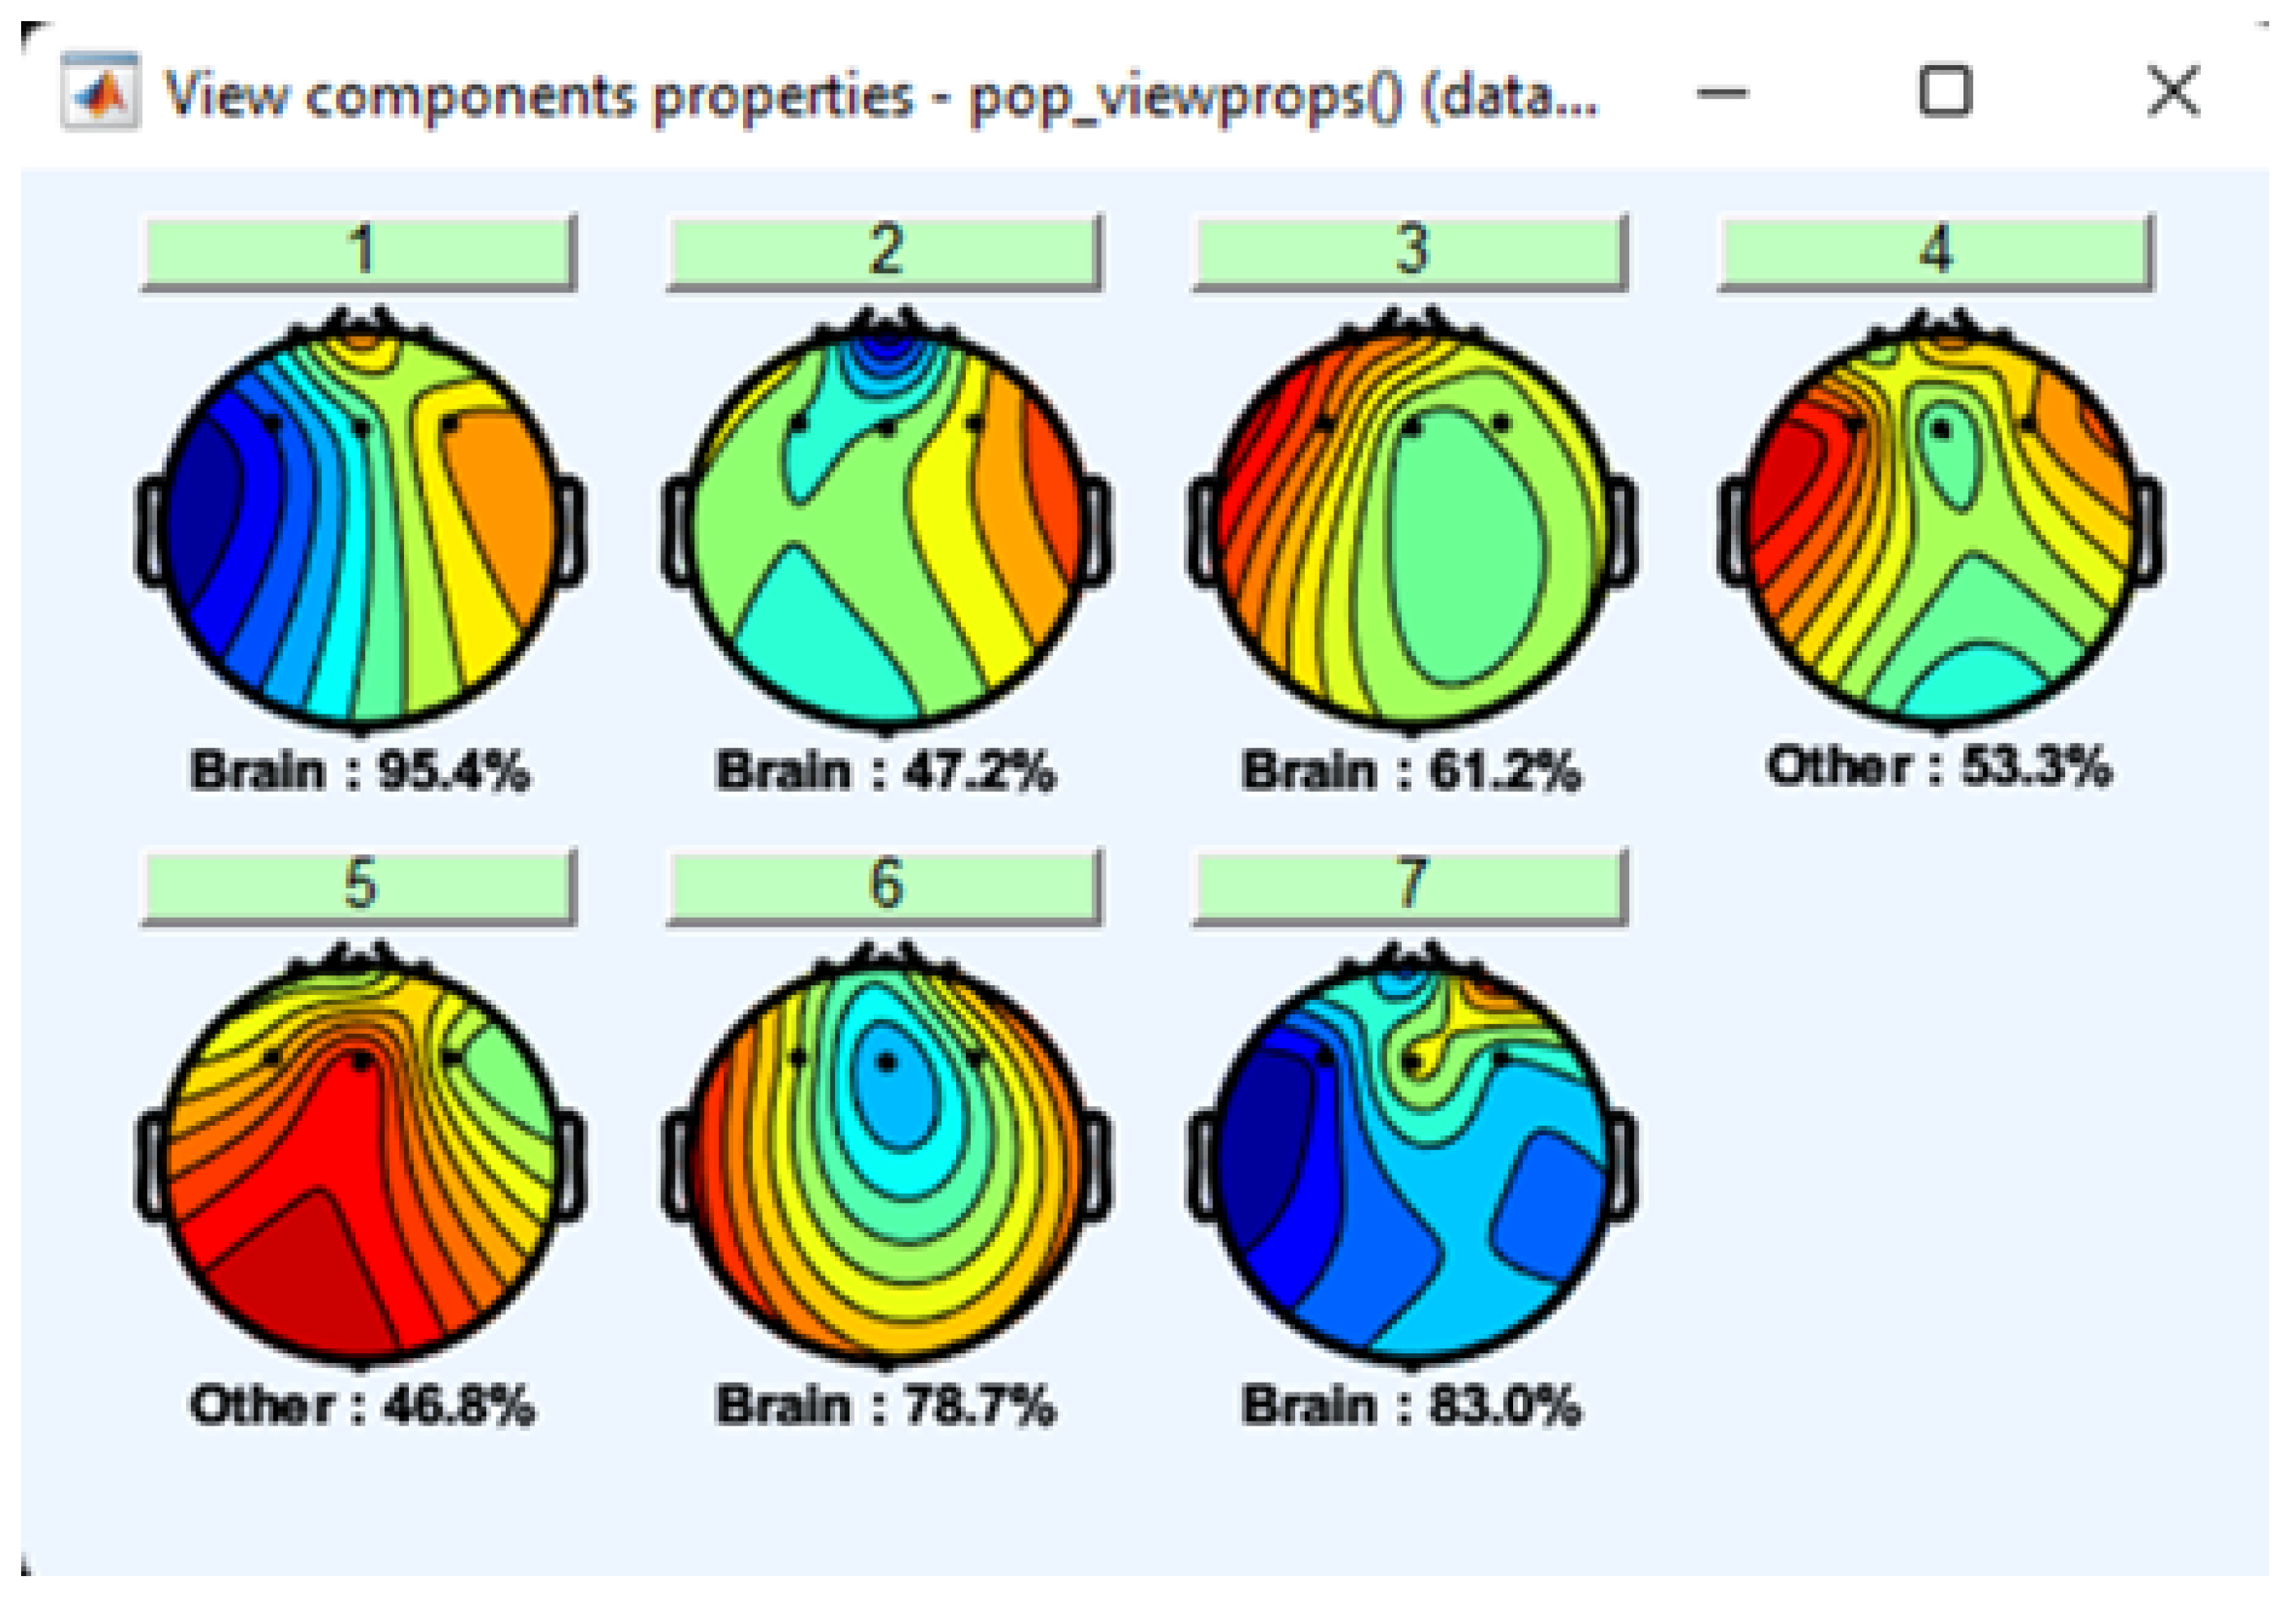
Figure 3.
Topographic Values of Brain Waves on Seven Electrodes Obtained from the 168-Step Training Outcome
Figure 3.
Topographic Values of Brain Waves on Seven Electrodes Obtained from the 168-Step Training Outcome
3.2. Application of Machine Learning in Brain Wave Processing and Its Results
While applying the PCA (Principal Component Analysis) algorithm was considered optimal, it was not used in data processing. This decision was based on the nature of brain waves, which are a composite of various waveforms or bundled data. In other words, brain waves are intertwined with signals such as muscle movement, eye movement, heartbeat, and brain activity. Using PCA risks eliminating certain critical types of waves, making them unsuitable for the experiment. To separate the recorded brain waves from the EEG device into distinct components, we employed the Independent Component Analysis (ICA) method. For data processing in the experiment, the machine learning steps were set to a maximum of 512 steps, while the learning rate was established between 0.001 < S-rate > 0.00001. A slow learning rate increases the time required for data processing, which is critical given the vast amount of data collected for brain waves—recorded every millisecond. Thus, selecting the correct learning rate is essential for efficient processing. Brain waves are unified bundles of various waveforms. Therefore, it is crucial to classify and process the distinct components for meaningful analysis. Biological variables such as wave power and wavelength were input into the machine learning process to calculate statistical measures like variance, kurtosis, and skewness. These statistical values were then used to compare and analyze brain wave distribution and emotional states, providing insights into the relationship between brain activity and emotions.
3.3. Neuronal Activity in the Brain During Emotional States and ICA
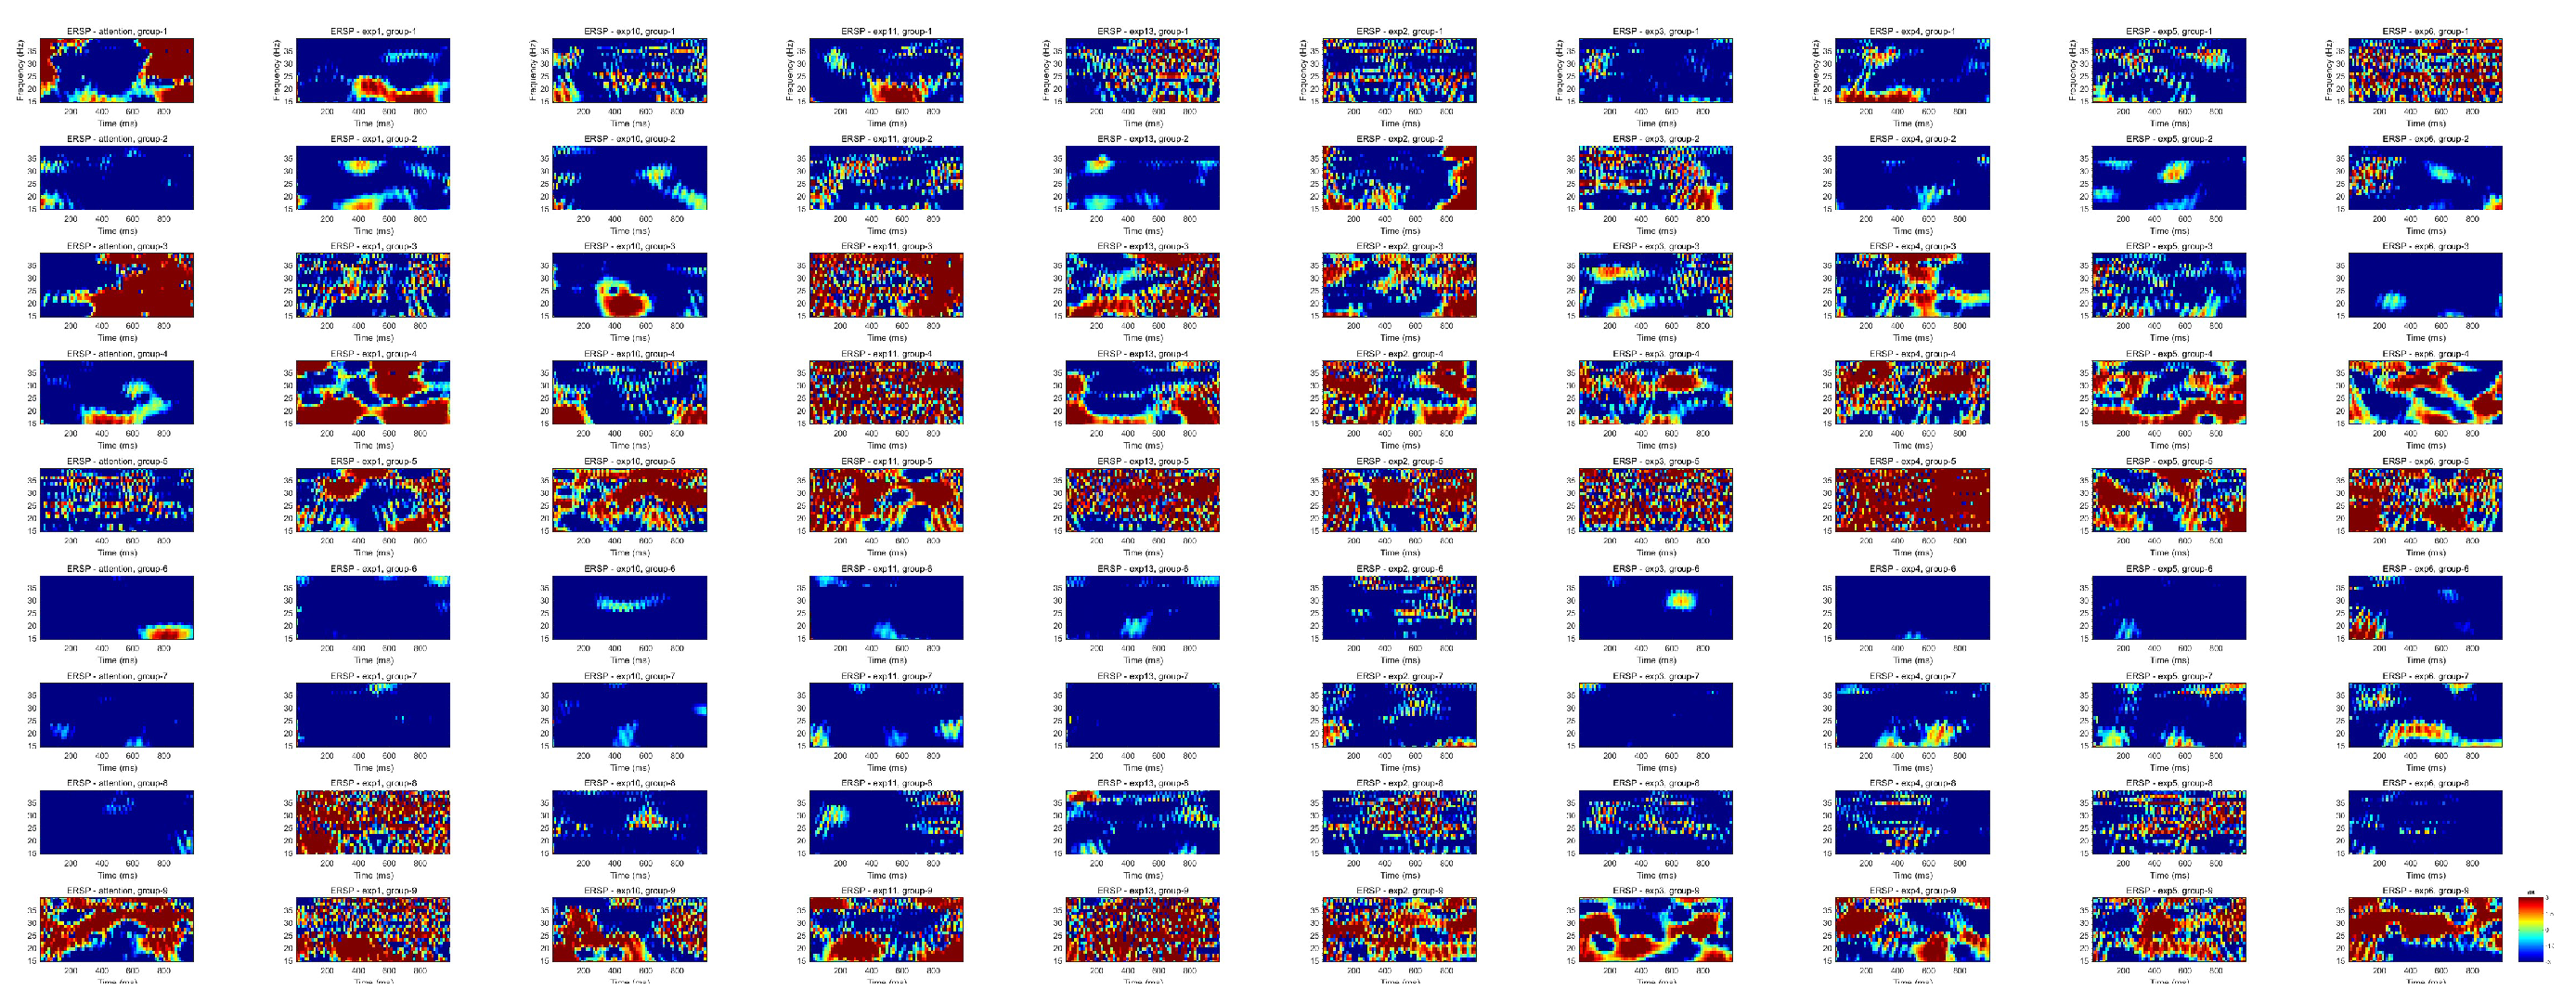
The study examined how participants experienced anxiety during stimulus video by correlating changes in energy generated by neural activity. This process represented the propagation of brain waves during anxiety as energy shifts during neuronal charge transitions, visualized using the Dipole method [17]. See Figure 4. Regions with high-amplitude bipolar waves were visualized in deep red and blue while decreasing wave intensity transitioned through red, green, yellow, and blue hues. Participants were divided into two groups, with 18 participants in total. Group 1 participants were born between 1980 and 1995, while Group 2 participants were born between 1996 and 2003. Each participant viewed a video with an average duration of 3 minutes. The video content was based on workplace scenarios involving interactions among colleagues. Each specific scenario within the video was marked as an event, with starting and ending timestamps, making it easier to distinguish between events. A total of 16 events were analyzed in this experiment. The anxiety experienced by participants during the scenarios is illustrated in Figure 4.
In Figure 4, events with relatively higher anxiety levels were selected based on spectral analysis results. It is important to note that participant responses to the video were inconsistent, likely due to generational differences in susceptibility to anxiety. According to the Imprint Hypothesis, the video content represented characteristics specific to each generational cohort [19]. Wave changes near the brain’s dipole region were color-coded [19], with red representing high-intensity waves and blue representing low-intensity waves. During the analysis, waves related to eye movements and muscle activity were excluded as much as possible. However, some residual waveforms could not be eliminated. For participants in Group 1, brain waves during anxiety were visualized using spectral analysis, as shown in Figure 5. While all events in the video were viewed, participants from Generation Y showed relatively lower anxiety levels. This could be attributed to a characteristic feature of this generation. Slight anxiety was observed during scenarios depicting the risk of being fired or becoming unemployed [21].
When brain wave frequency ranges were refined to 8 Hz to 13 Hz, the results indicated a relatively calm state, suggesting participants were processing the situation without heightened anxiety.
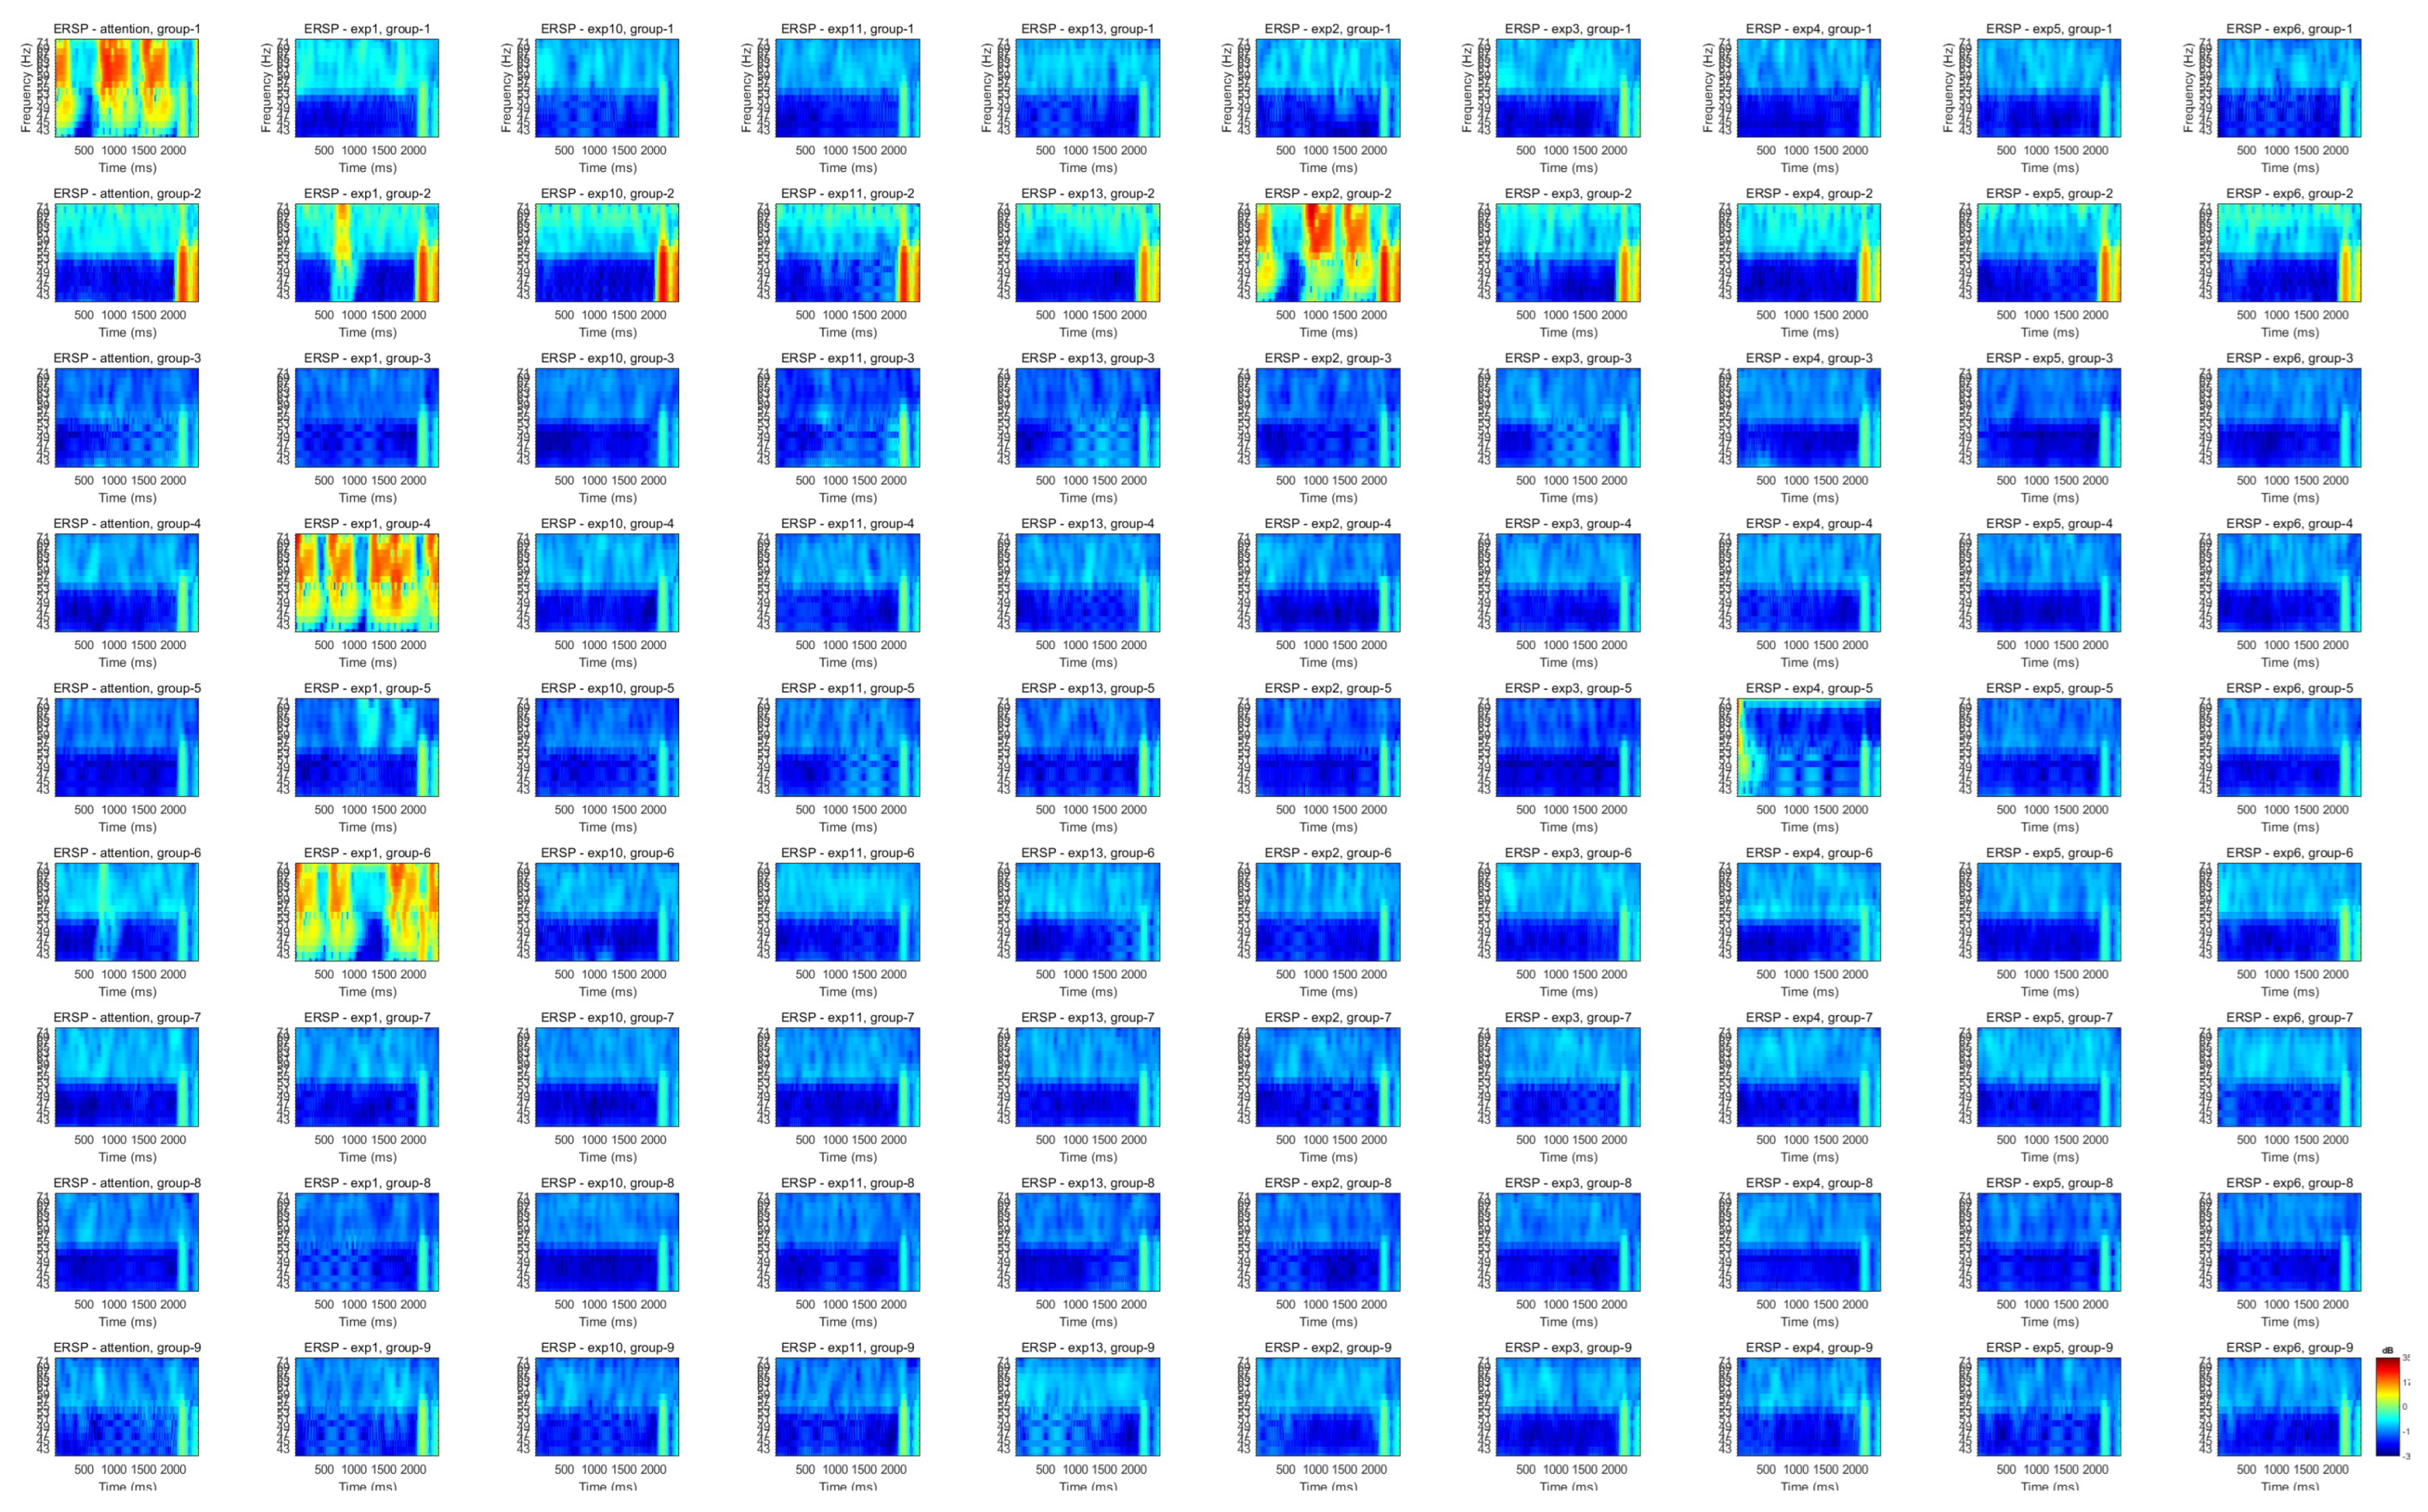
Figure 6.
When Adjusting the Brain Wave Filter Values to 8 Hz to 13 Hz
The results of Group 2 participants’ brain waves are shown in Figure 7. The experimental conditions for Group 2 were identical to those for Group 1. Compared to Group 1, participants in Group 2 demonstrated similar levels of perceived anxiety. Spectral analysis of ICA-calculated data is visualized in Figure 8.
As seen in Figure 8, Generation Z participants (Group 2) showed more active anxiety responses compared to Generation Y participants. The conditions triggering anxiety were tied to Event 2, which depicted a scenario where a manager entered the workplace, scolded an employee for failing to complete a task, and ignored the employee’s explanations.
Differences in anxiety responses to this event across the two groups are illustrated in Figure 9. In subsequent events, both groups exhibited relatively consistent responses, as confirmed by group-level experiments. The Topplot visualizations compared participants’ anxiety levels during specific events.
3.4. Results of Statistical Analysis
To evaluate the reliability of the experimental measurements, the Cronbach alpha was calculated for 14 dependent variables (DV). According to international standards, a Cronbach alpha greater than 0.70 is considered sufficient, and a value higher than 0.00 indicates high reliability. In this study, Cronbach’s alpha was greater than 0.00 (alpha = 0.00), demonstrating that the measurements were highly reliable. Furthermore, the alpha value did not change significantly when any variable was removed from the analysis, indicating that these 14 variables are consistent and do not distort the results (Table 1). A descriptive statistical analysis of the results showed that the control and experimental groups included 66 participants, with a mean age of 26.48 (SD = 6.15), ranging from 20 to 44 years. Of the 80 participants, 14 individuals who did not experience anxiety during the experiment were excluded from the analysis. Consequently, the study focused on the remaining XX participants, with XX in the control group reporting no anxiety (n = 33) and 66 reporting anxiety after the experiment (n = 33). The levels of anxiety in these participants were assessed using the Hospital Anxiety and Depression Scale (HADS) based on self-reported questionnaires. When divided by age groups, there were XX participants (54.5) in the Generation X and Y group under the age of 28 and 30 participants (45.5) in the Generation Y group over the age of 30. The results of the age-based analysis are presented in Table 1. Regarding gender, 48.5 of the participants were male (n = 32) and 51.5 were female (n = 34), indicating that gender balance was successfully maintained in the study. The sample included participants from seven different professions chosen randomly.

Table 1.
Results of Reliability Analysis for the Experimental Model.
| № | Reliability | |
|---|---|---|
| 1 | Cronbach’s Alpha | 0.826 |
| 2 | Variables | 14 |
1 Tables may have a footer.
The reliability analysis of this experiment was compared to the findings of international studies, as shown in the table below.
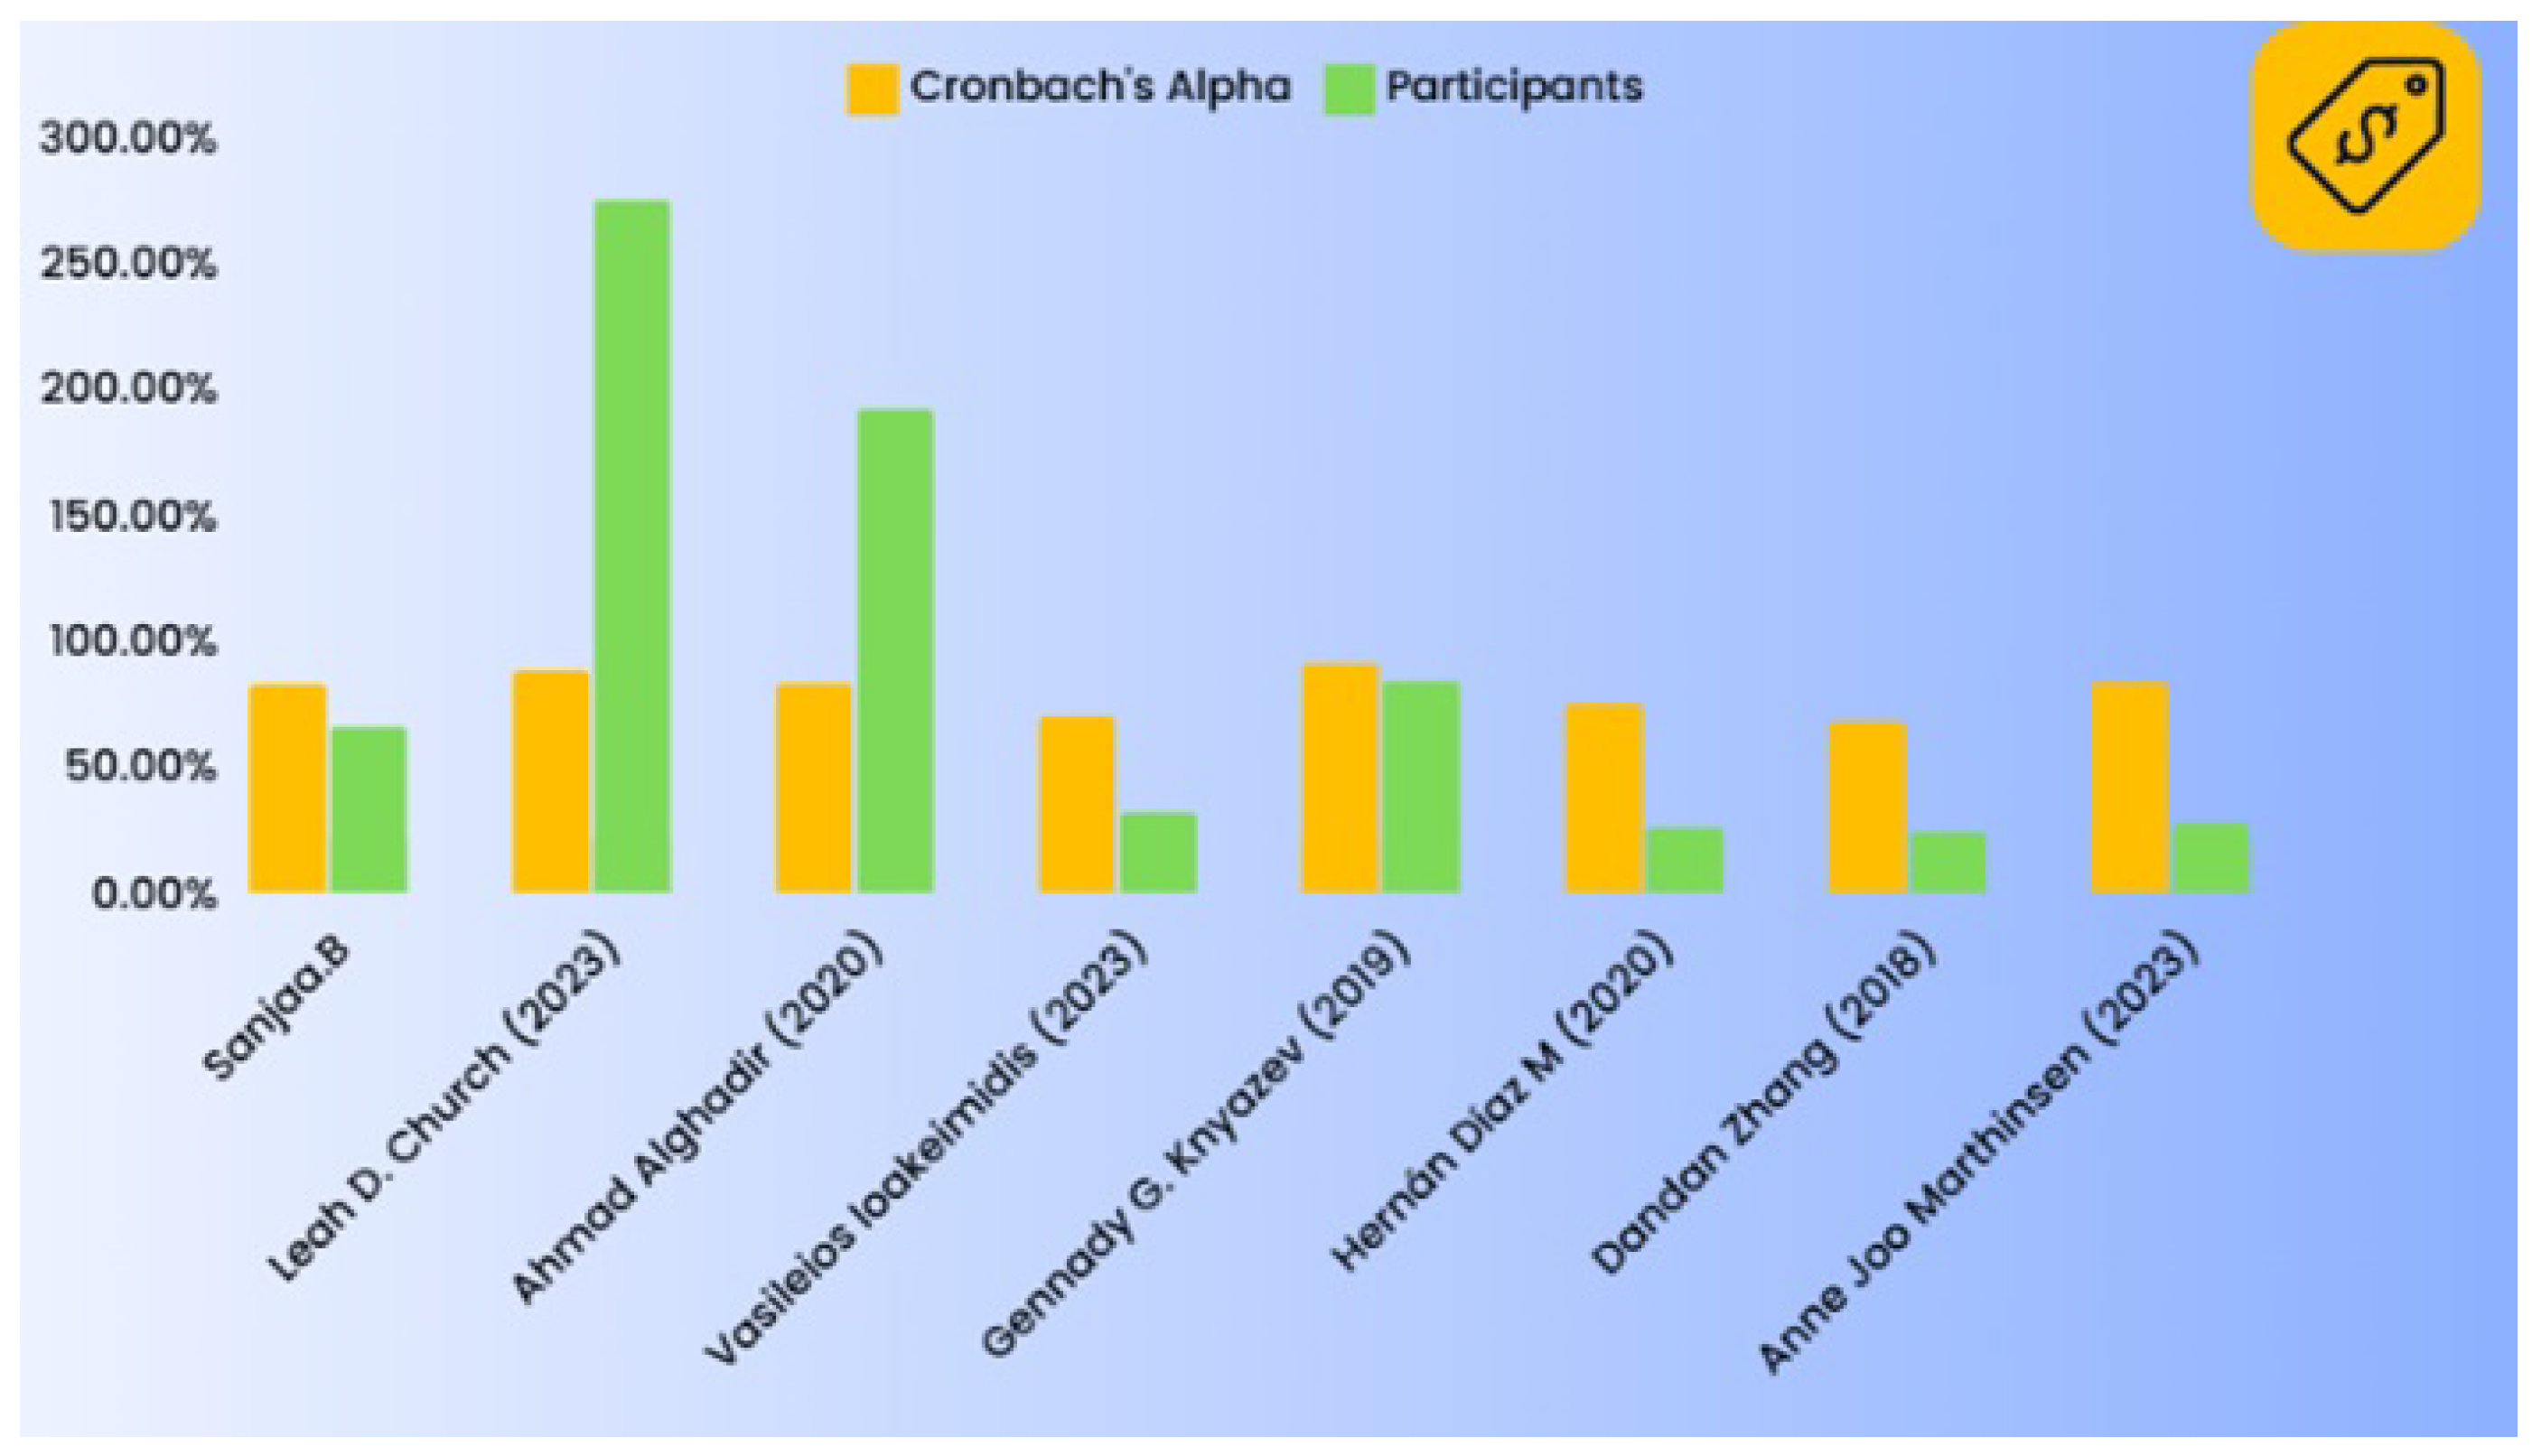
Figure 10.
Enter Caption
From the reliability analysis ratios presented in the table, it can be concluded that this experimental model represents an average level of reliability. However, differences in the study results may be attributed to variations in cultural, socio-economic, and educational factors specific to each country or population. This experiment incorporated characteristics unique to the Mongolian population.
3.5. Results of Correlation Analysis
Pearson’s correlation statistical analysis revealed that the power of alpha and beta brain waves was significantly associated with participants’ age. These correlations were moderate in strength and varied based on the measured locations of the brain waves. Specifically, alpha waves showed statistically significant negative correlations with age at the following frontal locations: FP1 (R = -0.31*, p < 0.05), FPz (R = -0.42*, p < 0.001), FP2 (R = -0.33*, p < 0.01), and F4 (R = -0.44*, p < 0.001). Similarly, beta waves demonstrated statistically significant negative correlations with age at the frontal locations FP1 (R = -0.28*, p < 0.05), FPz R = -0.37*, p < 0.01), FP2 (R = -0.36*, p < 0.01), and F4 (R = -0.41*, p < 0.001). In contrast, no statistically significant correlations were observed for either wave type at F3, Fz, or Oz locations. This indicates that age-related correlations for alpha and beta waves were evident only in the anterior/inferior regions of the frontal brain on both the left and right sides (FP1, FPz, FP2) and in the posterior/superior region of the frontal brain on the right side (F4). However, no age-related changes were detected for alpha or beta waves in the posterior/superior region of the frontal brain on the left side (F3).
Furthermore, the amplitude strength of the waves was significantly correlated across the measurement locations. For both alpha and beta waves, statistically significant correlations were observed between the following locations: FP1 and FPz, FP1 and F4, FPz and FP2, FPz and F3, FPz and F4, F2 and F3, F2 and Fz, F2 and F4, F2 and Oz, F3 and Fz, F3 and F4, and Fz and F4. Interestingly, there was a high correlation between alpha and beta waves across all measured locations, suggesting that alpha and beta waves tend to co-activate strongly.
3.6. Effects of Anxiety, Age Group, and Gender
The T-test analysis demonstrates how alpha and beta brain waves activate based on anxiety levels, age cohorts, and gender. When comparing the control and experimental groups using a two-tailed T-test, statistically significant higher activation of alpha waves was observed in the experimental group experiencing anxiety at FPz, FP2, F3, and Fz locations, while beta waves showed significant activation only at F3. Specifically, the power of alpha waves showed medium differences at the following locations: FPz: t(64) = -2.23, p < 0.05, Cohen’s d = -0.55 FP2: t(64) = -2.82, p < 0.01, Cohen’s d = -0.69 F3: t(64) = -2.81, p < 0.01, Cohen’s d = -0.69 Fz: t(64) = -2.31, p < 0.05, Cohen’s d = -0.57 For beta waves, the power at F3 showed a strong difference: F3: t(64) = -3.41, p < 0.001, Cohen’s d = -0.84. These findings suggest that when processing anxiety-related workplace information, the brain emits medium-intensity diffuse alpha waves and strongly localized beta waves on the left side. This supports the Neuropsychological Model of Emotion, demonstrating that alpha and beta waves play distinct roles in responding to anxiety. Alpha waves appear to reflect diffuse, widespread processing, while beta waves are more localized and intense.
3.7. Analysis of the Right and Left Hemispheres of the Brain
Alpha and beta waves originating from the anterior/inferior frontal regions are closely associated with the activity of the brain’s prefrontal cortex, the center for higher cognitive functions. These waves are also significantly linked to how emotions, such as anxiety, are perceived and processed in the right or left hemispheres of the brain [15]. From the study, alpha waves generally appeared symmetrically across the right and left hemispheres under most stimuli. However, during strong anxiety-inducing stimuli, alpha waves were more dominant in the right hemisphere. In contrast, beta waves predominantly appeared in the left hemisphere under most stimuli but shifted dominance to the right hemisphere during highly anxiety-inducing situations. Notably, the power of beta waves was generally higher than alpha waves across most locations (Appendix №1: Graph 3. Differences in Waves Between the Right and Left Hemispheres). 8. Generation Sensitivity to Anxiety When comparing Generation Y (28 years and older) and Generation Z (27 years and younger) participants, alpha waves for Generation Z were significantly stronger than those of Generation Y at the FP1, FPz, FP2, Fz, and F4 locations. However, there were no significant differences at the F3 and Oz locations, where the wave activity was similar. For beta waves, Generation Z also demonstrated significantly stronger wave activity than Generation Y at FP1, FPz, FP2, and F4. However, no significant differences were observed at Fz, F3, and Oz locations. These differences were mostly strong in effect size, as indicated by Cohen’s d (Table 1). These findings suggest that both alpha and beta waves tend to exhibit stronger activity across most brain regions in younger Generation Z participants compared to the older Generation Y participants. This implies that younger individuals from Generation Z expend significantly more energy in the brain’s prefrontal cortex when processing workplace anxiety-related information (Appendix №2: Y and Z Age Cohorts and T-Test Results Table).
4. Proposed Model and Recommendations
Within the scope of this study, the proposed research model identifies how generational psychology evolves in response to workplace actions and conflicts using neuropsychological methods. Thus, we developed a model that enables the study of workplace conflicts and negative behaviors in relation to generational personality traits. The findings indicate that studying generational traits and emotional patterns through neuropsychological methods is effective. Compared to traditional survey and test-based approaches, using brain measurement techniques proves to be more impactful in understanding such dynamics. Additionally, the results demonstrate the feasibility of applying neuropsychological methods to study individual personality traits in the field of human resource management.
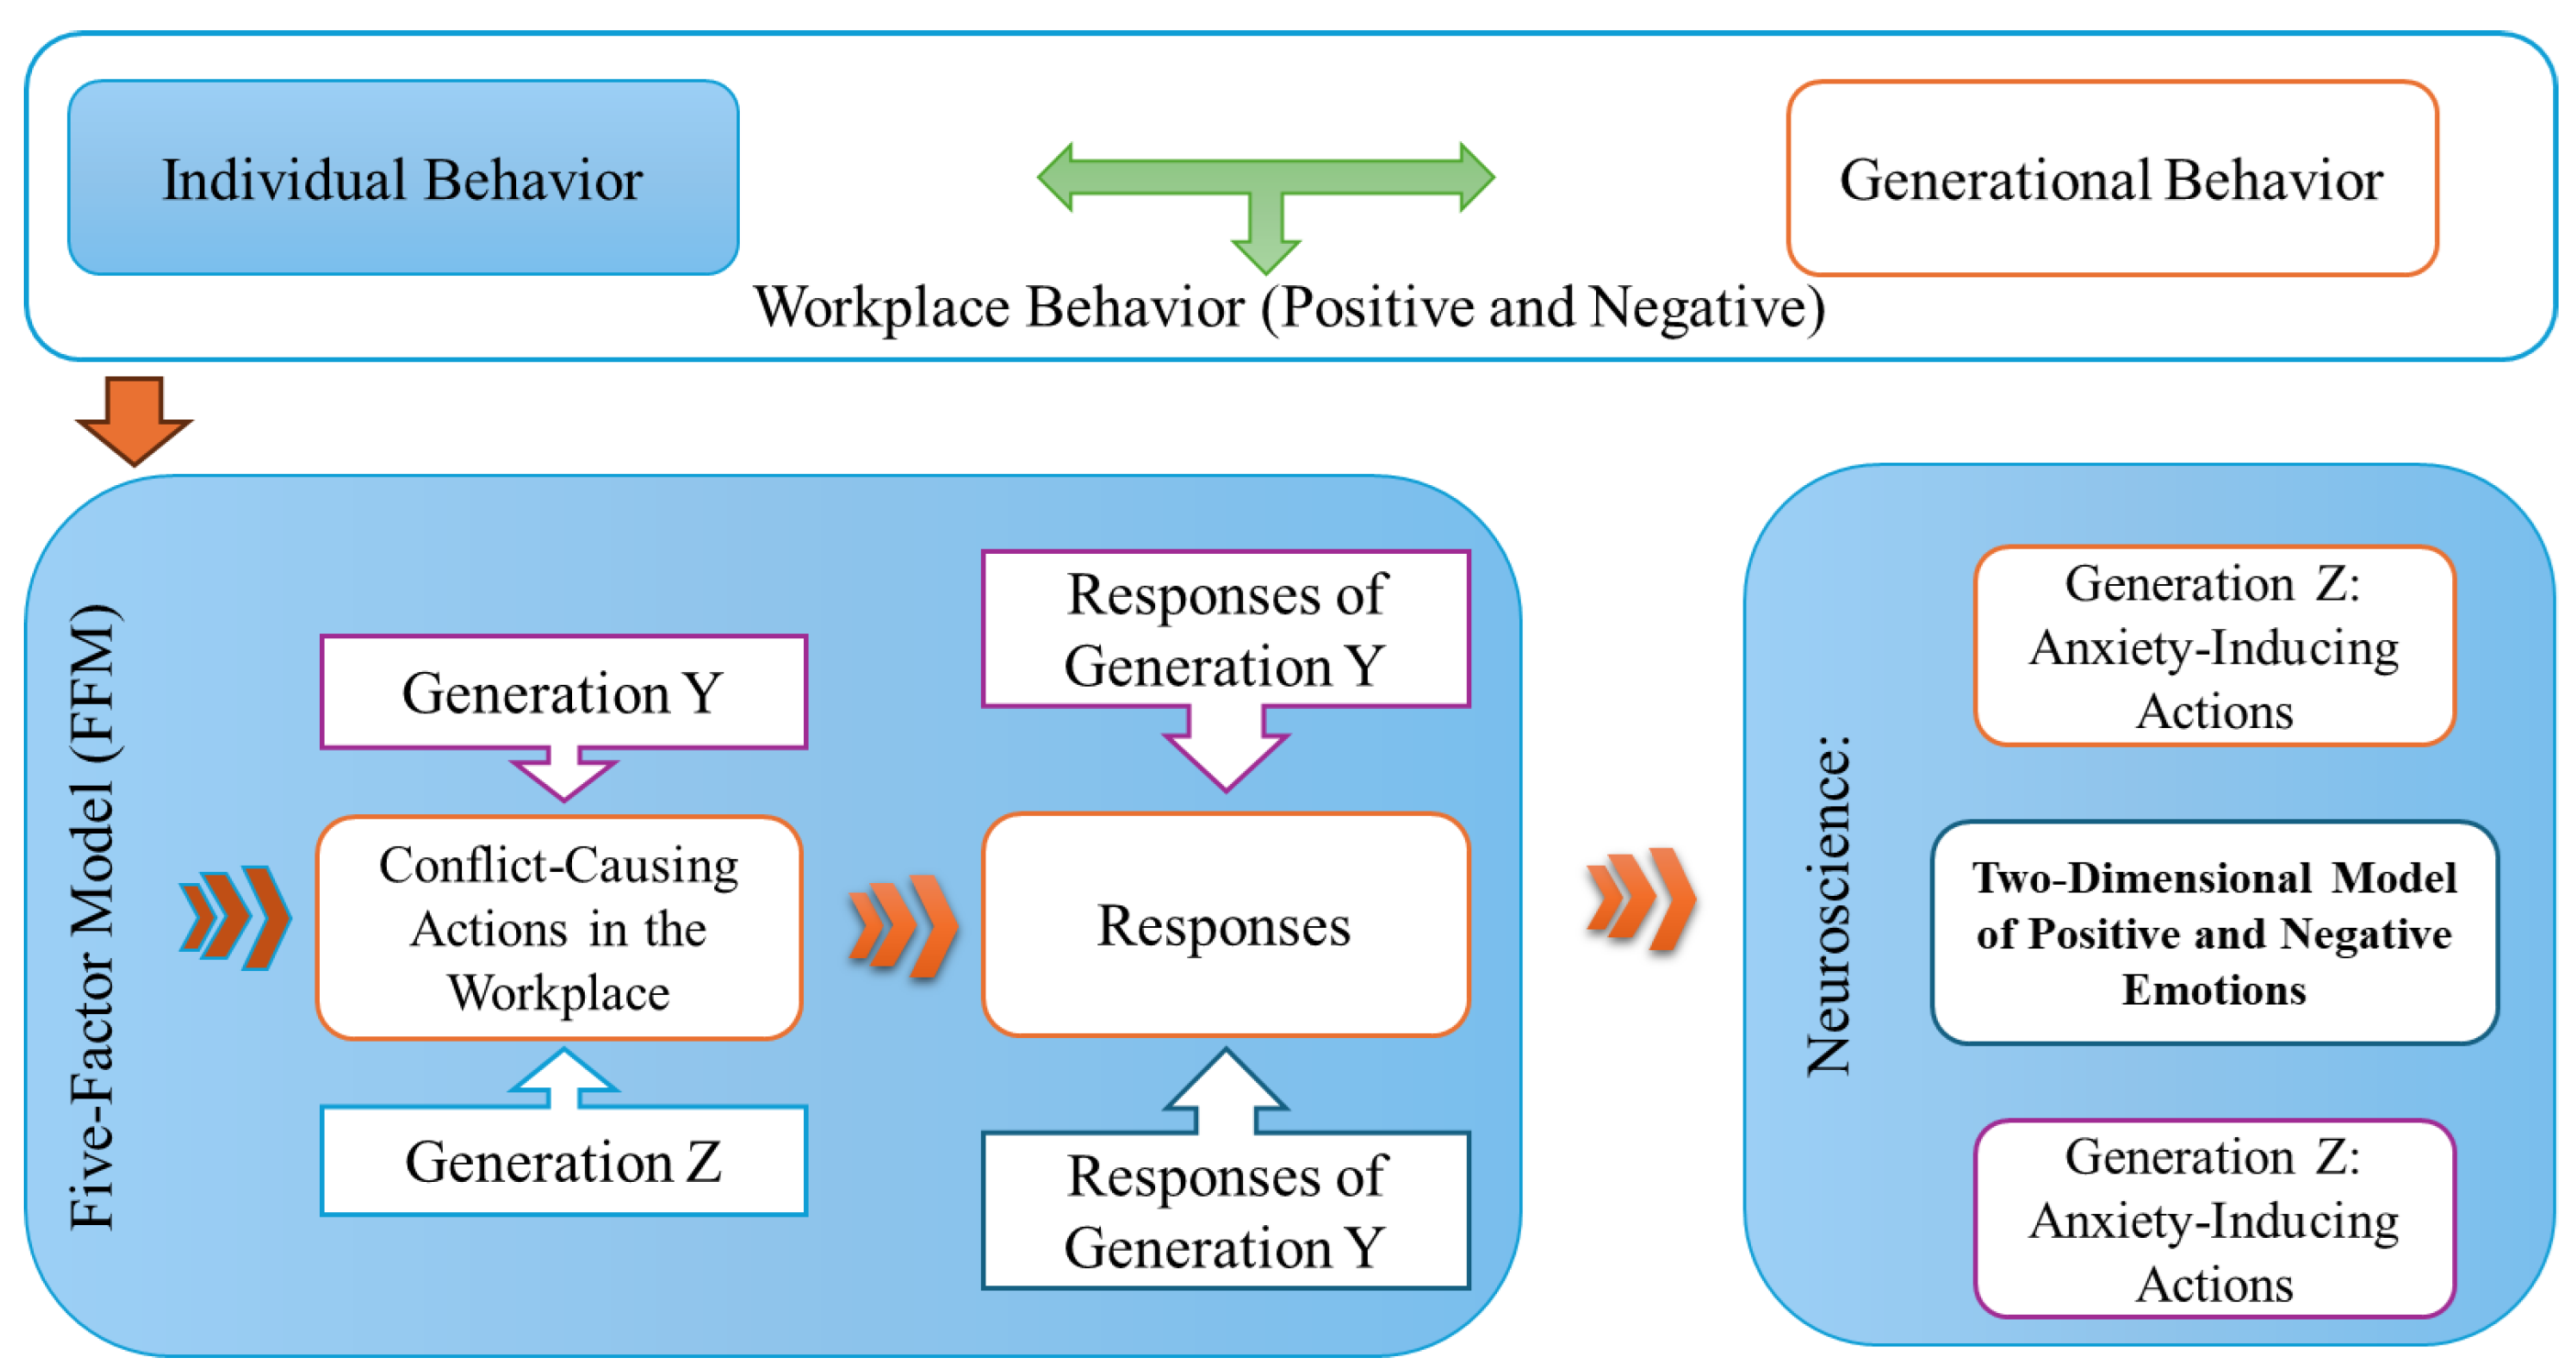
Figure 11.
Model for Studying Generation Behavior and Workplace Conflicts
As a multidisciplinary foundational study spanning management, psychology, and neuroscience, this research can be a valuable resource for scholars in these fields. Moreover, since the study works with real emotional data, it provides a basis for further research on numerous related topics.
5. Conclusion
The primary objective of this study was to examine the patterns of anxiety individuals experience in workplace relationships. By analyzing anxiety patterns in relation to age, the findings suggest that these patterns can effectively represent generational personality traits. Consequently, a total of 66 participants, aged xx-xx, were included in the study to explore these anxiety patterns. To explain susceptibility to anxiety, the study explored a model that integrates management, psychology, and neuroscience to investigate individual personality traits. This model is based on the Five-Factor Model, which explains external factors affecting employees’ satisfaction, attitudes, and relationships in the workplace. The Five-Factor Model is commonly used in human resource management to assess psychological states, workplace compatibility, and personality traits of employees during recruitment. Furthermore, it is well-suited for studying personality traits through experimental methods. In psychology, the Big Five Model is widely used to define individual personality traits. The comparison of measures between these two models indicated significant similarities, making them complementary for studying personality traits. The results of this comparison are presented in Table 5. The Five-Factor Model can be further refined by linking it with psychological patterns, and in neuroscience, it can be connected to the Neuropsychological Model of Emotion (Positive and Negative Emotion Model). Changes in individual personality traits are directly linked to the activity of neurotransmitters. As a result, specific frequencies of brainwaves are generated during changes in emotions and behaviors. The Five-Factor Model helps identify the causal actions leading to emotional states, while the resulting emotional patterns can be explained using the Neuropsychological Model of Emotion. The study’s general conclusions and findings contribute to the integration of these models for understanding personality traits, emotions, and their neuropsychological underpinnings.
References
- Batkhurel.G, Managements; MUST,Ulaaabaatar, Mongolia, 2019; pp. 68–69.
- Sugarsuren, G. A Study on the Factors Affecting Job Satisfaction and Employee Engagement of Generation X and Millennial Workers. 2021, 10, 55–58. [Google Scholar]
- Tseren.G, Organizational Behavior,; MNU ,Ulaaabaatar, Mongolia, 2021; pp. 55–60.
- Mannheim. K, The Problem of Generations. ; 1952; pp. 276–322.
- Goldberg, R.L. Language and individual differences: The search for universals in personality lexicons. Review of personality and social psychology 1981, 81–90. [Google Scholar]
- Raymond. B.C, Description and measurement of personality, New York, USA, 1946.
- McCrae, R.R. Validation of lhe five-factor model of personality across. Jounal of Personaality and Social Psychology 1987, 52, 81–90. [Google Scholar] [CrossRef]
- Berger. H, On the human electroencephalogram, 1929.
- Heller, B.N. Comorbidity, The Puzzle of Regional Brain Activity in Depression and Anxiety: The Importance of Subtypes. Cognition And Emotion 1998, 12, 421–447. [Google Scholar]
- Guozhen, Y.G. Frontal EEG Asymmetry and Middle Line Power Difference in Discrete Emotions. Frontiers in Behavioral Neuroscience 2018, 12, 1–14. [Google Scholar]
- Yanqiang. T,Xiangping Liu, Wenxin Hou, Haiqun Niu,Shujian Wang, Zijuan Ma, Dan Bi,Liang Zhang. The Mediating Role of Emotion Regulation Strategies in the Relationship Between Big Five Personality Traits and Anxiety and Depression Among Chinese Firefighters. Frontiers in Public Health 2022, 10. [Google Scholar]
- Guozhen. Y. G. Solutions for Generational Conflict in the Workplace. Social Psychology 2013, 1–15. [Google Scholar]
- McCrae. R. R. An Introduction to the Five-Factor Model and Its Applications. Handbook of personality: Theory and research 1999, 2, 139–153. [Google Scholar]
- Cannon. B. C. The James-Lange Theory of Emotions: A Critical Examination and an Alternative Theory. The American Journal of Psychology 1987, 100, 567–586. [Google Scholar] [CrossRef]
- Abdulhakim Al-Ezzi, Nidal Kamel Selman, Ibrahima Faye, Esther Gunaseli. Electrocortical brain oscillations and social anxiety disorder: a pilot study of frontal alpha asymmetry and delta-beta correlation. The 2nd Joint International Conference on Emerging Computing Technology and Sports (JICETS) 2020, 1529, 1–11. [Google Scholar]
- Niedermeyer, E. Dipole Theory and Electroencephalography. Clinical EEG and Neuroscience 1996, 27, 121–31. [Google Scholar] [CrossRef] [PubMed]
- Abeer Al-Nafjan, Areej Al-Wabil, Manar Hosny, Yousef Al-Ohali. Classification of human emotions from electroencephalogram (EEG) signal using deep neural network. International Journal of Advanced Computer Science and Applications(IJACSA) 2017, 8, 419–425. [Google Scholar]
- Pereda. E, Quiroga. R.Q, Bhattacharya. J. Nonlinear multivariate analysis of neurophysiological signals. Progress in Neurobiology 2005, 77, 1–37. [Google Scholar] [CrossRef] [PubMed]
- Sperry. R. W, Left-brain, right-brain, 1975, pp 30–33.
- Kandel E.R, Schwartz J.H. Ch. 4: The cytology of neurons. Principles of Neural Scienc 2000, 5, 1–7. [Google Scholar]
- Seung-Hyeon Oh, Yu-Ri Lee, Hyoung-Nam Kim. A Novel EEG Feature Extraction Method Using Hjorth Parameter. International Journal of Electronics and Electrical Engineering 2014, 2, 106–110. [Google Scholar]
- Seung-Hyeon Oh, Yu-Ri Lee, Hyoung-Nam Kim. Understanding and managing generational differences in the workplace, Worldwide Hospitality and Tourism Themes. Worldwide Hospitality and Tourism Themes, 2011; 3, 308–318. [Google Scholar]
Figure 2.
Experimental Model for Detecting Workplace Anxiety
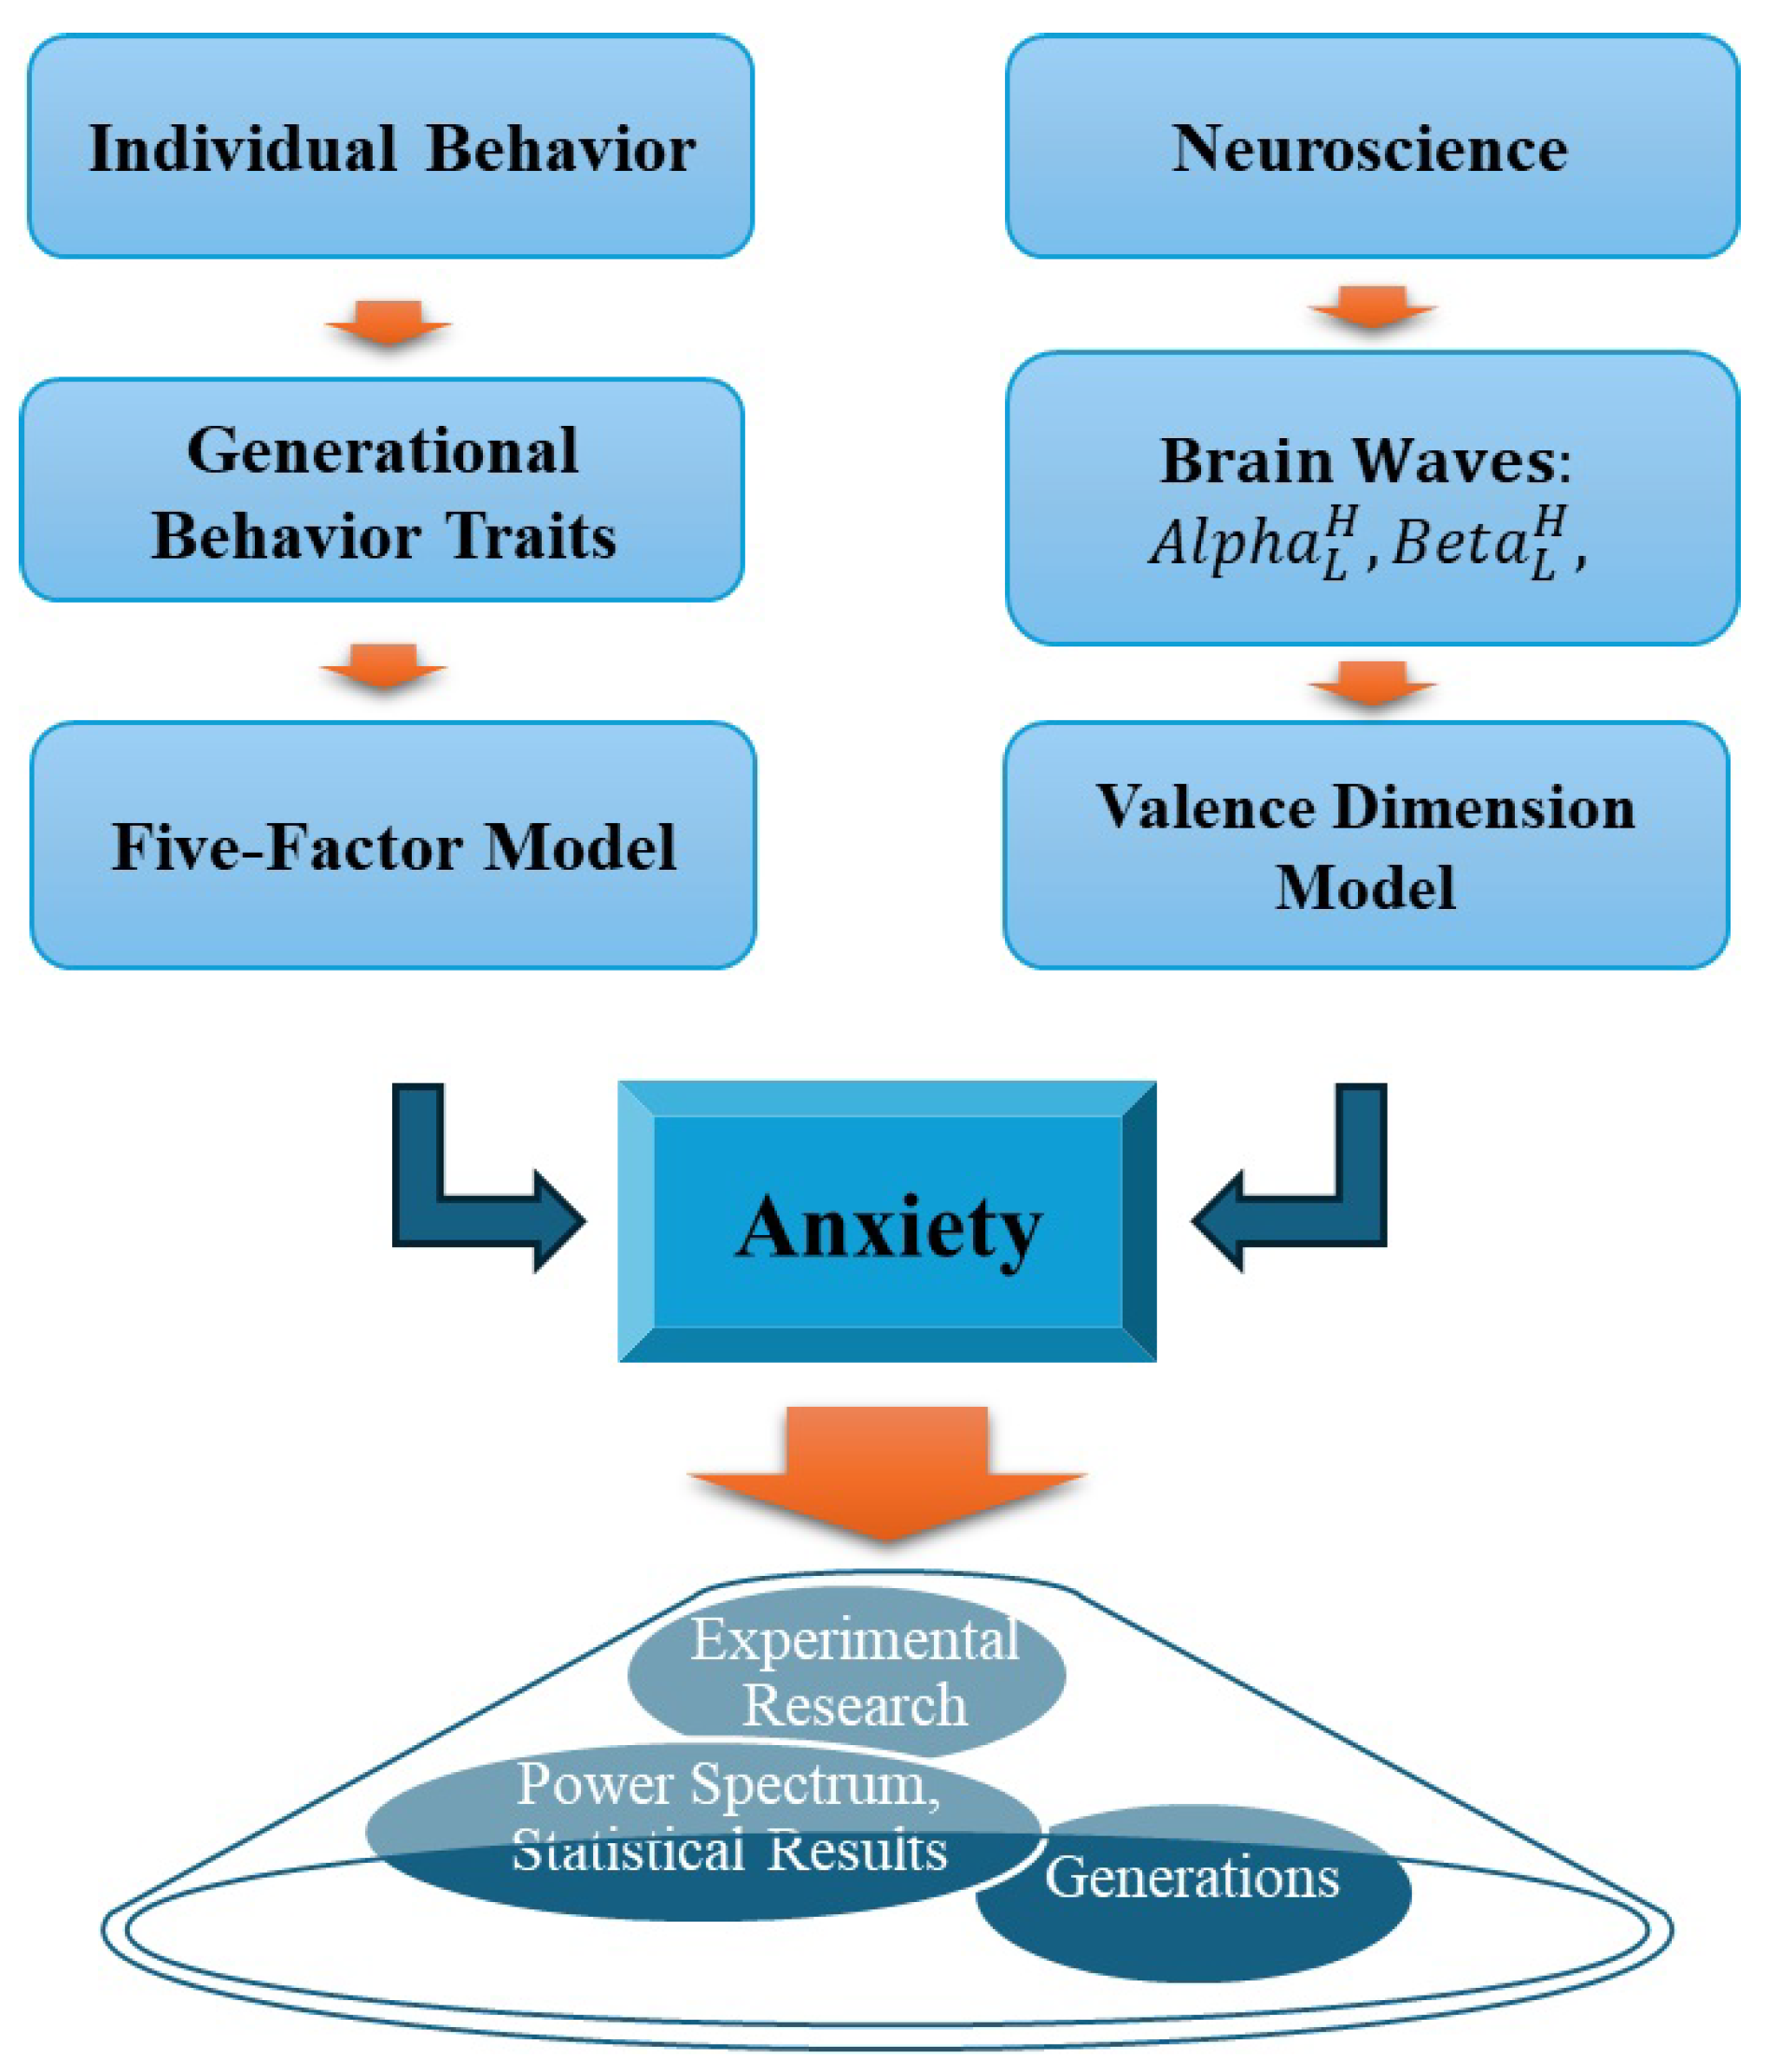
Figure 4.
Visualization of Brain Waves of Participants in Group 1 Using the ICA Dipole Method
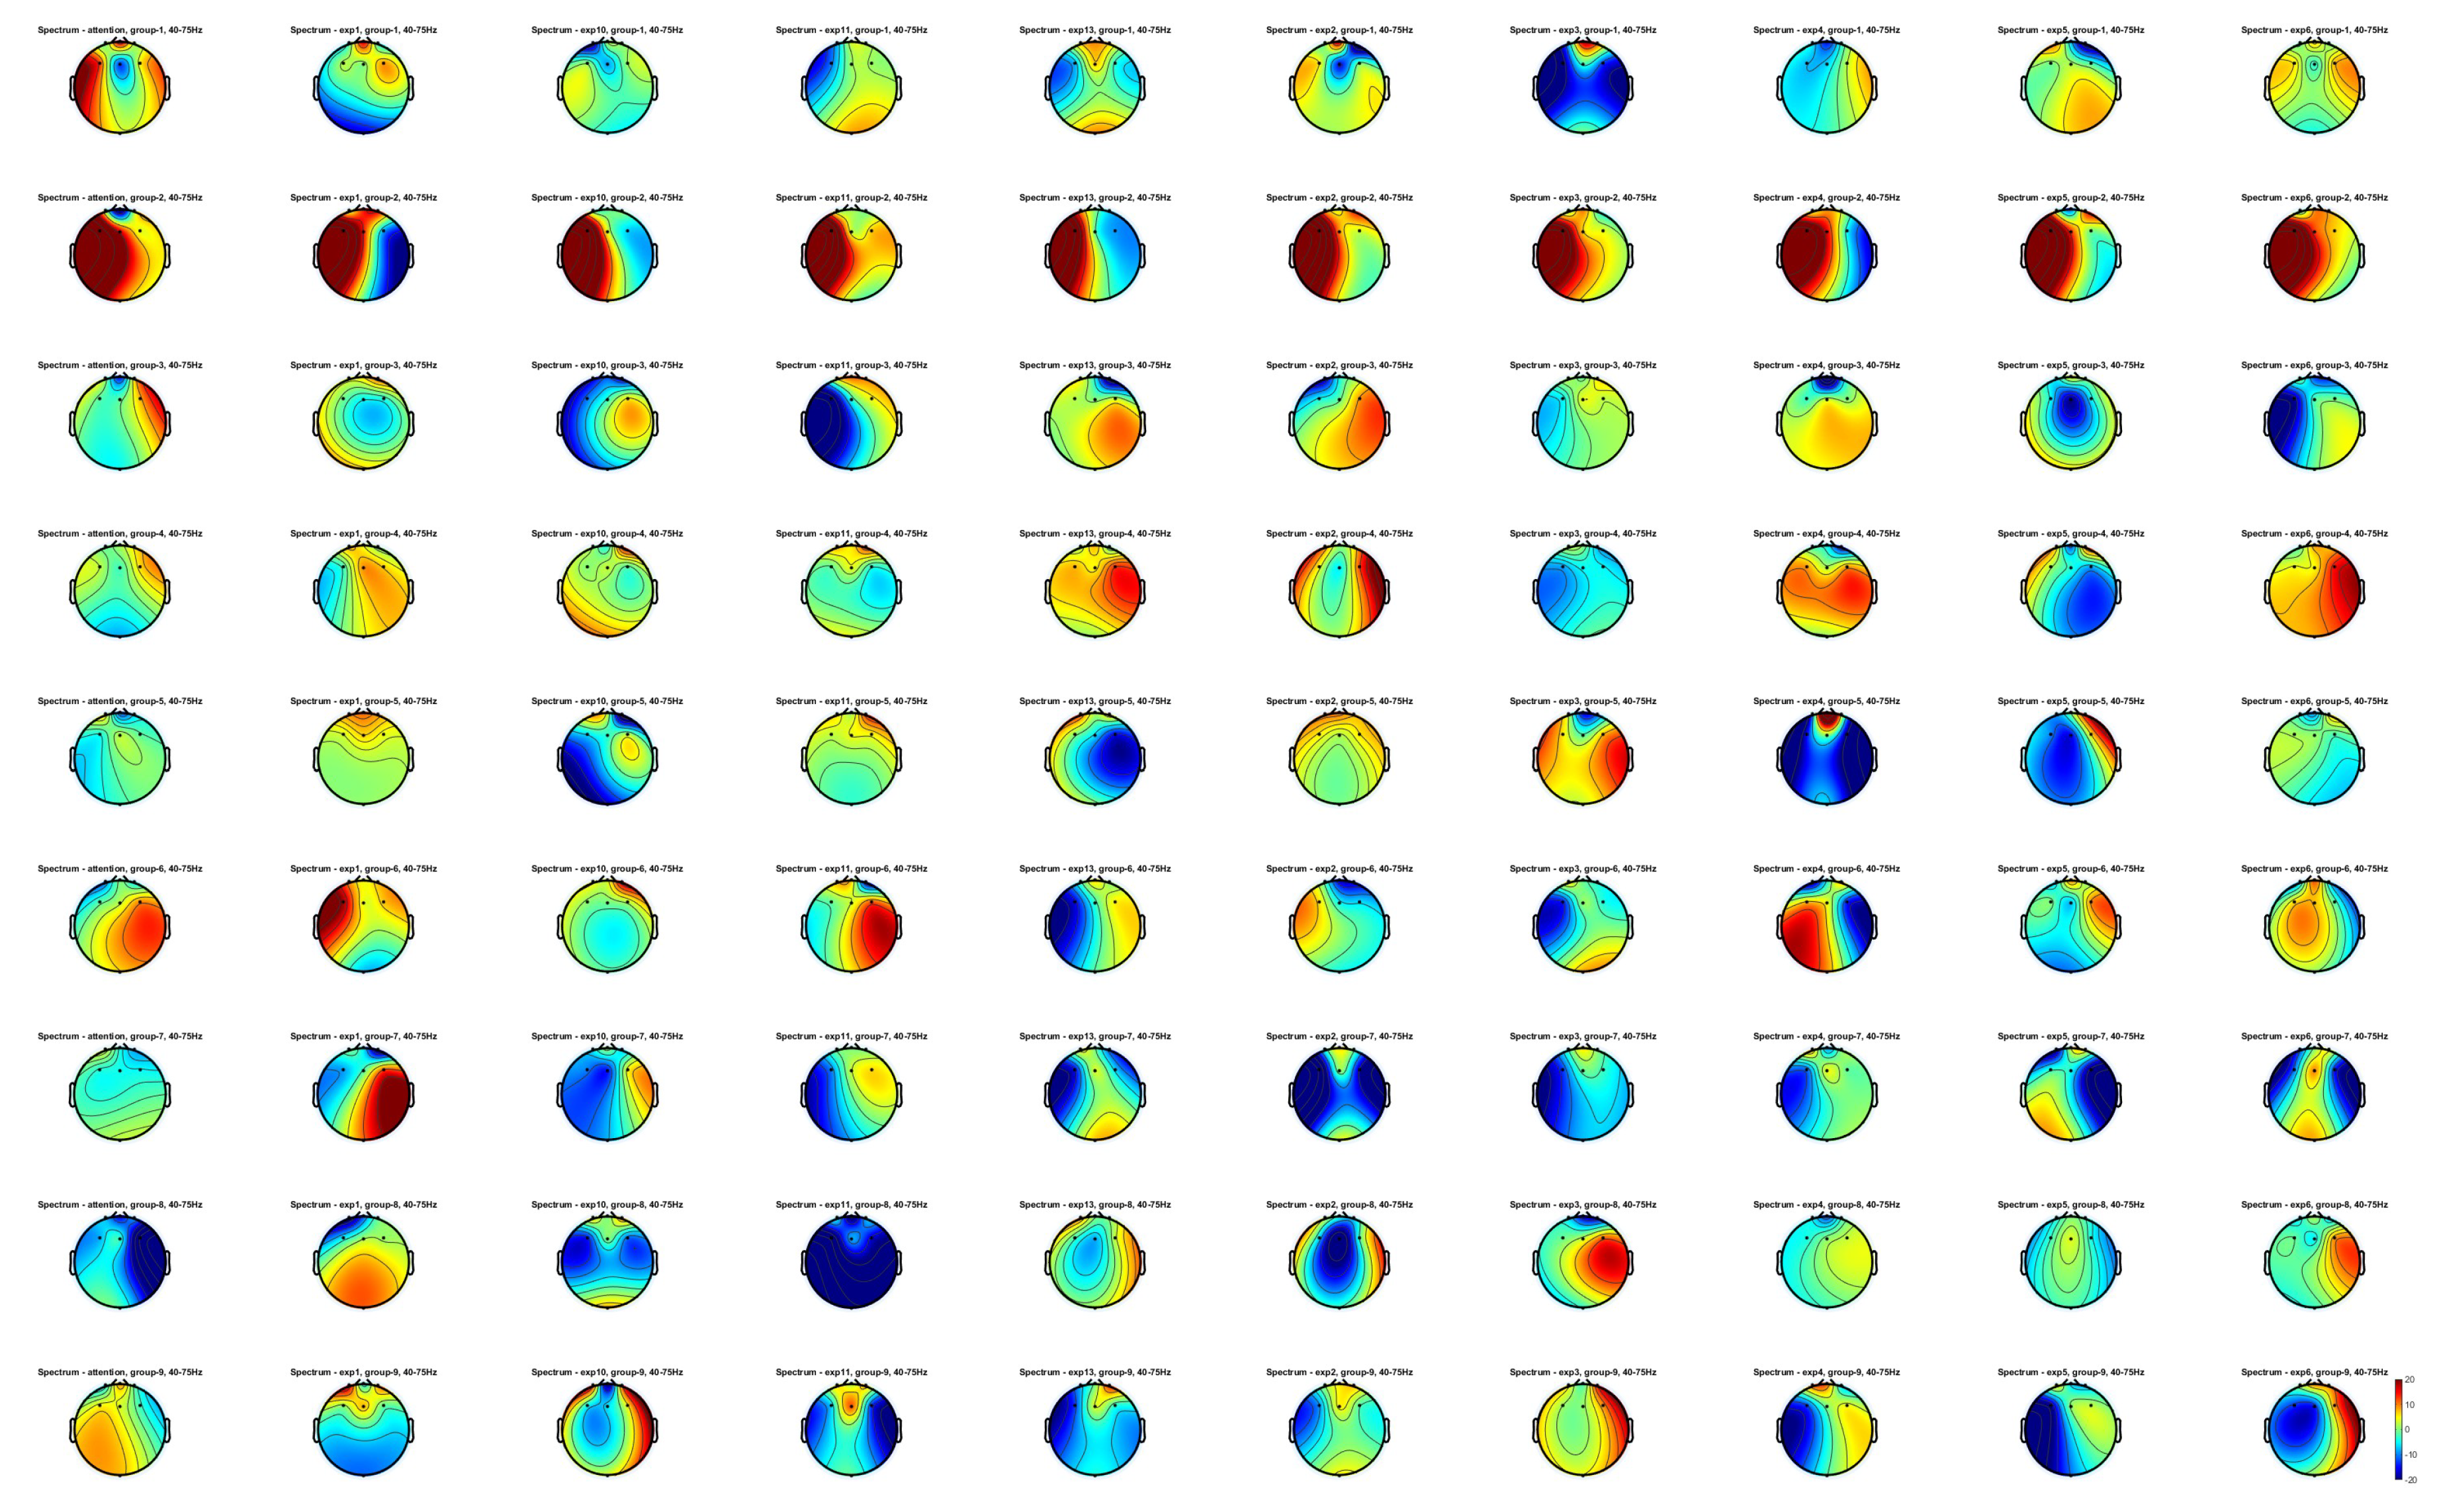
Figure 5.
Enter Caption
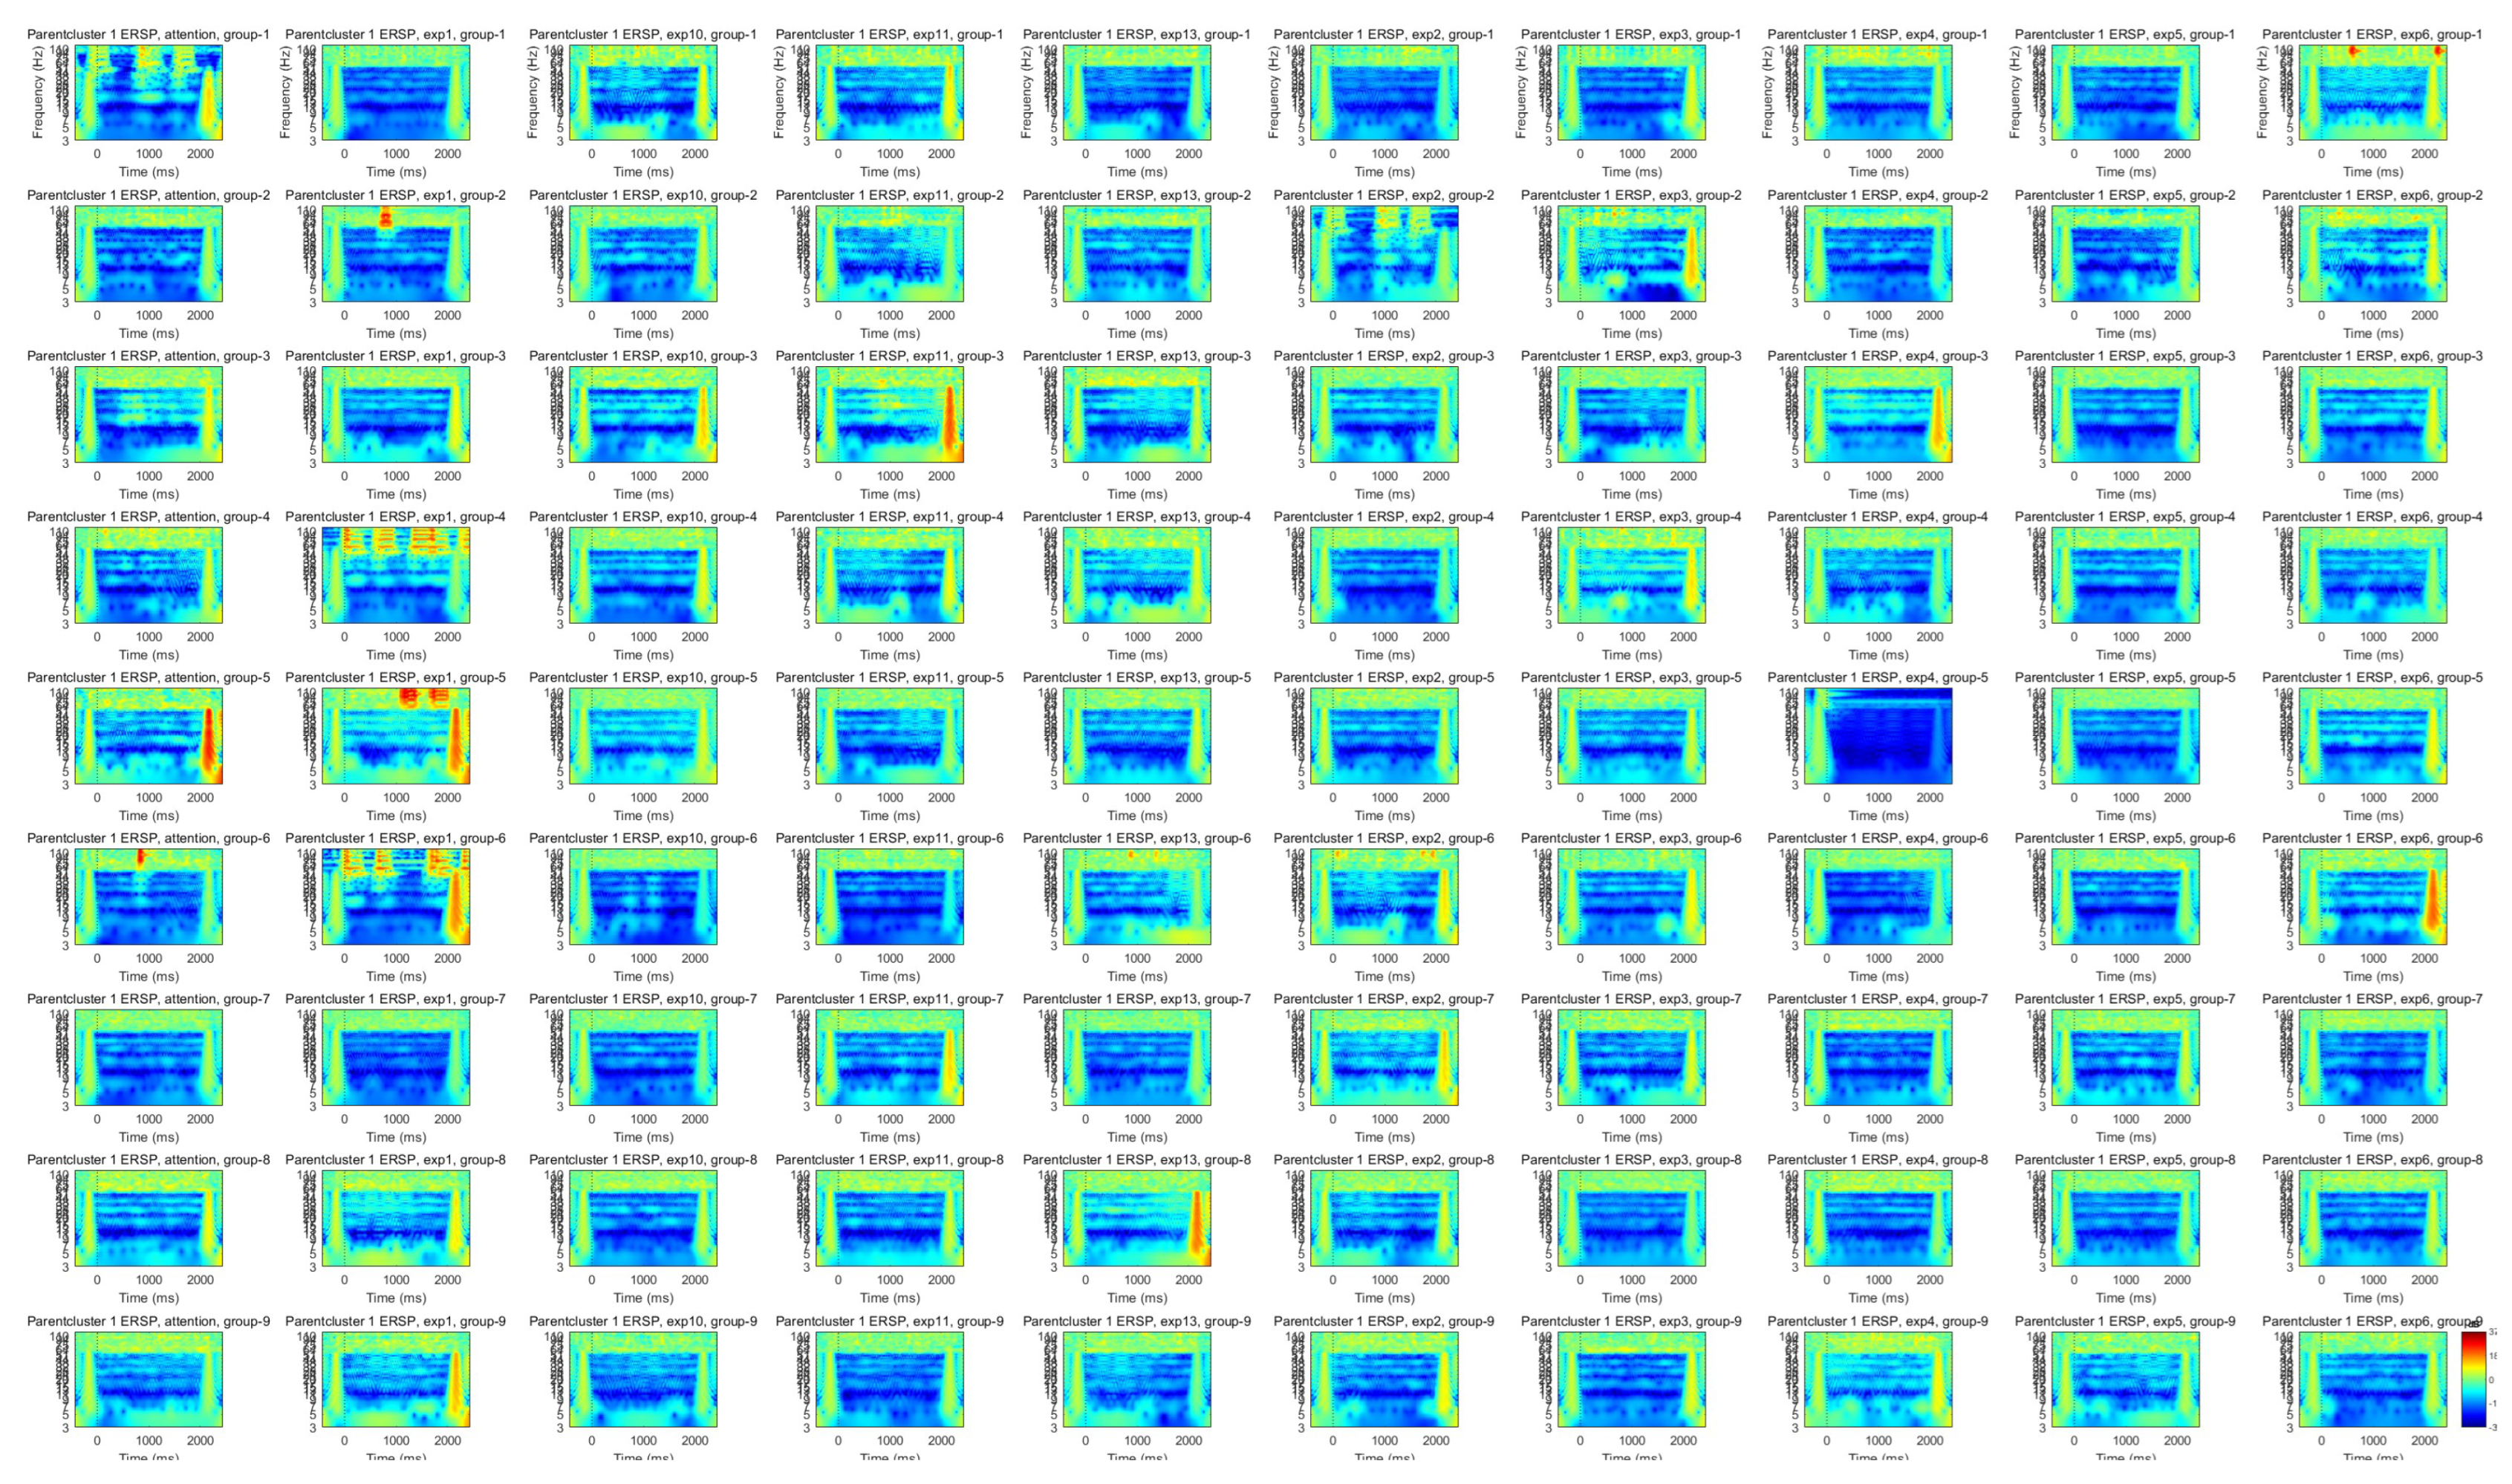
Figure 7.
Brain Mapping of Group 2 Calculated Using Dipole and ICA Methods
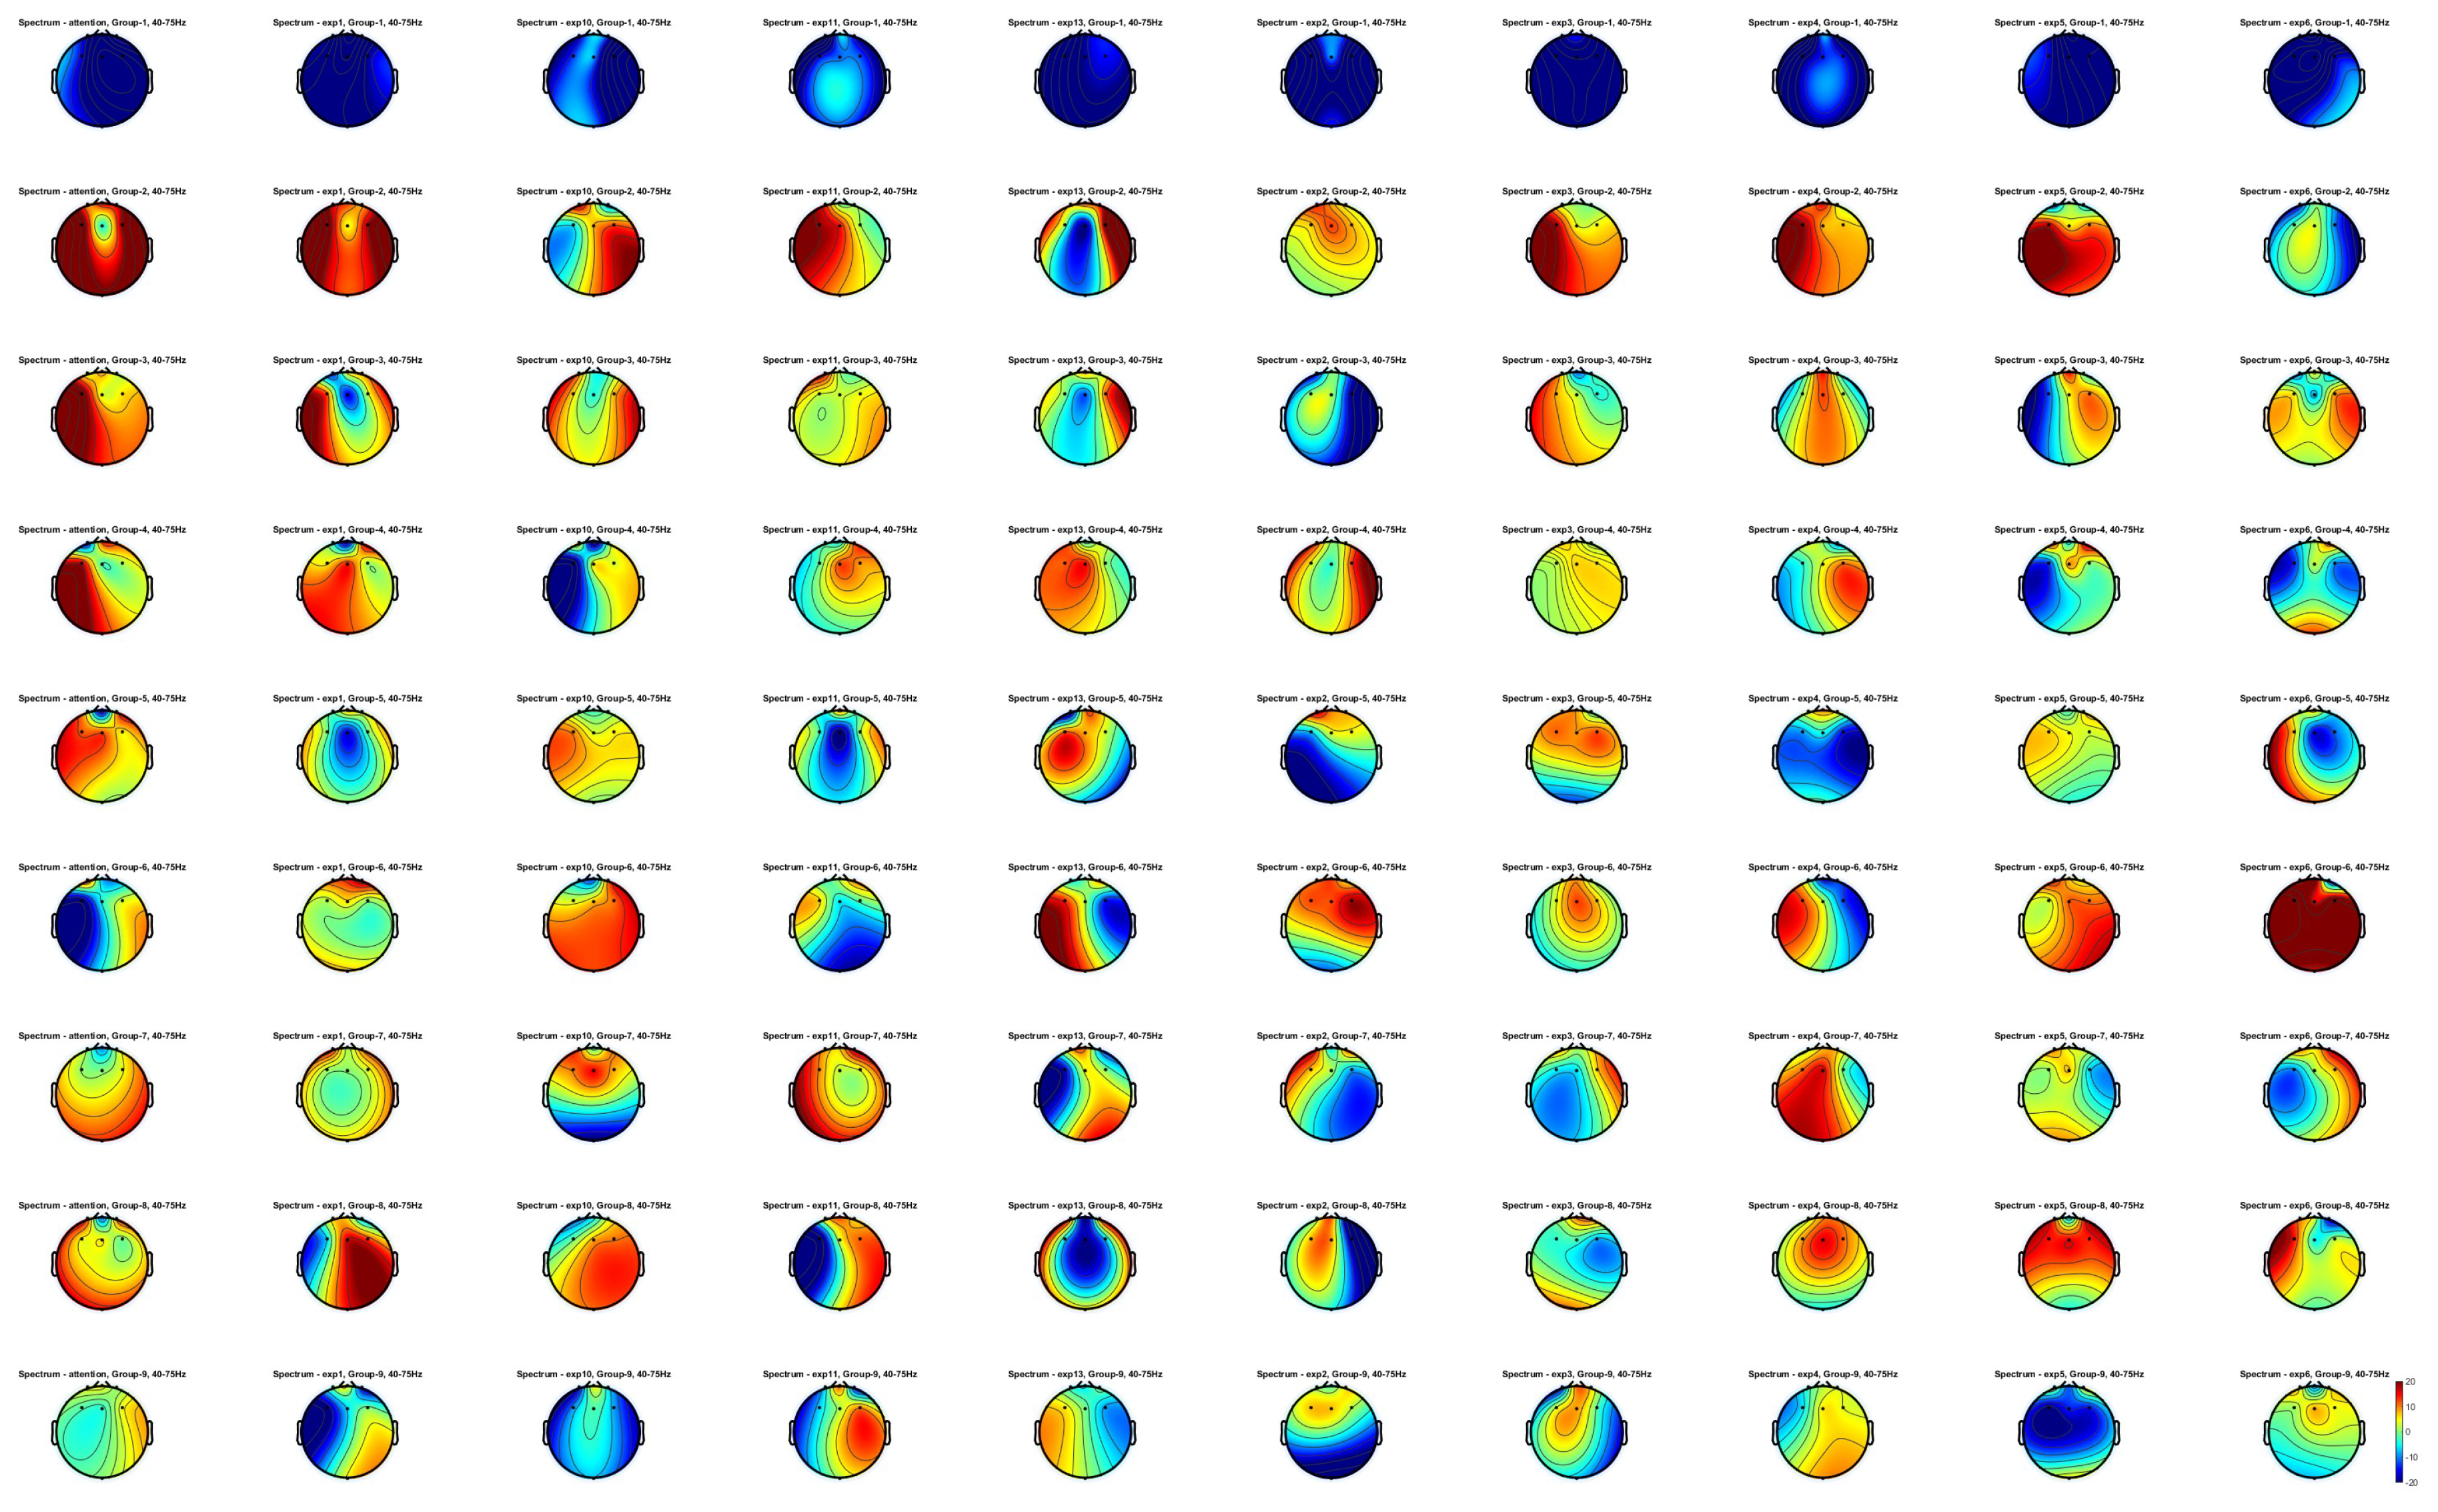
Figure 8.
Brain Mapping of Group 2 Participants Specifically Experiencing Anxiety

Figure 9.
Comparison Between Groups Y and Z Based on Calculations Using Machine Learning Methods
Disclaimer/Publisher’s Note: The statements, opinions and data contained in all publications are solely those of the individual author(s) and contributor(s) and not of MDPI and/or the editor(s). MDPI and/or the editor(s) disclaim responsibility for any injury to people or property resulting from any ideas, methods, instructions or products referred to in the content. |
© 2025 by the authors. Licensee MDPI, Basel, Switzerland. This article is an open access article distributed under the terms and conditions of the Creative Commons Attribution (CC BY) license (http://creativecommons.org/licenses/by/4.0/).
Copyright: This open access article is published under a Creative Commons CC BY 4.0 license, which permit the free download, distribution, and reuse, provided that the author and preprint are cited in any reuse.


