Submitted:
19 January 2025
Posted:
20 January 2025
You are already at the latest version
Abstract
Background/Objectives: We aimed to explore long-term trajectories of thy-roid-stimulating hormone receptor antibody (TRAb) in patients with Graves’ disease (GD) and to identify key factors associated with TRAb normalization. We also investigated whether these trajectories correlate with Graves’ orbitopathy (GO) comorbidity. Methods: We retrospectively reviewed 403 patients with GD who had an initial TRAb level ≥ 1.5 IU/L between 2010 and 2021, monitoring their TRAb levels for at least 3 years. K-means clustering was performed to categorize patients into distinct TRAb change patterns (A, B, C, D). We employed a Cox regression–based time-to-event model, expressing results as “Survival ratio” rather than the conventional Hazard ratio, to reflect the proportion of patients achieving TRAb normalization over time. Key variables included age, sex, ini-tial TRAb, and GO comorbidity. Results: Four unique TRAb patterns emerged, differing primarily in baseline TRAb levels, duration of GD, and treatment approaches. Pattern A demonstrated the highest TRAb normalization rate (96%), whereas Patterns B (80%), C (29%), and D (13%) showed lower probabilities. Regrouping into A vs BCD further emphasized the distinct normalization profile of Pattern A. A higher “Survival ratio” was observed in female patients and those with baseline TRAb < 6.14 IU/L. In contrast, patients whose TRAb levels were ≥ 6.14 IU/L frequently exhibited persistently elevated values over a decade. GO comorbidity did not significantly differ among the four patterns. Conclusions: K-means clustering revealed four unique TRAb change patterns in GD, with baseline TRAb (stratified by the median of 6.14 IU/L) and sex emerging as sig-nificant predictors of normalization. These findings highlight the importance of early TRAb monitoring and tailored therapeutic strategies, particularly for those with persistently elevated TRAb levels.
Keywords:
thyrotropin receptor antibody (TRAB)
; graves’ disease
; k-means clustering
; longitudinal patterns
; graves’ orbitopathy
1. Introduction
Graves’ disease (GD) is an autoimmune disorder primarily characterized by excessive thyroid hormone secretion. Thyroid-stimulating hormone receptor antibodies (TRAb) play a key etiological role in this process by stimulating thyroid-stimulating hormone (TSH) receptors, thereby leading to hyperthyroidism [1]. The TRAb assay is a vital tool for diagnosing GD owing to its high sensitivity and specificity. [2] In addition, TRAb levels typically decline as GD is managed with antithyroid medications or thyroidectomy, although radioactive iodine (RAI) treatment can transiently elevate TRAb levels during the first year [3,4,5]. During the clinical course of GD treatment, the specific cutoff values of TRAb serve as good predictors of relapse [6]. By evaluating whether TRAb remains elevated or decreases to normal ranges, clinicians can make more informed decisions regarding the continuation or cessation of antithyroid therapy [7,8].
TRAb also plays an important role in the pathogenesis of Graves’ orbitopathy (GO) by increasing hyaluronic acid synthesis and promoting adipogenesis in orbital fibroblasts [9]. Patients with a severe course of GO exhibit significantly higher TRAb levels at diagnosis and during follow-up [10]. High TRAb is also considered a risk factor for GO progression following RAI treatment and guides clinicians in determining whether steroid prophylaxis should be prescribed to prevent GO exacerbation after RAI treatment [11].
As TRAb is an important factor in both the pathogenesis and treatment guidelines for GD and GO, investigating its long-term changes in GD is worthwhile. While several studies have explored the overall average changes in TRAb levels during different GD treatments, there is a notable research gap in classifying the distinct patterns of TRAb changes over time during GD treatment and their relationship with GO comorbidity [3,5,12]. Identifying distinct patterns of TRAb changes could provide deeper insights into disease prognosis and help optimize individualized treatment strategies.
Predicting TRAb trends can also aid in clinical decision-making by guiding the duration of antithyroid medication and monitoring for extrathyroidal manifestations, including GO [13]. Therefore, the primary objective of this study was to characterize the long-term patterns of TRAb changes during GD treatment and to evaluate their association with the presence of GO. We also aimed to identify key factors related to TRAb normalization. By investigating these aspects, we hope to enhance our understanding of TRAb dynamics and their implications for the management and potential progression of GO.
2. Materials and Methods
2.1. Patient Recruitment
A retrospective analysis was conducted on the medical records of adult patients (aged 19 years and above) diagnosed with GD at Tertiary National University Hospital between the years 2010 and 2021. The inclusion criteria for the study required patients to have a TRAb level exceeding 1.5 IU/L and a minimum of 3-year follow-up on TRAb levels. The exclusion criteria included the absence of laboratory test results, prior diagnosis of GO, or missing treatment records. The Institutional Review Board (IRB) of Pusan National University Hospital approved this study, as indicated by the assigned IRB number 2306-030-128.
2.2. Clinical and Laboratory Assessment
TRAb levels were measured using the TRAK human radio receptor assay (Thermo Fisher Scientific, Germany), which has a reference range of 0–1.5 IU/L. Yearly TRAb values were collected for each patient, and missing measurements were estimated by linear interpolation [14]. Linear interpolation is a commonly used method for time-series data in which a straight line is drawn between two known data points, and the missing value is assumed to lie along this line.
We applied k-means clustering to identify distinct longitudinal patterns of TRAb changes (“Patterns A, B, C, D”) based on baseline TRAb levels, changes over time, and whether normalization occurred. In addition, we performed a cox-regression analysis using a median-based threshold of 6.14 IU/L to divide patients into “lower-TRAb” (<6.14 IU/L) and “higher-TRAb” (≥6.14 IU/L) groups. Although no formal cutoff analysis (e.g., ROC curve) was performed, 6.14 IU/L was chosen because it represented the median TRAb value in our study population.
GD treatment status during the follow-up period was collected, including the duration of methimazole prescription, statin use, RAI treatment history, and thyroidectomy. GD duration and GO comorbidities were also reviewed. GO diagnosis was confirmed by a specialized ophthalmologist at the same hospital whose primary responsibility was to manage patients with GO. The clinical parameters were compared between the different TRAb patterns and investigated to determine whether they were related to TRAb normalization.
2.3. Statistical Analysis
Clustering analysis: To identify homogeneous patient trajectories, we used the KmL algorithm (Christophe and Bruno, 2009) for functional cluster analysis. KmL, a non-parametric extension of k-means for longitudinal data, clusters based on the overall shape and temporal changes of trajectories, rather than individual points. For handling missing values, we utilized the 'linearInterpol.local' imputation method, which involves linear interpolation for intermittent missing values and considers the global slope at the end [14,15]. The number of clusters was determined based on clinical judgment and interpretation. Clinical parameters between the different patterns were compared using Pearson's chi-square test, Kruskal–Wallis rank sum test.
Survival analysis: We estimated the median time to normalization of TRAb values using Kaplan-Meier curves. Survival data from the original dataset were utilized, with "survival time" defined as the duration from the index date to either normalization time or the last follow-up observation. The "status" variable was coded as 1 for normalization and 0 for cases without normalization (censored). Univariate and multivariate Cox regression analyses were conducted to identify factors affecting the time to TRAb value normalization. For the Cox models, we chose to present results as “Survival ratio” rather than the conventional hazard ratio, aiming to emphasize the proportion of patients who achieve TRAb normalization over time. Specifically, the “Survival ratio” reflects the relative rate of normalization events in one group compared to another at a given time point.
In all analyses, statistical analyses were performed using the R statistical language (version 4.0.5; R Core Team, 2021) and additional packages (kml, longitudinalData). A p-value of <0.05 was considered statistically significant.
3. Results
A total of 403 patients (111 men) were included in this study. The mean age at enrollment was 47.65 ± 15.58 years, and the mean follow-up duration was 4.88 ± 2.33 years. At diagnosis, the mean disease duration of GD was 0.49 ± 0.86 years, and 63 patients (16%) presented with comorbid GO. Antithyroid medication (methimazole) was prescribed to 359 patients (89%) for an average of 44 ± 33.1 months (1,320 ± 993 days). Statin therapy was used in 40 patients (9.9%), radioactive iodine (RAI) therapy was performed in 47 (12%), and 5 (1.2%) underwent thyroidectomy during the follow-up (Table 1).
The mean baseline TRAb level was 8.98 ± 8.00 IU/L. Over a 10-year period, the mean of all measured TRAb values (“10-year average”) was 4.76 ± 6.38 IU/L, with a within-patient standard deviation (“10-year SD”) of 4.10 ± 3.74 IU/L. The annual rate of TRAb change was -0.29 ± 1.26 IU/L/year, indicating a general decline in TRAb levels across most patients, although some exhibited stable or even increasing trends. In total, 333 patients (83%) achieved TRAb normalization (<1.5 IU/L), and the mean time to normalization was 2.60 ± 1.87 years.
3.1. Patterns of TRAb Over Time and Overall Clinical Information
Out of 4,433 total TRAb measurements, 567 interpolated data points were generated after excluding measurements obtained following TRAb normalization (with no subsequent follow-up). Four distinct patterns of TRAb were identified over time and were designated as A, B, C, and D based on initial TRAb levels, annual rates of change, and final normalization outcomes (Figure 1, Table 1).
Pattern A (n = 291, 72.2%) had the lowest baseline TRAb (6.8 ± 5.42 IU/L) and showed a mean TRAb change of -0.41 ± 0.41 IU/L/year. This group attained a 96% normalization rate, with a median survival time of 2 years (p < 0.001).
Pattern B (n = 51, 12.6%) had the highest baseline TRAb (20.39 ± 10.21 IU/L) and exhibited a steep negative trend (-1.98 ± 0.77 IU/L/year). TRAb normalization occurred in 80% of these patients, and the median survival time was 8 years (p < 0.001).
By contrast, Patterns C (n = 38, 9.4%) and D (n = 23, 5.7%) showed positive mean TRAb changes (0.88 ± 1.28 IU/L/year and 2.95 ± 1.65 IU/L/year, respectively) and lower normalization rates (29% and 13%). Fewer than half of the patients in Patterns C and D achieved normalization within the study period (p < 0.001). Patterns B and D demonstrated steeper annual TRAb changes than A and C (P < 0.001), and Patterns A and B had higher final normalization rates (96% and 80%) than C and D (29% and 13%) (P < 0.001).
Among these four patterns, Pattern B had the longest mean disease duration (1.02 ± 1.48 years, p = 0.018), whereas Pattern D showed the highest thyroidectomy rate (8.7%, p = 0.006). Comorbidity with GO did not significantly differ across patterns (p = 0.876). MMI was prescribed for the shortest duration in Pattern A (1,118 ± 910 days, p < 0.001), while RAI therapy was more frequently used in Patterns B (35%), C (16%), and D (30%) than in Pattern A (5.5%, p < 0.001). Statin prescription rates did not differ significantly among the four groups (p = 0.759). Detailed demographic and clinical variables for each pattern are provided in Table 1.
3.2. Two Main Patterns Based on Normalization Rate
When Pattern A was compared with the combined Patterns B, C, and D (hereafter “BCD group”), Pattern A showed a significantly higher normalization rate. Specifically, 278 of 291 patients (96%) in Pattern A achieved TRAb normalization, whereas only 55 of 112 patients (49%) in the BCD group did so (p < 0.001). Consistent with these findings, the baseline TRAb level in Pattern A was markedly lower (6.80 ± 5.42 IU/L) than in the BCD group (14.65 ± 10.50 IU/L; p < 0.001; Table 2).
Disease duration was also shorter in Pattern A (0.39 ± 0.69 years) compared with the BCD group (0.73 ± 1.16 years; p = 0.004). Methimazole (MMI) therapy was prescribed for an average of 1,118 ± 910 days in Pattern A, significantly less than the 1,830 ± 1,013 days in the BCD group (p < 0.001). In addition, the BCD group had higher rates of radioactive iodine (RAI) therapy (28% vs. 5.5%, p < 0.001) and thyroidectomy (3.6% vs. 0.3%, p = 0.022). No significant differences in MMI usage frequency (p = 0.427) or statin prescription (p = 0.246) were noted between the two groups.
The mean TRAb change rate was -0.41 ± 0.41 IU/L/year in Pattern A, compared with 0.00 ± 2.28 IU/L/year in the BCD group (p < 0.001). Likewise, the time to TRAb normalization was shorter in Pattern A (2.39 ± 1.64 years) than in the BCD group (4.27 ± 2.64 years; p < 0.001). Detailed demographic and clinical variables for both Pattern A and the BCD group are summarized in Table 2.
3.3. Survival Analysis of TRAb
The median time to TRAb normalization in the overall cohort was 3 years (Figure 2A). When patients were classified into the four predefined patterns (A, B, C, D), Pattern A had a median survival time of 2 years, whereas Pattern B showed a notably longer median survival time of 8 years. In Patterns C and D, fewer than half of the patients achieved normalization within the 10-year observation period.
An additional survival analysis compared Pattern A with the combined Patterns B, C, and D (hereafter “BCD group”). In this comparison, the BCD group demonstrated a median survival time of 9 years (Figure 2B,C), indicating a slower normalization rate than that observed in Pattern A.
3.4. Prognostic Factors Associated with Patterns
We performed survival analyses using a Cox regression model but present the results as “Survival ratio” (SR) rather than the conventional hazard ratio. These analyses demonstrated that Pattern A was significantly associated with a higher probability of TRAb normalization compared with Patterns B, C, and D (p < 0.001; Table 3). In the multivariable model, the SR for TRAb normalization in Pattern A was 8.391 (95% CI: 3.087–22.81), whereas Patterns B and C did not show significant differences relative to Pattern D.
Among the patient characteristics examined, female sex increased the likelihood of TRAb normalization by approximately 1.3-fold (p = 0.044), and having an initial TRAb level below 6.14 IU/L was associated with a 1.7-fold higher probability of normalization (p < 0.001). Age, presence of GO, methimazole (MMI) treatment, statin use, and radioactive iodine (RAI) therapy were not significant predictors of TRAb normalization in the multivariable analysis. Although RAI therapy showed a reduced likelihood of TRAb normalization in the univariate model (SR, 0.415; 95% CI: 0.272–0.632; p < 0.001), this effect did not persist in the multivariable model (SR, 0.715; 95% CI: 0.459–1.113; p = 0.138). Thyroidectomy also did not exhibit a statistically significant association with TRAb normalization in the final analysis.
In a separate comparison of Pattern A (Group A) versus the combined BCD group (Patterns B, C, and D), similar results were obtained: female sex and lower baseline TRAb (< 6.14 IU/L) were significantly linked to faster TRAb normalization (data not shown). Detailed SRs and confidence intervals for each factor are provided in Table 3.
4. Discussion
Our findings demonstrate that the median time to TRAb normalization in this cohort was 3 years, underscoring the heterogeneous clinical courses of GD. Based on baseline TRAb levels, rate of changes, and normalization rates, we identified four distinct patterns. These could be further grouped into two main categories depending on whether the median time to normalization was within 2 years. Pattern A rapidly achieved normalization (median 2 years), whereas the remaining patterns generally required longer durations or exhibited normalization rates below 50%. Although these discrepancies were linked to factors such as disease duration, treatment modalities, and baseline TRAb concentrations, GO comorbidity rates did not differ significantly across the patterns. Notably, female sex and lower initial TRAb (<6.14 IU/L) were associated with greater probabilities of achieving normalization.
Among these patterns, Pattern A—observed in the majority of our cohort—appears to reflect the most favorable disease trajectory.Patients in Pattern A had the lowest baseline TRAb, the shortest time to normalization, less frequent use of RAI, and shorter durations of MMI therapy. This aligns with earlier reports indicating that an early and sustained response to a 12–18-month course of MMI often leads to remission in GD [7,16]. Patterns B, C, and D demonstrated relatively higher initial TRAb levels, longer methimazole prescription durations, and higher RAI and thyroidectomy prescription rates than pattern A. Notably, a high baseline TRAb level is a recognized risk factor for relapse [17,18], and discontinuation of antithyroid medication has been associated with relapse rates of 40–50% in Europe and Japan and approximately 37% in South Korea [19,20]. Consistent with these observations, the 2016 American Thyroid Association guidelines recommend either extending antithyroid therapy or opting for definitive treatments (RAI or surgery) in patients who demonstrate persistently elevated TRAb levels or experience clinical relapse [7].
Patterns B, C, and D likely represent clinical trajectories in which patients failed to achieve remission with an initial MMI course or experienced relapse after medication withdrawal.These patterns showed higher baseline TRAb levels, more frequent second-line or ablative interventions, and extended MMI prescriptions, consistent with earlier reports that prolonged or repeated antithyroid therapy—combined with elevated TRAb—often necessitates RAI or thyroidectomy [21,22]. Notably, Pattern B achieved a higher rate of TRAb normalization (80%) than Patterns C (29%) and D (13%), despite exhibiting the highest baseline TRAb level. Although Pattern B required a longer median time (8 years) to normalization than Pattern A, its eventual success highlights the role of additional or extended therapies for patients who fail to achieve remission after the initial MMI course. Indeed, previous studies have noted that a substantial proportion of GD patients who relapse following first-line MMI can still attain euthyroidism with prolonged medical therapy or RAI [23]. Still, the median survival time of 8 years and a mean TRAb change rate of -1.98 ± 0.77 IU/L/year in Pattern B highlight the impact of baseline TRAb levels on long-term outcomes [24]. Even with comprehensive management—including pharmacological and surgical interventions—achieving TRAb normalization within a widely acceptable timeframe (e.g., 2–3 years) can remain elusive for many patients [24].
Patterns C and D further illustrate the complexity of TRAb dynamics by offering distinct pathways to persistent elevation.Pattern C began with a relatively elevated baseline TRAb but exhibited only a modest positive slope, resulting in a 29% normalization rate. In contrast, Pattern D, despite starting from a moderate baseline TRAb, showed both fluctuations and an overall upward trend, even after multiple treatments, including RAI and, in 8.7% of cases, thyroidectomy. Some individuals in Pattern D maintained persistently elevated TRAb levels following surgery, potentially reflecting residual thyroid tissue or ongoing autoimmune activity [25]. This resistance to conventional treatments underscores the need for more aggressive or alternative therapeutic approaches and suggests possible immunologic or genetic underpinnings [5,26,27,28].
Regarding GO, our data showed no significant difference in GO comorbidity across these TRAb patterns, despite notable variations in RAI use. Specifically, 28% of patients in the combined BCD group underwent RAI compared with 14% in Pattern A (p < 0.001), yet GO incidence was 14% vs. 16%, respectively. This may be partly due to the concurrent and prolonged use of MMI in nearly 90% of the BCD group. In line with these findings, Azizi et al. [28] demonstrated that concurrent MMI administration reduces the risk of GO exacerbation in patients receiving RAI. Nevertheless, prospective studies are warranted to clarify whether extended antithyroid therapy truly mitigates GO risk in individuals presenting with high baseline TRAb.
The observed GO comorbidity rates of 11–17% are lower than the 27% reported by Tanda et al. [29] potentially reflecting differences in study design and patient selection. We required at least three years of TRAb follow-up, which may have excluded some patients with severe GO who lacked the requisite longitudinal data or were referred early for specialized care. Although no significant differences in GO comorbidities emerged among the four patterns, other investigations have found that higher TRAb levels correlate with more severe GO [10]. Future work examining GO severity rather than mere presence or absence may provide deeper insights.
Our results also corroborate previous evidence that female sex and lower initial TRAb levels predict a higher likelihood of TRAb normalization. Women have been reported to achieve higher remission rates than men [30], and an elevated baseline TRAb is a well-established marker for relapse. Cappelli et al. [24] similarly demonstrated that TRAb titers at GD diagnosis can help forecast long-term outcomes, where a high titer predicts persistent disease.
Despite identifying four distinct patterns of TRAb changes, clinicians should note that significant variability can exist within each cluster. Although these patterns offer a valuable framework for understanding general trajectories, individual patient courses may deviate substantially from the cluster average. Such heterogeneity reflects the multifactorial nature of GD, encompassing genetic predispositions, immune-regulatory differences, and variable treatment responses [31]. Accordingly, these patterns should be treated as broad guides rather than definitive predictions of each patient’s course, reinforcing the need for personalized approaches, possibly incorporating additional biomarkers and clinical variables.
Our study has some limitations. First, the retrospective design and single-center setting may introduce biases and underestimate GO comorbidities compared with previous reports, as not all newly diagnosed GD patients were referred for ophthalmological evaluation. Second, we did not classify disease states (relapse vs. remission) in our TRAb analysis, potentially overlooking important clinical nuances. Lastly, while linear interpolation is practical for handling missing data in a long-term dataset, it does not account for abrupt fluctuations that individual patients may experience. Nonetheless, this study provides valuable insights into the longitudinal behavior of TRAb and its clinical relevance in GD management.
In conclusion, we identified four distinct TRAb patterns in GD, which could be consolidated into two broader groups based on median survival times for normalization. Each pattern reflects varying TRAb trajectories and therapeutic intensities, offering clinicians a potential tool to anticipate disease courses and customize treatment strategies. Prospective, multicenter studies that incorporate a broader range of clinical, immunologic, and imaging parameters are necessary to validate these findings and further elucidate the interplay between TRAb patterns, GO severity, and long-term remission rates.
Author Contributions
Conceptualization, J.P. and J.H.K.; methodology, H.Y.C.; software, J.K.; validation, S.S.K. and H.Y.C.; formal analysis, J.K.; investigation, J.P. and J.H.K.; resources, S.S.K.; data curation, J.K.; writing—original draft preparation, J.H.K, J.P.; writing—review and editing, J.P, H.Y.C. and S.W.Y.; visualization, J.K.; supervision, S.W.Y.; project administration, S.W.Y.; funding acquisition, J.P, S.W.Y. All authors have read and agreed to the published version of the manuscript.
Funding
This study was supported by Biomedical Research Institute Grant (20210012), Pusan National University Hospital.
Institutional Review Board Statement
The study was conducted in accordance with the Declaration of Helsinki, and approved by the Institutional Review Board of Pusan National University Hospital approved this study, as indicated by the assigned IRB number 2306-030-128.
Informed Consent Statement
Patient consent was waived due to its retrospective review
Data Availability Statement
Data can be provided upon request.
Acknowledgments
This study was supported by the Department of Biostatistics of the Biomedical Research Institute, Pusan National University Hospital.
Conflicts of Interest
The authors have no relevant financial or non-financial competing interests to disclose.
References
- Adams, D. Pathogenesis of the Hyperthyroidism of Graves's Disease. British medical journal 1965, 1, 1015. [Google Scholar] [CrossRef] [PubMed]
- Tozzoli, R.; Bagnasco, M.; Giavarina, D.; Bizzaro, N. TSH receptor autoantibody immunoassay in patients with Graves' disease: improvement of diagnostic accuracy over different generations of methods. Systematic review and meta-analysis. Autoimmunity reviews 2012, 12, 107–113. [Google Scholar] [CrossRef] [PubMed]
- Laurberg, P.; Wallin, G.; Tallstedt, L.; Abraham-Nordling, M.; Lundell, G.; Tørring, O. TSH-receptor autoimmunity in Graves' disease after therapy with anti-thyroid drugs, surgery, or radioiodine: a 5-year prospective randomized study. European Journal of Endocrinology 2008, 158, 69–75. [Google Scholar] [CrossRef]
- Takamura, Y.; Nakano, K.; Uruno, T.; Ito, Y.; Miya, A.; Kobayashi, K.; et al. Changes in serum TSH receptor antibody (TRAb) values in patients with Graves' disease after total or subtotal thyroidectomy. Endocrine journal 2003, 50, 595–601. [Google Scholar] [CrossRef] [PubMed]
- Fang, Y.; Du, W.-H.; Zhang, C.-X.; Zhao, S.-X.; Song, H.-D.; Gao, G.-Q.; et al. The effect of radioiodine treatment on the characteristics of TRAb in Graves’ disease. BMC Endocrine disorders 2021, 21, 1–9. [Google Scholar] [CrossRef]
- Hesarghatta Shyamasunder, A.; Abraham, P. Measuring TSH receptor antibody to influence treatment choices in Graves’ disease. Clinical endocrinology 2017, 86, 652–657. [Google Scholar] [CrossRef]
- Ross, D.S.; Burch, H.B.; Cooper, D.S.; Greenlee, M.C.; Laurberg, P.; Maia, A.L.; et al. 2016 American Thyroid Association guidelines for diagnosis and management of hyperthyroidism and other causes of thyrotoxicosis. Thyroid 2016, 26, 1343–1421. [Google Scholar] [CrossRef]
- Park, J.; Kim, J.; Kim, S.S.; Choi, H.-Y. Prognostic significance of thyroid-stimulating hormone receptor antibodies in moderate-to-severe graves’ orbitopathy. Frontiers in Endocrinology 2023, 14, 1153312. [Google Scholar] [CrossRef]
- Iyer, S.; Bahn, R. Immunopathogenesis of Graves’ ophthalmopathy: the role of the TSH receptor. Best Practice & Research Clinical Endocrinology & Metabolism 2012, 26, 281–289. [Google Scholar]
- Eckstein, A.; Esser, J.; Mann, K.; Schott, M. Clinical value of TSH receptor antibodies measurement in patients with Graves' orbitopathy. Pediatric endocrinology reviews: PER 2010, 7, 198–203. [Google Scholar]
- Shiber, S.; Stiebel-Kalish, H.; Shimon, I.; Grossman, A.; Robenshtok, E. Glucocorticoid regimens for prevention of Graves' ophthalmopathy progression following radioiodine treatment: systematic review and meta-analysis. Thyroid 2014, 24, 1515–1523. [Google Scholar] [CrossRef] [PubMed]
- Kim, J.; Choi, M.S.; Park, J.; Park, H.; Jang, H.W.; Choe, J.-H.; et al. Changes in thyrotropin receptor antibody levels following total thyroidectomy or radioiodine therapy in patients with refractory Graves' disease. Thyroid 2021, 31, 1264–1271. [Google Scholar] [CrossRef] [PubMed]
- Barbesino, G.; Tomer, Y. Clinical utility of TSH receptor antibodies. The Journal of Clinical Endocrinology & Metabolism 2013, 98, 2247–2255. [Google Scholar]
- Genolini, C.; Falissard, B. KmL: k-means for longitudinal data. Computational Statistics 2010, 25, 317–328. [Google Scholar] [CrossRef]
- Genolini, C.; Falissard, B. KmL: A package to cluster longitudinal data. Computer methods and programs in biomedicine 2011, 104, e112–e21. [Google Scholar] [CrossRef]
- Kahaly, G.J.; Bartalena, L.; Hegedüs, L.; Leenhardt, L.; Poppe, K.; Pearce, S.H. 2018 European Thyroid Association guideline for the management of Graves’ hyperthyroidism. European thyroid journal 2018, 7, 167–186. [Google Scholar] [CrossRef]
- Vitti, P.; Rago, T.; Chiovato, L.; Pallini, S.; Santini, F.; Fiore, E.; et al. Clinical features of patients with Graves' disease undergoing remission after antithyroid drug treatment. Thyroid 1997, 7, 369–375. [Google Scholar] [CrossRef]
- Tun, N.N.Z.; Beckett, G.; Zammitt, N.N.; Strachan, M.W.; Seckl, J.R.; Gibb, F.W. Thyrotropin receptor antibody levels at diagnosis and after thionamide course predict Graves' disease relapse. Thyroid 2016, 26, 1004–1009. [Google Scholar] [CrossRef]
- Park, S.Y.; Kim, B.H.; Kim, M.; Hong, A.R.; Park, J.; Park, H.; et al. The longer the antithyroid drug is used, the lower the relapse rate in Graves’ disease: a retrospective multicenter cohort study in Korea. Endocrine 2021, 74, 120–127. [Google Scholar] [CrossRef]
- Thyrotoxicosis ATAaAAoCEToHaOCo, Bahn RS, Burch HB, Cooper DS, Garber JR, Greenlee MC, et al. Hyperthyroidism and other causes of thyrotoxicosis: management guidelines of the American Thyroid Association and American Association of Clinical Endocrinologists. Thyroid 2011, 21, 593–646. [Google Scholar] [CrossRef]
- Fereidoun, Azizi., Miralireza, Takyar., Elham, Madreseh., Elham, Madreseh., Atieh, Amouzegar. (2019). 4. Treatment of Toxic Multinodular Goiter: Comparison of Radioiodine and Long-Term Methimazole Treatment. Thyroid.
- Kiminori, Sugino., Takashi, Mimura., Osamu, Ozaki., Hiroyuki, Iwasaki., Nobuyuki, Wada., Akihiko, Matsumoto., Kunihiko, Ito. (1996). 3. Preoperative Change of Thyroid Stimulating Hormone Receptor Antibody Level: Possible Marker for Predicting Recurrent Hyperthyroidism in Patients with Graves’ Disease after Subtotal Thyroidectomy. World Journal of Surgery.
- Villagelin, D.; Romaldini, J.H.; Santos, R.B.; Milkos, A.B.; Ward, L.S. Outcomes in relapsed Graves' disease patients following radioiodine or prolonged low dose of methimazole treatment. Thyroid 2015, 25, 1282–1290. [Google Scholar] [CrossRef] [PubMed]
- Cappelli, C.; Gandossi, E.; Castellano, M.; Pizzocaro, C.; Agosti, B.; Delbarba, A.; et al. Prognostic value of thyrotropin receptor antibodies (TRAb) in Graves' disease: a 120 months prospective study. Endocrine journal 2007, 54, 713–720. [Google Scholar] [CrossRef] [PubMed]
- Shivangi, Dwivedi., Tejas, Kalaria., Harit, Buch. (2022). 1. Thyroid autoantibodies. Journal of Clinical Pathology.
- Nalla, P.; Young, S.; Sanders, J.; Carter, J.; Adlan, M.A.; Kabelis, K.; et al. Thyrotrophin receptor antibody concentration and activity, several years after treatment for Graves’ disease. Clinical Endocrinology 2019, 90, 369–374. [Google Scholar] [CrossRef] [PubMed]
- Samuels, M.H. Serum TSH Receptor Antibodies Fall Gradually and Only Rarely Switch Functional Activity in Treated Graves’ Disease. Clinical Thyroidology 2019, 31, 330–332. [Google Scholar] [CrossRef]
- Azizi, F.; Abdi, H.; Mehran, L.; Perros, P.; Masoumi, S.; Amouzegar, A. Long-term follow-up of graves orbitopathy after treatment with short-or long-term methimazole or radioactive iodine. Endocrine Practice 2023, 29, 240–246. [Google Scholar] [CrossRef]
- Tanda, M.; Piantanida, E.; Liparulo, L.; Veronesi, G.; Lai, A.; Sassi, L.; et al. Prevalence and natural history of Graves' orbitopathy in a large series of patients with newly diagnosed graves' hyperthyroidism seen at a single center. The Journal of Clinical Endocrinology & Metabolism 2013, 98, 1443–1449. [Google Scholar]
- Suzuki, N.; Noh, J.Y.; Yoshimura, R.; Mikura, K.; Kinoshita, A.; Suzuki, A.; et al. Does age or sex relate to severity or treatment prognosis in Graves' disease? Thyroid 2021, 31, 1409–1415. [Google Scholar] [CrossRef]
- Simmonds, M.; Gough, S. Unravelling the genetic complexity of autoimmune thyroid disease: HLA, CTLA-4 and beyond. Clinical & Experimental Immunology 2004, 136, 1–10. [Google Scholar]
Figure 1.
Four Patterns of Long-Term TRAb Changes in Graves’ Disease. Four distinct patterns of thyroid-stimulating hormone receptor antibody (TRAb) change over time in Graves’ disease: A, B, C, and D. Each pattern demonstrated a different baseline, rate of change, and normalization rate of TRAb. TSH, thyroid-stimulating hormone receptor antibody; TRAb, thyroid-stimulating hormone receptor antibody.
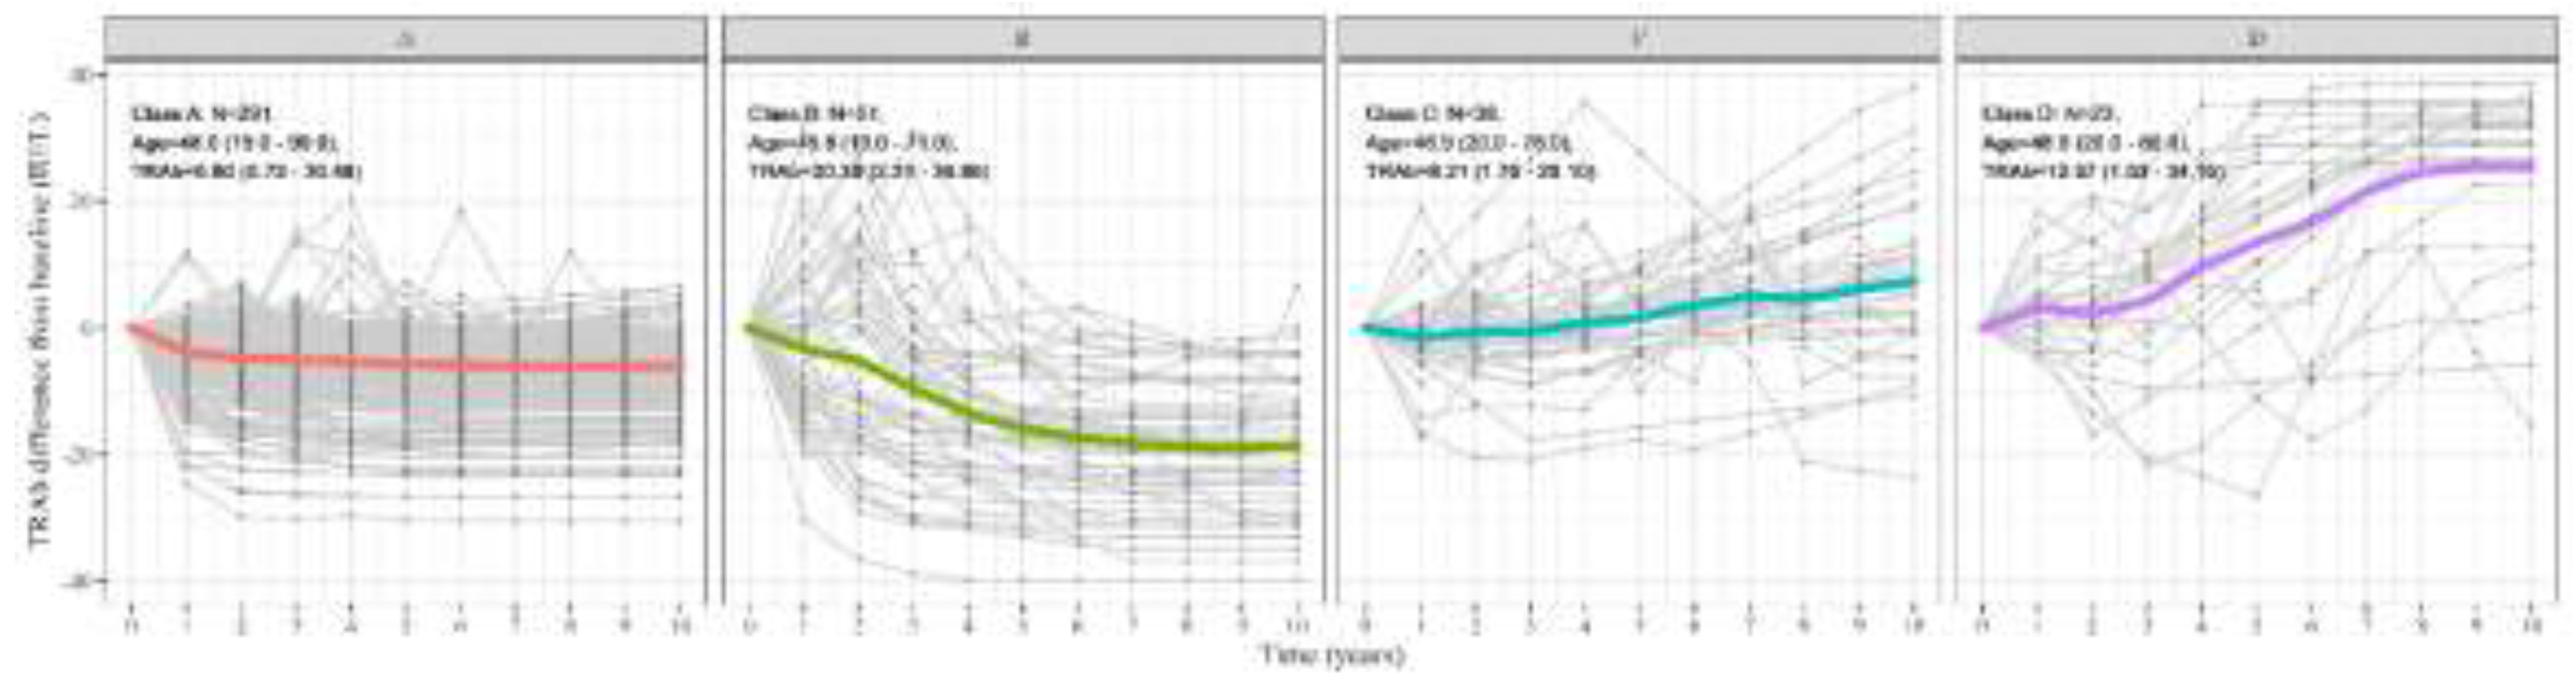
Figure 2.
Kaplan-Meier Curves of TRAb Normalization Across Overall Patients and Patterns in Graves’ Disease. (A) Figure 2A depicts the Kaplan-Meier survival curve, demonstrating the time to thyroid-stimulating hormone receptor antibody (TRAb) normalization among the total patient over a 10-year follow-up period. The median time of normalization was observed to be 3 years, by the end of the 10-year period, approximately 80% of the patients had achieved TRAb normalization. (B) Kaplan–Meier curve of TRAb normalization in each of the four TRAb change patterns. A and B achieved high normalization rate compared to C and D. A revealed a faster TRAb normalization compared to B while C showed a faster TRAb normalization compared to D. (C) Kaplan–Meier curve of TRAb normalization in A and BCD patterns. A showed a higher and faster normalization pattern compared to BCD. TRAb, thyroid-stimulating hormone receptor antibody.
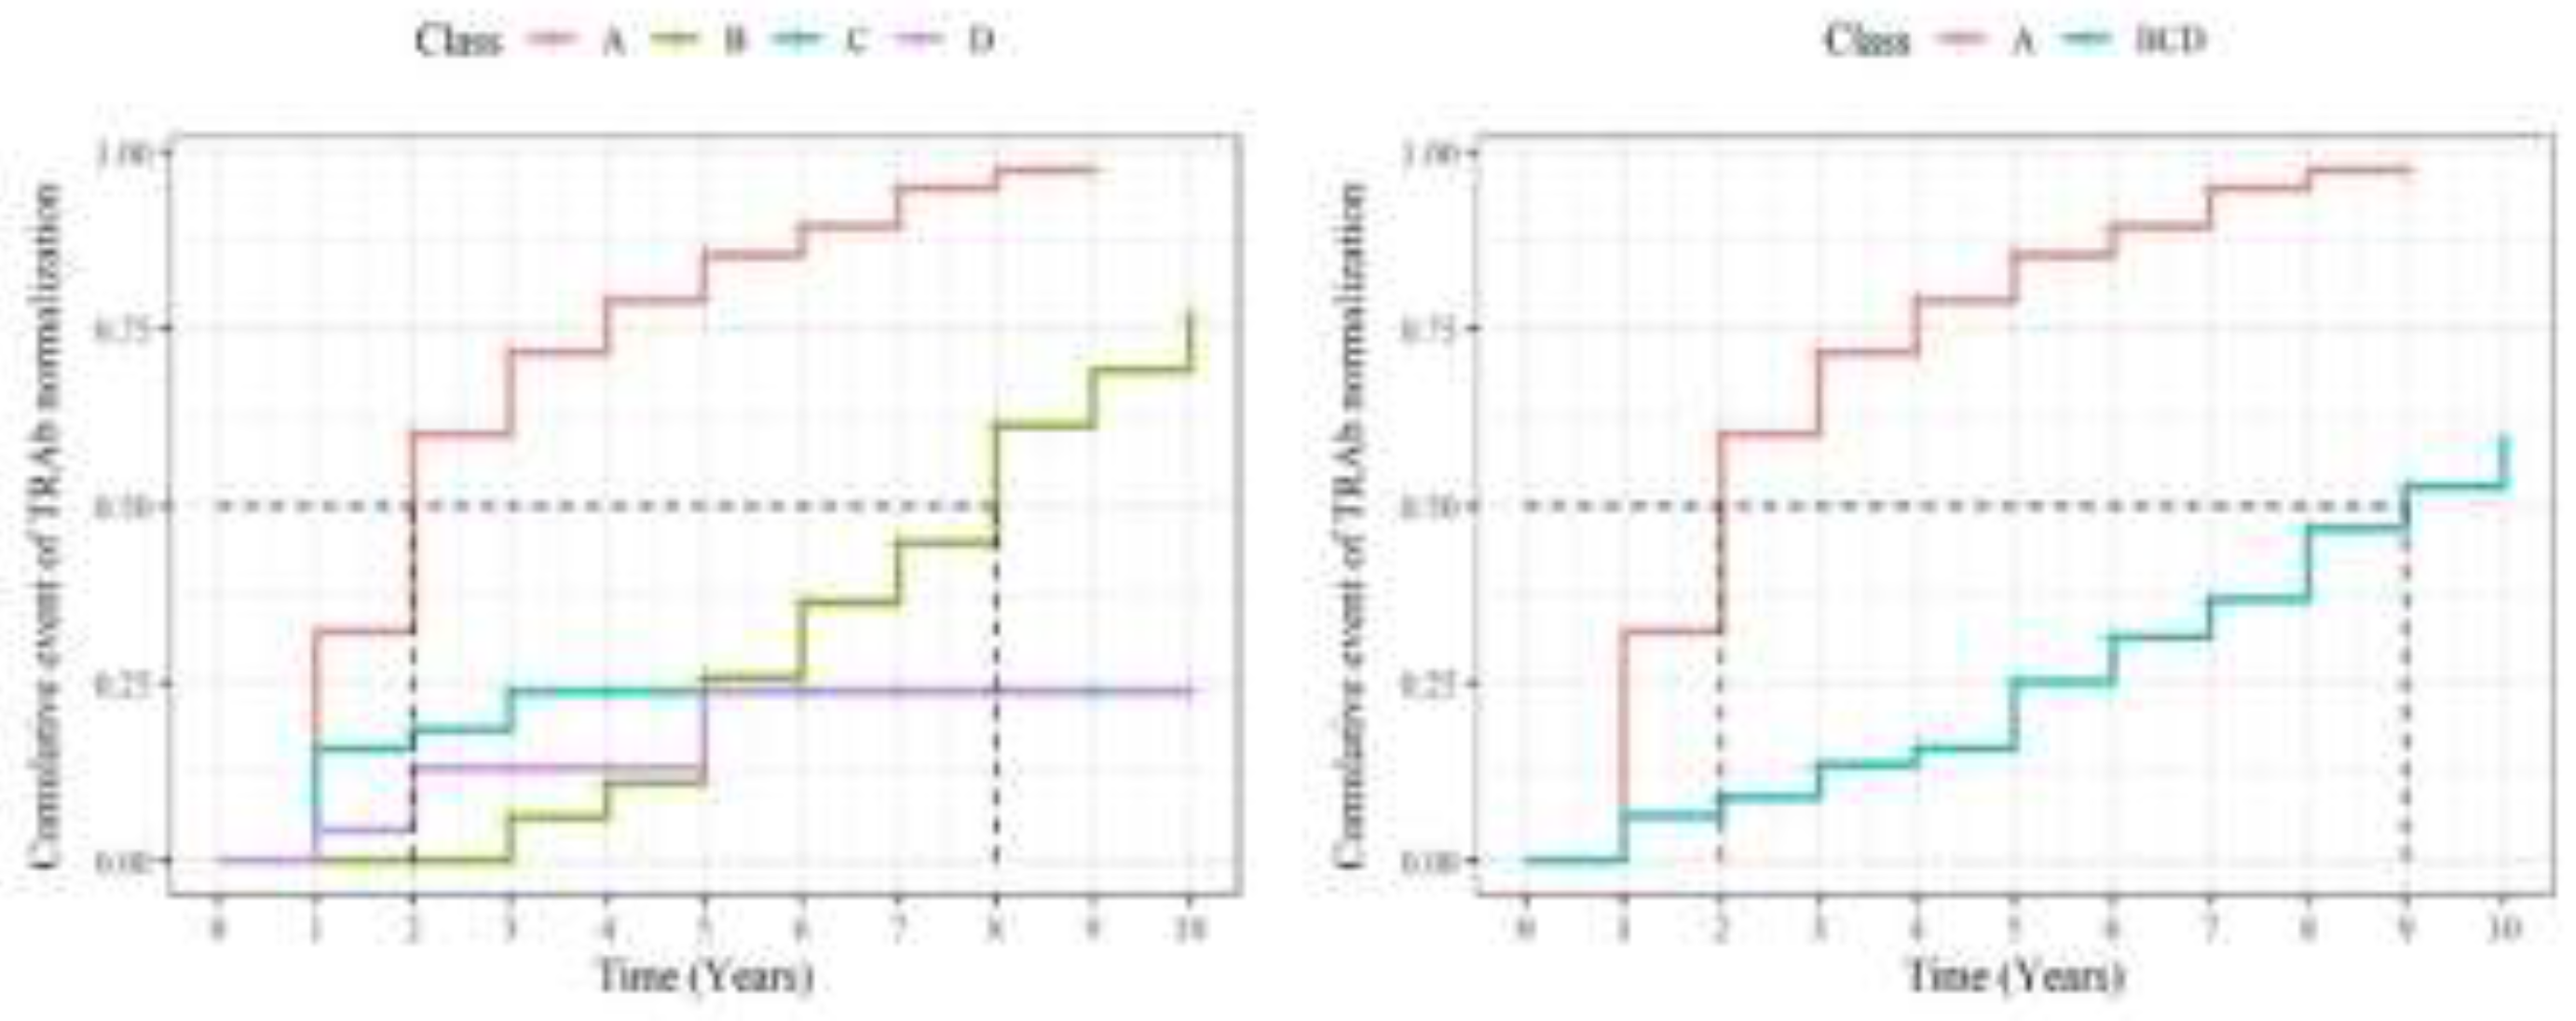

Table 1.
Demographics in the overall study population and four distinct patterns of TRAb change over time in Graves’ disease.
Table 1.
Demographics in the overall study population and four distinct patterns of TRAb change over time in Graves’ disease.
| Overall | A | B | C | D | P-value* | |
|---|---|---|---|---|---|---|
| N (%) | 403 | 291 (72.2) | 51 (12.6) | 38 (9.4) | 23 (5.7) | |
| Follow up duration (year) | 4.88 (2.33) | 4.68 (2.30) | 5.84 (2.44) | 5.21 (2.18) | 4.74 (2.12) | 0.006 |
| Age (year) | 47.65 (15.58) | 47.96 (15.10) | 45.80 (15.49) | 46.95 (17.92) | 48.96 (18.25) | 0.837 |
| Sex (male: female) | 111 : 292 | 78 : 213 | 11:40 | 13:25 | 9:14 | 0.336 |
| Disease duration (year) | 0.49 (0.86) | 0.39 (0.69) | 1.02 (1.48) | 0.46 (0.70) | 0.55 (0.81) | 0.018 |
| Graves' orbitopathy comorbidity (N (%)) | 63 (16%) | 47 (16%) | 8 (16%) | 4 (11%) | 4 (17%) | 0.876 |
| Methimazole | 359 (89%) | 257 (88%) | 46 (90%) | 36 (95%) | 20 (87%) | 0.697 |
| Methimazole prescription (day) | 1,320 (993) | 1,118 (910) | 1,858 (1,078) | 1,815 (944) | 1,792 (1,027) | <0.001 |
| Statin | 40 (9.9%) | 32 (11%) | 4 (7.8%) | 2 (5.3%) | 2 (8.7%) | 0.759 |
| Radioactive iodine treatment | 47 (12%) | 16 (5.5%) | 18 (35%) | 6 (16%) | 7 (30%) | <0.001 |
| Thyroidectomy | 5 (1.2%) | 1 (0.3%) | 2 (3.9%) | 0 (0%) | 2 (8.7%) | 0.006 |
| Baseline TRAb (IU/L) | 8.98 (8.00) | 6.80 (5.42) | 20.39 (10.21) | 8.21 (6.36) | 12.57 (9.93) | <0.001 |
| 10-year average of TRAb (IU/L) | 4.76 (6.38) | 1.81 (1.36) | 7.72 (3.05) | 10.61 (3.47) | 25.88 (4.12) | <0.001 |
| 10-year SD of TRAb (IU/L) | 4.10 (3.74) | 2.36 (1.74) | 8.86 (2.49) | 6.00 (3.44) | 12.36 (3.40) | <0.001 |
| Change rate of TRAb (IU/L/year) | -0.29 (1.26) | -0.41 (0.41) | -1.98 (0.77) | 0.88 (1.28) | 2.95 (1.65) | <0.001 |
| Normalization rate of TRAb (N (%)) | 333 (83%) | 278 (96%) | 41 (80%) | 11 (29%) | 3 (13%) | <0.001 |
| Period to normalization (year) | 2.60 (1.87) | 2.39 (1.64) | 5.85 (2.03) | 1.56 (0.88) | 2.50 (1.73) | <0.001 |
Values are presented as means (standard deviations) or numbers (%). TRAb, thyroid-stimulating hormone receptor antibody; SD, standard deviation; *Pearson's chi-square test, Kruskal–Wallis rank-sum test, or Fisher’s exact test.
Table 2.
Demographics in the overall study population and two re-clustered patterns (A vs. BCD) of TRAb change over time in Graves’ disease.
Table 2.
Demographics in the overall study population and two re-clustered patterns (A vs. BCD) of TRAb change over time in Graves’ disease.
| Overall | A | BCD | P-value* | |
|---|---|---|---|---|
| N (%) | 403 | 291 (72.2) | 112 (27.7) | |
| Follow up duration (year) | 4.88 (2.33) | 4.68 (2.30) | 5.40 (2.32) | 0.002 |
| Age (year) | 47.65 (15.58) | 47.96 (15.10) | 46.84 (16.81) | 0.592 |
| Sex (male : female) | 111 : 292 | 78 : 213 | 33 : 79 | 0.592 |
| Disease duration (year) | 0.49 (0.86) | 0.39 (0.69) | 0.73 (1.16) | 0.004 |
| Graves' orbitopathy comorbidity (N (%)) | 63 (16%) | 47 (16%) | 16 (14%) | 0.644 |
| Methimazole | 359 (89%) | 257 (88%) | 102 (91%) | 0.427 |
| Methimazole prescription duration (day) | 1,320 (993) | 1,118 (910) | 1,830 (1,013) | <0.001 |
| Statin | 40 (9.9%) | 32 (11%) | 8 (7.1%) | 0.246 |
| Radioactive iodine treatment | 47 (12%) | 16 (5.5%) | 31 (28%) | <0.001 |
| Thyroidectomy | 5 (1.2%) | 1 (0.3%) | 4 (3.6%) | 0.022 |
| Baseline TRAb (IU/L) | 8.98 (8.00) | 6.80 (5.42) | 14.65 (10.50) | <0.001 |
| 10-year average of TRAb (IU/L) | 4.76 (6.38) | 1.81 (1.36) | 12.43 (7.77) | <0.001 |
| 10-year SD of TRAb (IU/L) | 4.10 (3.74) | 2.36 (1.74) | 8.61 (3.78) | <0.001 |
| Change rate of TRAb (IU/L/year) | -0.29 (1.26) | -0.41 (0.41) | 0.00 (2.28) | <0.001 |
| Normalization rate of TRAb (N (%)) | 333 (83%) | 278 (96%) | 55 (49%) | <0.001 |
| Period to normalization (year) | 2.60 (1.87) | 2.39 (1.64) | 4.27 (2.64) | <0.001 |
Values are presented as means (standard deviations) or numbers (%). TRAb, thyroid-stimulating hormone receptor antibody; SD, standard deviation.
Table 3.
Survival analysis using Cox model to examine factors related to normalization of thyroid-stimulating hormone receptor antibody (TRAb).
Table 3.
Survival analysis using Cox model to examine factors related to normalization of thyroid-stimulating hormone receptor antibody (TRAb).
| Univariate analysis | Multivariable analysis | |||||
| Characteristic | Survival ratio | 95%Confidence interval | p-value | Survival ratio | 95%Confidence interval | p-value |
| TRAb pattern | ||||||
| D | 1 | Ref. | — | — | ||
| A | 8.873 | 3.285, 23.97 | <0.001 | 8.391 | 3.087, 22.81 | <0.001 |
| B | 1.860 | 0.635, 5.445 | 0.258 | 1.858 | 0.632, 5.461 | 0.260 |
| C | 1.422 | 0.437, 4.626 | 0.559 | 1.218 | 0.373, 3.981 | 0.744 |
| Sex | ||||||
| M | 1 | Ref. | — | — | ||
| F | 1.227 | 0.942, 1.598 | 0.129 | 1.317 | 1.007, 1.723 | 0.044 |
| Age (year) | ||||||
| 19≤ and <49 | 1 | Ref. | — | — | ||
| 49≤ | 1.065 | 0.846, 1.341 | 0.590 | 1.096 | 0.864, 1.391 | 0.449 |
| GO comorbidity | ||||||
| No | 1 | Ref. | — | — | ||
| Yes | 1.056 | 0.760, 1.466 | 0.747 | 1.135 | 0.805, 1.601 | 0.470 |
| Methimazole | ||||||
| No | 1 | Ref. | — | — | ||
| Yes | 0.866 | 0.608, 1.233 | 0.424 | 1.096 | 0.763, 1.575 | 0.618 |
| Statin | ||||||
| No | 1 | Ref. | — | — | ||
| Yes | 1.188 | 0.823, 1.715 | 0.358 | 1.1 | 0.747, 1.620 | 0.630 |
| RAI treatment | ||||||
| No | 1 | Ref. | — | — | ||
| Yes | 0.415 | 0.272, 0.632 | <0.001 | 0.715 | 0.459, 1.113 | 0.138 |
| Thyroidectomy | ||||||
| No | 1 | Ref. | — | — | ||
| Yes | 1.896 | 0.266, 13.53 | 0.523 | — | — | |
| Baseline TRAb (IU/L) | ||||||
| 6.14≤ | 2.104 | 1.660, 2.666 | <0.001 | 1.746 | 1.363, 2.235 | <0.001 |
| 1.5≤ and <6.14 | 1 | Ref. | — | — | ||
TRAb, thyroid-stimulating hormone receptor antibody; GO, Graves’ orbitopathy; RAI, radioactive iodine.P-value in bold indicates significance at P = 0.05.
Disclaimer/Publisher’s Note: The statements, opinions and data contained in all publications are solely those of the individual author(s) and contributor(s) and not of MDPI and/or the editor(s). MDPI and/or the editor(s) disclaim responsibility for any injury to people or property resulting from any ideas, methods, instructions or products referred to in the content. |
© 2025 by the authors. Licensee MDPI, Basel, Switzerland. This article is an open access article distributed under the terms and conditions of the Creative Commons Attribution (CC BY) license (http://creativecommons.org/licenses/by/4.0/).
Copyright: This open access article is published under a Creative Commons CC BY 4.0 license, which permit the free download, distribution, and reuse, provided that the author and preprint are cited in any reuse.


