Submitted:
10 January 2025
Posted:
10 January 2025
You are already at the latest version
Abstract
The reliable operation of photovoltaic (PV) systems is essential for sustainable energy production, yet their efficiency is often compromised by defects such as bird droppings, cracks, and dust accumulation. Automated defect detection is critical for addressing these challenges in large-scale solar farms, where manual inspections are impractical. This study evaluates three YOLO object detection models—YOLOv5, YOLOv8, and YOLOv11—on a comprehensive dataset to identify solar panel defects. YOLOv5 achieved the fastest inference time (7.1ms per image) and high precision (94.1%) for cracked panels. YOLOv8 excelled in recall for rare defects, such as bird drops (79.2%), while YOLOv11 delivered the highest mAP@0.5 (93.4%), demonstrating balanced performance across defect categories. Despite strong performance for common defects like dusty panels (mAP@0.5 > 98%), bird drop detection posed challenges due to dataset imbalances. These results highlight the trade-offs between accuracy and computational efficiency, providing actionable insights for deploying automated defect detection systems to enhance PV system reliability and scalability.
Keywords:
Automated Inspection
; Computational Efficiency
; Convolutional Neural Networks
; Deep Learning
; Object Detection
; Photovoltaics
; Solar Panel Defect Detection
; YOLO Models
; YOLO Object Detection
1. Introduction
The rapid adoption of photovoltaic (PV) systems as a sustainable energy solution has made their maintenance a critical component of ensuring consistent and efficient energy output [1]. Solar panels, being exposed to diverse environmental conditions, are susceptible to a variety of defects, such as bird droppings, cracks [2], and dust accumulation [3]. These defects can significantly reduce energy generation efficiency and, if left unaddressed, lead to long-term damage and increased operational costs [4]. While manual inspection has traditionally been used to identify these defects, it is often impractical for large-scale solar farms due to its labor-intensive and time-consuming nature. This has created a pressing need for automated and scalable defect detection systems [5].
Recent advancements in computer vision (CV) [6] and deep learning (DL) [7] have facilitated the development of object detection models that can identify and localize defects with high accuracy [8]. These Artificial Intelligence (AI) driven approaches offer several advantages over traditional inspection methods, including higher accuracy, consistency, and the ability to process large volumes of data quickly. Among the various DL models, the You Only Look Once (YOLO) [9] family of algorithms has shown remarkable potential in this domain [10]. YOLO models are particularly well-suited for real-time object detection tasks, making them ideal for applications such as drone-based inspections of large solar farms [11].
This study aims to evaluate the performance of three YOLO models—YOLOv5, YOLOv8, and YOLOv11—for detecting solar panel defects under realistic conditions. By focusing on diverse defect types and leveraging detailed performance metrics such as precision, recall, mean Average Precision (mAP), and inference time, the study seeks to understand the strengths and limitations of these models. Additionally, the evaluation considers the trade-offs between accuracy and computational efficiency, providing insights into the feasibility of deploying YOLO models for automated solar panel inspections.
By addressing these challenges, this research contributes to advancing defect detection methodologies for PV systems, with the ultimate goal of improving their reliability, operational efficiency, and scalability. Accurate and efficient defect detection not only supports cost-effective maintenance but also ensures the long-term sustainability of solar energy systems.
2. Contribution and Paper Organization
This study makes significant contributions to the field of automated solar panel defect detection by presenting a comprehensive evaluation of three state-of-the-art YOLO models—YOLOv5, YOLOv8, and YOLOv11, all developed by Ultralytics. These models were chosen for evaluation because the Ultralytics platform provides seamless access to their implementation, making them readily available for comparative analysis [12]. The research addresses the critical challenge of detecting diverse defects such as bird drops, cracks, and dust accumulation under realistic conditions. By systematically analyzing the performance of these models across key metrics, including precision, recall, mAP, and computational efficiency, this work provides valuable insights into their strengths, limitations, and applicability in real-world scenarios. The study not only highlights the advancements in object detection technologies but also underscores the potential of YOLO-based models to enhance PV system maintenance and reliability.
The remainder of this paper is organized as follows. Section 3 presents a literature review of YOLO models applied to solar panel PV defect detection, highlighting recent advancements and applications in the domain. Section 4 provides a background on the YOLO object detection algorithm, tracing its evolution from its inception to its latest iterations and discussing their respective strengths and advancements. Section 5 describes the dataset, preprocessing pipeline, and the evaluation metrics. Section 6 presents the results and analysis, covering performance metrics, class-specific evaluations, and computational efficiency comparisons. Section 7 outlines potential future directions, including dataset expansion, architectural optimizations, and real-time deployment strategies. Finally, Section 8 concludes the paper, summarizing the findings and emphasizing the contributions of this study to the field of automated solar panel defect detection.
3. Literature Review
To contextualize the contributions of this study, a review of existing literature is presented, focusing on advancements in PV defect detection and the application of YOLO-based methodologies within this domain.
N.Prajapati et al.[13] worked on identifying defects in PV modules via thermal picture analysis using a CNN learning algorithm-based YOLO model. Four distinct fault types lead to this algorithm’s implementation bypass diode fault, permanent hotspot fault, temporary hotspot fault, and cracks/wear and tear. They achieved an mAP of 83.86% and an average training loss of 0.0453%, making this model reliable for fault detection and identification of PV modules. This study has overlooked other types of defects and only covers faults that cause the panels to heat up and it also lacks enough sample photos of bypass diode failures, which makes it more challenging for the model to identify them precisely. No specific YOLO model was mentioned in the study. The model’s accuracy could improve significantly if the dataset had more examples of these faults.
Tahmid Tajwar et. al.[14] focused on using YOLOv3 and infrared thermography technique (IRT) for hotspot detection within PV modules. During the study, 3 detectors were used with 5,10, and 14 images respectively, to detect 1,2 and 3 hotspots. It led to the result that the detector with the best accuracy and the most hotspots detections is the one that was trained on the largest dataset.
Antonio Greco et. al.[15], proposed the criteria for a detection system that is ideal owing to its ease of configuration, high accuracy, and real-time processing. A DL framework, YOLOv3, for detecting PV panels was implemented in this study. The dataset, for this study, includes thermal camera footage of various PV plants captured by unmanned aerial vehicles (UAVs). Being a modified version, of the dataset cited in a previous study[16], this dataset includes 18 videos, 50,449 panels, and 4,939 hot spots. The YOLOv3-based approach proposed by the authors significantly improved precision, achieving 92%, compared to the 83% reported in a previous study [17]. On plants that were previously unseen, the model proved its adaptability, with a 91% accuracy rate. For plant-specific imagery, the model achieved an accuracy of 95%. This was the first instance of using PV panels using a DL-based methodology.
To enable real-time defect detection in PV modules, H. Wang et al. [18] present a cloud-edge collaborative approach that integrates the YOLOv3-tiny algorithm and ultra-fast detection through transfer learning. For improving the YOLO v3-tiny algorithm, a third prediction layer was introduced by merging shallow feature information with the stitching layer from the second detection scale, alongside the incorporation of a residual module. The effectiveness of the method was validated through testing, demonstrating that the improved YOLO v3-tiny achieved an average accuracy of 95.5% and recall rates of 93.7% for detecting defects in PV components. While utilizing only 64 MB of the model’s memory, the detection of a single panoramic image was completed in just 6.3 milliseconds (ms). Following the migration to cloud-edge learning, the training time for the local sample model increased by 66%, leading to an exceptional accuracy of 99.78%. Ultimately, this method demonstrated time-saving advantages and strong performance in accuracy. To further enhance the effectiveness of this approach, the incorporation of additional training data is recommended.
In this study, A.D. Tommaso et al.[19] proposed a mulit-stage model to detect defects in aerial images of PV panels. The model has three main parts: (i) a panel detector that identifies the area of PV panels, (ii) a defect detector that spots defects in the entire input image, and (iii) a false alarm filter that eliminates incorrect defect detections outside the PV panel areas.To demonstrate the effectiveness of model, authors investigated two PV plants in southern Italy, employing a pair of drones to systematically capture high-resolution aerial imagery for the detection of faults in the PV panels. The Sigma Ingegneria Efesto MKII drone, integrated with a DJI A2 flight controller (DJI, Shenzhen, China), a gimbal system, and a dual-camera setup, was deployed for fault detection. One camera captured thermal infrared (LWIR) and low-resolution visible spectrum (VIS-LR) images, while the second was used for high-resolution visible spectrum (VIS-HR) imagery. Infrared thermal imagery was used for hotspot detection. The results demonstrate a reduction in the operational and maintenance costs of PV systems, representing a significant advancement in PV panel monitoring. An accuracy of over 98% (AP@0.5) was achieved for PV panel detection across both plants. Additionally, for hotspot detection, AP@0.4 (AP@0.5) of roughly 88.3% (66.9%) was attained. Additional PV panel faults, such as soiling, delamination, bird droppings, and rain-induced water accumulation, were also assessed, yielding a mAP@0.5 of nearly 70% in the visible spectrum. An average mAP of 68.5% was achieved. However, the authors noted an overestimation tendency in the model for areas affected by soiling, underscoring the need for improved precision in defect localization. To enhance accuracy, the authors suggested upgrading drones in future models by integrating high-precision GNSS-RTK receivers in place of standard GPS technology.
The study by A. Gerd Imenes et al.[20] investigates whether thermal images alone or multiwavelength composite image processing enhances the detection and classification of faults in PV modules. YOLOv3 was selected as the detection algorithm due to its optimal balance between computational efficiency and high performance. We utilize convolutional neural networks to analyze thermal and visible color images, creating composite images by merging the two modalities. A mAP of 0.75 was achieved. Although the method effectively detected faults, it did not significantly improve the accurate classification of fault types. This approach had previously demonstrated effectiveness in various applications, including shadow detection[21].
J.-T. Zou et al.[22] employed a 5G-powered drone integrated with a thermal imaging camera, advanced AI algorithms and a combination of Python, OpenCV, and Darknet YOLOv4 to effectively identify defects in PV modules. A quadcopter drone flies over the solar panels for long range with the aid of 5G technology. The drone has a FLIR DUO PRO R thermal camera mounted on a stabilizing gimbal to capture real-time thermal images which are then sent to a ground station instantly by using AI. Of the 1,000 thermal images analyzed, 641 depicted solar cell defects, resulting in an mAP of 100% at an 89% confidence level. This approach demonstrated superior efficiency, cost-effectiveness, and reliability, ultimately enhancing the performance and productivity of solar power plants.
To overcome the challenges of precision and speed in Electroluminescence (EL) image detection for PV modules, Z. Meng et al.[23] proposed a fast object detection algorithm, YOLO-PV, based on the YOLOv4 framework. The framework is structured with a backbone, neck, and head, where the backbone is strategically optimized to extract low-level defect information, while SPAN is utilized in the neck for efficient feature fusion. This design improves processing speed by streamlining the data the model handles, without sacrificing accuracy. An average precision (AP) of 91.34% was achieved, with an inference speed exceeding 35 fps, demonstrating a 0.64% improvement over CSP-PV. Additionally, the processing time was reduced by 36.36% compared to the YOLOv4 algorithm. To enhance the model’s performance, three data augmentation techniques were employed: random rotation, the mosaic method, and random exposure adjustment. Resultantly, YOLO-PV achieved an accuracy of 94.55% in testing. However, the relationship between the defects identified in EL images and the actual performance of the PV modules is still unclear. Moreover, the development of algorithms for the quantitative analysis of EL defects has yet to be thoroughly explored. The accuracy and speed of defect detection in solar cells should be considered in future research. Additionally, the algorithm detection results should be leveraged to effectively quantify the performance of the solar cells.
L.Li et al.[24] noticed that PV defect detection leveraging CV ensures enhanced speed and precision, however, the identification of defects is impeded by their small size and the pronounced similarity between various defect types. To address these limitations, the authors enhanced the widely recognized YOLOv5 framework by incorporating Ghost Convolution with the BottleneckCSP and an additional prediction head. This approach was termed GBH-YOLOv5. The BottleneckCSP module was implemented to augment detection accuracy, incorporating a "prediction head" specifically designed to target and identify diminutive defects that are frequently overlooked. Ghost Convolution helped the system work faster and reduced its complexity, thereby optimizing overall performance. Extracted features are classified by a Feature Pyramid Network (FPN) and a Path Aggregation Network (PAN) structure. A new dataset named PV-Multi-Defect was used to test GBH-YOLOv5. The PV-Multi-Defect dataset comprises 1,108 images of PV panels with 4,235 defective targets spanning five defect types. Of these, 886 images were designated for training, while the remaining 222 images were utilized for the validation of the system. The model outperformed five other leading models by achieving an mAP of 97.8% ± 0.02. In comparison to the widely recognized Fast R-CNN[25], GBH-YOLOv5 demonstrated a substantial enhancement of 27.8% in mAP. The incorporation of additional modules into the model leads to an increase in both the number of parameters and the overall model size. To mitigate this complexity, the dataset is processed in grayscale. However, this simplification may potentially introduce certain inaccuracies in the detection process. Future research may concentrate on creating lightweight networks optimized for real-time performance. Additionally, another avenue for exploration is the direct application of RGB (color) images in PV panel defect detection.
F. Hong et al.[26] proposed a framework utilizing DL methods, YOLOv5, and Deep Residual Network (ResNet) for PV fault detection. Visible and infrared PV array images were taken under uniform conditions utilizing a dual infrared camera, strategically operated at low altitudes to ensure optimal image quality and effectiveness. The integration of visible images for segmenting the PV array components, alongside infrared images for fault detection, ensured the framework’s effective performance, even under varying lighting conditions. The study utilized a dataset from a solar power station in Hainan, China, comprising 3,000 images taken at various times of the day, which were divided into training (approximately 66%), testing (around 22%), and validation (roughly 11%) sets. The framework achieved an impressive accuracy of 95%, while the PV array segmentation speed was enhanced to 36 frames per second (FPS). This model outperformed VGG’s accuracy of 93% This framework is highly applicable in engineering because of its efficient defect detection and potential to reduce maintenance costs for PV power stations.
M.Zhang et al.[27] proposed an advanced solar cell defects detection method based on the YOLOv5 PV module. The improved algorithm is engineered to address challenges such as complex solar cell image background, variable defect morphology, and large-scale differences. Firstly, traditional convolutions in the model were substituted with deformable convolutions, enabling the model to process and understand image features more flexibly and accurately. Then, the model’s ability to extract features and detect targets of varying sizes is improved by introducing the ECA-Net attention mechanism and small defect prediction head respectively. Mosaic and MixUp techniques were employed to enhance the model’s efficiency and performance, while K-means++ was utilized for anchor box clustering, expediting convergence. Moreover, the loss function was replaced with CIOU to elevate prediction box accuracy. The improved model achieved an mAP of 89.64%, representing a 7.85% improvement over the original algorithm, with a processing speed of 36.24 FPS.
Q. Zheng[28] proposed a lightweight detection model, S-YOLOv5, based on YOLOv5 to achieve a balance between detection accuracy and processing speed.This model utilizes efficient adaptive scaling and normalization for detailed feature extraction in the backbone, along with the fusion of features in both the neck and prediction stages. An aerial image dataset is constructed from infrared images captured at various resolutions using a UAV-mounted thermal camera. Subsequently, adaptive scaling is applied to prepare the input image for processing within the network. S-YOLOv5 achieved a remarkable mAP of 98.1% with a detection speed of 49 FPS, surpassing other models in speed, efficiency, and lightweight design.
X. Zhang et al.[29] proposed a UAV-based inspection and classification system leveraging advanced AI image recognition technology. Thermal images, acquired using a DJI M300RTK UAV equipped with a DJI H20T thermal camera, were used for defect detection in PV panels. Thermal images collected by UAV are then identified using AI automatic identification technology based on the YOLOV5 algorithm. The model achieved a mAP of 80.88% at a confidence threshold of 0.5 using a data set of 10,772 IR images from eight photovoltaic plants.
To address the challenges of insufficient accuracy, limited defect categories, and ineffective localization of defect targets in photovoltaic panels, Liu et al. [30] introduced an enhanced defect detection method based on YOLOv7. The authors replaced the original activation function used during initial image processing with FReLU, significantly improving the performance of the downsampling module. Additionally, PwConv was introduced to improve the ELAN module, which contributed to greater detection accuracy. To further enhance reliability, a Seam attention mechanism was integrated between the model’s backbone and neck, enabling the model to focus on defects even in the presence of complex and distracting backgrounds. These modifications resulted in a 2.4% increase in the mAP of the original YOLOv7 model, achieving an overall mAP of 97.7%.
A study by Q. B. Phan et al.[31] investigated fault detection in PV cells utilizing YOLOv8, with Particle Swarm Optimization (PSO)[32,33]. This model was employed to improve batch size, anchor box size, learning rate and detection accuracy. Two case studies using training sets of 70% and 80% respectively, were conducted. The dataset used in the study had 2,624 images of solar panel cells that were labelled and adjusted for consistency. By leveraging the capabilities of YOLOv8 and Particle Swarm Optimization (PSO), an mAP of 94% was achieved.
P. Malik et al.[34] conducted a comprehensive study for evaluating and comparing the effectiveness of various YOLO models, ranging from YOLOv5 to YOLOv9, for detecting faults in thermal images of solar panels. The authors trained these YOLO models, including their GELAN variant, for 300 epochs with batch sizes of 8 and 16. The test results revealed that YOLOv8, YOLOv9, and GELAN demonstrated significant efficacy in detecting faults in solar panel images. Impressively, the GELANc model achieved an mAP of 70.4%, surpassing YOLOv9c’s 64.5%, thereby exhibiting superior accuracy and efficiency relative to the other models.
To mitigate the challenges of missed detections and false alarms, W. Pan et al.[35] introduced the Adaptive Complementary Fusion (ACF) module, designed to integrate spatial and channel information adaptively. Incorporating the ACF module into YOLOv5 resulted in developing the enhanced YOLO-ACF model. The experimental evaluation, conducted on a dataset of 4,500 EL images of PV panels, demonstrated that the YOLO-ACF method achieved notable enhancements of 5.2, 0.8, and 2.3 percentage points in recall (R), mAP50, and mAP50-95, respectively, when compared to the performance of YOLOv8[36]. YOLO-ACF outperformed YOLOv5[36], which was previously regarded as the lightest and fastest model, by reducing weight by 12.4%, parameters by 12.9%, and time consumption by 4.2%, while achieving a 5% increase in FPS, thereby significantly enhancing both efficiency and overall performance. YOLO-ACF, being a highly efficient and robust tool for detecting defects in solar panels, is an invaluable asset for manufacturers, offering enhanced accuracy, reduced model size, and faster processing speeds.
MZ. Ab. Hamid et al. [37] employed the YOLOv9 algorithm, enhanced through the integration of image processing techniques, to achieve effective hotspot detection in solar PV panels. This study utilized a dataset comprising 1,558 thermal images from a solar PV farm in Pasir Mas, Kelantan, Malaysia. An Anafi Thermal Drone equipped with a FLIR Lepton 3.5 microbolometer, operating at heights between 15 and 30 meters, was used to capture the images. Upon completing 100 training epochs, the model achieved recall values exceeding 97%, alongside precision and mAP values surpassing 96%. These results underscore the model’s exceptional performance, demonstrating its effectiveness and reliability in object detection tasks.
S.E. Droguett et al. [38] conducted a study on solar panel detection in satellite images, beginning with the Faster Mask-CNN architecture [39] before transitioning to YOLO models. The study tested several iterations of YOLOv9 [40], including YOLOv9c and YOLOv9e, alongside the newer YOLOv10 [41] variants, specifically YOLOv10x and YOLOv10l. The dataset comprised 3,480 images, with 2,745 featuring ground backgrounds and 735 showing rooftop backgrounds, sourced from solar PV samples captured through satellite and aerial photography in Beijing, China [42]. YOLO models used 3,360 images for training, 90 for validation, and 30 for testing. For comparison, the Mask-CNN baseline model utilized 3,415 images for training and 65 for testing. The YOLOv9e model achieved an F1 score of 86% and an mAP of 74% at an IoU range of 0.5 to 0.95, outperforming YOLOv9c. Compared to YOLOv8x [43], YOLOv9e demonstrated a 15% reduction in parameters, a 25% decrease in computational requirements, and a 1.7% improvement in AP [44]. The YOLOv10x and YOLOv10l models were trained for 26 and 20 epochs, respectively. YOLOv10x achieved an mAP of 73% at an IoU range of 0.5 to 0.95, with an F1 score of 84%, precision of 88%, and recall of 82%. While YOLOv9e exhibited impressive performance, the YOLOv10 variants surpassed it in several metrics, demonstrating their superiority. The authors suggested future research could explore alternative methods, such as the Single Shot MultiBox Detector (SSD) [45] and RetinaNet [40], which could offer additional advantages in solar panel detection tasks.
Table 1. underscores the diverse methodologies and architectural innovations employed in utilizing YOLO models for PV defect detection, reflecting their extensive adoption in this domain. The integration of drones, thermal imaging, and data augmentation techniques with YOLO variants enhances PV fault detection, showcasing their advanced capability to overcome complex issues in the field. Among the various models, YOLOv4 and YOLOv5 distinguish themselves with consistently high detection accuracies of nearly 99% in certain scenarios, cementing their prominence in the field. Furthermore, the recently introduced YOLOv10 model demonstrates advancements surpassing the performance of YOLOv5 in certain metrics. The consistently high accuracy of these models across diverse applications enhances the reliability of PV systems. It shows their promising potential for broader implementation in CV and object detection tasks.
4. Yolo Background
The YOLO object detection algorithm, introduced by Joseph Redmon et al. in 2015 [46], transformed real-time object detection by merging region proposal and classification into a single neural network, drastically reducing computation time. Its unified architecture segments the image into a grid, allowing for direct predictions of bounding boxes and class probabilities for each cell, facilitating end-to-end learning. YOLO’s real-time detection capabilities have had a profound impact across various domains, including agriculture [47], medical object detection [48], autonomous vehicles [49], security and surveillance systems [50], and industrial manufacturing [51], where both accuracy and speed are critical. The algorithm has evolved significantly, with the latest iteration being YOLOv10, showcasing improved performance in terms of FPS and mAP across successive versions up to YOLO11. The timeline in Figure 1 illustrates the evolution of YOLO, tracing its development from the initial release to the most recent version, YOLO11.
Since the introduction of the initial YOLO model, YOLOv2 (also known as YOLO9000) [52,53] marked a significant leap forward by increasing operational resolution and enabling the detection of over 9000 object categories, thereby improving both versatility and accuracy. YOLOv3 further enhanced these advancements through the inclusion of multi-scale predictions and a deeper network design, which facilitated improved detection of smaller objects [54]. The evolution of the series continued with YOLOv4 and YOLOv5, each introducing innovative techniques to boost detection performance in terms of both precision and speed [55,56]. YOLOv4 introduced features like Cross-Stage Partial (CSP) connections and Mosaic data augmentation, while YOLOv5, developed by Ultralytics, offered notable improvements in usability and efficiency, earning widespread popularity in the CV domain. Subsequent iterations, from YOLOv6 to YOLO11, have focused on refining scalability, reducing computational requirements, and enhancing real-time performance. Each version has set new standards for object detection and significantly influenced applications ranging from autonomous vehicles and traffic systems to healthcare and industrial automation [57].
The evolution of the YOLO has brought significant advancements in object detection performance and efficiency. YOLOv1 marked the inception of the series with an mAP of 63.4%, though it encountered challenges with higher latency [46]. Subsequent iterations, YOLOv2 and YOLOv3, enhanced detection accuracy, achieving mAPs of 76.8% and 57.9%, respectively, at the expense of increased latency [53,54]. YOLOv4 further extended these improvements with an mAP of 43.5%, setting the stage for more sophisticated variants [56].
YOLOv5 gained popularity due to its balance of performance and efficiency, achieving an mAP of 50.7% and a latency of 140 ms [58]. The YOLOv6 series, spanning models from YOLOv6-N to YOLOv6-L, demonstrated mAPs ranging between 37.0% and 51.8%, with moderate latency, reflecting a focus on optimizing detection speed alongside accuracy [59]. YOLOv7, including YOLOv7-tiny and standard versions, achieved mAPs of 56.4% and 51.2%, albeit with higher latency, showing a shift in emphasis towards improved accuracy [60].
YOLOv8 exhibited impressive results with mAP scores between 37.3% and 53.9% and latency figures from 6.16 ms to 16.86 ms. Despite these achievements, YOLOv8 fell slightly behind in efficiency and accuracy compared to its successors [61]. The YOLOv9 series introduced models such as YOLOv9-N, YOLOv9-S, YOLOv9-M, YOLOv9-C, and YOLOv9-X, with mAP scores from 39.5% to 54.4% [40]. While achieving top mAPs similar to YOLOv10, the YOLOv9 series displayed higher latency, particularly in YOLOv9-X, highlighting YOLOv10’s enhanced efficiency. YOLOv10 presented a comprehensive range of variants, including YOLOv10-N, YOLOv10-S, YOLOv10-M, YOLOv10-B, YOLOv10-L, and YOLOv10-X, with precision scores from 38.5% to 54.4% on the MS-COCO dataset [41].
YOLO11, the latest advancement in the series (Glenn Jocher 2024), builds on previous successes with innovative enhancements designed to improve performance across diverse CV tasks. This model introduces an optimized architecture that enhances feature extraction capabilities, enabling detailed image analysis [62]. YOLO11 supports applications such as real-time object detection, instance segmentation, and pose estimation, making it suitable for industries like agriculture and surveillance [63]. Advanced training methodologies have contributed to improved performance on benchmark datasets, with YOLO11m achieving an mAP of 95.0% on the COCO dataset while utilizing 22% fewer parameters compared to YOLOv8m. Additionally, YOLO11 boasts an average inference speed 2% faster than YOLOv10, ensuring it meets the demands of real-time applications. These advancements position YOLO11 as a highly efficient and accurate tool for AI-driven image analysis.
5. Methodology
5.1. Dataset
This study used the Solar Panel dataset [64], sourced from the Roboflow Universe [65], an open-source CV community. This dataset comprises 6,493 images annotated with four distinct classes: "bird_drop," "cracked," "dusty," and "panel." The "panel" class represents non-defective panels, establishing a baseline for normal conditions, while the other three classes correspond to common anomalies observed in solar panels: bird droppings, cracks, and dust accumulation. These classes are visually represented in Figure 2, where each condition is highlighted using bounding boxes and distinct colors to facilitate clear differentiation. The dataset ensures a diverse and representative sample of real-world solar panel conditions, including various backgrounds and panel types, which are essential for training a generalized and effective model.
The dataset was split into training (70%), validation (20%), and testing (10%) sets, as shown in Table 2. This distribution exposes the model to a balanced representation of each class, facilitating effective training. However, it is important to note that in real-world applications, the distribution of these classes may vary significantly, which could present additional challenges for accurate detection and classification.
Manual annotation was not required as an open-source dataset, streamlining the process. This dataset served as a robust foundation for training and evaluating various YOLO models—YOLOv5, YOLOv8, and YOLOv11—to compare their performance in detecting and classifying solar panel defects.
5.2. Model Training
Three state-of-the-art object detection models were evaluated for this study: YOLOv5, YOLOv8, and YOLOv11. YOLOv5 [58] is a single-stage object detection model designed to balance accuracy and speed, making it widely popular for real-time applications. It incorporates innovative architectural designs like CSPDarknet53 as its backbone and focuses on feature pyramid networks to enhance multi-scale object detection [66]. YOLOv8 [67], also a single-stage object detection model developed in PyTorch, employs a fully convolutional network tailored to predict bounding boxes and class probabilities of objects with exceptional speed and accuracy in real-time scenarios. YOLOv11 [62] represents the latest advancement in the YOLO series algorithms. This version enhances feature extraction through a more sophisticated backbone and neck architecture while achieving superior efficiency and precision via optimized designs and training pipelines, balancing both accuracy and computational cost [63].
The model training was conducted on a high-performance workstation with a 20-core processor (1.32 GHz base clock speed). This configuration provided sufficient processing power for the computationally intensive training process. NVIDIA GeForce RTX 3060 GPUs (Ampere architecture) was utilized to accelerate complex image processing and machine learning tasks. These GPUs feature 3584 CUDA cores, a boost clock of 1.78 GHz, and a 12 GB of GDDR6 memory with 192-bit memory interface. During training, the models underwent several iterations aimed at optimizing their ability to detect objects across various class categories. The training phase utilized pre-trained weights (v5mu, v8m, and v11m) to expedite convergence and improve detection accuracy. These mid-sized models were selected as a compromise between computational demands and learning capacity; larger models were deemed computationally prohibitive for the target domain, while smaller models were considered insufficient for effective learning.
All models were trained using a standardized configuration, to ensure consistency and comparability across experiments. The hyperparameter settings presented in Table 3 detail the framework employed for optimizing YOLO model training in this study. The training was conducted for 100 epochs, providing sufficient iterations for the models to effectively learn and adapt to the dataset’s complexities. A batch size of 17 was chosen to strike an optimal balance between memory efficiency and computational speed. Input images were resized to a fixed resolution of 640x640 pixels to standardize the data fed into all models. The initial and final learning rates were both set to 0.01, ensuring controlled adjustments in the learning process throughout training. Momentum was configured at 0.937 to stabilize parameter updates, while a weight decay of 0.0005 was applied to mitigate overfitting. The training process included a warmup phase lasting three epochs, allowing gradual stabilization of the learning parameters. Specific loss function components were adjusted to balance their contributions: box loss gain was set to 7.5, class loss gain to 0.5, and definition loss gain to 1.5, ensuring appropriate emphasis on different aspects of the learning objectives.
5.3. Evaluation Metrics
The performance of the three object detection models on the annotated dataset was evaluated using standard metrics, including precision, recall, and mAP at various Intersection over Union (IoU) thresholds. These metrics are foundational for quantifying how well the models predict bounding boxes relative to ground truth annotations, offering insights into their detection accuracy, sensitivity, and consistency.
Precision evaluates the fraction of correctly identified positive detections out of all detections made by the model [68]. It highlights the model’s ability to minimize false positives, as expressed in Equation 1:
True positives occur when the model accurately detects and classifies objects consistent with the annotations. Conversely, false positives are instances where the model incorrectly identifies non-existent objects. High precision indicates a reduction in false positive errors, emphasizing the accuracy of the detections.
Recall measures the model’s ability to identify all relevant objects within the dataset, focusing on minimizing false negatives [69]. It is calculated as shown in Equation 2:
False negatives occur when the model fails to detect objects present in the ground truth annotations. A higher recall score reflects the model’s sensitivity to capturing all true positives, ensuring comprehensive object identification.
The F1-score, a harmonic mean of precision and recall, is also critical for assessing the balance between these metrics [70]. It is particularly useful when the dataset contains imbalanced classes or when both false positives and false negatives need to be equally minimized. The F1-confidence curves visualize the relationship between F1-scores and detection confidence thresholds, providing a nuanced understanding of the models’ performance across varying confidence levels.
The mean Average Precision (mAP) provides an aggregate metric for evaluating object detection performance across multiple classes and IoU thresholds [71]. Derived by calculating the AP for each class and averaging these values, mAP captures the balance between precision and recall over different confidence thresholds. Mathematically, mAP is expressed in Equation 3:
where N represents the number of object classes. A higher mAP score signifies better overall detection accuracy, showcasing the model’s ability to handle diverse object classes effectively [68].
In addition to accuracy-focused metrics, computational efficiency metrics, including preprocessing time, inference time, and postprocessing time, were analyzed. Preprocessing time accounts for tasks such as image resizing, normalization, and augmentation [72]. Inference time measures the duration for the model to process new data and generate predictions, and is a key determinant of real-time application feasibility [73]. Postprocessing time reflects the model’s speed in refining detections, such as applying non-maximum suppression (NMS) to remove redundant bounding boxes [74].
Efficient models demonstrate minimal delays in all stages of the pipeline, balancing computational complexity with detection accuracy. Factors influencing inference time include the model architecture, parameter count, hardware specifications, and optimization techniques [75]. For real-world solar panel defect detection, low latency is critical for ensuring timely and accurate maintenance interventions, especially in large-scale installations.
These metrics collectively provide a holistic view of model performance, emphasizing both detection accuracy and computational efficiency. The ability to achieve high precision, recall, and mAP while maintaining low inference times underlines the suitability of these models for real-world applications, such as automated solar panel inspections. By enabling rapid and reliable defect detection, these models contribute to improved maintenance workflows, enhanced energy production efficiency, and the advancement of scalable solutions in renewable energy management.
6. Results and Discussion
The comparative analysis of YOLOv5, YOLOv8, and YOLOv11 for solar panel defect detection reveals comprehensive insights into the performance, accuracy, and computational efficiency of these state-of-the-art object detection models. Table 4 provides a consolidated overview of the evaluation metrics, encompassing precision, recall, and mAP across different solar panel conditions, including bird drops, cracks, dust accumulation, and normal panel states.
The subsequent sections will systematically deconstruct these metrics, offering an in-depth exploration of each model’s capabilities and limitations. By examining detection accuracy, consistency, and computational efficiency, this research aims to provide a nuanced understanding of how these YOLO versions perform in the critical domain of solar panel inspection and maintenance.
6.1. Detection Accuracy Assessment: Precision, Recall, and F1-Confidence Analysis
The precision and recall metrics provide crucial insights into the detection performance of the YOLO models. YOLOv5 demonstrated high overall precision (88.4%) and recall (88.3%), indicating balanced detection capabilities with minimal false positives and false negatives. YOLOv8 showed a slight improvement in recall (89.9%) but a marginal decrease in precision (86.9%), suggesting a focus on detecting more instances at the expense of increased false positives. YOLOv11 achieved a middle ground with 87.6% precision and 89% recall, balancing accuracy and coverage effectively.
Class-specific performance varied across the models. All three excelled in detecting normal panels and dusty defects, with precision and recall exceeding 95% for these classes. However, detecting bird drops posed challenges due to limited dataset instances. YOLOv8 achieved the highest recall for bird drops (79.2%), favoring sensitivity, while YOLOv5 achieved the highest precision (64%), indicating cautious detection. YOLOv11 struck a balance with improved precision (82.5%) and recall (79.0%).
The F1-confidence curves (Figure 3) further illustrate the models’ comparative performance across confidence thresholds. YOLOv11 achieved the highest F1 score of 0.88 at a confidence threshold of 0.678, reflecting its ability to balance precision and recall effectively. YOLOv8 and YOLOv5 achieved identical F1 scores of 0.88 at confidence thresholds of 0.524 and 0.560, respectively. All models maintained consistent F1 scores across a broad confidence range, indicating robustness in defect detection under varying confidence levels.
Cracked panel detection was strong across models, with YOLOv5 achieving the highest precision (94.1%) and YOLOv8 the highest recall (87.9%). YOLOv11 performed consistently, highlighting its robustness in maintaining balanced accuracy and sensitivity across diverse defect types.
6.2. Detection Consistency Evaluation: mAP at IoU 0.50 and Precision-Recall Analysis
The mAP at an Intersection over Union (IoU) threshold of 0.50 provides a comprehensive measure of detection consistency across all classes. YOLOv11 demonstrated the highest overall mAP@0.5 of 93.4%, followed closely by YOLOv8 at 92.3% and YOLOv5 at 91.5%. This indicates that YOLOv11 offers the most consistent performance across all classes, suggesting improved feature extraction and localization capabilities.
Class-specific mAP@0.5 scores indicated exceptional performance for dusty and normal panels, with scores exceeding 98%. Cracked panels also exhibited high consistency across models, with mAP@0.5 ranging from 94.0% to 94.7%.
Bird drop detection remained challenging. YOLOv11 achieved the highest mAP@0.5 of 82.5%, outperforming YOLOv8 (77.3%) and YOLOv5 (73.5%). The precision-recall (PR) curves (Figure 4) illustrate this trend, with YOLOv11 demonstrating higher precision and recall across most confidence thresholds for this defect. Dusty defects and normal panels consistently maintained precision values above 98%, reinforcing their distinct and recognizable features.
6.3. Computational Efficiency Analysis: Image Processing Speed
Computational efficiency is a critical factor in real-world applications, especially for large-scale solar panel inspections. YOLOv5 demonstrated the fastest processing speed, with an inference time of 7.1ms per image, followed closely by YOLOv11 at 7.7ms per image. YOLOv8, despite its competitive accuracy, showed a significantly longer inference time of 15.9ms per image.
YOLOv5’s efficiency can be attributed to its streamlined architecture, balancing performance and speed. With 25,047,532 parameters and 64.0 GFLOPs, it achieves a good trade-off between model complexity and processing speed. YOLOv11, while slightly slower than YOLOv5, manages to maintain high efficiency with 20,033,116 parameters and 67.7 GFLOPs, suggesting architectural improvements that enhance performance without significantly impacting speed. YOLOv8, with 25,842,076 parameters and 78.7 GFLOPs, shows the highest computational demand among the three models. Its longer inference time indicates that the improvements in detection accuracy come at the cost of increased computational complexity. This trade-off may be acceptable in scenarios where processing time is not a critical factor, but could limit its applicability in real-time or large-scale inspection systems.
The preprocessing and postprocessing times for all models were relatively consistent, ranging from 0.3ms to 0.4ms for preprocessing and 0.6ms to 1.0ms for postprocessing. These times contribute minimally to the overall processing time, with the inference stage being the primary determinant of computational efficiency.
6.4. Error Patterns and Classification Performance: Confusion Matrix Analysis
The confusion matrices (Figure 5) provide detailed insights into classification performance and error patterns for YOLOv5, YOLOv8, and YOLOv11. Diagonal elements represent true positive rates, while off-diagonal elements indicate misclassifications.
YOLOv11 exhibited robust performance with high true positive rates for dusty defects (94%), panel detection (96%), and cracked panels (92%). Bird drop detection achieved a true positive rate of 79%, reflecting the challenges of this defect class. YOLOv8 demonstrated strong and consistent performance, with true positive rates of 97% for dusty defects, 95% for panels, and 93% for cracked defects. Its bird drop detection rate (83%) surpassed that of YOLOv11 and YOLOv5, showcasing improved sensitivity.
YOLOv5 maintained competitive performance with a perfect true positive rate for dusty defects (100%) and high rates for panel detection (96%) and cracked panels (93%). However, its bird drop detection rate (79%) matched YOLOv11, highlighting a shared challenge.
Across all models, the most common misclassification was between bird drops and the background class, attributed to the limited number of bird drop instances in the dataset. While YOLOv8 showed superior performance in this category, YOLOv5 excelled in detecting dusty defects with perfect accuracy. YOLOv11 balanced both metrics, emphasizing its reliability for diverse defect categories.
7. Future Directions
While this study highlights the promising potential of YOLO-based models for solar panel defect detection, there remain several areas where advancements could further enhance their performance and applicability. These future directions aim to address identified challenges, optimize computational efficiency, and expand the models’ usability in real-world scenarios. The following key areas outline potential improvements and applications.
- Dataset Expansion and Diversity:Expanding the dataset to address the underrepresentation of rare defect types, such as bird drops, is crucial for improving model robustness. Additionally, incorporating images captured under diverse environmental conditions, such as varying lighting, weather, and panel orientations, could enhance the adaptability of the models to real-world scenarios. Synthetic data augmentation techniques, such as those based on GANs or other advanced generative models, could help mitigate data imbalances by simulating rare or difficult-to-capture defects.
- Architectural Optimizations: Advancements in model architecture could significantly improve computational efficiency and detection accuracy. Lightweight model designs, achieved through techniques such as pruning, quantization, or knowledge distillation, would reduce computational complexity, enabling deployment on resource-constrained devices. Incorporating attention mechanisms like SE blocks or transformer-based enhancements could improve the models’ ability to detect subtle or complex defects. Additionally, hybrid approaches that combine YOLO’s strengths with anchor-free methods or segmentation frameworks may provide better precision and localization accuracy.
- Integration with Multi-Sensor Systems: Multi-sensor integration offers an avenue for improving defect detection performance. Combining visible light images with thermal or infrared imagery can help identify defects, such as hotspots or micro-cracks, that are not evident in standard RGB imagery. Similarly, leveraging depth information from RGB-D sensors or stereo imaging could aid in capturing three-dimensional structural details of solar panels, further enhancing detection capabilities.
- Real-Time Deployment and Automation: Real-time deployment of YOLO-based models in automated inspection systems holds immense potential for improving maintenance workflows. For instance, integrating these models into drone-based platforms can facilitate large-scale, autonomous solar panel inspections. Furthermore, optimizing models for edge devices, such as IoT systems or embedded processors, could enable localized data processing, reducing reliance on centralized servers and improving operational efficiency. Developing intelligent feedback mechanisms to provide actionable insights, such as severity ratings or repair recommendations, would further enhance their utility in real-world applications.
- Cross-Domain Applications: The methodologies and insights from this study can be extended to other domains [51]. In industrial defect detection, YOLO-based models could be adapted for tasks such as quality control and structural health monitoring. In agriculture, they could be employed for precision farming tasks, including pest detection and crop health assessment [47]. Additionally, integrating these models into smart grid systems could optimize predictive maintenance and improve energy efficiency across renewable energy infrastructure [76].
By addressing these future directions, the scope of YOLO-based solar panel defect detection can be significantly broadened, paving the way for innovations that advance sustainable, efficient, and scalable solutions across various domains.
8. Conclusion
This study provided an in-depth evaluation of three state-of-the-art YOLO object detection models—YOLOv5, YOLOv8, and YOLOv11—for detecting defects in solar panels. The analysis was conducted using a comprehensive dataset that included key defect classes such as bird drops, cracks, and dust accumulation, alongside normal panels. The models were assessed based on multiple performance metrics, including precision, recall, mAP, and computational efficiency, to determine their suitability for real-world PV system monitoring.
YOLOv5 emerged as the most computationally efficient model, with an inference time of just 7.1ms per image, making it ideal for real-time defect detection scenarios. It also demonstrated excellent precision in detecting common defect types like dusty panels and cracks, minimizing false positive errors. On the other hand, YOLOv8 excelled in recall, particularly for rare defect classes such as bird drops, highlighting its sensitivity in identifying challenging anomalies. However, its higher computational demands and inference time (15.9ms per image) may limit its applicability in scenarios where speed is critical.
YOLOv11 offered the most balanced performance, achieving the highest overall mAP@0.5 (93.4%) across all defect classes. It demonstrated robust detection capabilities for both common and rare defects, with competitive precision and recall metrics. Additionally, its inference time of 7.7ms per image provided a favorable trade-off between accuracy and processing speed, making it a versatile choice for both real-time and large-scale inspection tasks.
Class-specific performance analysis revealed consistent strengths and weaknesses across the models. All three models excelled in detecting dusty panels and normal conditions, achieving mAP@0.5 scores above 98%, underscoring their reliability in identifying clear and distinct defect patterns. However, bird drop detection remained a significant challenge due to the limited representation of this defect type in the dataset. Cracked panel detection showcased complementary strengths across the models, with YOLOv5 achieving the highest precision (94.1%) and YOLOv8 demonstrating superior recall (87.9%), illustrating their respective potential to minimize false positives and false negatives.
Overall, this study highlights the adaptability and efficiency of YOLO-based models in advancing solar panel defect detection. By leveraging their strengths and addressing identified limitations, these models can play a pivotal role in enhancing PV system maintenance workflows, ensuring optimal energy production and contributing to the broader adoption of renewable energy technologies.
References
- Hernández-Callejo, L.; Gallardo-Saavedra, S.; Alonso-Gómez, V. A review of photovoltaic systems: Design, operation and maintenance. Solar Energy 2019, 188, 426–440. [Google Scholar] [CrossRef]
- Alnasser, T.M.; Mahdy, A.M.; Abass, K.I.; Chaichan, M.T.; Kazem, H.A. Impact of dust ingredient on photovoltaic performance: An experimental study. Solar Energy 2020, 195, 651–659. [Google Scholar] [CrossRef]
- Zereg, K.; Gama, A.; Aksas, M.; Rathore, N.; Yettou, F.; Panwar, N.L. Dust impact on concentrated solar power: A review. Environmental Engineering Research 2022, 27. [Google Scholar] [CrossRef]
- Gupta, V.; Sharma, M.; Pachauri, R.K.; Babu, K.D. Comprehensive review on effect of dust on solar photovoltaic system and mitigation techniques. Solar Energy 2019, 191, 596–622. [Google Scholar] [CrossRef]
- Hijjawi, U.; Lakshminarayana, S.; Xu, T.; Fierro, G.P.M.; Rahman, M. A review of automated solar photovoltaic defect detection systems: Approaches, challenges, and future orientations. Solar Energy 2023, 266, 112186. [Google Scholar] [CrossRef]
- Szeliski, R. Computer vision: algorithms and applications; Springer Nature, 2022.
- LeCun, Y.; Bengio, Y.; Hinton, G. Deep learning. nature 2015, 521, 436–444. [Google Scholar] [CrossRef]
- Wu, X.; Sahoo, D.; Hoi, S.C. Recent advances in deep learning for object detection. Neurocomputing 2020, 396, 39–64. [Google Scholar] [CrossRef]
- Ultralytics Detection Tasks Documentation. https://docs.ultralytics.com/tasks/detect/. Accessed: 2024-12-31.
- Hussain, M.; Khanam, R. In-depth review of yolov1 to yolov10 variants for enhanced photovoltaic defect detection. In Proceedings of the Solar. MDPI, Vol. 4; 2024; pp. 351–386. [Google Scholar]
- Wang, Z.; Zheng, P.; Bahadir Kocer, B.; Kovac, M. Drone-Based Solar Cell Inspection With Autonomous Deep Learning. Infrastructure Robotics: Methodologies, Robotic Systems and Applications 2024, pp. 337–365.
- Ultralytics. Ultralytics Official Website. https://www.ultralytics.com/, 2025. Accessed: 2025-01-01.
- Prajapati, N.; Aiyar, R.; Raj, A.; Paraye, M. Detection and Identification of faults in a PV Module using CNN based Algorithm. In Proceedings of the 2022 3rd International Conference for Emerging Technology (INCET). IEEE; 2022; pp. 1–5. [Google Scholar]
- Tajwar, T.; Mobin, O.H.; Khan, F.R.; Hossain, S.F.; Islam, M.; Rahman, M.M. Infrared thermography based hotspot detection of photovoltaic module using YOLO. In Proceedings of the 2021 IEEE 12th Energy Conversion Congress &, 2021, Exposition-Asia (ECCE-Asia). IEEE; pp. 1542–1547.
- Greco, A.; Pironti, C.; Saggese, A.; Vento, M.; Vigilante, V. A.; Pironti, C.; Saggese, A.; Vento, M.; Vigilante, V. A deep learning based approach for detecting panels in photovoltaic plants. In Proceedings of the Proceedings of the 3rd International Conference on Applications of Intelligent Systems, 2020, pp.; Vento, M.
- Shinde, S.; Kothari, A.; Gupta, V. YOLO based human action recognition and localization. Procedia computer science 2018, 133, 831–838. [Google Scholar] [CrossRef]
- Carletti, V.; Greco, A.; Saggese, A.; Vento, M. An intelligent flying system for automatic detection of faults in photovoltaic plants. Journal of Ambient Intelligence and Humanized Computing 2020, 11, 2027–2040. [Google Scholar] [CrossRef]
- Wang, H.; Li, F.; Mo, W.; Tao, P.; Shen, H.; Wu, Y.; Zhang, Y.; Deng, F. Novel Cloud-Edge Collaborative Detection Technique for Detecting Defects in PV Components, Based on Transfer Learning. Energies 2022, 15, 7924. [Google Scholar] [CrossRef]
- Di Tommaso, A.; Betti, A.; Fontanelli, G.; Michelozzi, B. A multi-stage model based on YOLOv3 for defect detection in PV panels based on IR and visible imaging by unmanned aerial vehicle. Renewable energy 2022, 193, 941–962. [Google Scholar] [CrossRef]
- Imenes, A.G.; Noori, N.S.; Uthaug, O.A.N.; Kröni, R.; Bianchi, F.; Belbachir, N. A deep learning approach for automated fault detection on solar modules using image composites. In Proceedings of the 2021 IEEE 48th Photovoltaic Specialists Conference (PVSC). IEEE; 2021; pp. 1925–1930. [Google Scholar]
- Teke, M.; Başeski, E.; Ok, A.Ö.; Yüksel, B.; Şenaras, Ç. Multi-spectral false color shadow detection. In Proceedings of the ISPRS Conference on Photogrammetric Image Analysis. Springer; 2011; pp. 109–119. [Google Scholar]
- Zou, J.T.; Rajveer, G. Drone-based solar panel inspection with 5G and AI Technologies. In Proceedings of the 2022 8th International Conference on Applied System Innovation (ICASI). IEEE; 2022; pp. 174–178. [Google Scholar]
- Meng, Z.; Xu, S.; Wang, L.; Gong, Y.; Zhang, X.; Zhao, Y. Defect object detection algorithm for electroluminescence image defects of photovoltaic modules based on deep learning. Energy Science & Engineering 2022, 10, 800–813. [Google Scholar]
- Li, L.; Wang, Z.; Zhang, T. Photovoltaic panel defect detection based on ghost convolution with BottleneckCSP and tiny target prediction head incorporating YOLOv5. arXiv preprint, arXiv:2303.00886 2023.
- Girshick, R. Fast r-cnn. arXiv 2015. arXiv preprint, arXiv:1504.08083 2015.
- Hong, F.; Song, J.; Meng, H.; Wang, R.; Fang, F.; Zhang, G. A novel framework on intelligent detection for module defects of PV plant combining the visible and infrared images. Solar Energy 2022, 236, 406–416. [Google Scholar] [CrossRef]
- Zhang, M.; Yin, L. Solar cell surface defect detection based on improved YOLO v5. IEEE Access 2022, 10, 80804–80815. [Google Scholar] [CrossRef]
- Zheng, Q.; Ma, J.; Liu, M.; Liu, Y.; Li, Y.; Shi, G. Lightweight hot-spot fault detection model of photovoltaic panels in UAV remote-sensing image. Sensors 2022, 22, 4617. [Google Scholar] [CrossRef]
- Zhang, X.; Zou, P.; Ma, C.; Zhang, Z.; Guo, H.; Chen, Y.; Cheng, Z. Inspection and classification system of photovoltaic module defects based on UAV and thermal imaging. In Proceedings of the 2022 7th International Conference on Power and Renewable Energy (ICPRE). IEEE; 2022; pp. 905–909. [Google Scholar]
- Liu, H.; Zhang, F. A Photovoltaic Panel Defect Detection Method Based on the Improved Yolov7. In Proceedings of the 2024 5th International Conference on Mechatronics Technology and Intelligent Manufacturing (ICMTIM); 2024; pp. 359–362. [Google Scholar] [CrossRef]
- Phan, Q.B.; Nguyen, T.T. A Novel Approach for PV Cell Fault Detection using YOLOv8 and Particle Swarm Optimization. In Proceedings of the 2023 IEEE 66th International Midwest Symposium on Circuits and Systems (MWSCAS). IEEE; 2023; pp. 634–638. [Google Scholar]
- Kennedy, J.; Eberhart, R. Particle swarm optimization. In Proceedings of the Proceedings of ICNN’95-international conference on neural networks. ieee, 1995, Vol. 4, pp. 1942–1948.
- Shi, Y.; Eberhart, R. A modified particle swarm optimizer. In Proceedings of the 1998 IEEE international conference on evolutionary computation proceedings. IEEE world congress on computational intelligence (Cat. No. 98TH8360). IEEE; 1998; pp. 69–73. [Google Scholar]
- Malik, P.; Saxena, V.; Raj, S.; Singh, S.; Kumar, S.; et al. Fault Detection of the Solar Photovoltaic Modules Using YOLO Models. In Proceedings of the 2024 IEEE Region 10 Symposium (TENSYMP). IEEE; 2024; pp. 1–6. [Google Scholar]
- Pan, W.; Sun, X.; Wang, Y.; Cao, Y.; Lang, Y.; Qian, Y. Enhanced photovoltaic panel defect detection via adaptive complementary fusion in YOLO-ACF. Scientific Reports 2024, 14, 26425. [Google Scholar] [CrossRef]
- Almalki, F.A.; Albraikan, A.A.; Soufiene, B.O.; Ali, O. Utilizing artificial intelligence and lotus effect in an emerging intelligent drone for persevering solar panel efficiency. Wireless Communications and Mobile Computing 2022, 2022, 7741535. [Google Scholar] [CrossRef]
- Ab Hamid, M.Z.; Daud, K.; Soh, Z.H.C.; Osman, M.K.; Isa, I.S.; Jadin, M.S. YOLOv9-Based Hotspots Recognition in Solar Photovoltaic Panels: Integrating Image Processing Techniques for Targeted Region Identification. In Proceedings of the 2024 IEEE 14th International Conference on Control System, Computing and Engineering (ICCSCE). IEEE; 2024; pp. 94–99. [Google Scholar]
- Droguett, S.E.; Sanchez, C.N. Solar Panel Detection on Satellite Images: From Faster R-CNN to YOLOv10.
- Faster, R. Towards real-time object detection with region proposal networks. Advances in neural information processing systems 2015, 9199, 2969239–2969250. [Google Scholar]
- Wang, C.Y.; Yeh, I.H.; Mark Liao, H.Y. Yolov9: Learning what you want to learn using programmable gradient information. In Proceedings of the European Conference on Computer Vision. Springer; 2025; pp. 1–21. [Google Scholar]
- Wang, A.; Chen, H.; Liu, L.; Chen, K.; Lin, Z.; Han, J.; Ding, G. Yolov10: Real-time end-to-end object detection. arXiv preprint , arXiv:2405.14458 2024.
- Jiang, H.; Yao, L.; Lu, N.; Qin, J.; Liu, T.; Liu, Y.; Zhou, C. Multi-resolution dataset for photovoltaic panel segmentation from satellite and aerial imagery. Earth System Science Data Discussions 2021, 2021, 1–17. [Google Scholar] [CrossRef]
- Terven, J.; Córdova-Esparza, D.M.; Romero-González, J.A. A comprehensive review of yolo architectures in computer vision: From yolov1 to yolov8 and yolo-nas. Machine Learning and Knowledge Extraction 2023, 5, 1680–1716. [Google Scholar] [CrossRef]
- Wang, C.; Yeh, I.; Liao, H. YOLOv9: Learning what you want to learn using programmable gradient information. arXiv 2024. arXiv preprint , arXiv:2402.13616.
- Liu, W.; Anguelov, D.; Erhan, D.; Szegedy, C.; Reed, S.; Fu, C.Y.; Berg, A.C. Ssd: Single shot multibox detector. In Proceedings of the Computer Vision–ECCV 2016: 14th European Conference, Amsterdam, The Netherlands, 2016, Proceedings, Part I October 11–14. Springer, 2016, October 11–14; pp. 21–37.
- Redmon, J. You only look once: Unified, real-time object detection. In Proceedings of the Proceedings of the IEEE conference on computer vision and pattern recognition; 2016. [Google Scholar]
- Badgujar, C.M.; Poulose, A.; Gan, H. Agricultural object detection with You Only Look Once (YOLO) Algorithm: A bibliometric and systematic literature review. Computers and Electronics in Agriculture 2024, 223, 109090. [Google Scholar] [CrossRef]
- Ragab, M.G.; Abdulkader, S.J.; Muneer, A.; Alqushaibi, A.; Sumiea, E.H.; Qureshi, R.; Al-Selwi, S.M.; Alhussian, H. A Comprehensive Systematic Review of YOLO for Medical Object Detection (2018 to 2023). IEEE Access 2024. [Google Scholar] [CrossRef]
- DAZLEE, N.M.A.A.; Khalil, S.A.; RAHMAN, S.A.; Mutalib, S. Object detection for autonomous vehicles with sensor-based technology using yolo. International journal of intelligent systems and applications in engineering 2022, 10, 129–134. [Google Scholar] [CrossRef]
- Vijayakumar, A.; Vairavasundaram, S. Yolo-based object detection models: A review and its applications. Multimedia Tools and Applications 2024, pp. 1–40.
- Khanam, R.; Hussain, M.; Hill, R.; Allen, P. A comprehensive review of convolutional neural networks for defect detection in industrial applications. IEEE Access 2024. [Google Scholar] [CrossRef]
- Nakahara, H.; Yonekawa, H.; Fujii, T.; Sato, S. A lightweight YOLOv2: A binarized CNN with a parallel support vector regression for an FPGA. In Proceedings of the Proceedings of the 2018 ACM/SIGDA International Symposium on field-programmable gate arrays, 2018, pp.31–40.
- Li, R.; Yang, J. Improved YOLOv2 object detection model. In Proceedings of the 2018 6th international conference on multimedia computing and systems (ICMCS). IEEE; 2018; pp. 1–6. [Google Scholar]
- Kim, K.J.; Kim, P.K.; Chung, Y.S.; Choi, D.H. Performance enhancement of YOLOv3 by adding prediction layers with spatial pyramid pooling for vehicle detection. In Proceedings of the 2018 15th IEEE international conference on advanced video and signal based surveillance (AVSS). IEEE; 2018; pp. 1–6. [Google Scholar]
- Nepal, U.; Eslamiat, H. Comparing YOLOv3, YOLOv4 and YOLOv5 for autonomous landing spot detection in faulty UAVs. Sensors 2022, 22, 464. [Google Scholar] [CrossRef] [PubMed]
- Mohod, N.; Agrawal, P.; Madaan, V. Yolov4 vs yolov5: Object detection on surveillance videos. In Proceedings of the International Conference on Advanced Network Technologies and Intelligent Computing. Springer; 2022; pp. 654–665. [Google Scholar]
- Sapkota, R.; Qureshi, R.; Flores-Calero, M.; Badgujar, C.; Nepal, U.; Poulose, A.; Zeno, P.; Bhanu Prakash Vaddevolu, U.; Yan, P.; Karkee, M.; et al. Yolov10 to its genesis: A decadal and comprehensive review of the you only look once series. Available at SSRN 4874098 2024. [Google Scholar]
- Jocher, G. Ultralytics YOLOv5, 2020. [CrossRef]
- Li, C.; Li, L.; Jiang, H.; Weng, K.; Geng, Y.; Li, L.; Ke, Z.; Li, Q.; Cheng, M.; Nie, W.; et al. YOLOv6: A single-stage object detection framework for industrial applications. arXiv preprint , arXiv:2209.02976 2022.
- Xu, X.; Jiang, Y.; Chen, W.; Huang, Y.; Zhang, Y.; Sun, X. Damo-yolo: A report on real-time object detection design. arXiv preprint , arXiv:2211.15444 2022.
- Roboflow. What is YOLOv8? https://blog.roboflow.com/what-is-yolov8/, 2025. Accessed: 2025-01-01.
- Jocher, G.; Qiu, J. Ultralytics YOLO11, 2024.
- Khanam, R.; Hussain, M. YOLOv11: An Overview of the Key Architectural Enhancements. arXiv preprint , arXiv:2410.17725 2024.
- Susan. panel solar Dataset. https://universe.roboflow.com/susan-ifblr/panel-solar-bw945, 2024. visited on 2024-11-22.
- Roboflow. Roboflow Universe, 2024. Accessed: 2024-11-22.
- Khanam, R.; Hussain, M. What is YOLOv5: A deep look into the internal features of the popular object detector. arXiv preprint , arXiv:2407.20892 2024.
- Jocher, G.; Chaurasia, A.; Qiu, J. Ultralytics YOLOv8, 2023.
- Padilla, R.; Netto, S.L.; Da Silva, E.A. A survey on performance metrics for object-detection algorithms. In Proceedings of the 2020 international conference on systems, signals and image processing (IWSSIP). IEEE; 2020; pp. 237–242. [Google Scholar]
- Padilla, R.; Passos, W.L.; Dias, T.L.; Netto, S.L.; Da Silva, E.A. A comparative analysis of object detection metrics with a companion open-source toolkit. Electronics 2021, 10, 279. [Google Scholar] [CrossRef]
- Yacouby, R.; Axman, D. Probabilistic extension of precision, recall, and f1 score for more thorough evaluation of classification models. In Proceedings of the Proceedings of the first workshop on evaluation and comparison of NLP systems, 2020, pp.
- Henderson, P.; Ferrari, V. End-to-end training of object class detectors for mean average precision. In Proceedings of the Computer Vision–ACCV 2016: 13th Asian Conference on Computer Vision, Taipei, Taiwan, 2016, Revised Selected Papers, Part V 13. Springer, 2017, November 20-24; pp. 198–213.
- Jeong, H.J.; Park, K.S.; Ha, Y.G. Image preprocessing for efficient training of YOLO deep learning networks. In Proceedings of the 2018 IEEE International Conference on Big Data and Smart Computing (BigComp). IEEE; 2018; pp. 635–637. [Google Scholar]
- Diwan, T.; Anirudh, G.; Tembhurne, J.V. Object detection using YOLO: Challenges, architectural successors, datasets and applications. multimedia Tools and Applications 2023, 82, 9243–9275. [Google Scholar] [CrossRef]
- Maji, D.; Nagori, S.; Mathew, M.; Poddar, D. Yolo-pose: Enhancing yolo for multi person pose estimation using object keypoint similarity loss. In Proceedings of the Proceedings of the IEEE/CVF Conference on Computer Vision and Pattern Recognition, 2022, pp.2637–2646.
- Zheng, C. Stack-YOLO: A friendly-hardware real-time object detection algorithm. IEEE Access 2023, 11, 62522–62534. [Google Scholar] [CrossRef]
- Shihavuddin, A.; Rashid, M.R.A.; Maruf, M.H.; Hasan, M.A.; ul Haq, M.A.; Ashique, R.H.; Al Mansur, A. Image based surface damage detection of renewable energy installations using a unified deep learning approach. Energy Reports 2021, 7, 4566–4576. [Google Scholar] [CrossRef]
Figure 1.
YOLO Model Evolution
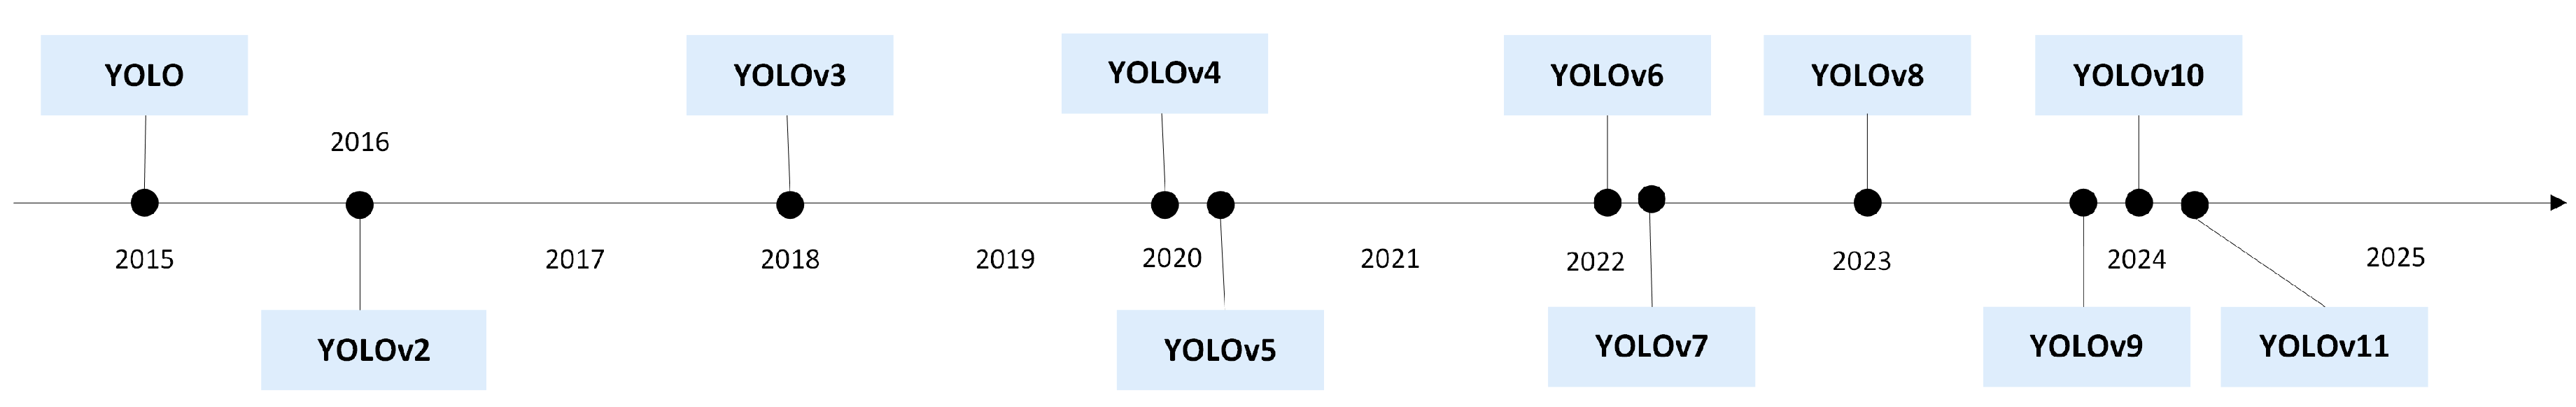
Figure 2.
Representative examples of classes in the Solar Panel Dataset
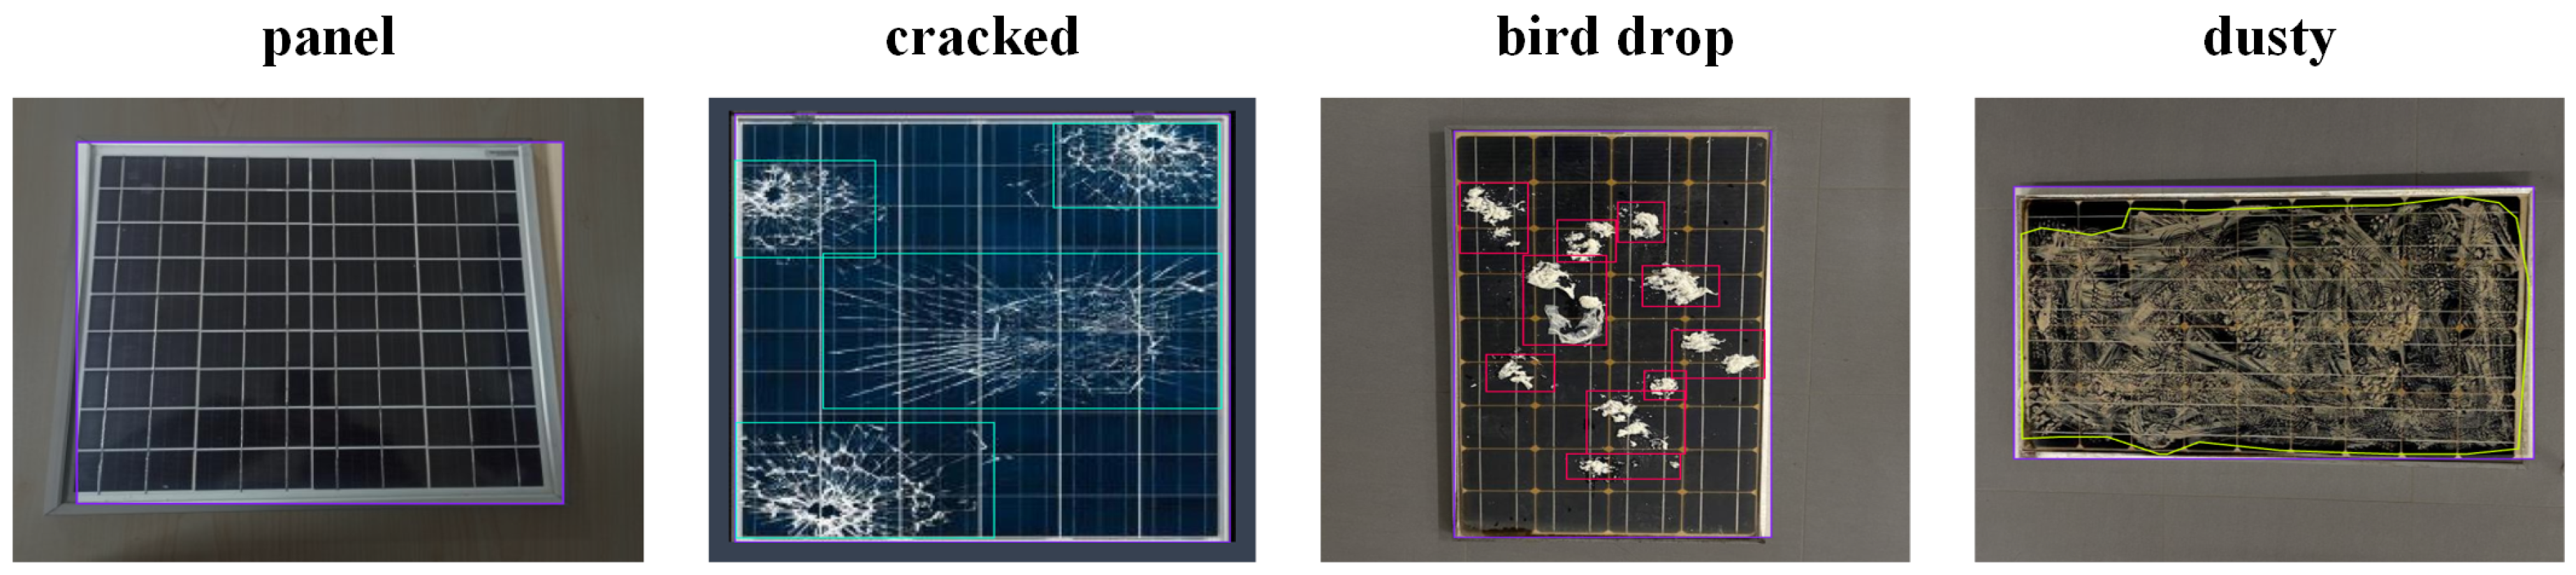
Figure 3.
F1-Confidence curve of YOLO models
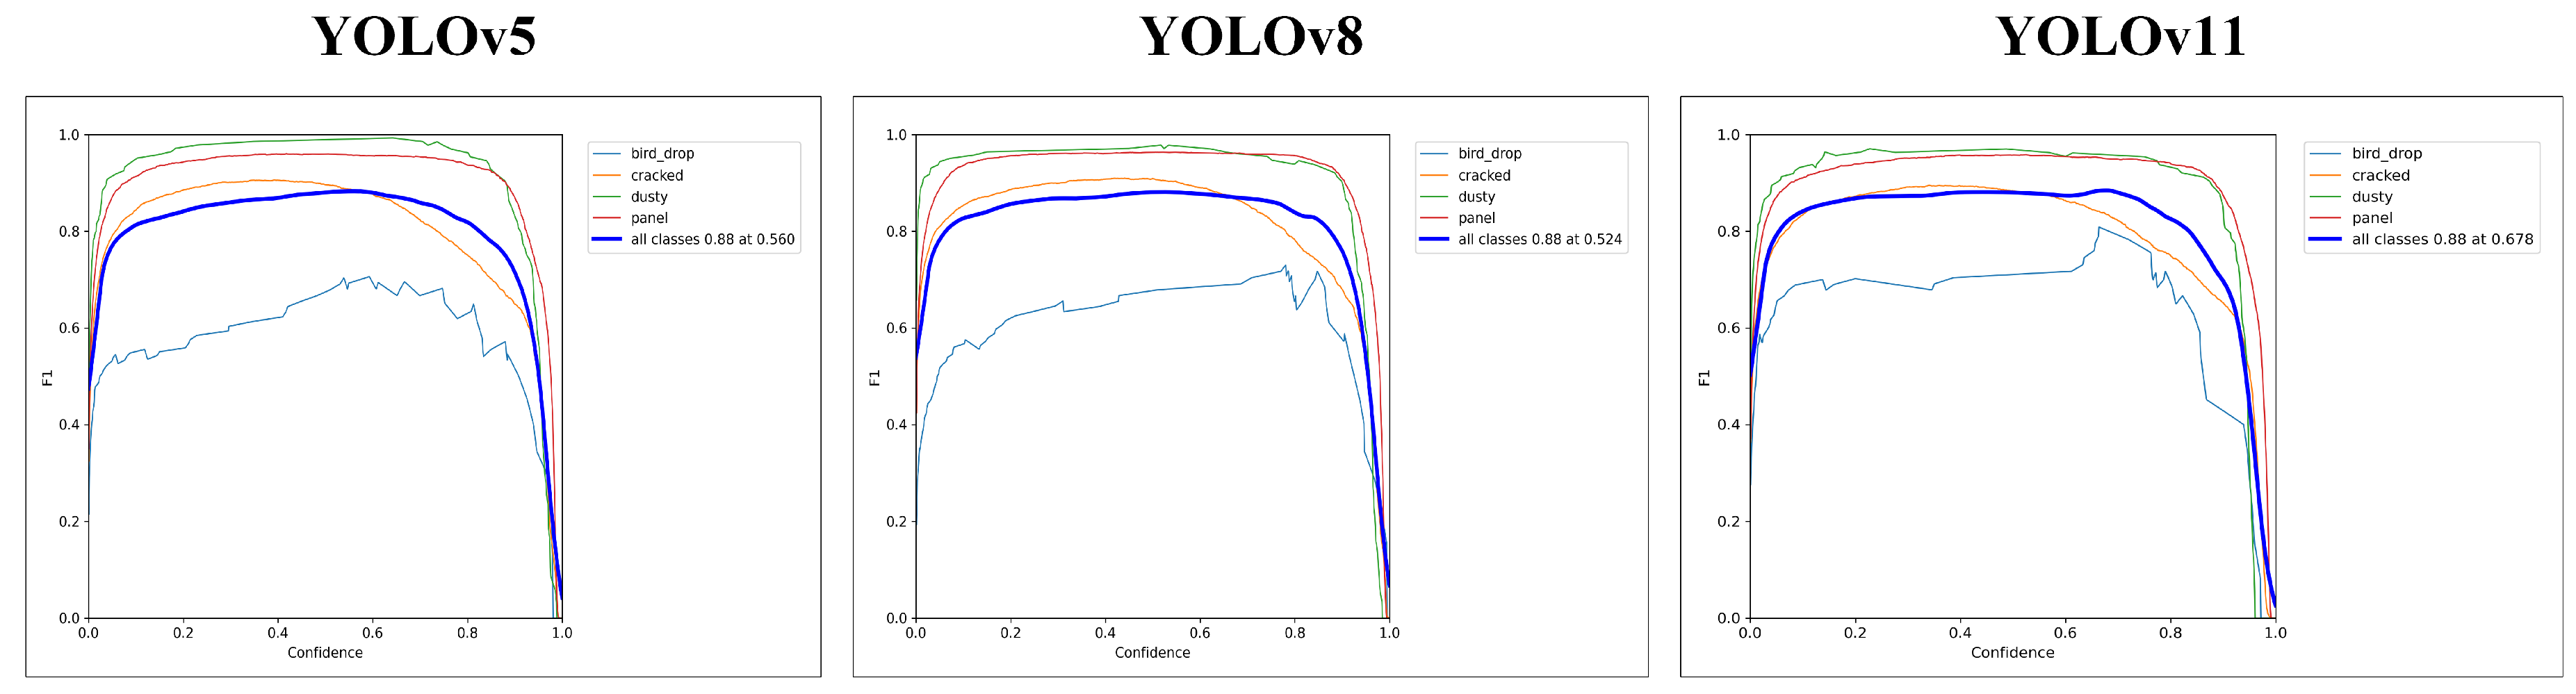
Figure 4.
Precision-recall(PR) curve of YOLO models
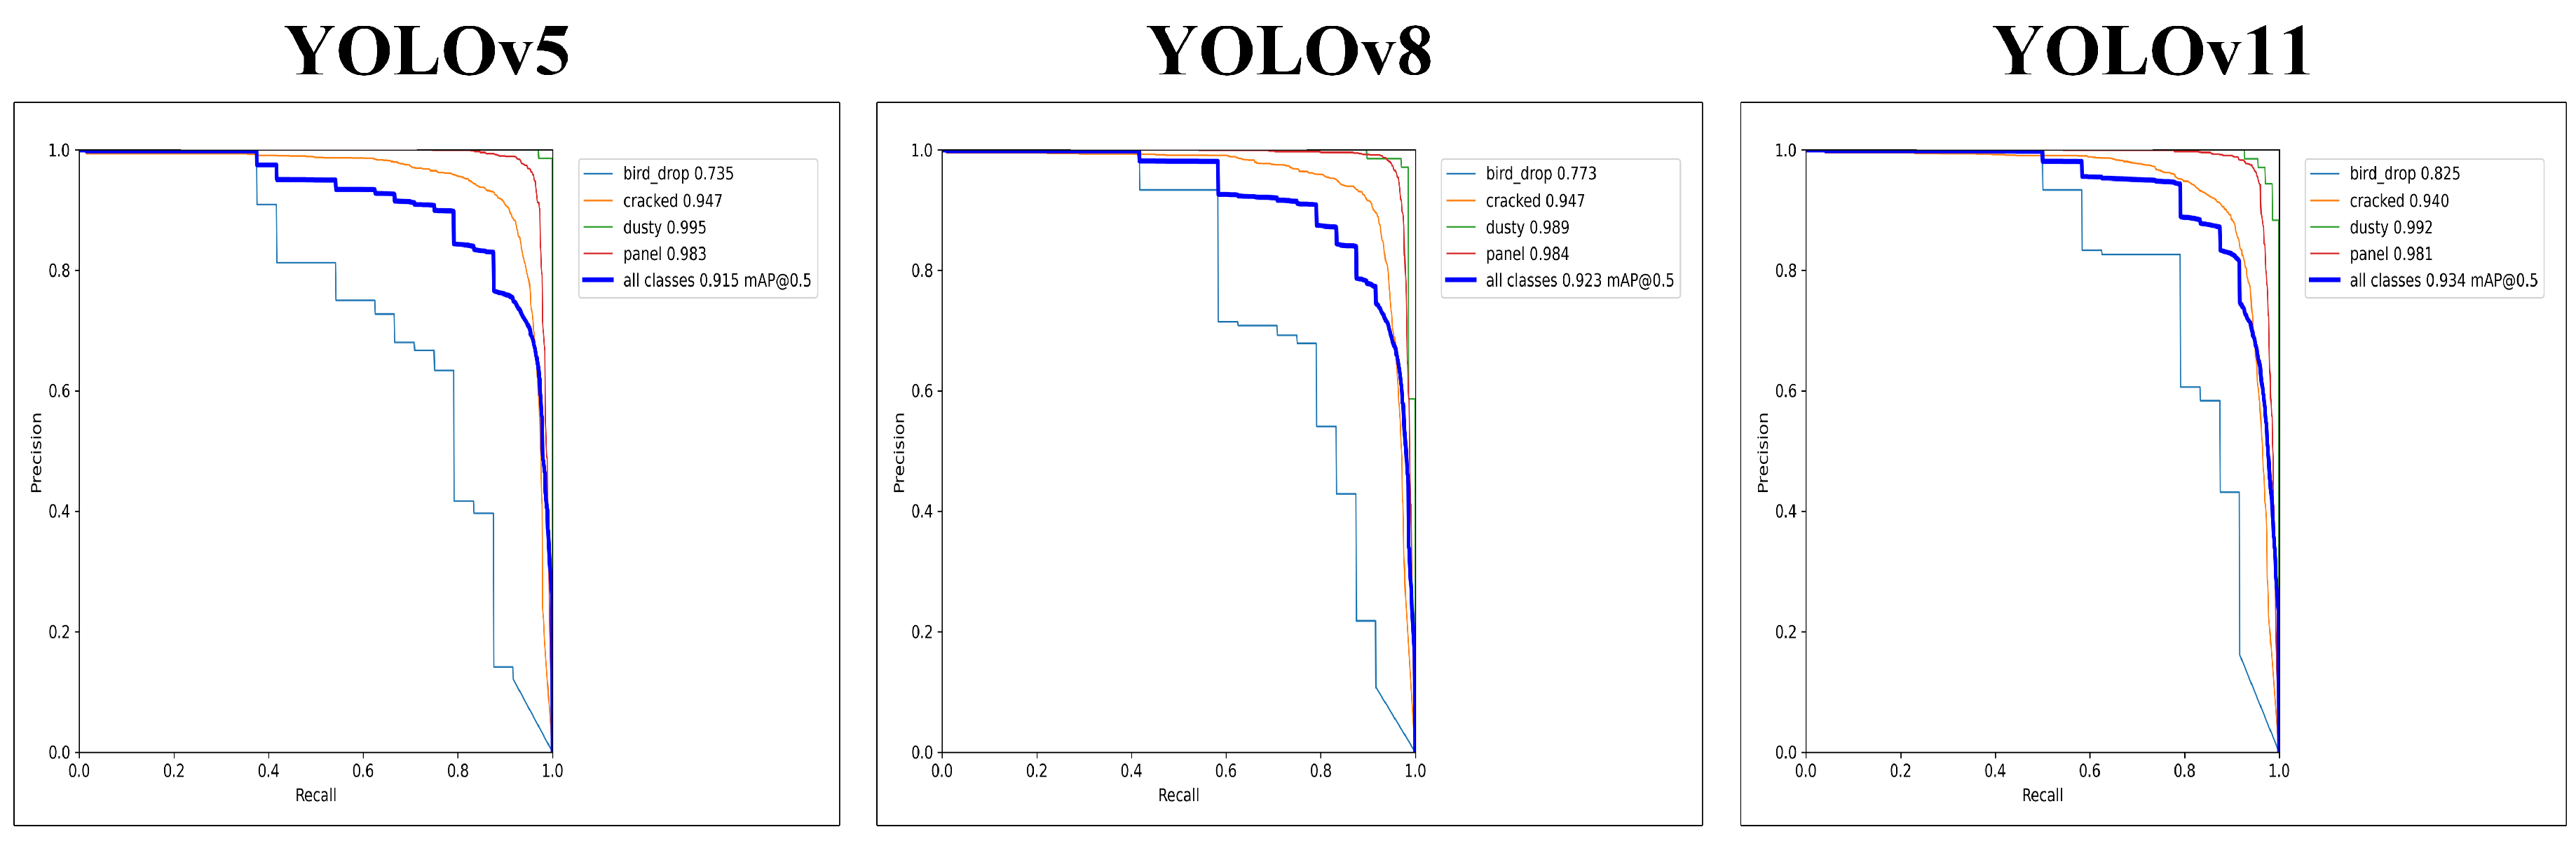
Figure 5.
Confusion matrix for YOLO models
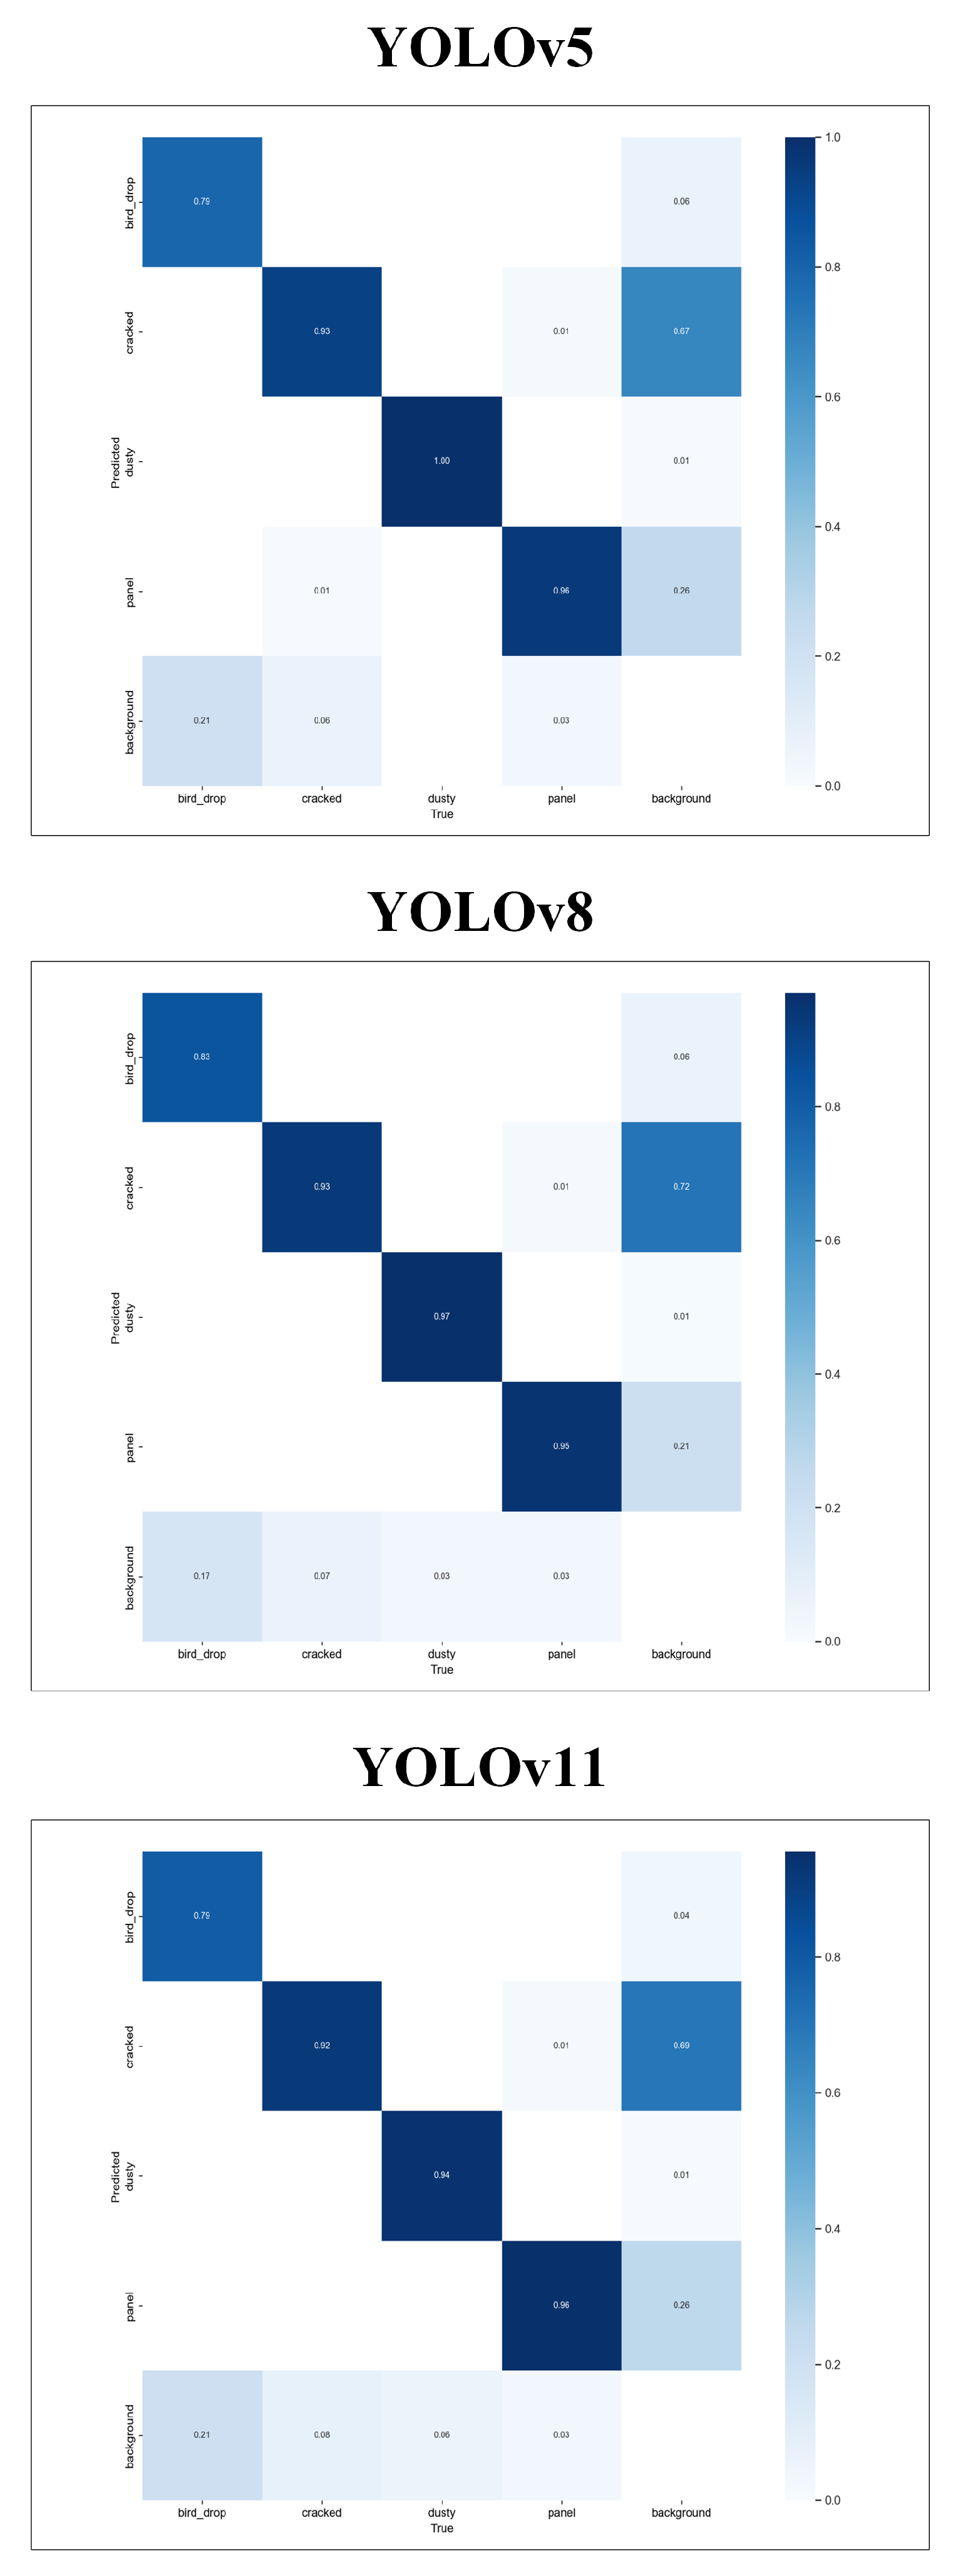

Table 1.
Performance Comparison of YOLO Models for Photovoltaic Fault Detection
| Authors | YOLO Models | Contributions | Accuracy |
|---|---|---|---|
| Prajapati et al.[13] | YOLO | Detection and classification of faults in PV modules through thermal image analysis | 83.86% |
| Tahmid Tajwar et al.[14] | YOLOv3 | Hotspot detection through YOLO model with IRT imaging and improved detection accuracy with more diverse training data | - |
| Antonio Greco et al.[15] | YOLOv3 | Segmentation of modules in PV plants through plug-and-play deep learning-based YOLO method, eliminating the need for plant-dependent configurations | 95% |
| H. Wang et al. [18] | YOLOv3 | Proposed a cloud-edge collaborative technique and introduced an improved YOLO v3-tiny algorithm with a third prediction layer and a residual module. | 95.5% |
| A.D. Tommaso et al.[19] | YOLOv3 | Proposed a multi-stage architecture consisting of panel detector, defect detector and False Alarm for the detection of anomalies in images of PV panels | 68.5% |
| A.Gerd Imenes et al.[20] | YOLOv3 | Acquired multiwavelength composite images(thermal and visible) to improve fault detection and classification. | 75% |
| J.-T. Zou et al.[22] | YOLOv4 | AI-driven method using YOLOv4, CNN, and 5G drones for efficient PV module defect detection via thermal images. | 100% |
| Z. Meng et al.[23] | YOLOv4 | Introduced YOLO-PV, a YOLOv4-based framework optimized for EL image detection in PV modules, with innovative techniques like SPAN and data augmentation. | 94.55% |
| L.Li et al.[24] | YOLOv5 | Incorporated Ghost convolution, BottleneckCSP, and a tiny target prediction head in YOLOv5 for improved accuracy, speed, and detection of tiny defects | 97.8% |
| F. Hong et al.[26] | YOLOv5 | Introduced a intelligent end-to-end detection framework for module defects in PV power plants, integrating visible and infrared images | 95% |
| M.Zhang et al.[27] | YOLOv5 | Incorporated with deformable convolutional CSP module, ECA-Net attention mechanism, prediction head and improved network structure was proposed | 89.64% |
| Q. Zheng[28] | YOLOv5 | To improve both speed and accuracy, the feature extraction component of YOLOv5 is modified by integrating the Focus structure and the core unit of ShuffleNetV2, while simplifying the original feature fusion method. | 98.1% |
| X. Zhang et al.[29] | YOLOv5 | Acquired UAV and thermal camera for collecting thermal images of PV modules in power plants and detected areas with abnormal temperatures. | 80.88% |
| Liu et al. [30] | YOLOv7 | Enhanced YOLOv7 by integrating FReLU, PwConv, and SEAM attention | 97.7% |
| Q. B. Phan et al.[31] | YOLOv8 | Presented a novel fault detection method for photovoltaic cells by integrating YOLOv8 with Particle Swarm Optimization | 94% |
| P. Malik et al.[34] | YOLOv5 & YOLOv9 | Presented an advanced object detection approach using YOLOv5 through YOLOv9 models, with the GELANc model. | 70.4% |
| W. Pan et al.[35] | YOLOv5 | Proposed an Adaptive Complementary Fusion (ACF) module that combines spatial and channel information and integrates it into YOLOv5, resulting in the YOLO-ACF model. | 80% |
| MZ. Ab. Hamid et al. [37] | YOLOv9 | Presented a YOLOv9-based method integrated with advanced image processing techniques for precise hotspot detection and localization in solar PV panels | 96% |
| S.E. Droguett et al.[38] | YOLOv9 & YOLOv10 | Implemented Mask RCNN and CNN architecture in YOLO models to identify solar panels in satellite images | YOLOv9e = 74%, YOLOv10 = 73% |
Table 2.
Dataset Distribution for Solar Panel Dataset
| Dataset | Number of Images | Percentage |
|---|---|---|
| Training | 4546 | 70% |
| Validation | 1299 | 20% |
| Testing | 648 | 10% |
| Total | 6493 | 100% |
Table 3.
Hyperparameters used for training models.
| Hyperparameter | Value | Description |
|---|---|---|
| Epochs | 100 | Total number of complete passes through the training dataset. |
| Batch Size | 17 | Number of samples processed before the model updates its parameters. |
| Image Size (imgsz) | 640 | The dimension to which all input images are resized for training, balancing accuracy and computational cost. |
| Initial Learning Rate (lr0) | 0.01 | The starting learning rate, determining the step size for optimizer updates. |
| Final Learning Rate (lrf) | 0.01 | The learning rate applied at the final epoch to ensure gradual convergence. |
| Warmup Epochs | 3.0 | Number of initial epochs during which the learning rate is incrementally increased to stabilize training. |
| Momentum | 0.937 | Hyperparameter for the optimizer that smoothens weight updates and accelerates convergence. |
| Weight Decay | 0.0005 | Regularization parameter added to reduce model overfitting. |
| Box Loss Gain (box) | 7.5 | Multiplier applied to the bounding box regression loss to prioritize localization accuracy. |
| Class Loss Gain (cls) | 0.5 | Multiplier applied to the classification loss to adjust its contribution during training. |
| Definition Loss Gain (dfl) | 1.5 | Scaling factor for the focal loss, enhancing the precision of bounding box predictions. |
Table 4.
YOLO Model Performance Comparison.
| Class | Images | Instances | Model | Precision (%) | Recall (%) | mAP@0.5 (%) |
|---|---|---|---|---|---|---|
| all | 1299 | 3167 | YOLOv5m | 88.4 | 88.3 | 91.5 |
| YOLOv8 | 86.9 | 89.9 | 92.3 | |||
| YOLOv11m | 87.6 | 89.0 | 93.4 | |||
| bird_drop | 3 | 24 | YOLOv5m | 64.0 | 75.0 | 73.5 |
| YOLOv8 | 59.5 | 79.2 | 77.3 | |||
| YOLOv11m | 63.9 | 79 | 82.5 | |||
| cracked | 718 | 1796 | YOLOv5m | 94.1 | 83.9 | 94.7 |
| YOLOv8 | 93.3 | 87.9 | 94.7 | |||
| YOLOv11m | 91.7 | 86.6 | 94.0 | |||
| dusty | 27 | 68 | YOLOv5m | 98.1 | 100.0 | 99.5 |
| YOLOv8 | 97.1 | 97.5 | 98.9 | |||
| YOLOv11m | 98.2 | 95.6 | 99.2 | |||
| panel | 1055 | 1279 | YOLOv5m | 97.5 | 94.1 | 98.3 |
| YOLOv8 | 97.8 | 94.9 | 98.4 | |||
| YOLOv11m | 96.6 | 94.7 | 98.1 |
Table 5.
Summary of YOLO Model Architectures and Speed Metrics
| Model | Layers | Parameters | GFLOPs | Speed (ms/image) |
|---|---|---|---|---|
| YOLOv5m | 248 | 25,047,532 | 64.0 | Preprocess: 0.3 |
| Inference: 7.1 | ||||
| Loss: 0.0 | ||||
| Postprocess: 1.0 | ||||
| YOLOv8 | 218 | 25,842,076 | 78.7 | Preprocess: 0.4 |
| Inference: 15.9 | ||||
| Loss: 0.0 | ||||
| Postprocess: 0.7 | ||||
| YOLOv11m | 303 | 20,033,116 | 67.7 | Preprocess: 0.3 |
| Inference: 7.7 | ||||
| Loss: 0.0 | ||||
| Postprocess: 0.6 |
Disclaimer/Publisher’s Note: The statements, opinions and data contained in all publications are solely those of the individual author(s) and contributor(s) and not of MDPI and/or the editor(s). MDPI and/or the editor(s) disclaim responsibility for any injury to people or property resulting from any ideas, methods, instructions or products referred to in the content. |
© 2025 by the authors. Licensee MDPI, Basel, Switzerland. This article is an open access article distributed under the terms and conditions of the Creative Commons Attribution (CC BY) license (http://creativecommons.org/licenses/by/4.0/).
Copyright: This open access article is published under a Creative Commons CC BY 4.0 license, which permit the free download, distribution, and reuse, provided that the author and preprint are cited in any reuse.


