Submitted:
25 July 2024
Posted:
25 July 2024
You are already at the latest version
Abstract
Despite the demonstrated benefits of data monetization initiatives in achieving competitive advantages, many of these efforts struggle to realize their potential. Companies often find it challenging to sustain even initially successful data monetization initiatives due to significant data quality issues. This reflects a disconnect between advancements in data monetization research—spanning digitization, digitalization, and digital transformation—and practical implementation within companies. Consequently, misguided approaches to data monetization are relatively common. A critical prerequisite for successful data monetization is the establishment and maintenance of clean, high-quality data. This study underscores the importance of data quality by conducting an in-depth analysis of Medical Inc., a company engaged in preparing pristine customer master data for advanced customer analytics. The investigation aims to elucidate Medical Inc.’s approach to addressing data cleanliness challenges and to distill a general framework for the customer master data cleansing process. This framework illuminates a relatively unexplored aspect of data monetization supplementing existing literature on digitization, digitalization, and digital transformation.
Keywords:
Customer analytics
; data cleanliness
; data harmonization
; data integration
; data monetization
; digitization
; digitalization
; digital transformation
; and
; customer master data
1. Introduction
Scholars and practitioners generally concur that companies must advance their efforts and investments in digitization, digitalization, and digital transformations [1]. Hereby, data monetization has emerged as a principal justification for investments in these endeavors [2,3]. However, despite the proven benefits of data monetization, company success in leveraging data to achieve competitive advantage remains inconsistent. While some pioneering companies have successfully utilized data, substantial evidence indicates that many organizations continue to struggle with effective data utilization and data monetization [4,5,6]. These challenges are not confined to the monetization of "big" data and advanced analytics, such as artificial intelligence, but also extend to the monetization of basic data and data analytics.
A consensus among various studies indicates that only a minority of companies have achieved success with their data initiatives. The majority of companies experience only modest benefits, and some even incur losses from their advanced data analytics initiatives. Nevertheless, the few companies that successfully implement data monetization strategies are reported to outperform their less data-centric counterparts in terms of revenue growth, profit margins, and returns on equity [4,5,6].
This is particularly surprising given that data monetization has rapidly emerged as a prominent research topic and dominates the agendas of many companies. Previous research has highlighted various data monetization approaches, such as direct and indirect data monetization, elucidated the necessary conditions for successful data monetization initiatives, and provided use cases across various industries [8,16]. However, prior studies overlook two critical aspects. First, it remains unclear how companies’ legacy information and communication systems influence the outcomes of data monetization initiatives. Legacy systems naturally shape the starting points of these initiatives, either inhibiting or facilitating company goals, roadmaps, strategic plans, and implementations. Legacy systems can impose burdens related to data quality, harmonization, and consistency, thereby delaying the achievement of expected outcomes in data initiatives [2,7].
Second, existing research frequently examines data monetization initiatives at the company level while emphasizing the importance of implementing lighthouse projects and developing concrete use cases to create and sustain momentum for data initiatives. The literature often highlights the successes of individual use cases without delving deeply into selected examples or exploring the reasons behind the failures of these use cases. This oversight is notable given that many companies report difficulties during the implementation and eventual discontinuation of promising use cases [8].
We contend that the existing evidence and theoretical considerations indicate a significant gap in understanding how companies can effectively benefit from data. To address these fundamental issues, we investigated the following research question through a single case study on customer analytics in collaboration with a medical technology company (Medical Inc.): How should companies prepare their customer master data to monetize their customer analytics efforts?
In answering this question, we make three important contributions. First, we identify key activities necessary for the successful deployment of data initiatives in customer analytics. Rather than aiming for an exhaustive list, we focus on specific key activities deemed most crucial for advancing data utilization and monetization through customer analytics. Second, we integrate these key activities into an overall framework, illustrating how companies can advance their data and advanced analytics initiatives throughout their digitization and digital transformation efforts. Third, we address a gap in the 3D concept—digitization, digitalization, and digital transformation—highlighting that digitization alone is insufficient for achieving the next step in digital advancement [1,9].
The paper proceeds by first explaining the theoretical background and then outlining the research methodology applied in collaboration with our case company. We then present our findings, introducing the phase termed datatization in the company's journey through i) digitization, ii) digitalization, and iii) digital transformation. This phase is translated into a nine-step framework that establishes digitalization as a better foundation for digital transformation. The paper concludes with a concise summary of the primary findings and implications.
2. Theoretical Background
2.1. Digitization, Digitalization and Digital Transformation
The research is embedded into the general research on digitization, digitalization, and digital transformation [9,10]. Research defines digitization basically as the conversion of analog signals into digital signals, essentially separating the data from its medium and converting it into binary code consequently making it digitally available [9,11,12]. Digitalization is seen as the process of including digital technologies in organizational processes and consequently developing new value opportunities while simultaneously changing the way companies are using the data [9,13,14]. Digital transformation is defined as the immersion of the whole enterprise into digital ways not limited by processes and data but also reaching into operations, the business model and the competencies of a firm [14]. These definitions inherit one another, digital transformation cannot happen without digitalization and digitalization cannot happen without digitization [9].
2.2. Data Monetization
Data monetization is a critical component of this broader discussion on digitization, digitalization, and digital transformation. The role in data monetization in the digitization is, for example, about creating raw digital data that forms the basis for all subsequent data-driven strategies. For instance, digitized records, sensor data, and digital communication logs are essential for generating valuable insights. Data monetization drives digitalization by enabling companies to streamline operations, improve customer experiences, and enhance decision-making through data analysis. For the digital transformation, data is increasingly treated as a strategic asset. Organizations leverage data to drive innovation, gain competitive advantage, and create entirely new business models [2,4,5,6,7].
Data monetization is thus a continuous thread running through these stages, progressively enhancing the ways organizations derive value from their data. It shifts from merely converting and storing data (digitization), to using data to improve and innovate business processes (digitalization), and finally to fundamentally transforming the business landscape to create new value propositions and revenue streams (digital transformation). Data monetization is the process by which tangible economic advantages are derived from the utilization of available data sources [8,15]. This process encompasses both direct and indirect methods, each capitalizing on data assets in distinctive ways to generate value. Direct data monetization primarily involves the sale or licensing of data to external parties. This can manifest in various forms, including data sales, where companies collect, package, and vend data to third-party entities, data licensing, wherein companies grant other organizations the right to utilize their data under specified conditions, and participation in data marketplaces, where companies engage in the buying and selling of data sets. Conversely, indirect data monetization revolves around the utilization of data to optimize internal operations, refine products, or enhance services, thus yielding economic benefits [8,16]. Key methodologies in this realm include leveraging data analytics to facilitate more informed decision-making, utilizing customer data to tailor services and foster heightened satisfaction and loyalty, employing data analysis to streamline operations and minimize costs (as exemplified by predictive maintenance in manufacturing), and leveraging data insights to drive product innovation [2,7].
Existing literature underscores a structured approach to data monetization, delineated into four main phases: data collection, data cleansing1 and preparation, data analysis, and implementation, evaluation, and monitoring. The data collection phase entails gathering relevant data from diverse sources such as customer interactions, transaction records, or Internet of Things (IoT) devices. Subsequently, the data is refined and prepared for analysis, ensuring its quality and usability. The analysis phase employs various analytical tools and techniques to derive actionable insights from the data. Finally, the implementation, evaluation, and monitoring phase focusses on deploying data-driven initiatives and continually assessing their outcomes to ensure they align with anticipated economic benefits [16,17].
Navigating through these phases presents companies with several challenges, notably pertaining to data quality, privacy, and security, data integration across disparate systems, scalability of data infrastructure, and the cultivation of requisite expertise in data science and analytics. Addressing these challenges is crucial for organizations seeking to realize the full potential of data monetization initiatives [18].
2.3. Data, Data Structuring, and Data Analytics
The recent discussion about data monetization often neglects data cleansing, preparation, and harmonization. A possible reason for the limited emphasis on data cleansing, preparation, and harmonization is the recent rush for “big data.” The term “big data” refers to large and complex data assets characterized by four features, known as the 4Vs: i) volume, describing the large scale of data requiring innovative tools for collection, storage, and analysis; ii) velocity, highlighting the rate at which data are generated and updated in real-time; iii) variety, indicating the variation in data types; and iv) veracity, reflecting the complexity and uncertainty of data [19,20].
The process of big data analytics comprises four key phases. Phase 1 involves turning data into insights by collecting, cleaning, analyzing, and processing large, diverse, and usually unstructured data from internal and external sources. These analytics generate insights for decision-makers. Phase 2 transforms these insights into decisions, as managers contextualize and attach meaning to the insights. Phase 3 translates decisions into specific operational actions. Phase 4 generates additional data points from these actions, which are then cycled back into the process for future decision-making.
Implementing this process is not linear; rather, companies should embrace an evolutionary approach to developing their data analytics capabilities over time, progressing through four stages of maturity. Stage 1, data structuring, involves digitizing and organizing data to ensure cleanliness, structure, and usability for further analysis. This often includes “scrubbing” data to remove errors and ensure quality, addressing the common concern of “garbage in, garbage out.” Stage 2 focuses on making data available to relevant users, ensuring the right data is accessible when and where needed. Stage 3 applies basic analytics to the data, demonstrating that even simple analytic approaches can yield significant gains and serve as a foundation for more advanced analytics in Stage 4. Stage 4 involves applying advanced analytics, which can generate radical new business insights but requires deep analytical expertise. As companies develop their capabilities, they move along this maturity map. Both the big data analytics cycle [22] and the implementation maturity map [21] highlight the importance of data cleansing. However, detailed guidance on data cleansing remains sparse. Additionally, it is often argued that the necessary costs for data structuring (e.g., clean(s)ing, harmonization, consistency) may outweigh the benefits of data monetization.
2.4. Customer Analytics
Data cleansing is contingent upon the specific use case of data monetization. Customer analytics is a significant use case wherein data structuring is a crucial precondition for effective data monetization. Customer analytics generally empowers businesses to make data-driven decisions, enhance customer engagement, improve marketing effectiveness, and ultimately increase customer loyalty and profitability. Customer analytics refers to the systematic examination and interpretation of customer data to understand and predict customer behavior, preferences, and trends. This involves using data collection, data processing, and analytical techniques to gain insights into customer interactions, experiences, and engagement [23,24].
Customer analytics is particularly important for companies with a sales force, as it aids sales representatives and managers in increasing revenue and enhancing customer satisfaction and loyalty [25,26]. Customer analytics facilitates the understanding of customer behavior and preferences through data analysis, driving tailored service or product promotions that contribute to business growth and data monetization [26].
The primary objective of customer analytics is to provide key executives with real-time data insights via accessible Business Intelligence (BI) platforms equipped with user-friendly dashboards [27,28]. Ideally, these dashboards present executives with the most relevant data points without requiring a comprehensive analysis of the entire dashboard [29].
The opportunities of BI platforms for customer analytics are vast and varied. To harness these opportunities, companies must develop a data model that integrates all relevant data from various IT systems. The success of a BI platform in exploring these opportunities hinges on the accurate recording and alignment of all relevant customer data across databases, preventing issues such as displaying the same customer with different IDs from various data sets [30].
Achieving data consistency is reported to be challenging. While companies starting from scratch may find it relatively easy, those with a long legacy of IT systems, product and service sales often face numerous systems with significant data inconsistencies, necessitating extensive data alignment and structuring efforts [31]. Despite the critical importance of data alignment, companies frequently underestimate the effort required to integrate systems with disparate data models and data sets.
A data model explicitly defines the structure of data, while structured data is organized according to this model. A data set is an ordered collection of data, defined by its content, grouping, purpose, and relatedness [32] Companies must recognize that without data alignment, valuable insights for increasing revenue or customer satisfaction cannot be generated [31].
Recent advancements in customer analytics include algorithms designed to identify data inconsistencies and quality issues, such as duplicates, outliers, or missing values [33]. However, these algorithms are limited in their applicability to transactional and master data alignment. Transactional data, which is generated by business transactions and changes rapidly over time, contrasts with master data, which changes infrequently and describes fundamental company objects, such as customer or product master data [34,35].
2.5. Algorithms for Data Integration & Cleansing
Algorithms for data integration and cleansing are essential for transforming data into a useful and consistent data format. The primary data integration algorithms include entity resolution, schema matching, data fusion, and ontology-based integration. For data cleansing, the key algorithms are missing value imputation, outlier detection and removal, normalization and standardization, text cleansing, and data transformation. Advanced techniques for data cleansing include deep learning algorithms like autoencoders and recurrent neural networks, reinforcement learning through active learning, and graph-based data cleansing using graph algorithms for detecting and resolving inconsistencies and duplicates. These algorithms are fundamental to effective data integration and cleansing, ensuring that data is high-quality, consistent, and reliable for analytics and decision-making processes [37].
Data migration and integration require linking master data records, which can be facilitated by algorithms available on modern Master Data Management (MDM) platforms. However, these algorithms have limitations. While numerous statistical methods exist, none can fully merge and create a clean customer master data set when the initial data sets are not clean. Various algorithms based on statistical comparative or classification frameworks can be applied to data in general, primarily addressing transactional data issues [35,36]. Master data issues differ significantly from those of transactional data. Common transactional data issues include duplicates, missing values, outliers, and contradicting values [38]. In contrast, master data issues often involve duplicates, incorrect attributes, incorrect or missing groupings, and missing values.
Comparative algorithms require a reference data set for comparison and logic to determine the correct value [33]. Classification methods rely on rules or patterns to classify objects [33]. These requirements are not as prevalent in customer master data as they are in transactional data. The problem of duplicates differs markedly between master and transactional data. In transactional data, a duplicate is a true tuple duplicate with identical or similar attributes. In master data, duplicates are not as obvious; for example, a customer may have the same name but different addresses, where one address is correct for the customer, and the other is incorrect. Determining the true value in such cases is challenging because there is no consistent rule to follow when faulty attributes vary between tuples.
Furthermore, existing frameworks cannot address all issues simultaneously but must follow a sequence [38]. This sequential approach poses a problem when multiple issues coexist in a single record. While existing algorithms are effective at identifying these problems, they are less effective at solving them and may even create new data quality issues in the process [39]. Consequently, cleansing master data remains a largely manual process [31]. Table 1 summarizes the key themes of our theoretical background.
3. Research Methodology
To extract insights on the utilization of customer analytics by companies, we conducted an in-depth case study of a leading global medical technology provider, referred to here as Medical Inc. for confidentiality purposes. Medical Inc.'s diverse product portfolio includes syringes, needles, lab automation systems, and cell sorters. Headquartered in the United States, the company maintains regional head offices and geographical hubs across major markets worldwide. It operates as a centralized organization, granting minimal autonomy to its geographical markets in altering the operating model or redefining data management processes.
The strategic objective of Medical Inc. is to enhance customer centricity by prioritizing and proactively serving its customers. Consequently, the company has been striving to integrate customer analytics within its sales department. This case study adopts an interorganizational perspective, examining the company's internal departments and their interactions. Specifically, the sales department acts as a customer to the analytics department, which contributes to the customer journey from within the organization.
Our methodology combined traditional case study methods [40] with a processual view and process theorizing [41]. We examined the evolution of Medical Inc.'s IT landscape and data structures over the past years. Data were collected through a series of interviews with technical subject matter experts who have been with the company for several years, and participation in internal workshops. The primary interview questions focused on Medical Inc.'s past, present, and future customer analytics initiatives, targeting the IT landscape, supported processes, and involved data.
These primary data were supplemented with secondary data from internal documents, technical specifications, and project reports. Data collection spanned the entire data cleansing project and included input from both the core team and a broader project support team (e.g., analytic project leaders, customer master data managers, solution architects, data scientists, analysts, and operations managers). The project advanced through internal brainstorming workshops, categorizing key issues into five main topic areas. All collected data were synthesized into a comprehensive case study description.
A content analysis of the case description was conducted to identify the phases of the customer analytics initiatives and pinpoint turning points within these phases, segmenting the journey into phases to elucidate the interconnected events and simplify temporal flows. During phase development, we identified where issues arose, how they were addressed, and anticipated future states. The framework, developed during brainstorming sessions, was iterated through several cycles, incorporating after-action reviews each time. Initially, the problem-solving team focused on German data, providing an opportunity to apply the framework to Austria and Switzerland, thus refining the theory [40].
Recognizing the inherent complexity of process data in data cleansing projects [42], our data analysis began with constructing a timeline of key dates and milestones. Subsequently, an inductive method was used to create a chronological, detailed narrative of the data cleansing initiative, triangulating data from documents, observations, and interviews. Hereby, we applied temporal bracketing strategy [41] to the examination of the chronological process of the data cleansing initiative.
4. Results—Insights Into the Data Cleansing Initiative
Our data analysis revealed that the data cleansing initiative for enhancing customer analytics encompasses three broad phases. These phases interact with other strategic milestones and events driven by Medical Inc. Each phase exhibited distinct characteristics in Medical Inc.'s systems, databases, processes, and governance (see Figure 1).
4.1. Three Main Phases to Utilize Data for Customer Analytics
Phase 1 commenced with the culmination of two significant acquisitions, precipitating a scenario wherein Medical Inc. found itself operating disparate IT systems, each reliant on individual databases. The transition from Phase 1 to Phase 2 ensued as Medical Inc. embarked on the integration of these disjointed systems and databases, concurrently endeavoring to standardize data processes and governance protocols.
Phase 2 was instigated by the implementation of a new ERP system within the framework of an integration initiative, which went live in 2022, with the master data cleansing project slated for completion by 2025. These successive phases were characterized by distinct focal points and actions. Phase 1 was marked by the ramifications of the fragmented system landscape on data and operational processes, a predicament initially sparked by the inaugural acquisition but further exacerbated by subsequent acquisitions. Unlike the larger acquisition, the decision was made during the smaller acquisition in 2015 to refrain from full integration. This smaller acquisition catered to the same customer base, operating on autonomous systems that necessitated disparate data processes across departments, leading to duplicative and disjointed treatment of customer data. Consequently, challenges in customer master data management surfaced.
The transition to Phase 2 was underpinned by concerted integration and harmonization endeavors. The objective here was to establish a unified system with standardized data processing across all departments, culminating in the creation of a singular data model encompassing all integrated systems. However, the severity of master data issues became evident during this phase. While processes were harmonized and an integrated system was implemented, data migration into the new source system proved to be fraught with cleanliness issues. The attainment of the final state of Phase 2 was contingent upon the rectification and alignment of data, thus leading to the subsequent development of a framework.
Phase 3 heralds a forward-looking perspective, envisaging the utilization of refined master data for advanced analytics, facilitated by the establishment of robust data governance frameworks and delineated data flows. This phase will witness enhancements to the BI system and database infrastructure, alongside the standardization of processes. It will encompass detailed descriptions of data structures and delineate contributors for specific analytics tools and functions.
4.2. Data Cleanliness, Integration and Harmonization As A Key Challenge
Medical Inc.’s revenue growth through mergers and acquisitions (phases 1 and 2) let the data cleanliness, integration and harmonization become increasingly intricate, transitioning from the mere amalgamation of physical assets to the incorporation of the digital ecosystem into an established closed ecosystem. Given that Medical Inc. as well as the acquired companies relied heavily on digital processes to support their operations, integrating these processes into existing systems entails disruptions and necessitates meticulous planning. Despite adopting a greenfield approach by establishing a new system for the parent (Medical Inc.) environment, the integration process was not truly greenfield for the data aspect. Recognizing data as one of the most significant assets today, it was imperative to migrate data into new systems to preserve historical transactions.
Medical Inc. made the strategic decision to integrate and modernize its operations by implementing a new ERP system while also integrating the latest acquisition. The project was structured with an implementation plan in waves, gradually rolling out components of the parent company and the majority of the newest acquisition. As depicted in Figure 2, the Medical Inc. operated on one CRM system and two ERP systems, each serving distinct purposes. One ERP system primarily handled financial tasks, while the other managed other operational aspects. These ERP systems, sourced from different timeframes and based on different software platforms (SAP from 2017 and IBM from the 90s), fed into a business intelligence (BI) system. The third ERP system, introduced with the latest acquisition, was an Oracle system that fed into its own BI module, subsequently integrated into the Medical Inc.’s own BI system. The project aimed to consolidate all functions into a single ERP system. Initially, the acquired company and the financial segment of the Medical Inc. were integrated, followed by the consolidation of the remaining operational functions managed by the last ERP system. Given the disparate data models and datasets across these systems, the first crucial step was the data migration. For the integration and migration of customer master data, a cloud-based Master Data Management (MDM) platform was employed, enabling the aggregation of customer master data from various systems while standardizing it by eliminating hierarchies.
As depicted in Figure 2, all customer records were uniformly inputted into the platform. Subsequently, the Master Data Management (MDM) platform commenced the creation of golden records, consolidating identical customers from different systems into singular entities. This process, automated and facilitated by an underlying algorithm, compared various customer-related data elements such as names and addresses.
The establishment of customer hierarchies ensued, utilizing the CRM hierarchies as a blueprint and replicating them within the MDM platform. On a specified date, all pertinent and refined data was migrated into the new ERP system.
With the initial phase and subsequent go-live of the new ERP system, challenges pertaining to master data became pervasive. Notably, erroneous orders were dispatched to incorrect customers, pricing discrepancies for specific customers emerged, and the consignment process encountered impediments. A thorough examination of the Business Intelligence (BI) landscape pinpointed the root cause: inadequate cleanliness and organization of customer master data. Instances arose where unrelated customers were merged, resulting in convoluted customer hierarchies and discrepancies between billing and delivery addresses across systems. These challenges necessitated a temporary suspension of the project.
The illustrative depiction of the fragmented IT landscape (Figure 2) highlights the ongoing efforts to streamline operations. ERP 3 has been replaced by ERP 4, while existing ERP systems are now fed by the new ERP system. All systems are interconnected through the MDM platform, acting as a unifying conduit, and efforts are underway to identify and resolve key data-related issues before resuming work on the original project.
All systems (CRM, ERP, BI) are synchronized, with the MDM platform managing data sources and ensuring alignment across systems. The data model for customer master data entails hierarchical structuring, delineating customer trees with up to eight levels. This hierarchical structure, exemplified by a hospital setting, necessitates meticulous alignment between CRM and ERP systems.
Technical disparities between CRM and ERP systems, particularly in level setup and nomenclature, necessitate precise alignment. The ERP system designates the top customer as a hierarchy node, responsible for grouping accounts and imparting terms to associated transactional accounts. Conversely, the CRM system employs the Top Level Account (TLA) as the highest level, with subsequent sub-accounts categorized based on hierarchy. Specific accounts must be harmonized in their roles across systems.
The MDM platform harmonizes information from both systems, ensuring consistency in account roles and levels across all systems (see Figure 2). This process is guided by a framework developed in response to identified issues and structured around their severity and hierarchical sequence.
4.3. Challenges Identification—Impeding Progress
The data cleansing project team identified five primary areas of concern: i) hierarchy, ii) business Partners, iii) golden records, iv) data quality monitoring, and customer structure. Furthermore, the expansion of the customer database resulted in a significant increase, with 235,000 customer records exclusively in the Germany, Switzerland, and Austria (GSA) region. This surge was attributed to the decision to migrate all customer records, both active and inactive, from all systems, exacerbating the pre-existing challenges within the customer master database. It is worth noting that these issues often manifested concurrently within individual customer records, complicating the identification of accurate data segments and the associated customer identities.
Hierarchy issues stem from discrepancies in the legal customer hierarchies established within the Master Data Management (MDM) platform. Faulty hierarchies originating from the CRM system led to instances where customers were either not linked to any hierarchy, creating "orphans," or linked to incorrect hierarchies, resulting in the amalgamation of unrelated customers within hierarchies. The absence of a clear understanding of the top hierarchy customer's role further compounded these issues, leading to the formation of disparate customer hierarchies with varying structures. Moreover, the hierarchical complexity, reaching up to eight levels, was deemed excessive by the project team.
Business Partner concerns arose from disparities across systems, wherein the MDM platform aimed to unify and cleanse data sources for migration to the new ERP system, while the existing systems remained unaltered, perpetuating data discrepancies. Additionally, inconsistencies in the functions attributed to each customer within systems, along with misaligned naming conventions, contributed to the divergence of data across systems.
The concept of Golden Records within the MDM platform entails consolidating multiple records of the same customer into a single entity. However, discrepancies among customer records, such as slight variations in addresses or post codes, posed challenges in identifying accurate information for the creation of Golden Records, resulting in erroneous customer setups and duplicate Golden Records.
Data Quality Monitoring and Customer Structure issues were identified as separate yet interconnected challenges. While data quality monitoring was hindered by the absence of a governance framework, customer structure issues stemmed from a lack of guidelines on how customer master data should be structured. Although these issues were not directly linked to data cleanliness, they served as foundational factors contributing to data discrepancies.
4.4. Proposed Solution for Overcoming These Challenges
To address these challenges, the project team proposed a multi-faceted approach. Initially, a comprehensive cleansing of existing data was proposed to rectify hierarchy, business partner, and Golden Record issues. Subsequently, the establishment of a governance process aimed at preventing future instances of data uncleanliness was recommended. Additionally, the creation of a data handbook outlining guidelines for structuring customer master data was proposed to ensure consistency and accuracy in future data management efforts.
At the start of the rollout, there were 235,000 customer records in the system. Within a few months, 126,000 inactive accounts were removed. Beginning with Germany, the GSA team conducted an in-depth analysis to further reduce unnecessary customer records. They defined "needed" and "not needed" records based on an activity list, which included CRM object usage, sales from the last three years, open invoices older than three years, technical service records, and asset placements.
The team interviewed stakeholders from each business unit to understand the actions taken with each customer record in the CRM system. They created reports from the relevant systems and mapped this information to each customer record. Records with no activity were considered unnecessary and were deactivated. This reduced the German customer base from 74,000 to 34,000 records.
Next, the team began cleansing activities by addressing the hierarchical customer setup. They started at the top of the customer trees, breaking down the customer base into manageable parts and creating a new basis for each customer tree. They created an overview of all Top-Level Accounts (TLAs), including orphans, and included records from ERP4 (the new ERP system), MDM, CRM, ERP1, and ERP2. ERP4, MDM, and CRM records had a one-to-one relationship, but MDM to ERP2 and ERP1 to ERP2 records had many-to-one relationships, adding complexity. Therefore, the team focused on cleansing the newest ERP system and the CRM system first.
Each team member reviewed assigned packages of TLA records to decide if they were true TLAs, orphans needing an upgrade, needed to be attached to an existing TLA, or required the creation of a new TLA. These decisions were based on the customer's name and address information found in the systems and online. Duplicate records were identified and consolidated. This first validation round created a new TLA base to work with.
The next step was validating the “child” accounts linked to the TLAs. The customer record overview was updated with the new TLAs, including all levels of the customer trees, their respective IDs, addresses, and sales data. The team checked if the parent account was correct and remapped it if necessary. This step ensured clean reporting at the TLA level, which was critical for business intelligence and other functions that determine prices and agreements.
The first part of the data handbook was prepared to guide teams on how customers should be set up in the system. This enabled clean reporting for group purchasing organizations or lab groups, ensuring that pricing and terms set at the TLA level translated correctly to child accounts, solving pricing and delivery issues caused by incorrect parenting.
The next stage involved correcting the levels within each customer tree, merging duplicate accounts, assigning customer categories, and adding specific data points like the number of beds for hospitals and the German unique hospital identifier. This required visualizing and sorting the customer tree correctly according to the data handbook, understanding each entity, and enriching the tree with additional data. Customer categories helped in strategic business planning by addressing the needs of different markets, such as hospitals, laboratories, or outpatient care.
Finally, the team corrected names, addresses, and other customer information and aligned business partners across systems. This step improved the readability and transparency of customer records, making it easier to identify the correct customer for any function, such as order management, and reducing the creation of new accounts due to incorrect information. Streamlining the business partner ensured consistency across systems.
4.5. A framework for a Customer Master Data Cleansing Process
The insights emerging from the Medical Inc. can be translated into a more general framework about the customer master data cleansing process. The emerging framework would consist of two core activities with nine subsequent key tasks. The core activities capture first the 1) problem collection activities and afterwards 2) master data cleansing activities. The initial problem collection activity included 1a) problem identification, 1b) major problem categorization, 1c) problem prioritization, 1d) problem preparation tasks. The later master data cleansing activity consists of five tasks: 2a) setting up a customer base overview, 2b) deactivating unnecessary customer, 2c) reassigning top customers, 2d) assigning sub-customers to top customers, and 2e) cleansing up customer trees. Table 2 summarizes these key activities and key tasks according to their objectives, steps, and outcomes.

Table 2.
A framework for customer master data cleansing.
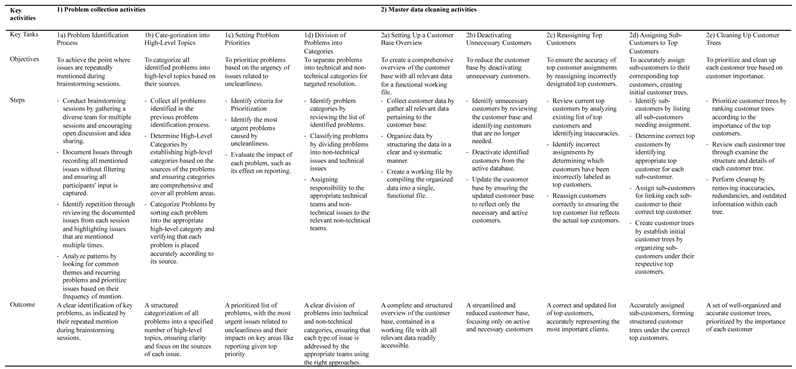 |
The process begins with problem identification, which entails recognizing recurring issues during brainstorming sessions. Following this, problems are categorized into high-level topics, emphasizing the importance of aligning categories with their respective problem sources. Subsequently, problem priorities are adjusted to address the most urgent issues, particularly those stemming from uncleanliness, such as its impact on reporting. Problems are then classified into technical and non-technical categories to facilitate tailored solutions by different teams. Non-technical issues, closely linked to uncleanliness, diverge into a separate path. This path involves establishing a comprehensive overview of the customer base, deactivating unnecessary customers, and correcting top customer assignments. Next, sub-customers are assigned to their correct top customers to form initial customer trees. Finally, each customer tree is systematically cleaned up, with priority given to customers based on their importance.
5. Conclusions
This study highlights the challenges and critical activities necessary for successful data monetization through customer analytics [20], especially within the context of a legacy IT environment [16,18]. Our case study of Medical Inc. reveals that data cleaning, preparation, and harmonization are foundational for deriving value from customer data [22]. Insights gleaned from Medical Inc.'s endeavors offer a valuable framework for a generalized customer master data cleansing process, comprising problem identification, categorization, prioritization, and subsequent cleansing activities. This structured framework underscores the iterative nature of data management, emphasizing continuous evaluation and refinement to maintain data integrity and drive informed decision-making.
We propose a nine-step framework within the phase of pre-digitalization (datatization), emphasizing that digitization alone is insufficient for achieving digital transformation. Companies must integrate key activities into a comprehensive approach, addressing both the theoretical and practical aspects of data utilization. We phrase this as datatization. Datatization refers to the process of converting various forms of data into data that can be quantified, analyzed, and utilized in analytics systems. This involves capturing, storing, and organizing data from diverse sources, transforming it into structured formats suitable for computational analysis and decision-making processes. Datatization enables the extraction of actionable insights, supports data monetization strategies, and facilitates the integration of data into broader digital ecosystems.
This research not only fills gaps in existing literature but also offers a structured path for companies aiming to leverage customer analytics effectively. Future research should further explore the dynamic interactions between legacy systems and data monetization initiatives, providing deeper insights into overcoming the associated challenges [2,3].
In conclusion, the comprehensive analysis of Medical Inc.'s data cleansing initiative for enhancing customer analytics has shed light on a structured approach encompassing three vital phases: initial assessment and planning, implementation and execution, and evaluation and refinement. These phases have unfolded within the context of Medical Inc.'s strategic milestones and events, elucidating distinct characteristics across its systems, databases, processes, and governance.
| 1 | The terms "data cleaning" and "data cleansing" are often used interchangeably in data management and analytics. However, subtle distinctions can sometimes be made depending on context or specific industry practices. Data cleaning generally refers to the process of identifying and rectifying errors or inconsistencies in data to improve its quality. This includes tasks like correcting typographical errors, handling missing values, and removing duplicate records. Data cleaning typically involves surface-level tasks that address immediate, apparent issues in the data. Data cleansing is a more comprehensive process that involves ensuring the data is not only free from errors but also accurate, consistent, and usable for its intended purpose. This might include verifying data against external sources, ensuring data integrity, and standardizing formats across datasets. Data cleansing encompasses a broader range of activities, often with a deeper focus on the overall quality and reliability of the data. Thus, we use the term data cleansing in the paper. |
References
- Danuso, A.; Giones, F.; and da Silva, E.R. The digital transformation of industrial players. Bus. Horiz., 2022, 65(3), 341-349. [CrossRef]
- Wixom, B.H.; Piccoli, G.; and Rodriguez, J. Fast-track data monetization with strategic data assets. MIT Sloan Manag. Rev., 2021, 62(4), 1-4.
- Zhang, X.; Yue, W.T.; Yu, Y.; Zhang, X. (2023). How to monetize data: An economic analysis of data monetization strategies under competition. Decis. Support Syst., 173, 114012. [CrossRef]
- Top Trends in Data and Analytics 2024. Available Online: https://www.gartner.com/smarterwithgartner/gartner-top-10-data-and-analytics-trends-for-2021 (accessed 24 July 2024).
- How to monetize your customer data. Available Online: https://www.gartner.com/smarterwithgartner/how-to-monetize-your-customer-data/ (accessed 24 July 2024).
- How to create a business case for data quality improvement. Available Online: https://www.gartner.com/smarterwithgartner/how-to-create-a-business-case-for-data-quality-improvement/ (accessed 24 July 2024).
- Ritala, P.; Keränen, J.; Fishburn, J.; Ruokonen, M. Selling and monetizing data in B2B markets: Four data-driven value propositions. Technovation, 2024, 130, 102935. [CrossRef]
- Najjar, M.S.; Kettinger, W.J. Data Monetization: Lessons from a Retailer's Journey. MIS Q. Exec., 2013, 12(4), 213-225.
- Saarikko, T.; Westergren, U.H.; Blomquist, T. Digital transformation: Five recommendations for the digitally conscious firm. Bus. Horiz., 2020, 63(6), 825–839. [CrossRef]
- Kokkinou, A.; van Kollenburg, T.; Mandemakers, A.; Hopstaken, H.; and van Elderen, J. (2023). The data analytic capability wheel: an implementation framework for digitalization. In 36th Bled eConference: Digital Economy and Society: the Balancing Act for Digital Innovation in Times of Instability.
- Legner, C.; Eymann, T.; Heß, T.; Matt, C.; Böhmann, T.; Drews, P.; Mädche, A.; Urbach, N.; Ahlemann, F. Digitalization: opportunity and challenge for the business and information systems engineering community. Bus. Inform. Syst. Eng., 2017, 59(4), 301–308. [CrossRef]
- Tilson, D.; Lyytinen, K.; and Sørensen, C. Research commentary—Digital infrastructures: The missing IS research agenda. Inf. Syst., 2010, 21(4), 748-759. [CrossRef]
- Brynjolfsson, E.; McAfee, A. The second machine age: Work, progress, and prosperity in a time of brilliant technologies. 2014, WW Norton & Company.
- Machado, C.G.; Winroth, M.; Carlsson, D.; Almström, P.; Centerholt, V.; and Hallin, M.C.. Industry 4.0 readiness in manufacturing companies: challenges and enablers towards increased digitalization. Procedia CIRP, 2019, 81, 1113–1118. [CrossRef]
- Ofulue, J.; Benyoucef, M. Data monetization: insights from a technology-enabled literature review and research agenda. 2022, Manag. Rev. Q., 1-45. [CrossRef]
- Wixom, B.H.; and Ross, J.W. How to monetize your data. MIT Sloan Manag. Rev., 2017, 58(3), 10–13.
- Faroukhi, A.Z.; El Alaoui, I.; Gahi, Y.; Amine, A.. Big data monetization throughout Big Data Value Chain: a comprehensive review. 2020, J. of Big Data, 7, 1-22. [CrossRef]
- Wixom, B.; Yen, B.; Rellich, M. Maximizing value from business analytics. MIT Sloan Manag. Rev., 2013, 12, 111–123.
- Kietzmann, J.; Paschen, J.; Treen, E.. Artificial intelligence in advertising: How marketers can leverage artificial intelligence along the consumer journey. J. Advert., 2018, 58(3), 263-267.
- Sivarajah, U.; Kamal, M.M.; Irani, Z.; Weerakkody, V.. Critical analysis of Big Data challenges and analytical methods. J. Bus. Res., 2017, 70, 263-286. [CrossRef]
- Sanders, N.R. How to use big data to drive your supply chain. Calif. Manage. Rev., 2016, 58(3), 26-48. [CrossRef]
- Tabesh, P.; Mousavidin, E., Hasani, S.. Implementing big data strategies: A managerial perspective. Bus. Horiz., 2019, 62(3), 347-358. [CrossRef]
- Erevelles, S.; Fukawa, N.; Swayne, L. Big Data consumer analytics and the transformation of marketing. J. Bus. Res., 2016, 69(2), 897-904. [CrossRef]
- Hossain, M.A.; Akter, S.; Yanamandram, V.; and Wamba, S.F. Data-driven market effectiveness: The role of a sustained customer analytics capability in business operations. Technol. Forecast. Soc. Change, 2023, 194, 122745. [CrossRef]
- Velcu-Laitinen, O.; Yigitbasioglu, O. The Use of Dashboards in Performance Management: Evidence from Sales Managers. Int. J. Digit. Account. Res., 2012, 12, 36–58. [CrossRef]
- What Is Customer Analytics? Available online: https://www.forbes.com/advisor/business/customer-analytics/ (accessed 24 July 2024).
- Chen, H.; Chiang, R.H.; Storey, V.C. (2012). Business intelligence and analytics: From big data to big impact. MIS Q., 2012, 36(4), 1165-1188. [CrossRef]
- Dover, C. How dashboards can change your culture. Strat. Fin., 2004, 86(4), 42.
- Pappas, L. M.; Whitman, L.. Riding the technology wave: Effective dashboard data visualization. In Lecture Notes in Computer Science, 2011, (pp. 249–258).
- Watson, H. J.; Goodhue, D.L.; Wixom, B.H. The benefits of data warehousing: why some organizations realize exceptional payoffs. Inform. Manage, 2002, 39(6), 491–502. [CrossRef]
- Gudivada,V.N., Apon, A., & Ding, J. Data Quality Considerations for Big Data and Machine Learning: Going Beyond Data Cleaning and Transformations. Intern. J. Advan. Soft.. 2017, 10(1), 1-20.
- Renear, A. H.; Sacchi, S.; Wickett, K.M. Definitions of dataset in the scientific and technical literature. Proceedings of the Association for Information Science and Technology, 2010, 47(1), 1–4.
- Lee, G. Y., Alzamil, L., Doskenov, B., & Termehchy, A. (2021). A survey on data cleaning Methods for Improved Machine learning model Performance. arXiv (Cornell University).
- McGilvray, D. Executing Data Quality Projects: Ten Steps to Quality Data and Trusted Information TM. 2008, Academic Press.
- Wedekind, H. Bestandsdaten, Bewegungsdaten, Stammdaten. Lexikon der Wirtschaftsinformatik. 1997, Springer, Berlin, p. 61.
- Arnold, J., & Hammwöhner, R. Data Integration and Data Cleaning: Solutions for Improving Data Quality. Springer, 2022.
- Mahdavi, M., Neutatz, F., Visengeriyeva, L., & Abedjan, Z. (2019). Towards automated data cleaning workflows. Mach. Learn., 15, 16.
- Ridzuan, F., and Zainon, W. A review on data cleansing methods for big data. Procedia Comput. Sci., 2019, 161, 731–738. [CrossRef]
- Eisenhardt, K.M. Building Theories from Case Study Research. Acad. Manage. Rev., 1989, 14(4), 532-550.
- Langley, A. (1999). Strategies for theorizing from process data. Acad. Manage. Rev., 24(4), 691-710.
- Langley, A.; Smallman, C.; Tsoukas, H.; Van De Ven, A.H. Process Studies of Change in Organization and Management: unveiling temporality, activity, and flow. Acad. Manage. J., 2013, 56(1), 1–13. [CrossRef]
Figure 1.
Temporal brackets describing the three key phases.
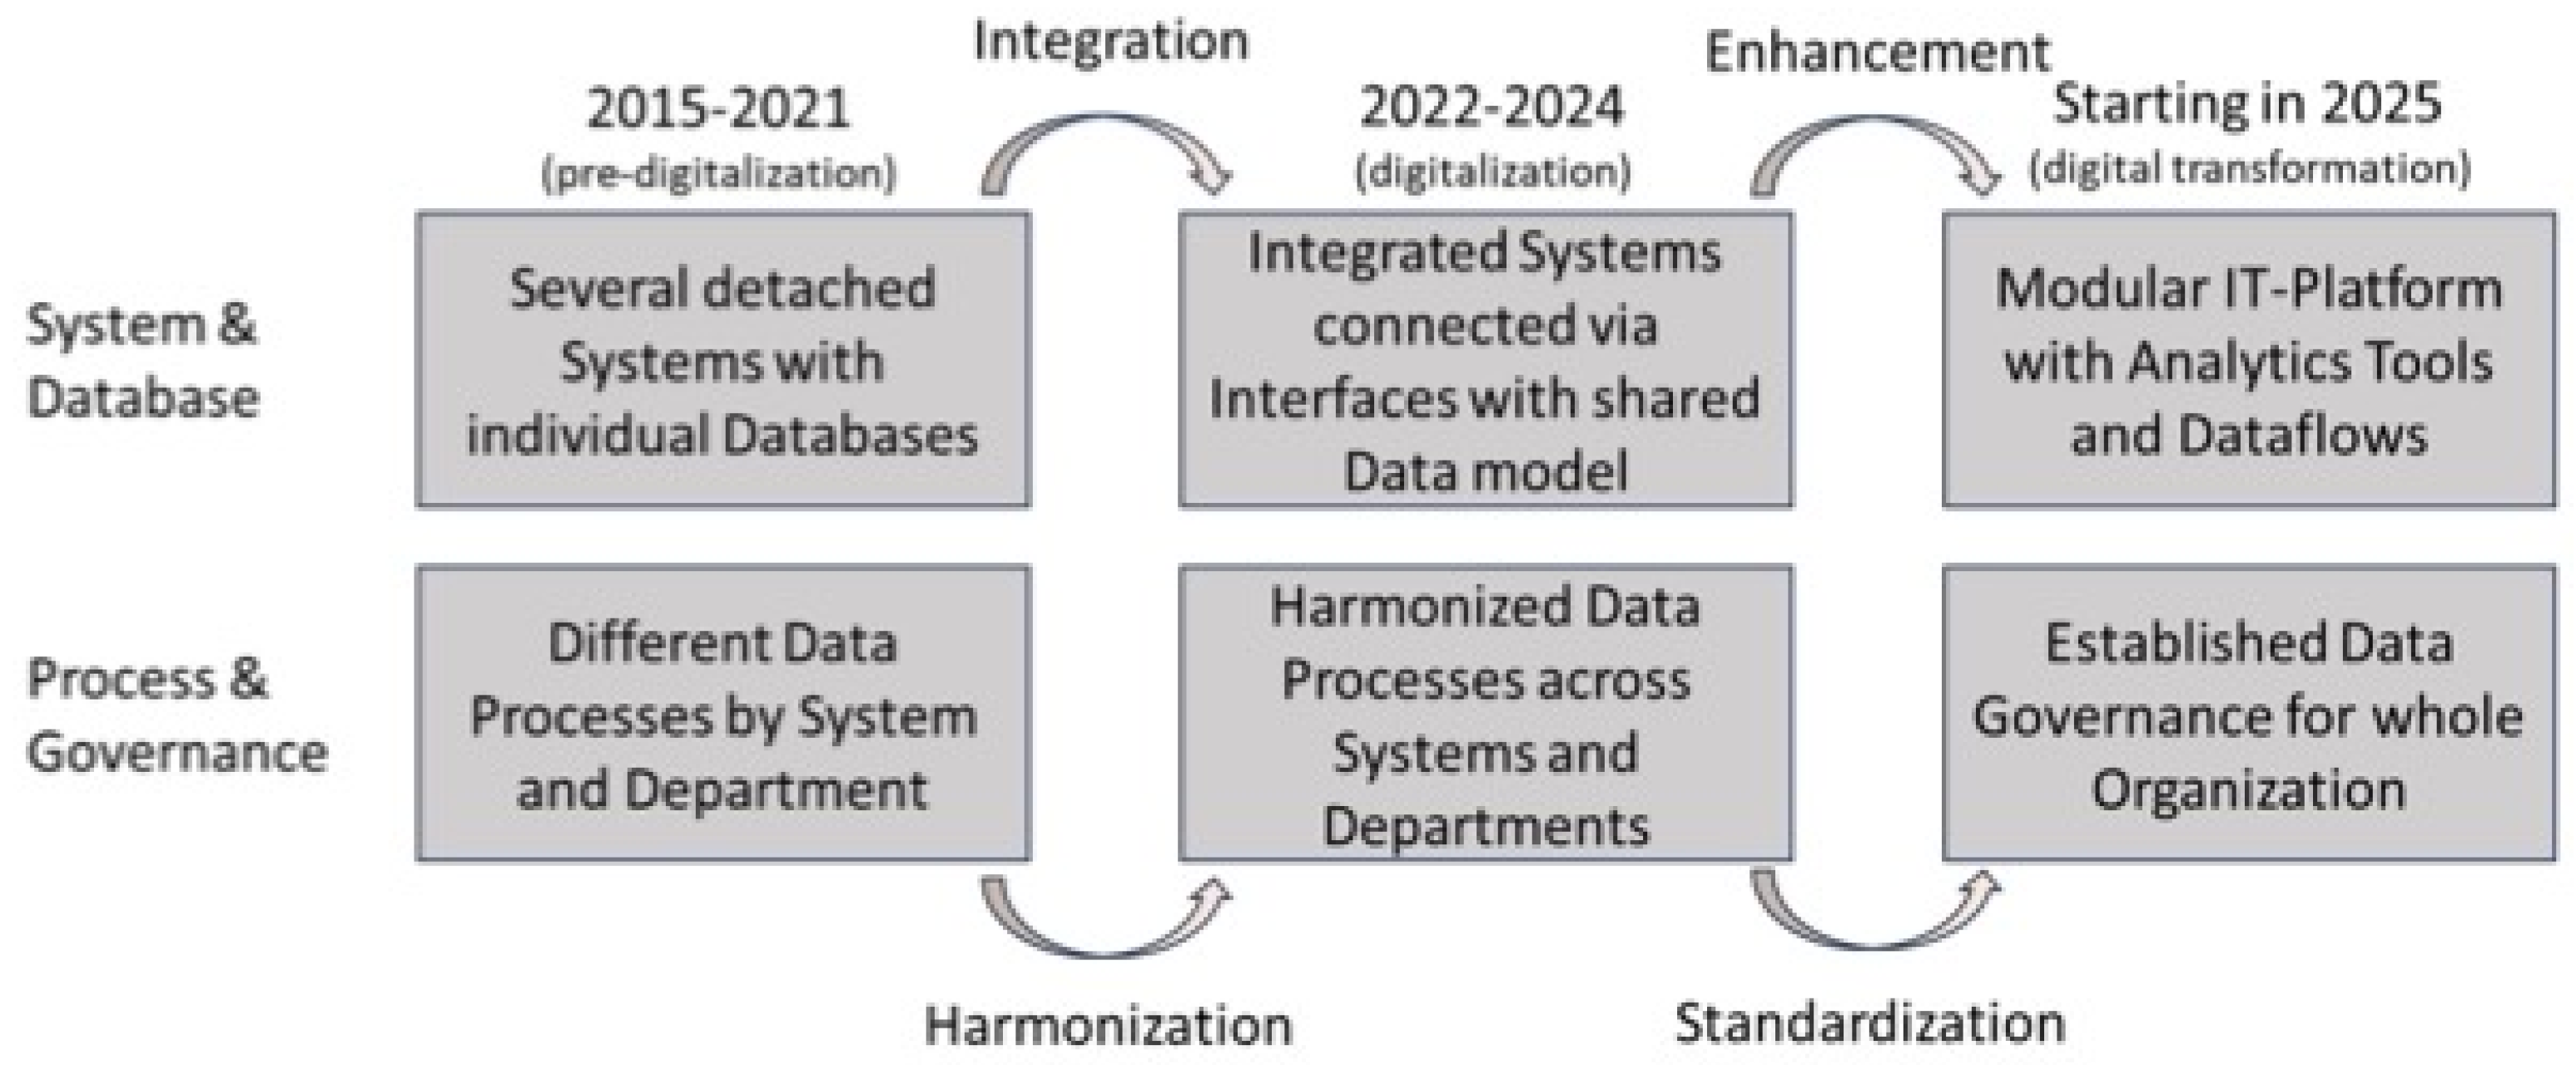
Figure 2.
Key issues for customer master data cleaning.
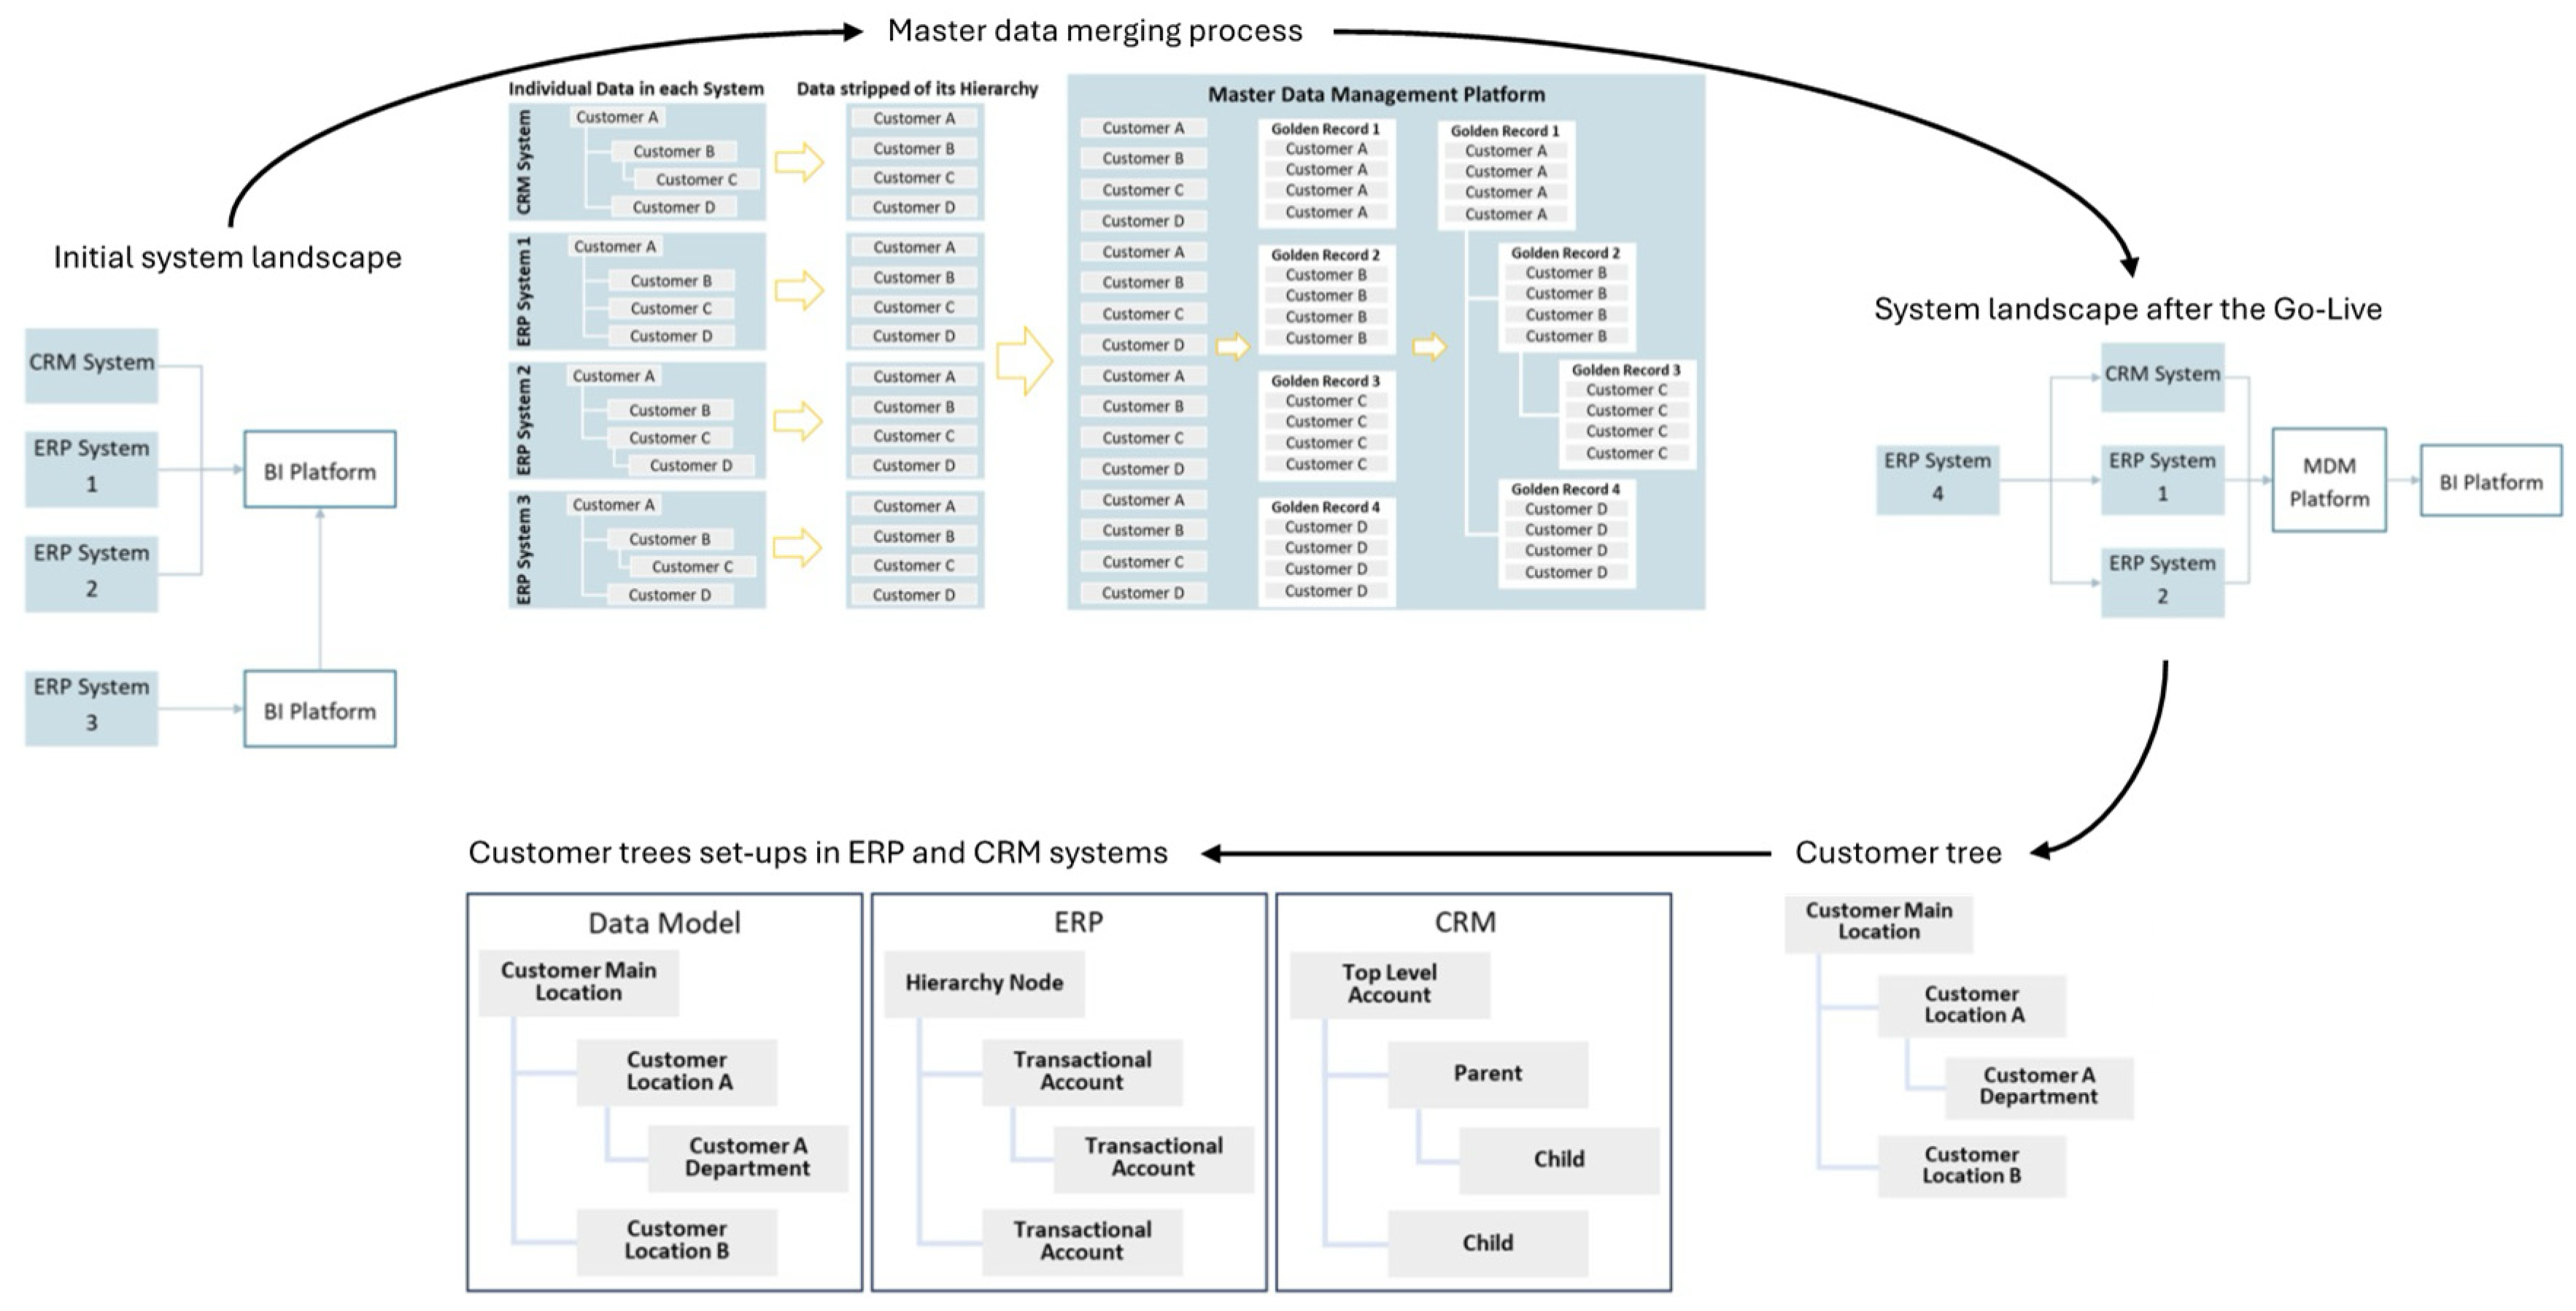
Table 1.
Overview of the key theme summaries of the theoretical background.
| Key Research Theme | Summary |
|---|---|
| Digitization, Digitalization, and Digital Transformation | Research explores the concepts of digitization, digitalization, and digital transformation. Digitization involves converting analog signals into digital ones, separating data from its medium. Digitalization involves integrating digital technologies into organizational processes to create new value opportunities. Digital transformation immerses the entire enterprise in digital methods, extending beyond processes and data to impact operations, business models, and competencies. |
| Data Monetization | Data monetization is integral to discussions on digitization, digitalization, and digital transformation. It involves deriving economic benefits from available data sources through direct or indirect methods. Direct methods include data sales, licensing, and participation in data marketplaces. Indirect methods involve utilizing data to optimize internal operations, refine products, or enhance services. |
| Data Structuring and Data Analytics | Data cleaning, preparation, and harmonization are crucial for effective data monetization. The process of big data analytics comprises four phases: turning data into insights, transforming insights into decisions, translating decisions into actions, and generating data points for future decision-making. Companies should progress through four stages of maturity in developing data analytics capabilities: data structuring, data availability, basic analytics, and advanced analytics. |
| Customer Analytics | Data cleaning is essential for customer analytics, enabling businesses to make data-driven decisions and enhance customer engagement, marketing effectiveness, and profitability. It involves examining and interpreting customer data to understand and predict behavior, preferences, and trends. Customer analytics empowers sales representatives and managers to increase revenue and improve customer satisfaction and loyalty. |
| Algorithms for Data Integration & Cleaning | Various algorithms facilitate data integration and cleaning, ensuring data quality, consistency, and reliability for analytics and decision-making. These algorithms include entity resolution, schema matching, data fusion, ontology-based integration, missing value imputation, outlier detection and removal, normalization and standardization, text cleaning, and data transformation. Advanced techniques such as deep learning, reinforcement learning, and graph-based algorithms enhance data cleaning effectiveness. |
Disclaimer/Publisher’s Note: The statements, opinions and data contained in all publications are solely those of the individual author(s) and contributor(s) and not of MDPI and/or the editor(s). MDPI and/or the editor(s) disclaim responsibility for any injury to people or property resulting from any ideas, methods, instructions or products referred to in the content. |
© 2024 by the authors. Licensee MDPI, Basel, Switzerland. This article is an open access article distributed under the terms and conditions of the Creative Commons Attribution (CC BY) license (http://creativecommons.org/licenses/by/4.0/).
Copyright: This open access article is published under a Creative Commons CC BY 4.0 license, which permit the free download, distribution, and reuse, provided that the author and preprint are cited in any reuse.


