
Submitted:
30 June 2024
Posted:
10 July 2024
You are already at the latest version
Abstract
Background: The goal of the study was to analyze variations in central, perifoveal, and peripheral retinal thickness (RT) and choroidal thickness (CT) in patients with diabetic macular edema (DME) measured with ultra-wide-field optical coherence tomography (UWF-OCT). Additionally, correlations between RT and CT in the central, perifoveal, and peripheral sectors and the presence of selected systemic factors were evaluated. Methods: A total of 74 consecutive adult diabetic patients with DME and 75 healthy controls were included. Study participants were divided into three groups: DME patients without panretinal photocoagulation (PRP; 84 eyes), DME patients after PRP (56 eyes), and healthy controls (125 eyes). RT and CT were analyzed in three zones: a central circle of 3 mm diameter (Central), a ring contained between a centered 9 mm circle and the central 3 mm circle (Perifoveal), and a second, more peripheral ring between centered 18 mm and 9 mm circles (Peripheral). Additionally, DME subgroups were analyzed according to the correlation of RT and CT with age, axial length, best corrected visual acuity (BCVA), diabetes duration, insulin therapy duration, body mass index (BMI), glycosylated hemoglobin (HbA1c) values, intravitreal injection (IVI) count, and the advancement of retinopathy assessed by the simplified diabetic retinopathy severity scale (DRSS). Results The increase in RT in the far peripheral sectors in DME patients was not significant. The increase in central and perifoveal RT and CT in PRP-naïve DME patients was strongly associated with poorer BCVA. Patients with DME after PRP presented with BCVA improvements significantly related to the number of IVIs. The amount of DME and RT in peripheral sectors were both independent of systemic factors such as BMI, duration of diabetes, duration of insulin intake, retinopathy severity, and HbA1c levels. Conclusion Peripheral retinal sectors in DME patients are less affected in terms of increase in their thickness compared to central ones. UWF-OCT provides valuable information on retinal and choroidal involvement in diabetic retinopathy complicated by DME.
Keywords:
ultra-wide-field optical coherence tomography
; choroidal thickness
; retinal thickness
; diabetic macular edema
; diabetes
Introduction
The occurrence of diabetic macular edema (DME) has been associated with many systemic and local factors. The most important systemic associations include the duration of diabetes, glycemic control, insulin dependence, kidney functional status, and body mass index (BMI) [1,2,3,4]. Among local factors analyzed in the context of DME incidence are retinopathy severity, axial length, and choroidal thickness (CT) [5,6,7]. In modern ophthalmology, DME can be measured with software tools available in spectral domain optical coherence tomography (SD-OCT) devices. Such equipment enables the evaluation of retinal morphology and the measurement of central subfoveal thickness (CST), the parameter that, to some extent, characterizes DME severity. Modern OCT devices make it possible to measure CT as well. This anatomical structure plays an important role in nourishing the retina, and its impairment might result in retinal tissue alterations, DME notwithstanding. Associations between different factors and the amount of DME measured with SD-OCT have been analyzed in many studies engaging standard field devices [8,9,10,11]. Nevertheless, the employment of wide-field (WF) OCT in such analysis is rare, as this technology has been just introduced to clinical practice. WF-OCT with modern equipment provides CT and retinal thickness (RT) values in the peripheral sectors. As retinal periphery status plays an important role in the development of DME, numerical analysis of the peripheral and choroidal sectors might provide additional information to analyze this relationship. The goal of our study was to analyze variations in central, perifoveal, and peripheral RT and CT in patients with DME measured by ultra-wide-field OCT (UWF-OCT). Additionally, we sought correlations between RT and CT in the central, perifoveal, and peripheral sectors and the presence of selected systemic factors.
Materials and Methods
The study was conducted according to the Declaration of Helsinki and approved by the local ethical board of Dobry Wzrok Ophthalmological Clinic (No. 3/2024).
The study involved 74 consecutive adult patients treated for DME and diabetic retinopathy at the Specialist Hospital in Chojnice and 75 consecutive healthy adult controls in an occupational program examined in the outpatient clinic of the same hospital. All patients were subject to basic ophthalmological examinations that included anterior and posterior segment evaluation, intraocular pressure measurement, and best corrected visual acuity (BCVA) testing. Patients with opacity of optical media that prevented the acquisition of quality OCT scans were excluded from the study. Additionally, the DME patients’ medical histories were reviewed for diabetes duration, insulin dependence and duration of intake, current HbA1c (glycosylated hemoglobin) values, BMI, number of received intravitreal injections, and peripheral panretinal photocoagulation (PRP). As peripheral laser treatment might significantly affect RT and CT, patients with PRP were analyzed as a separate study subgroup. In all cases, PRP was performed longer than 6 months before the UWF-OCT measurements.
For the control group, eyes without ocular pathologies or previous ocular surgical treatments were initially qualified for WF-OCT testing. Patients with systemic diseases, such as diabetes, metabolic disorders, and hypercholesterolemia, or pregnancy, which could influence the results, were also excluded from the control group.
After the application of the exclusion criteria, the study participants were divided into three groups: DME patients without PRP (84 eyes), DME patients after PRP (56 eyes), and healthy controls (125 eyes). The demographics of the study and control groups are provided in Table 1.
All patients underwent WF-OCT testing performed after pupil dilation with swept-source Xephilio OCT-S1 (Canon Medical Systems Europe B.V., 2023), which enables the widest scan of 23 × 20 mm. Measurements are performed in 24 fields. For the purpose of this study, the 24 fields were merged into three zones for easier evaluation: a central circle of 3 mm diameter (Central), a ring contained between a centered 9 mm circle and the central 3 mm circle (Perifoveal), and a second, more peripheral ring between centered 18 mm and 9 mm circles (Peripheral); see Figure 1.
The data obtained from the three groups were analyzed according to RT and CT in all three zones. Additionally, the DME subgroups (with and without PRP) were analyzed according to the correlation of RT and CT with age, axial length, BCVA, diabetes duration, insulin therapy duration, BMI, HbA1c values, intravitreal injection (IVI) count, and advancement of retinopathy assessed by the simplified diabetic retinopathy severity scale (DRSS; five stages) [12,13].
Examples of UWF-OCT scans of patients with DME are presented in Figure 2a and 2b.
Statistical procedures
Categorical variables were presented as integer numbers and percentages. Numerical traits were described by their mean, median, standard deviation, and lower-to-upper quartile values. The normality of the distribution was tested using the Shapiro–Wilk W test. Levene’s test was used to assess the homogeneity of variances. A multifactorial analysis of variance (ANOVA) without replications was performed to test the significance of differences in normally distributed numerical traits between the study groups. For non-normally distributed measures, generalized linear models were fitted. After the omnibus tests, post hoc multiple comparisons were carried out when applicable. A level of p < 0.05 was considered statistically significant. All tests and computations were performed using Statistica™, release 13.2 (TIBCO Software Inc., Palo Alto, CA, USA).
Results
All three groups were compared according to age, axial length, and received laser treatment. A significant variance of results was observed for BCVA, with the control group having significantly better BCVA, but not for the other two analyzed factors. Table 2 presents the variance between the groups in age, axial length, and BCVA.
The comparison of RT and CT between the three groups in the three defined sectors is presented in Table 3. No significant difference in CT was noted between the groups in any sector. Significant differences were observed in RT, however. The control group had the lowest RT values in all three sectors compared to the DME groups. The laser group presented with the highest RT values in all sectors; however, a statistically significant difference from the no laser group was observed for the perifoveal ring (p = 0.0125) but not the peripheral.
Table 4, Table 5, Table 6 and Table 7 present the relationships between analyzed factors and RT and CT for the DME subgroups. A significant relationship was found between BCVA and RT and CT in the central and perifoveal sectors only for the subgroup not treated with laser. A lower CT correlated with older age in all sectors for the no laser group only. A higher IVI count strongly correlated with lower values of RT for the PRP subgroup of DME patients.
No other significant relationships were found for the study groups with reference to other analyzed factors: axial length, level of HbA1c, BMI, duration of diabetes, DRSS, and duration of insulin therapy.
Discussion
The subject of retinal and choroidal thickness in patients with diabetes mellitus, especially cases complicated by diabetic retinopathy, has been analyzed in many studies that employed standard field OCT [8,9,10,11]. WF-OCT testing has not been employed for such research so far, and our study is, to our knowledge, the first to do so. UWF-OCT provides additional information on peripheral RT and CT and thus enables evaluation of the involvement of this anatomical sector in diabetic retinopathy. As peripheral laser treatment (PRP) significantly affects RT and CT, correlations between DME and UWF-OCT measurements should be sought, particularly for laser-naïve cases. The results of the present study generally revealed similar patterns for RT and CT in the perifoveal and central sectors. An obvious increase in central RT in DME patients also extended to the perifoveal sectors. The retinal periphery, however, was affected to a lesser extent. DME patients who did not receive PRP had a peripheral RT that did not significantly differ from that of controls. Such a difference was, however, observed in patients who received PRP treatment and hence had severe non-proliferative or proliferative retinopathy. It is plausible that laser-induced peripheral retinal nerve fiber layer thinning was compensated in these patients but a tendency for retinal thickening due to retinopathy was present [14,15].
Significant variations in CT in DME patients versus controls were not noted in our work in any sector. This outcome was also reported by other authors, who did not link the central RT with central CT in DME patients [16]. On the other hand, some studies showed long-term reductions in subfoveal CT after PRP [17,18]. It must be noted, however, that our study involved the analysis of CT in larger sectors, and it is plausible that mean CT variations after PRP in larger areas are smaller compared to those observed and reported in the limited area under the fovea.
The morphological findings of the UWF-OCT measurements in DME patients were also reflected in retinal function. PRP-naïve patients presented with BCVA strongly correlated with RT in the central and perifoveal sectors: better BCVA was related to a lower RT in these regions. The peripheral retina, however, did not show such a relationship. On the other hand, patients who received laser treatment did not present with such a correlation at all. Previous research showed that retinal architecture, not only RT, affects visual outcomes in diabetic retinopathy (DR) [19]. Moreover, in a milestone Diabetic Retinopathy Clinical Research network (DRCR net) group study, only a moderate correlation between central point RT and BCVA was noted [20]. In our research, a significant correlation between RT and BCVA in laser treatment-naïve patients was found for larger central areas (3 mm and 9 mm in diameter). Hence, it can be speculated that the correspondence of RT and BCVA in DR is noted at its earlier stages and in cases with an extension of retinal thickening to parafoveal regions. Possibly, mean values of RT in larger sectors might serve as a predictor of preservation of visual function in DR.
Smaller CT values at the retinal center and perifoveal sector correlated with worse BCVA in laser-naïve patients. Again, such a relationship was not noted for the choroidal periphery. Hence, the condition of the peripheral choroid does not affect visual function as much as its center. The involvement of CT in visual outcomes in DR was analyzed in other standard field studies. A higher CT was a predictor for better BCVA improvements after anti-VEGF therapy [21]. A lower central CT was also associated with more severe retinopathy that presented with poorer BCVA [22]. These findings remain in consent with our results, proving better BCVA in cases with greater central CT.
CT in DME patients has a strong correlation to the patient’s age. This relationship, assessed in patients who did not receive laser treatment, proved to be true for all sectors including the choroidal periphery. Patients after PRP showed such a relationship only for the central choroidal sector. A decrease in CT with age in all sectors was observed in healthy individuals as well, as shown by a previous UWF-OCT publication by the same authors [23]. Thus, it can be stated that the sole presence of DME does not influence this correlation in a significant way.
The number of received IVIs was significantly related to a reduction in RT in all sectors, but only for patients after PRP. Such a relationship was not noted for patients who received IVI treatment alone. Thus, it can be speculated that peripheral retinal ablation in DR provides more consistent morphological outcomes of IVI management with reference to the retinal center. Intravitreal therapy without peripheral laser in DR was associated with a higher variance of RT despite the received treatment. Nevertheless, recent high-quality research did not show a reduction in the number of IVIs or differences in BCVA improvement in patients with DME who underwent PRP targeted at ischemic areas [24,25]. Hence, a more straightforward reaction to IVI treatment does not necessarily mean a lower number of required injections in the long term.
The lack of correlation between RT and CT and other factors, especially systemic ones, proves that morphological changes of the choroid and retina in diabetic retinopathy are related to multiple factors, not just selected ones. Interestingly, RT and CT were independent of DRSS grading. This finding proves that RT in DME patients does not necessarily increase in consent with the severity of retinopathy. It is difficult to relate our results to other published research. Only a few studies analyzed the relationship between DME severity and systemic factors in diabetes. These studies proved such relationships only for systemic inflammatory biomarkers [26,27,28]. Other systemic factors were analyzed in the context of DME incidence or response to its treatment, not specific RT and CT values [29,30,31,32]. Among such factors, high levels of HbA1c or a lower estimated glomerular filtration rate were named most often.
Conclusions
UWF-OCT provides valuable information on retinal and choroidal involvement in diabetic retinopathy complicated by DME. Peripheral retinal sectors in DME patients are less affected in terms of increase in their thickness compared to central ones. An increase in central and perifoveal RT and CT in PRP-naïve patients with DME is strongly associated with poorer BCVA. An association of peripheral RT and CT with BCVA was not found. Patients with DME after PRP present with BCVA improvements significantly related to the number of IVIs. The amount of DME and RT in peripheral sectors was independent of systemic factors such as BMI, duration of diabetes, duration of insulin intake, and HbA1c levels.
Author Contributions
Conceptualization, M.G and K.K.; methodology, M.G. and K.K.; formal analysis, K.K.; writing—original draft preparation, M.G.; writing—review and editing, M.G. and K.K.; supervision, M.G. All authors have read and agreed to the published version of the manuscript.
Funding
This research received no external funding.
Institutional Review Board Statement
This study was conducted in accordance with the Declaration of Helsinki and approved by the Institutional Review Board of Dobry Wzrok Ophthalmological Clinic (No. 3/2024 dated 03.02.2024).
Informed Consent Statement
Informed consent was obtained from all the participants of the study.
Data Availability Statement
Supporting data are available upon reasonable request.
Conflicts of Interest
The authors declare no conflicts of interest.
References
- Tarasewicz, D.; Conell, C.; Gilliam, L.K.; Melles, R.B. Quantification of risk factors for diabetic retinopathy progression. Acta Diabetol. 2023, 60, 363–369. [Google Scholar] [CrossRef] [PubMed]
- Kume, A.; Kashiwagi, K. Systemic and ocular diseases associated with the development of diabetic macular edema among Japanese patients with diabetes mellitus. BMC Ophthalmol. 2020, 20, 309. [Google Scholar] [CrossRef] [PubMed]
- Zhuang, X.; Cao, D.; Yang, D.; Zeng, Y.; Yu, H.; Wang, J.; Kuang, J.; Xie, J.; Zhang, S.; Zhang, L. Association of diabetic retinopathy and diabetic macular oedema with renal function in southern Chinese patients with type 2 diabetes mellitus: a single-centre observational study. BMJ Open. 2019, 9, e031194. [Google Scholar] [CrossRef] [PubMed]
- Liew, G.; Wong, V.W.; Saw, M.; Tsang, T.E.; Nolan, T.; Ong, S.; Ho, I.V. Profile of a population-based diabetic macular oedema study: the Liverpool Eye and Diabetes Study (Sydney). BMJ Open. 2019, 9, e021884. [Google Scholar] [CrossRef]
- Kung, E.W.T.; Chan, V.T.T.; Tang, Z.; Yang, D.; Sun, Z.; Wang, Y.M.; Chan, C.H.; Kwan, M.C.H.; Shi, J.; Cheung, C.Y. Alterations in the Choroidal Sublayers in Relationship to Severity and Progression of Diabetic Retinopathy: A Swept-Source OCT Study. Ophthalmol Sci. 2022, 2, 100130. [Google Scholar] [CrossRef]
- Man, R.E.; Sasongko, M.B.; Sanmugasundram, S.; Nicolaou, T.; Jing, X.; Wang, J.J.; Wong, T.Y.; Lamoureux, E.L. Longer axial length is protective of diabetic retinopathy and macular edema. Ophthalmology 2012, 119, 1754–1759. [Google Scholar] [CrossRef] [PubMed]
- Acan, D.; Calan, M.; Er, D.; Arkan, T.; Kocak, N.; Bayraktar, F.; Kaynak, S. The prevalence and systemic risk factors of diabetic macular edema: a cross-sectional study from Turkey. BMC Ophthalmol. 2018, 18, 91. [Google Scholar] [CrossRef]
- Ghosh, S.; Bansal, P.; Shejao, H.; Hegde, R.; Roy, D.; Biswas, S. Correlation of morphological pattern of optical coherence tomography in diabetic macular edema with systemic risk factors in middle aged males. Int Ophthalmol. 2015, 35, 3–10. [Google Scholar] [CrossRef]
- Blodi, B.; Gardner, T.W.; Gao, X.; Sun, J.K.; Lorenzi, G.M.; de Koo, L.C.O.; Das, A.; White, N.H.; Gubitosi-Klug, R.A.; Aiello, L.P.; Bebu, I. DCCT/EDIC Research Group. Intensive Glycemic Management Is Associated With Reduced Retinal Structure Abnormalities on Ocular Coherence Tomography in the DCCT/EDIC Study. Diabetes Care, 2324. [Google Scholar]
- Yoon, Y.H.; Boyer, D.S.; Maturi, R.K.; Bandello, F.; Belfort, R., Jr.; Augustin, A.J.; Li, X.Y.; Bai, Z.; Hashad, Y. Ozurdex MEAD Study Group. Natural history of diabetic macular edema and factors predicting outcomes in sham-treated patients (MEAD study). Graefes Arch Clin Exp Ophthalmol. 2019, 257, 2639–2653. [Google Scholar] [CrossRef]
- Acan, D.; Karahan, E.; Kocak, N.; Kaynak, S. Evaluation of systemic risk factors in different optical coherence tomographic patterns of diabetic macular edema. Int J Ophthalmol. 2018, 11, 1204–1209. [Google Scholar]
- Wilkinson, C.P.; Ferris FL 3rd, Klein, R. E.; Lee, P.P.; Agardh, C.D.; Davis, M.; Dills, D.; Kampik, A.; Pararajasegaram, R.; Verdaguer, J.T. Global Diabetic Retinopathy Project Group. Proposed international clinical diabetic retinopathy and diabetic macular edema disease severity scales. Ophthalmology. 2003, 110, 1677–1682. [Google Scholar] [CrossRef] [PubMed]
- Yonekawa, Y.; Modi, Y.S.; Kim, L.A.; Skondra, D.; Kim, J.E.; Wykoff, C.C. American Society of Retina Specialists Clinical Practice Guidelines on the Management of Nonproliferative and Proliferative Diabetic Retinopathy without Diabetic Macular Edema. J Vitreoretin Dis. 2020, 4, 125–135. [Google Scholar] [CrossRef] [PubMed]
- Koca, S.; Kılıç, D. Long-term longitudinal retinal changes after conventional and pattern scan laser panretinal photocoagulation in diabetic retinopathy. Photodiagnosis Photodyn Ther. 2023, 44, 103845. [Google Scholar] [CrossRef] [PubMed]
- Yazdani, S.; Samadi, P.; Pakravan, M.; Esfandiari, H.; Ghahari, E.; Nourinia, R. Peripapillary RNFL Thickness Changes after Panretinal Photocoagulation. Optom Vis Sci. 2016, 93, 1158–1162. [Google Scholar] [CrossRef] [PubMed]
- Mohamed, D.M.F.; Hassan, N.A.; Osman, A.A.; Osman, M.H. Subfoveal choroidal thickness in diabetic macular edema. Clin Ophthalmol. 2019, 13, 921–925. [Google Scholar] [CrossRef] [PubMed]
- Park, N.; Lee, I.G.; Kim, J.T. Changes in choroidal thickness in advanced diabetic retinopathy treated with pan-retinal photocoagulation using a pattern scanning laser versus a conventional laser. BMC Ophthalmol. 2020, 20, 226. [Google Scholar] [CrossRef] [PubMed]
- Li, F.; Liu, L.; Rao, C.H.; Gao, J. Comparison of Chorioretinal Parameters in Diabetic Retinopathy with or without Pan-Retinal Photocoagulation Using Ultrawide-Field Swept-Source Optical Coherence Tomography Angiography. Ophthalmic Res. 2023, 66, 538–549. [Google Scholar] [CrossRef] [PubMed]
- Murakami, T.; Nishijima, K.; Sakamoto, A.; Ota, M.; Horii, T.; Yoshimura, N. Association of pathomorphology, photoreceptor status, and retinal thickness with visual acuity in diabetic retinopathy. Am J Ophthalmol. 2011, 151, 310–317. [Google Scholar] [CrossRef]
- Diabetic Retinopathy Clinical Research Network; Browning, D. J.; Glassman, A.R.; Aiello, L.P.; Beck, R.W.; Brown, D.M.; Fong, D.S.; Bressler, N.M.; Danis, R.P.; Kinyoun, J.L.; Nguyen, Q.D.; Bhavsar, A.R.; Gottlieb, J.; Pieramici, D.J.; Rauser, M.E.; Apte, R.S.; Lim, J.I.; Miskala, P.H. Relationship between optical coherence tomography-measured central retinal thickness and visual acuity in diabetic macular edema. Ophthalmology. 2007, 114, 525–536. [Google Scholar]
- Rayess, N.; Rahimy, E.; Ying, G.S.; Bagheri, N.; Ho, A.C.; Regillo, C.D.; Vander, J.F.; Hsu, J. Baseline choroidal thickness as a predictor for response to anti-vascular endothelial growth factor therapy in diabetic macular edema. Am J Ophthalmol. 2015, 159, 85–91. [Google Scholar] [CrossRef]
- Wang, S.; Lin, S.; Zheng, Y.; Di, F.; Cao, X.; Liu, C.; Yang, J. [Association of choroidal thickness with diabetic retinopathy at different stages]. Zhonghua Yi Xue Za Zhi. 2015, 95, 2584–2588. [Google Scholar] [PubMed]
- Kiciński, K.; Gawęcki, M. Choroidal and Retinal Thicknesses in Healthy Eyes Measured with Ultra-Wide-Field Optical Coherence Tomography. Diagnostics 2024, 14, 1114. [Google Scholar] [CrossRef] [PubMed]
- Cornish, E.E.; Wickremasinghe, S.; Mehta, H.; Lim, L.; Sandhu, S.S.; Nguyen, V.; Gillies, M.C.; Fraser-Bell, S. Aflibercept monotherapy versus aflibercept with targeted retinal laser to peripheral retinal ischemia for diabetic macular oedema (LADAMO). Eye 2023, 37, 3417–3422. [Google Scholar] [CrossRef] [PubMed]
- Talks, S.J.; Bhatia, D.; Menon, G.; Cole, A.; Eleftheriadis, H.; Downey, L.; Chong, N.V.; Sivaprasad, S. RDP study group. Randomised trial of wide-field guided PRP for diabetic macular oedema treated with ranibizumab. Eye 2019, 33, 930–937. [Google Scholar] [CrossRef] [PubMed]
- Yanxia, C.; Xiongyi, Y.; Min, F.; Xiaoyun, K. Optical Coherence Tomography-Based Grading of Diabetic Macular Edema Is Associated with Systemic Inflammatory Indices and Imaging Biomarkers. Ophthalmic Res. 2024, 67, 96–106. [Google Scholar] [CrossRef] [PubMed]
- Figueras-Roca, M.; Matas, J.; Llorens, V.; Sala-Puigdollers, A.; Navarro, M.; Zarranz-Ventura, J.; Adán, A.; Molins, B. Systemic contribution of inflammatory mediators to the severity of diabetic and uveitic macular edema. Graefes Arch Clin Exp Ophthalmol. 2021, 259, 2695–2705. [Google Scholar] [CrossRef] [PubMed]
- Pessoa, B.; Heitor, J.; Coelho, C.; Leander, M.; Menéres, P.; Figueira, J.; Meireles, A.; Beirão, M. Systemic and vitreous biomarkers - new insights in diabetic retinopathy. Graefes Arch Clin Exp Ophthalmol. 2022, 260, 2449–2460. [Google Scholar] [CrossRef] [PubMed]
- Lee, S.H.; Lee, G.W.; Lee, S.J.; Kim, S.G. Association between the response of intravitreal antivascular endothelial growth factor injection and systemic factors of diabetic macular edema. BMC Ophthalmol. 2024, 24, 166. [Google Scholar] [CrossRef] [PubMed]
- Han, Y.E.; Jo, J.; Kim, Y.J.; Lee, J. Factors Affecting Intensive Aflibercept Treatment Response in Diabetic Macular Edema: A Real-World Study. J Diabetes Res. 2023, 2023, 1485059. [Google Scholar] [CrossRef]
- Mititelu, M.; Uschner, D.; Doherty, L.; Bjornstad, P.; Domalpally, A.; Drews, K.L.; Gubitosi-Klug, R.; Levitsky, L.L.; Pak, J.W.; White, N.H.; Blodi, B.A. Retinal Thickness and Morphology Changes on OCT in Youth with Type 2 Diabetes: Findings from the TODAY Study. Ophthalmol Sci. 2022, 2, 100191. [Google Scholar] [CrossRef]
- Wei, Q.; Qiu, W.; Liu, Q.; Jiang, Y. Relationship Between Risk Factors and Macular Thickness in Patients with Early Diabetic Retinopathy. Int J Gen Med. 2022, 15, 6021–6029. [Google Scholar] [CrossRef] [PubMed]
Figure 1.
The three fields analyzed in the study: central, perifoveal, and peripheral.
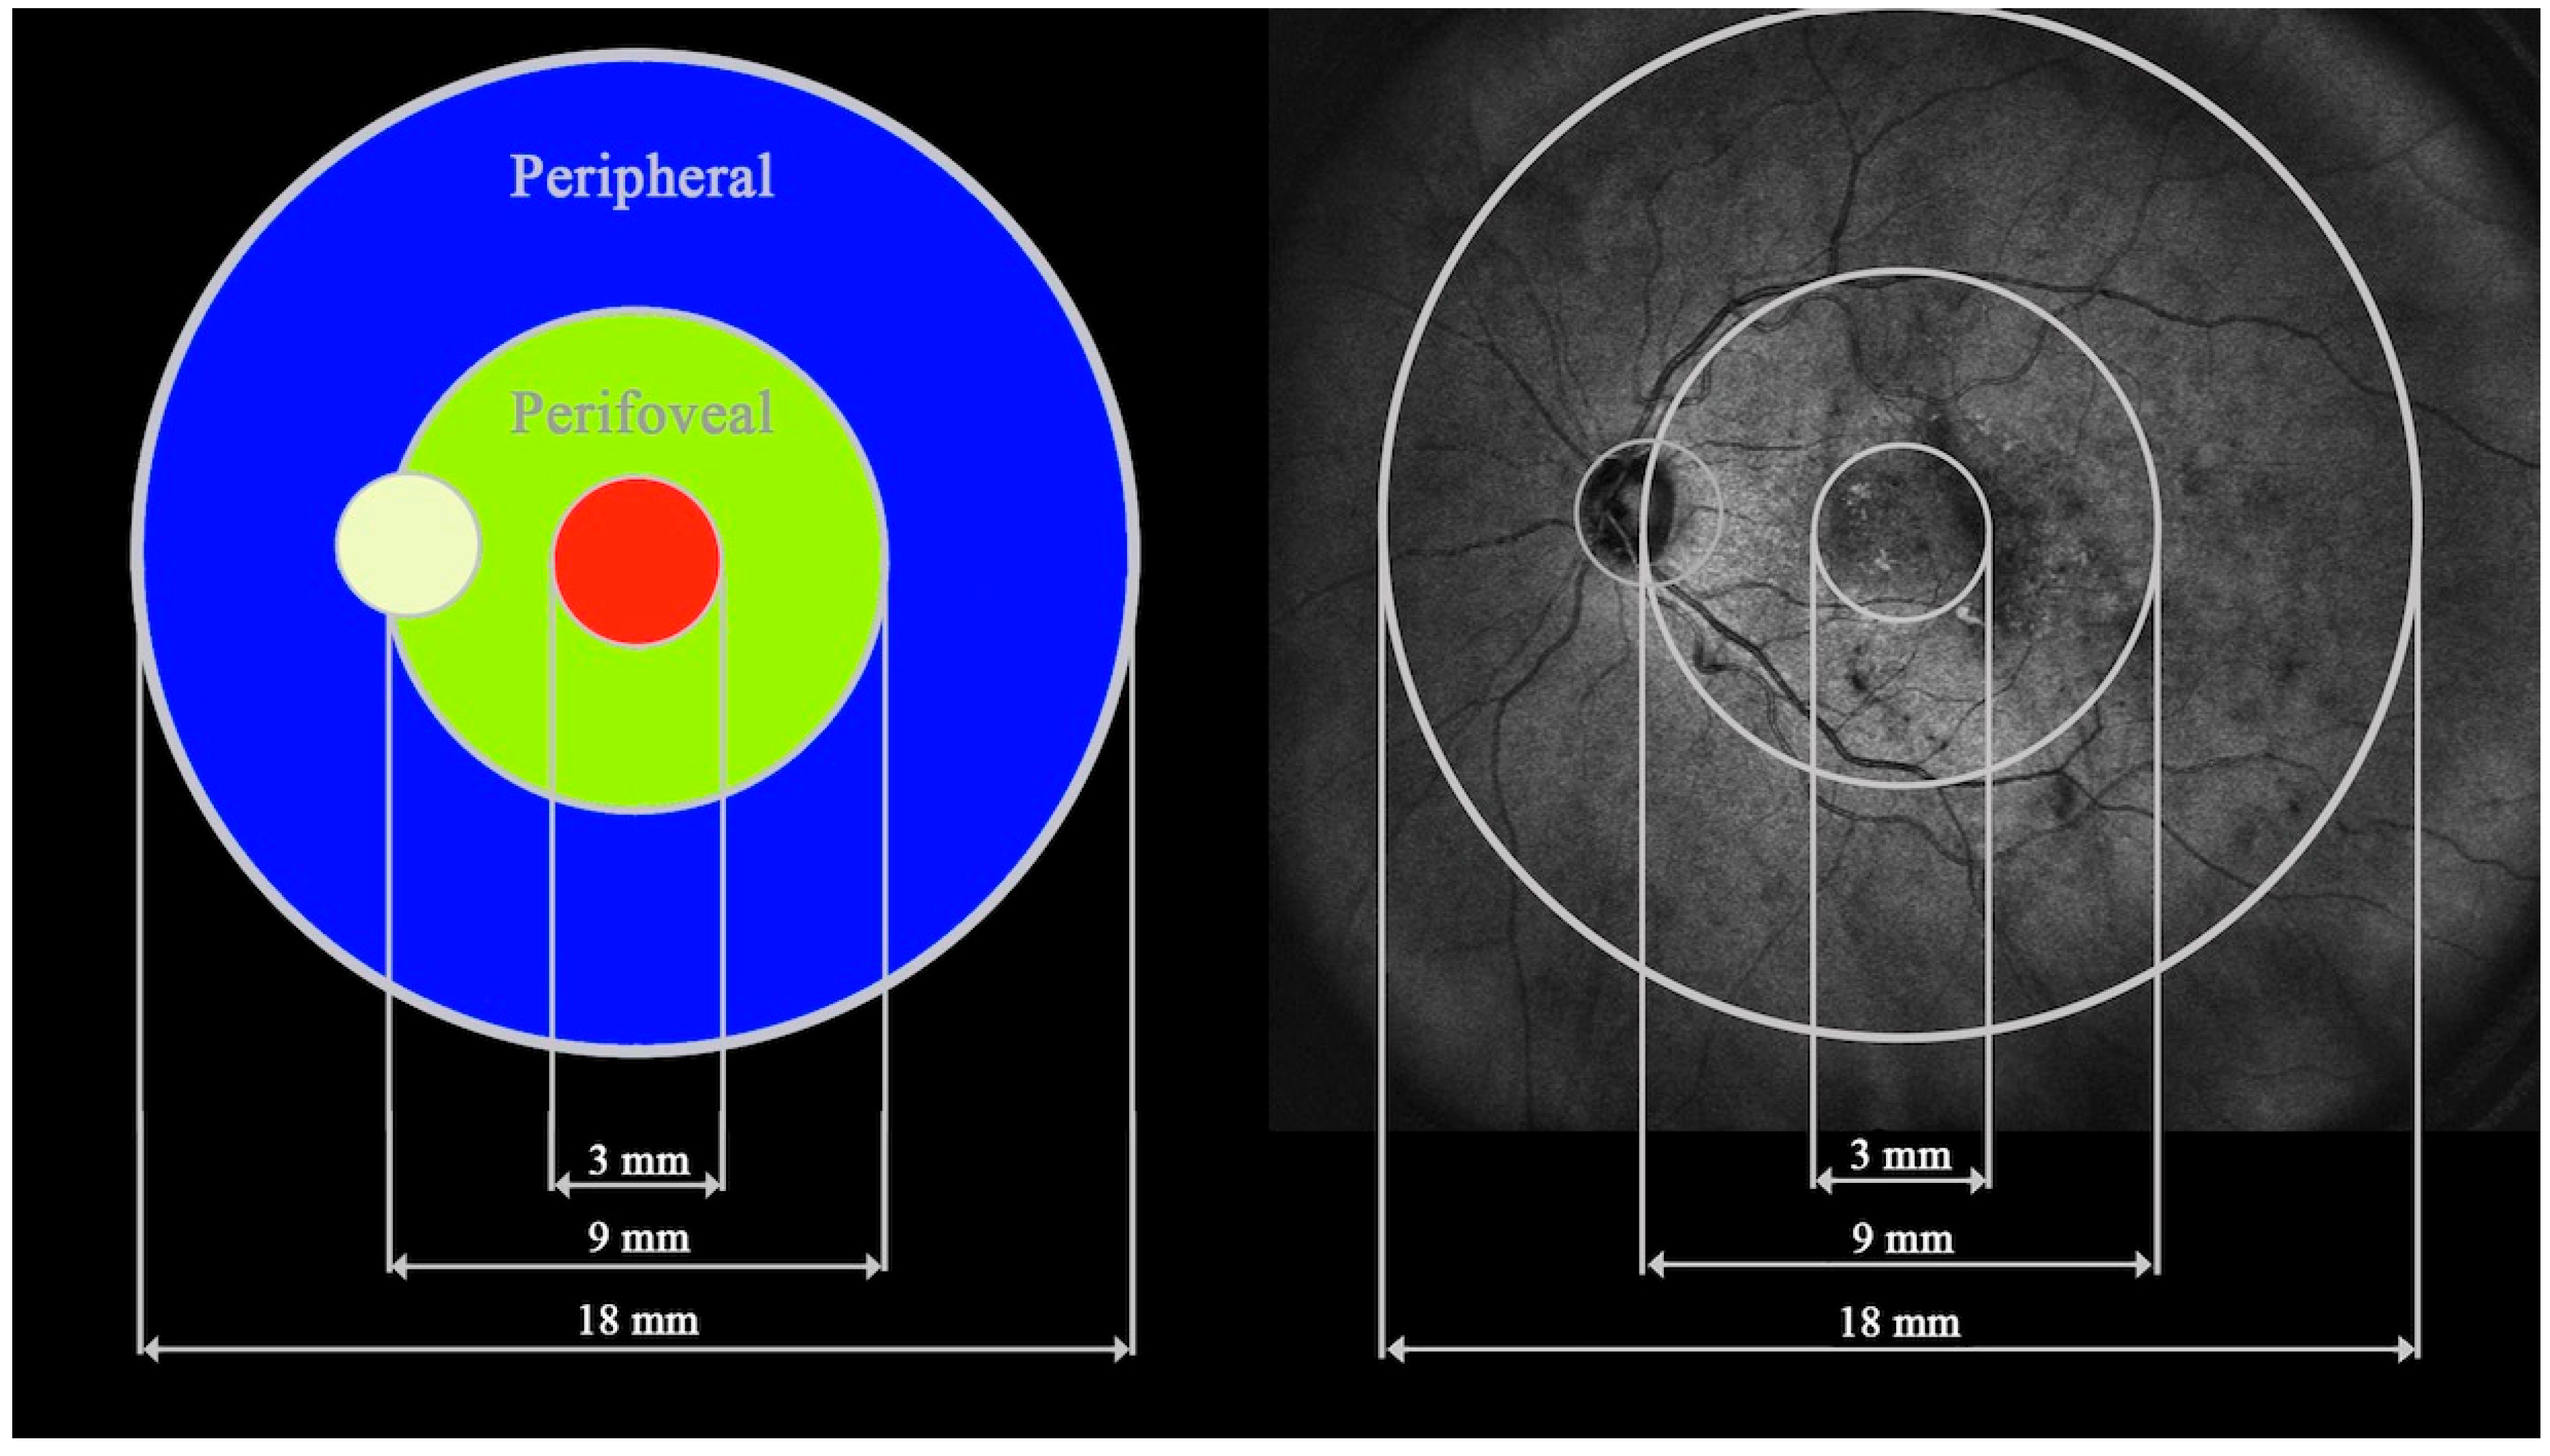
Figure 2.
a. UWF-OCT of significant DME with cystoid changes in the neurosensory retina. The scan engages the optic disc. b. UWF-OCT of extensive DME with the presence of subretinal fluid.
Figure 2.
a. UWF-OCT of significant DME with cystoid changes in the neurosensory retina. The scan engages the optic disc. b. UWF-OCT of extensive DME with the presence of subretinal fluid.
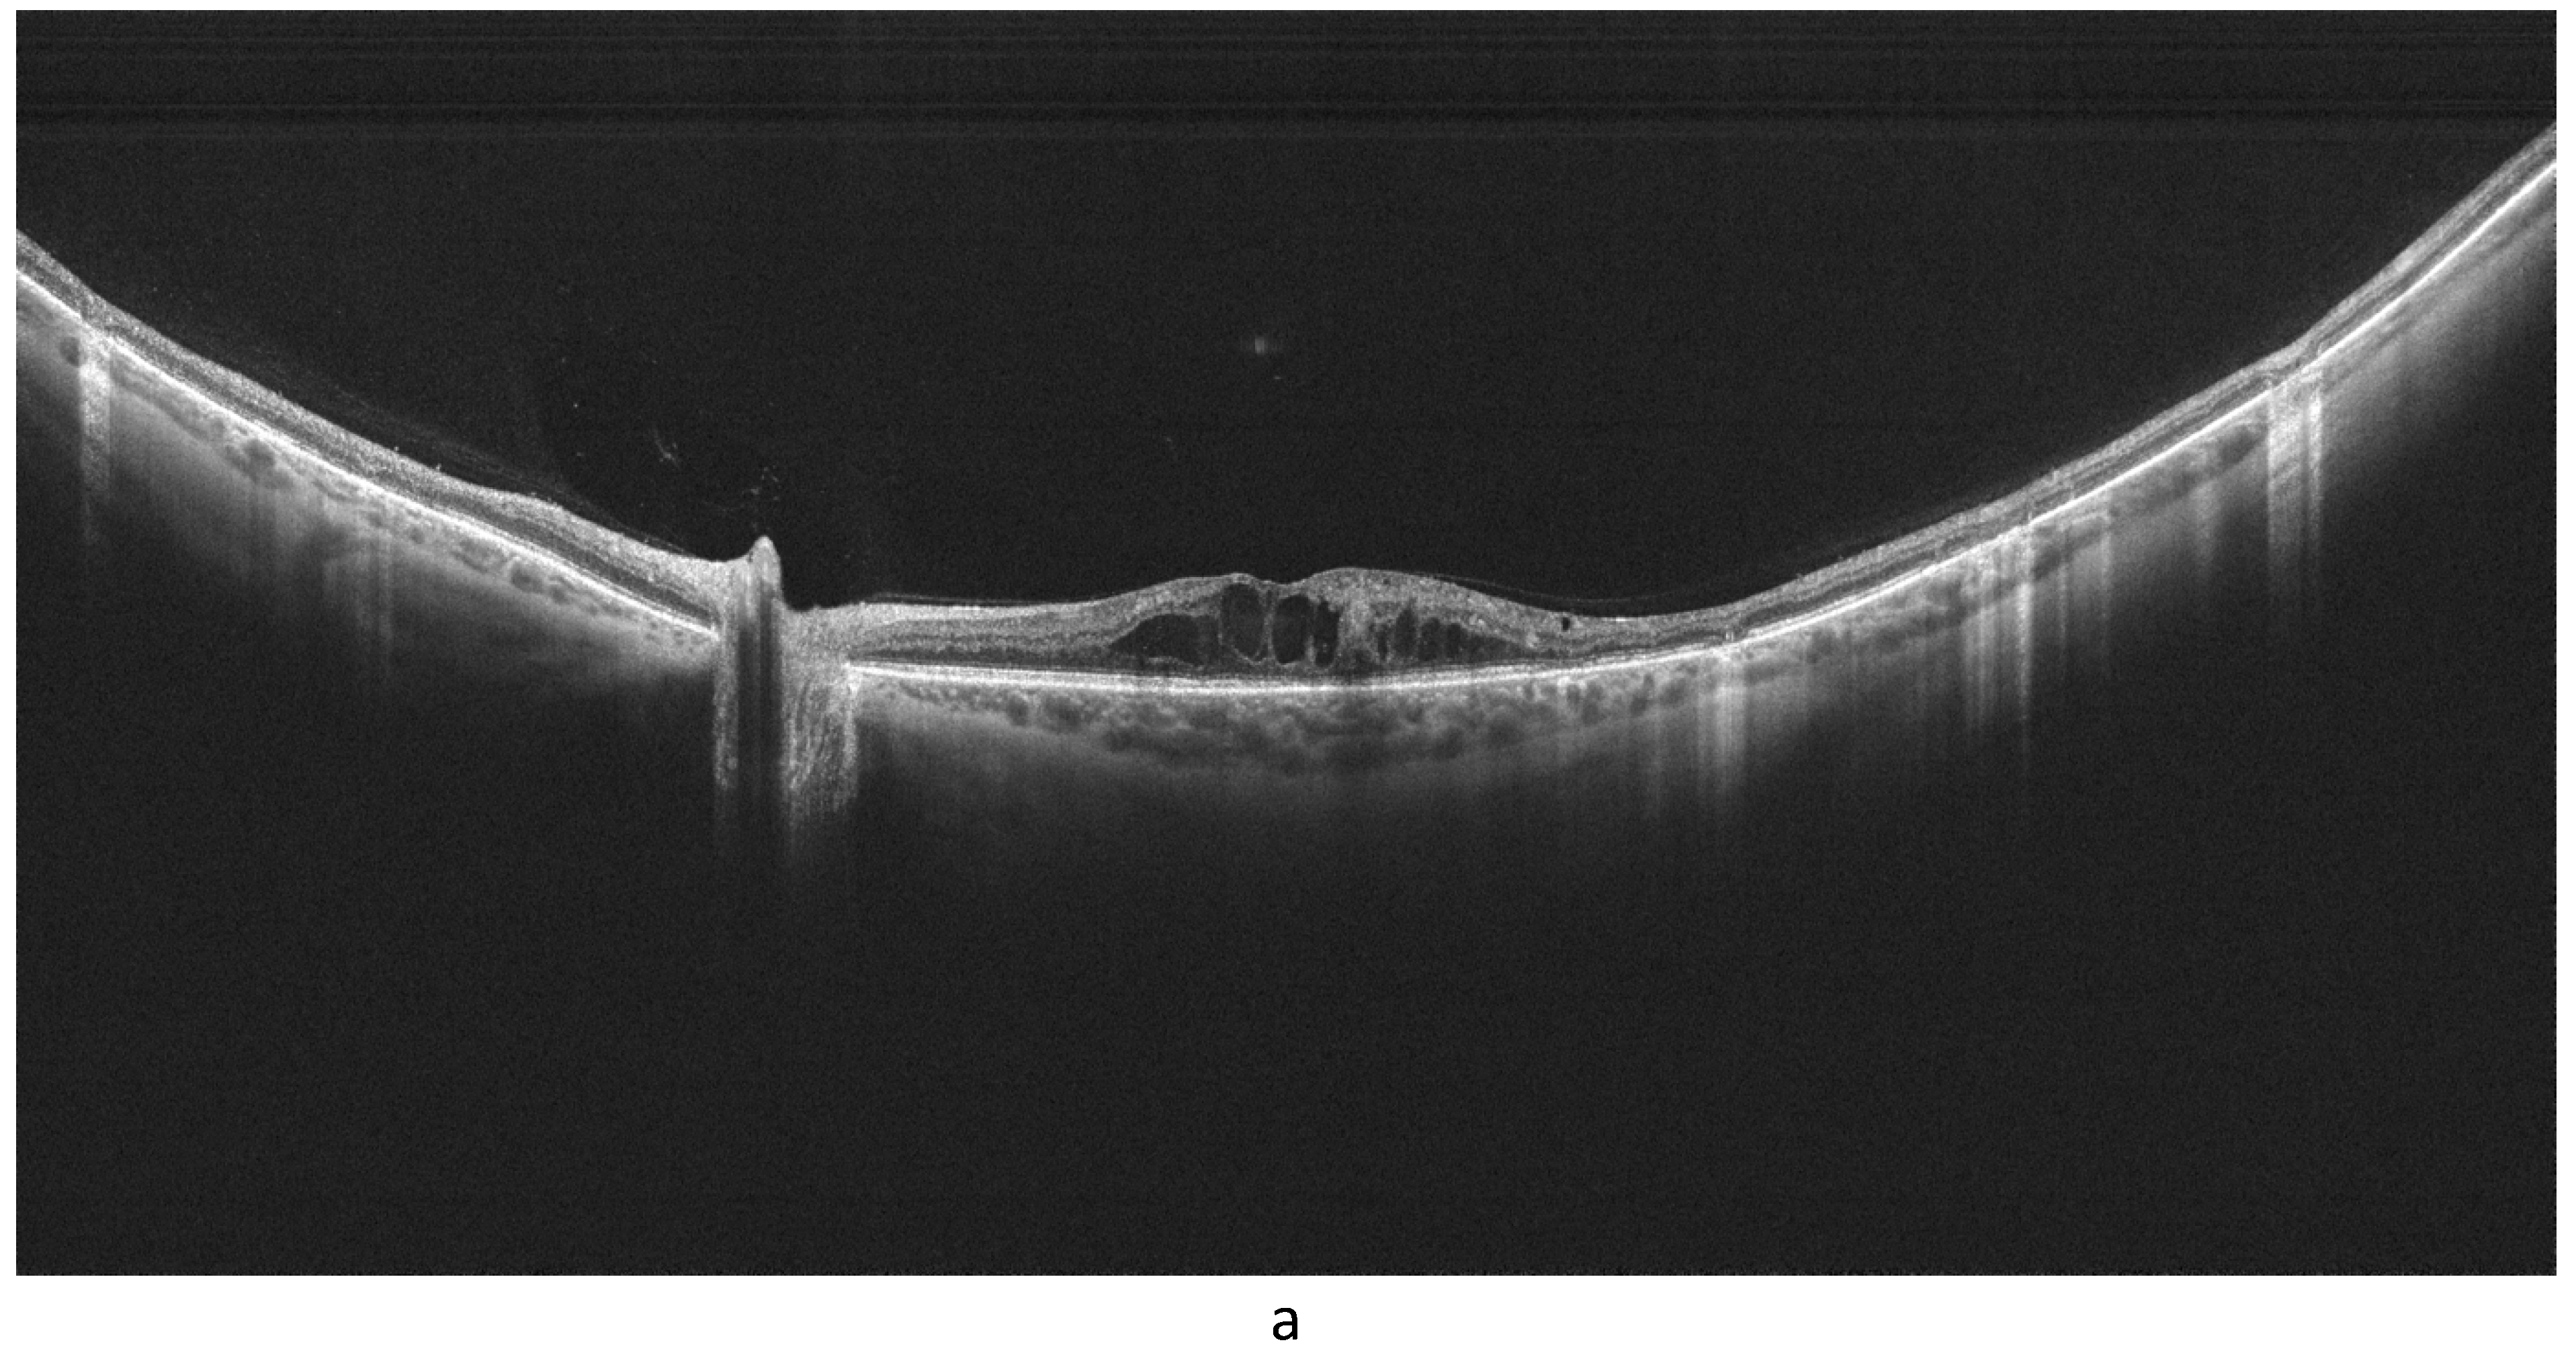


Table 1.
Baseline characteristics of the study cohort by prevalence of diabetes mellitus and laser application (discrete variables).
Table 1.
Baseline characteristics of the study cohort by prevalence of diabetes mellitus and laser application (discrete variables).
| Analyzed trait | Study group | P value | ||
| Control group | DME w/ laser |
DME w/o laser |
||
| No. of participants, n (%) | 75 (50.33) | 32 (21.48) | 42 (28.19) | |
| No. of eyes, n (%) | 125 (47.17) | 56 (21.13) | 84 (31.70) | |
| Gender, n (%) | ||||
|
44 (58.67) | 12 (37.50) | 18 (42.86) | = 0.0779 |
|
31 (41.33) | 20 (62.50) | 24 (57.14) | |
w – with, w/o – without, DME – diabetic macular edema.
Table 2.
Baseline characteristics of the study cohort by prevalence of diabetes mellitus and laser application (numerical variables); n = 149 individuals = 265 eyes.
Table 2.
Baseline characteristics of the study cohort by prevalence of diabetes mellitus and laser application (numerical variables); n = 149 individuals = 265 eyes.
| Analyzed trait | DME/laser | Statistical parameter * | P value ** | |||
| M | SD | Me | Q1-Q3 | |||
| Age [years] | DME w/ laser | 60.22 | 13.03 | 66.00 | 51.00-69.00 | = 0.1448 |
| DME w/o laser | 63.67 | 9.17 | 64.00 | 57.50-71.50 | ||
| Control group | 59.03 | 15.92 | 63.00 | 48.00-71.00 | ||
| Axial length [mm] | DME w/ laser | 24.76 | 1.47 | 24.40 | 23.75-26.10 | = 0.3145 |
| DME w/o laser | 25.03 | 1.54 | 25.00 | 24.10-25.80 | ||
| Control group | 24.78 | 1.59 | 24.80 | 23.80-25.60 | ||
| BCVA (logMAR) | DME w/ laser | 0.56 | 0.36 | 0.55 | 0.30-0.70 | |
| DME w/o laser | 0.32 | 0.28 | 0.30 | 0.10-0.50 | ||
| Control group | 0.00 | 0.00 | 0.00 | 0.00-0.00 | ||
(* Statistical measures used: M – mean, SD – standard deviation, Me – median, Q – quartile. ** Controlled for gender and/or age.). DME – diabetic macular edema, BCVA – best corrected visual acuity, w – with, w/o – without.
Table 3.
Descriptive statistics for the retinal/choroidal thicknesses (µm) of the study cohort by prevalence of diabetes mellitus and laser application (n = 265 eyes).
Table 3.
Descriptive statistics for the retinal/choroidal thicknesses (µm) of the study cohort by prevalence of diabetes mellitus and laser application (n = 265 eyes).
| Measured field | DME/laser | Statistical parameter | P value * | |||
| M | SD | Me | Q1-Q3 | |||
| Retinal thickness | ||||||
| Central | DME w/ laser | 369.79 | 66.84 | 363.00 | 313.00-394.00 | < 0.0001 a |
| DME w/o laser | 366.36 | 61.42 | 351.00 | 325.00-380.50 | ||
| Control group | 335.08 | 20.69 | 335.00 | 324.00-348.00 | ||
| Perifoveal |
DME w/ laser | 315.28 | 39.77 | 307.78 | 281.41-337.91 | < 0.0001 b |
| DME w/o laser | 302.20 | 30.00 | 296.47 | 283.72-313.72 | ||
| Control group | 287.50 | 14.98 | 289.81 | 277.37-297.75 | ||
| Peripheral |
DME w/ laser | 227.07 | 21.06 | 219.19 | 212.37-341.63 | = 0.0150 c |
| DME w/o laser | 225.60 | 17.32 | 220.94 | 214.62-234.94 | ||
| Control group | 220.29 | 12.43 | 221.37 | 211.50-228.63 | ||
| Choroidal thickness | ||||||
| Central | DME w/ laser | 288.18 | 76.63 | 293.00 | 220.50-353.50 | = 0.9227 |
| DME w/o laser | 285.82 | 85.33 | 288.00 | 230.50-352.00 | ||
| Control group | 293.87 | 87.10 | 300.00 | 223.00-357.00 | ||
| Perifoveal | DME w/ laser | 254.89 | 75.90 | 240.72 | 201.56-309.31 | = 0.7573 |
| DME w/o laser | 244.75 | 68.90 | 231.47 | 193.53-284.31 | ||
| Control group | 250.98 | 71.48 | 241.00 | 200.69-314.19 | ||
| Peripheral |
DME w/ laser | 196.54 | 56.46 | 183.56 | 159.00-227.19 | = 0.2139 |
| DME w/o laser | 185.10 | 45.71 | 176.06 | 153.06-206.63 | ||
| Control group | 186.57 | 46.02 | 174.12 | 152.62-221.00 | ||
(* Controlled for the study subjects’ age and gender. Results of post hoc comparisons: a. DME w/laser vs. control group P = 0.0004, DME w/laser vs. DMW w/o laser P = 0.8772, DME w/o laser vs. control group P = 0.0001; b. DME w/ laser v. DME w/o laser p = 0.0126, DME w/laser vs. control group P = 0.0011, DME w/o laser vs. control group P < 0.0001; c. DME w/ laser vs. control group P = 0.0457, DME w/laser vs. DME w/o laser P = 0.7867, DME w/o laser vs. control group P = 0.0812.). DME – diabetic macular edema, M – mean, Me – median, SD – standard deviation, w – with, w/o – without, Q – quartile.
Table 4.
Pearson product-moment correlation coefficients along with corresponding p values for the retinal/choroidal thicknesses versus selected continuous traits in the DM group without the use of laser.
Table 4.
Pearson product-moment correlation coefficients along with corresponding p values for the retinal/choroidal thicknesses versus selected continuous traits in the DM group without the use of laser.
| Patient characteristics | Axial length (mm) | BCVA (logMAR) | HbA1c (%) | BMI (kg*m–2) | Age (years) | |||||
| Measured field | r | p * | r | p * | r | p * | r | p * | r | p * |
| Retinal thickness | ||||||||||
| Central | –0.11 | 0.3385 | 0.33 | 0.0025 | 0.001 | 0.9904 | –0.20 | 0.2320 | 0.11 | 0.3086 |
| Perifoveal | 0.06 | 0.5659 | 0.23 | 0.0384 | 0.08 | 0.5240 | –0.15 | 0.3818 | –0.07 | 0.5473 |
| Peripheral | 0.30 | 0.0052 | 0.16 | 0.1411 | –0.03 | 0.7980 | –0.10 | 0.5468 | –0.14 | 0.1916 |
| Choroidal thickness | ||||||||||
| Central | 0.20 | 0.0656 | –0.25 | 0.0223 | –0.04 | 0.7082 | –0.12 | 0.4593 | –0.44 | < 0.0001 |
| Perifoveal | 0.21 | 0.0518 | –0.26 | 0.0187 | –0.07 | 0.5467 | –0.11 | 0.5322 | –0.48 | < 0.0001 |
| Peripheral | 0.18 | 0.1084 | –0.15 | 0.1796 | –0.14 | 0.2306 | 0.02 | 0.8998 | –0.38 | 0.0004 |
BCVA – best corrected visual acuity, BMI – body mass index, HbA1c – glycosylated hemoglobin.
Table 5.
Spearman’s rank correlation coefficients along with corresponding p values for the retinal/choroidal thicknesses versus selected integer or non-normally distributed traits in the DM group without the use of laser.
Table 5.
Spearman’s rank correlation coefficients along with corresponding p values for the retinal/choroidal thicknesses versus selected integer or non-normally distributed traits in the DM group without the use of laser.
| Patient characteristics | DM duration (years) | Insulin therapy (years) | IVI count | DRSS | ||||
| Measured field | r | p * | r | p * | r | p * | r | p * |
| Retinal thickness | ||||||||
| Central | –0.11 | 0.3707 | –0.22 | 0.1256 | –0.15 | 0.3103 | –0.13 | 0.3009 |
| Perifoveal | –0.19 | 0.1220 | –0.15 | 0.3078 | –0.17 | 0.2580 | 0.19 | 0.1213 |
| Peripheral | 0.01 | 0.9322 | 0.20 | 0.1700 | 0.10 | 0.5131 | 0.07 | 0.5730 |
| Choroidal thickness | ||||||||
| Central | –0.14 | 0.2557 | 0.28 | 0.0531 | 0.13 | 0.4047 | –0.06 | 0.6371 |
| Perifoveal | –0.15 | 0.2313 | 0.25 | 0.0910 | 0.06 | 0.6952 | –0.08 | 0.5064 |
| Peripheral | –0.16 | 0.1828 | 0.15 | 0.2982 | 0.07 | 0.6251 | –0.10 | 0.4545 |
DM – diabetes mellitus, IVI – intravitreal injection, DRSS – diabetic retinopathy severity scale.
Table 6.
Pearson product-moment correlation coefficients along with corresponding p values for the retinal/choroidal thicknesses versus selected continuous traits in the DM group after laser treatment.
Table 6.
Pearson product-moment correlation coefficients along with corresponding p values for the retinal/choroidal thicknesses versus selected continuous traits in the DM group after laser treatment.
| Patient characteristics | Axial length (mm) | BCVA (logMAR) | HbA1c (%) | BMI (kg*m–2) | Age (years) | |||||
| Measured field | r | p * | r | p * | r | p * | r | p * | r | p * |
| Retinal thickness | ||||||||||
| Central | –0.02 | 0.9030 | 0.01 | 0.9362 | 0.06 | 0.6852 | –0.08 | 0.7058 | 0.13 | 0.3548 |
| Perifoveal | 0.10 | 0.4693 | 0.13 | 0.3667 | 0.08 | 0.5709 | –0.15 | 0.5069 | 0.04 | 0.7504 |
| Peripheral | 0.36 | 0.0066 | 0.24 | 0.0870 | –0.11 | 0.4549 | –0.06 | 0.7869 | –0.13 | 0.3627 |
| Choroidal thickness | ||||||||||
| Central | –0.16 | 0.2495 | –0.05 | 0.7246 | 0.08 | 0.5955 | 0.27 | 0.2213 | –0.31 | 0.0213 |
| Perifoveal | –0.14 | 0.3171 | –0.07 | 0.6144 | 0.15 | 0.3035 | 0.14 | 0.5195 | –0.25 | 0.0693 |
| Peripheral | –0.08 | 0.5485 | –0.01 | 0.9365 | –0.01 | 0.9667 | –0.03 | 0.9001 | –0.18 | 0.1859 |
BCVA – best corrected visual acuity, BMI – body mass index, HbA1c – glycosylated hemoglobin.
Table 7.
Spearman’s rank correlation coefficients along with corresponding p values for the retinal/choroidal thicknesses versus selected integer or non-normally distributed traits in the DM group after laser treatment.
Table 7.
Spearman’s rank correlation coefficients along with corresponding p values for the retinal/choroidal thicknesses versus selected integer or non-normally distributed traits in the DM group after laser treatment.
| Patient characteristics | DM duration (years) | Insulin therapy (years) | IVI count | DRSS | ||||
| Measured field | r | p * | r | p * | r | p * | r | p * |
| Retinal thickness | ||||||||
| Central | –0.27 | 0.0837 | –0.30 | 0.0606 | –0.38 | 0.0504 | 0.02 | 0.8886 |
| Perifoveal | –0.28 | 0.0656 | –0.38 | 0.0171 | –0.61 | 0.0006 | 0.17 | 0.3036 |
| Peripheral | –0.09 | 0.5611 | –0.10 | 0.5364 | –0.49 | 0.0088 | 0.31 | 0.0519 |
| Choroidal thickness | ||||||||
| Central | –0.24 | 0.1279 | 0.16 | 0.3326 | –0.001 | 0.9963 | 0.05 | 0.7673 |
| Perifoveal | –0.16 | 0.3008 | 0.26 | 0.1144 | 0.04 | 0.8574 | 0.04 | 0.8128 |
| Peripheral | –0.02 | 0.8748 | 0.29 | 0.0761 | –0.10 | 0.6279 | –0.002 | 0.9883 |
DM – diabetes mellitus, IVI – intravitreal injections, DRSS – diabetic retinopathy severity scale.
Disclaimer/Publisher’s Note: The statements, opinions and data contained in all publications are solely those of the individual author(s) and contributor(s) and not of MDPI and/or the editor(s). MDPI and/or the editor(s) disclaim responsibility for any injury to people or property resulting from any ideas, methods, instructions or products referred to in the content. |
© 2024 by the authors. Licensee MDPI, Basel, Switzerland. This article is an open access article distributed under the terms and conditions of the Creative Commons Attribution (CC BY) license (http://creativecommons.org/licenses/by/4.0/).
Copyright: This open access article is published under a Creative Commons CC BY 4.0 license, which permit the free download, distribution, and reuse, provided that the author and preprint are cited in any reuse.


