Submitted:
04 June 2024
Posted:
05 June 2024
You are already at the latest version
Abstract
Background: Studies have tried to identify predictors of functional markers of keratoconus progression, whereas structural outcomes of collagen cross-linking have not been properly investigated. Objective: find and set up a combination of diagnostic modalities and measurements to reliably reflect CXL efficiency. Material and methods: We retrospectively reviewed the medical histories of 107 KC patients (131 eyes) who underwent CXL in a medical center from January 2018 to December 2022. The dataset included preoperative examinations and follow-up results, which provided a total of 796 observations. The cases of other corneal diseases, repeated CXL, pregnancy, and observations without follow-up examinations were excluded. Results: The study findings revealed a significant drop in the central and corneal thickness during 14.01±9.98 months of observations. Linear and polynomial equations suggested different trends in pachymetry change after CXL. The linear model showed corneal thinning, and according to the polynomials, pachymetry findings return to baseline values two years after CXL. Conclusion: The most reliable prognosis of postoperative corneal thickness is achieved with the models trained on keratometry readings and topography indices. BAD indices are also reliable predictors of the corneal thickness after CXL. A combination of the aforementioned structural parameters and their derivatives can reliably predict CXL efficiency.
Keywords:
keratoconus
; corneal collagen cross-linking
; CXL outcomes
; machine learning models
; predictive models
; keratometry readings
; corneal thickness
; corneal thinning
; individualized approach
; precision medicine
1. Introduction
Keratoconus (KC) is a rare ectatic corneal disorder leading to visual impairment. KC usually presents in the second or third decade of life with a global prevalence of 138 per 100,000 people [1,2]. The etiology of keratoconus remains unclear: a combination of genetic, biomechanical, and environmental factors may account for disease occurrence [3]. Risk factors of KC include frequent eye rubbing, allergic reactions, and permanent ultraviolet radiation exposure [4]. At early stages, the pathology is asymptomatic [5]. Corneal topography is a screening technique aimed at promoting early treatment before irregular astigmatism, myopia, and corneal scarring develop due to keratoconus [6,7,8].
Currently, corneal collagen cross-linking (CXL) is the most effective method to halt keratoconus progression by rejuvinating collagen fibril molecules. As a result, KC remains firm for up to 28 years. Although CXL may damage endothelial cells and injure nerves [9], the procedure prevents the severe KC stages that would require corneal transplantation (keratoplasty) [10]. Despite a high graft survival rate (90.4%) in keratoplasty, the method has limitations and side effects [11,12]. Treatment response varies among patients, therefore risk assessment will enable the delivery of individualized medical care.
Here, we critically appraise clinical evaluation, pachymetry, visiorefractometry, and topography tests for assessing KC progression. An ophthalmic examination includes a comprehensive series of tests that indicate the optimal timing of corneal crosslinking [13]. Since KC causes corneal thinning and protrusion, pachymetry readings may help to forecast CXL effectiveness [14]. According to recent studies, corneal thickness decreases rapidly within three months after CXL and restores to the baseline level within a year [15]. Little extension between the outer and inner surfaces of the cornea leads to favorable outcomes [16].
Maximum curvature value (Kmax) is a strong predictor of disease progression and effectiveness of CXL. The smaller preoperative Kmax is, the more successful the intervention is expected to be [17,18]. The results in best-corrected visual acuity (BCVA) test also prognosticate the efficacy of CXL. Recent studies have tried to identify the most accurate predictors of disease progression and patients’ responses to interventions. However, they considered a limited number of parameters. To overcome this limitation, we initiated the current project.
The aim of the current study is to find and set up a combination of diagnostic modalities and measurements that reliably reflect CXL efficiency. This will allow us to create a system for multimodal assessment of treatment risks. The desired risk stratification system will predict treatment efficiency and help ophthalmologists to find the optimal approach from clinicodemographic data and instrumental findings.
To reach the study objective, we formulated and fulfilled the following tasks:
- Assess the relationships between pre- and postoperative pachymetry findings.
- Examine the association of CXL outcomes with the results in keratometry, visiorefractometry, topography tests, and clinical examination.
- Construct a model of dynamics in the central corneal thickness (CCT) and minimal corneal thickness (MCT) after CXL for KC.
- Identify top-informative features of CXL effectiveness in KC care.
2. Materials and Methods
2.1. Study Cohort
We retrospectively reviewed the medical histories of 107 KC patients (131 eyes) who underwent CXL in the medical center “Voka” from January 2018 to December 2022. Males outnumbered females: 79 vs 28 (73.8% vs 26.2%). The average age was roughly equal in both sexes: 29±9 and 29±7 years, respectively. The dataset included the results of preoperative examinations and follow-ups, which totaled to 796 observations. All the included cases contained the results of the eye refraction test and the reports on the following ophthalmologic examinations: slit-lamp biomicroscopy, pachymetry, keratometry, and computerized corneal topography. The cases with other corneal diseases, repeated CXL, pregnancy, and observations without follow-up examinations were excluded from the current study.
2.2. Methods
Keratometry data were collected from Marco ARK-1 Series Autorefractor/Keratometer. Topography examination provided us with refractometry indices and elevation back parameters that were obtained from the corneal apex. The best-fit sphere (BFS) is the most common reference for corneal elevation (see Figure 1). The sphere has an ’exclusion zone’, i.e., a 4.00 mm circle area around the MCT point. The surface area outside the zone is called the ’exclusion map’. The raw data of the map are used to compute the elevation back map parameters [19].
Visual acuity was measured with the Golovin–Sivtsev scale, a standardized assessment tool in the countries that use Cyrillic alphabet [20]. The scale scores range from 0.1 to 2.0 decimal units, with 1.0 or 100% for the average vision. A score below 1 indicates myopia, and a score over 1 suggests far-sightedness or hypermetropia.
2.3. Study Methodology
To complete the first task, we examined the relationships between CCT and MCT before and after CXL. The missing values were predicted with linear regression imputations. The exploratory analysis of the dataset followed data preprocessing.
The study cohort was monitored for up to 40 months after CXL. To assess CXL outcomes, we divided the postoperative period into three time intervals: 1) within 6 months, 2) from 6 to 24 months, and 3) more than 24 months. Within each interval, we calculated descriptive statistics, then we applied the Kruskal Wallis test to find marked changes in the ophthalmometry readings. We resorted to the Student’s t-test to compare pre- and postoperative findings. The individual results outside of the diapason [15, 85] percentile were considered to be outliers and excluded from further analysis.
We used the Shapiro-Wilk test to check the distribution of the data. The relationships between normally distributed variables were tested with Pearson correlation. For the other variables, Spearman correlation was used. The significance level of p<0.05 indicated a strong association between the data and CXL outcomes.
Working on the second task, we applied the same approach. Specifically, we analyzed associations between pre- and postoperative findings. For this purpose, we computed pairwise correlation coefficients among corneal thickness values, keratometry, topography, and visiorefractometry readings.
To address the third task, we trained models to predict a change in central and minimal corneal thickness after CXL from individual preoperative parameters. We selected linear and polynomial equations for modeling the trends in corneal thickness during the follow-up. Then, we used Bayesian Information Criterion to score and select the optimal model type.
To forecast the success of treatment, we constructed machine learning models predicting CXL outcomes from the preoperative findings. In the follow-up examinations, corneal thickness reflected the structural outcome of CXL. Therefore, the targeted variables were a change in CCT and MCT. Regression models were trained to forecast CCT and MCT dynamics from the four groups of predictors: keratometry readings, visiorefractometry data, refractive, and deviation indices. We performed feature selection and split the original dataset into training and testing subsets - 70 vs 30% of the data correspondingly.
To train and validate multiple machine learning models, we used a 5-fold cross-validation technique. Training and validation were conducted with Decision Tree, Random Forest, XGBoost, and LightGBM models. The performance was assessed with the mean absolute error (MAE).
To streamline the training process and augment the models’ performance, we implemented Optuna framework and optimized hyperparameters. The framework allowed us to investigate various permutations of hyperparameters for each model. The results of validation tests revealed the top-performing configuration. The models’ generalization ability was measured on unseen data.
3. Results
The study showed a significant improvement in keratometric parameters and topography indices after CXL (see Table 1). In visiorefractometry findings, uncorrected visual acuity (UVA) increased from 0.27±0.23 to 0.33±0.30 (p=0.0286). However, other functional parameters remained stable after the invasion.
3.1. Pre- and Postoperative Pachymetry Findings
We observed a significant decrease in CCT and MCT after CXL within 14.01±9.98 months of observation. The thickness of the central cornea dropped from 479.21±38.35 to 465.57±42.36m, and the minimal corneal thickness reduced from 457.74±35.56 to 442.15±40.84 m (p<0.0001) (see Table 1).
An association between CCT and MCT was stronger after CXL (r=0.9 vs 0.79). We also explored relationships between preoperative pachymetry parameters and postoperative findings. The preoperative CCT had a weak correlation with pachymetry data after CXL. Similarly, MCT values before CXL did not correlate strongly with postoperative MCT and CCT (See Figure 2). These facts suggest the absence of a linear association between preoperative pachymetry data and the structural outcomes of CXL.
3.2. Relationship between Preoperative Parameters and Corneal Thickness After CXL
Preoperative keratometry findings exhibited moderate and weak association with postoperative pachymetry data (see Figure 4A). Corneal eccentricity describes the rate of flattening from the center to the periphery of the cornea, and it demonstrated a strong inverse correlation with CCT and MCT after CXL (r=-0.52, and r=-0.60 respectively; ). The intervention on the prolate cornea resulted in its lower thickness according to CCT and MCT in follow-ups. The preoperative K2 value had a weak positive correlation with the pachymetry data after CXL. Other keratometry readings did not show any relationship with CCT and MCT.
We also looked for the preoperative functional parameters that would be the correlates of the pachymetry values after the procedure. Corneal astigmatism had a moderate negative correlation with both CCT and MCT (r=-0.46, and r=-0.56 respectively; ). BCVA had an inverse relationship with pachymetry findings. In other words, myopia is a risk factor for corneal thinning after CXL. Corrected (cylinder) visual acuity and MCT demonstrate a weak relationship (r=0.24, ).
Another group of candidate predictors of structural outcomes of CXL was comprised of topography findings and BAD deviation indices (see Figure 4B). All topography readings correlated stronger with MCT than CCT. The keratoconus index (KI) and the index of height decentration (IHD) showed the strongest negative relationship with MCT (r=-0.63, ). The index of height asymmetry (IHA) did not correlate with CCT and MCT. In contrast to MCT which had a pronounced inverse relationship with all the BAD indices, CCT was associated only with Df and Dt values: r=-0.51 and -0.45 respectively, p.
On average, the elevation back map parameters were associated tighter with MCT than CCT (see Figure 4). The top correlates were the data received at the posterior elevation with the best-fit sphere and exclusion map area (see Figure 4B and Figure 4C). The measurements of the exclusion zone exhibited a looser association with MCT and CCT.
3.3. Corneal Pachymetry after CXL
We modeled postoperative structural changes with linear and polynomial regressions. The dataset included 796 cases with an observational period of 4 to 52 months. As seen in Figure 5, the linear trends showed a steady decline in pachymetry readings (). The polynomial functions declined during the first 20 months and then reached a plateau. A growth followed after the 28th month.
3.4. Prognosing CXL Outcomes in KC Patients
For a reliable prognosis on postoperative corneal thickness, we used four groups of predictors: keratometry readings, visiorefractometry data, refractive and deviation indices (see Figure 6). The top-accurate models were trained to predict MCT dynamics from keratometry readings: MAE/ROV = 0.044±0.031%. However, the best-performing models of CCT change employed viseorefractometry data as predictors: MAE/ROV = 0.042±0.0026%. Topography indices had the lowest predictive value among the four groups.
4. Discussion
4.1. Pachymetry after Corneal Collagen Cross-Linking
The current study revealed a significant drop in the central and corneal thickness at the beginning of the observation period followed by a rise in the MCT and CCT values. The results are in line with previous studies that reported a continuous decrease in pachimetry values within the first year after CXL [21,22]. In a year, the corneal thickness steadily increased and returned to the baseline [23].
Initially, the pachymetry findings demonstrated negative dynamics. At the same time, we observed an improvement in UCVA and keratometric values. A similar tendency was reported in previous studies. A recent publication suggested that patients with worse visual acuity and larger central cones benefit from CXL to a greater extent [24]. The rise in UCVA after CXL can be explained by an increase in endothelial density [25]. A stiffening effect of the intervention is another reason for the positive changes in the visual clearness [26].
We demonstrated an association between pre- and postoperative corneal thickness, both central and minimal. Hence, the baseline pachymetry data can reflect the intervention outcomes. Another study revealed that CXL flattens the cornea more if it is thinner at the baseline [27]. The post-CXL corneal thickness is correlated stronger with the preoperative CCT than with MCT data. However, a substantial body of literature presents MCT as a reliable predictor of CXL outcomes [15,28]. Our study suggests that researchers should recognize CCT as an input to models that forecast results in pachymetry tests after the surgery.
Preoperative OCT and MCT findings correlate closely. Still, an association between them is not linear (r<1). In KC, steeping of the cornea is irregular, which results in irregular astigmatism [1]. The association between CCT and MCT after CXL strengthens compared to the preoperative status (r=0.90 vs 0.79, p<0.05). Hence, CXL halts the KC progression, and changes in the corneal thickness become more uniform due to a decrease in the interfibrillar distance [29].
4.2. Association between Preoperative Ophthalmometry Findings and CXL Outcomes
The corneal refractive power depends on the corneal thickness and curvature. The majority of KC studies focus on corneal flattening after CXL. Typically, the variables of interest are visual refractometry and keratometry readings [30,31]. Since changes in keratoconic corneas are very complex, clinical trials on CXL efficiency should monitor early and long-term outcomes such as a drop and a rise in the corneal thickness [32,33]. Still, keratometry remains the major outcome measurement in the assessment of the disease dynamics because the key factors affecting refraction are the refractive index of the cornea and adjacent tear film [34].
The Pentacam topography screening indices (ISV, IVA, KI, CKI, etc.) form a corneal thickness profile that reflects variations of the thinnest point in the peripheral cornea. According to our data, the indices are the top correlates of MCT after CXL. Other studies provide supportive statements that corneal topography is the best method for early detection and monitoring KC progression [35].
The current study revealed a negative relationship between postoperative pachimetry findings and preoperative data on BCVA and corneal astigmatism. The fact confirms that CXL is more efficient in advanced stages of KC with a severe loss in visual acuity [24]. However, the procedure prevents further KC progression and stabilizes the cornea. It does not recover a significant vision loss. CXL is a solution for progressing keratoconus in its early or moderate stages [36].
We showed a correlation of postoperative pachymetry data with preoperative keratometry findings, elevation back maps, and topography indices. Another study revealed the same tendency: it identified a 3% greater risk of corneal thinning for steepening of baseline Kmax by 1D [24]. Topography indices may also reflect the worsening of untreated KC. For example, an annual change rate in the anterior BFS is greater in patients with progressive disease compared to stable KC [37].
4.3. Long-Term Changes in Corneal Curvature after CXL
We used linear and polynomial models to forecast a long-term change in the corneal thickness after CXL. The linear model showed a negative linear trend in CCT and MCT values, which replicates the literature data. Other authors also observed a linear decrease in pachymetry values [16,23]. They reported a pronounced thinning of the cornea in the first year after the intervention [16].
In the current study, polynomials indicated a gradual increase in the corneal thickness from the 28th month after CXL onwards. The models show that pachymetry data return to baseline levels in two years after CXL. Other researchers also revealed a similar tendency, but the cut-off points between postoperative thinning and thickening of the cornea varied among the studies [15,38].
Greenstein et al. described a slackening of the pace of thinning with time. According to them, the cornea thinned at 1 month (mean change 28.7 m; p<.001) and from 1 to 3 months (mean change 20.1 m, p=0.002), followed by a recovery of the corneal thickness between 3 months and 6 months (mean +20.5 ± 20.4 m; p<0.001) [15]. Meanwhile, Holopainen et al. observed corneal thinning within the first month with a gradual thickening within the next five months [38]. Contrarily, Chan et al. reported a decline in the central and minimal corneal thickness in a five-year follow-up [23]. Differences in study cohorts may account for the heterogeneity in the literature findings.
4.4. Predictors of CXL Effectiveness in KC Patients
Information on the predictors of CXL success is limited [39]. For prognosticating postoperative outcomes, researchers commonly perform univariate analysis which is the most straightforward procedure of data processing [40]. Herein, we focused on the structural outcomes of CXL, and trained machine learning algorithms to forecast the postoperative corneal thickness. The best predictors were preoperative keratometry readings in MCT models whereas topography findings were the most informative correlates of CCT. Other authors also prognosticate CXL efficiency from the same baseline findings [41,42,43]. However, in their studies, curvature parameters are the major targeted variables since physicians prefer functional assessment of the intervention to structural measurements.
As our study shows, keratometry and topography findings reflect CXL outcomes reliably. The progression of untreated KC can also be modeled with the same predictors. For accurate prognosis, some authors consider keratoconus enlargement and preoperative longitudinal changes in corneal topography [35,37]. In our database, most cases had a single baseline examination before the invasion, therefore we could not explore longitudinal preoperative findings as potentially informative predictors. Future studies may improve the prediction of CXL outcomes with the suggested data at the input to the models.
We revealed that preoperative BAD indices can accurately reflect postoperative minimal and central corneal thickness. Recent studies suggested these indices as markers of disease progression [44]. From our data, the predictive value of visiorefractometry findings was lower compared to the results of other types of examination. However, Badawi et al. showed a strong linear dependency between preoperative BCVA and the outcomes of CXL (, p<0.001) [16]. In untreated KC, a BCVA-based univariate model does not reveal the disease progression: AUC=0.647 [37]. CXL prognosis becomes more reliable when visual acuity is used in combination with other predictors.
5. Conclusions
- The study findings demonstrated a significant drop in the central and corneal thickness during 14.01±9.98 months of observations. The research showed an association between pre- and postopertive corneal thickness, both central and minimal. Hence, the baseline pachymetry data can adequately reflect the intervention outcomes.
- Postoperative pachymetry data correlate strongly with preoperative structural findings and weakly with BCVA. The topography indices are the top correlates of postoperative MCT and the most reliable markers of early KC and its progression.
- Linear and polynomial equations reveal different trends in pachymetry change after CXL. The linear model shows a negative trend in MCT and CCT. In contrast, polynomials indicate a gradual increase in the thickness from the 28th month after CXL onwards, they show that pachymetry findings return to the baseline values in two years after CXL.
- The most reliable prognosis of postoperative CCT and MCT is achieved when the models are trained on keratometry readings and topography indices. BAD indices are also reliable predictors of the corneal thickness after CXL. A combination of the aforementioned structural parameters and their derivatives can correctly predict CXL efficiency.
Ethical aspects
The study was approved by the Tawam Human Research Ethics Committee (T-HREC, number MF2058-2022-899). All the medical findings were received as a standard of care.
Author Contributions
Conceptualization: Y.S., P.B., and M.L.; writing (original draft preparation) was mainly done by D.S. and Y.S.; study methodology: R.V. and Y.S.; data curation: E.L., P.B., D.S., G.L.S.; formal analysis and visualization: R.V.; writing (review and editing)—by Y.S.; validation of study results—by D.A., E.L., M.P., A.P. and P.B.; problem investigation—by D.S. and G.L.S.; supervision—by Y.S.; project administration—by Y.S., and K.N.-V.G.; funding acquisition—by M.L. All authors contributed to the article and approved the submitted version.
Funding
The study was supported by ASPIRE, the technology program management pillar of Abu Dhabi’s Advanced Technology Research Council (ATRC), via the ASPIRE Precision Medicine Research Institute Abu Dhabi (ASPIREPMRIAD) award grant number VRI-20-10.
Abbreviations
The following abbreviations are used in this manuscript:
| Ast | corneal astigmatism |
| BAD | Belin/Ambrósio display |
| BCVA | best-corrected visual acuity |
| BFS | best fit sphere |
| CCT | central corneal thickness |
| CKI | central keratoconus index |
| CT | corneal thickness |
| CXL | corneal collagen cross-linking |
| D | diopters |
| Da | thinnest point displacement SD |
| Db | SD of changes in the back elevation |
| DT | Decision tree |
| Df | SD of changes in the front elevation |
| Dp | pachymetric progression SD |
| Dt | thinnest point thickness SD |
| ecc. | eccentricity of cornea |
| EBM | elevation back map |
| IHA | Index of height asymmetry |
| IHD | Index of height decentration |
| ISV | Index of surface variance |
| IVA | Index of vertical asymmetry |
| K1 | flat corneal curvature |
| K2 | steep corneal curvature |
| Kmax | maximal corneal curvature/maximum keratometry value |
| KC | keratoconus |
| KI | Keratoconus index |
| LB | LightBoost |
| MCT | minimal corneal thickness |
| OCT | optical coherence tomography |
| RF | Random Forest |
| Rf | radius of K1 |
| Rm | radius of Kmax |
| Rper | average radius of curvature |
| Rs | radius of K2 |
| Rmin | smallest radius of curvature |
| SD | standard deviation |
| UCVA | uncorrected visual acuity |
| XGB | XGBoost |
References
- Santodomingo-Rubido, J.; Carracedo, G.; Suzaki, A.; Villa-Collar, C.; Vincent, S.J.; Wolffsohn, J.S. Keratoconus: An updated review. Contact Lens and Anterior Eye 2022, 45, 101559. [Google Scholar] [CrossRef] [PubMed]
- Hashemi, H.; Heydarian, S.; Hooshmand, E.; Saatchi, M.; Yekta, A.; Aghamirsalim, M.; Valadkhan, M.; Mortazavi, M.; Hashemi, A.; Khabazkhoob, M. The prevalence and risk factors for keratoconus: a systematic review and meta-analysis. Cornea 2020, 39, 263–270. [Google Scholar] [CrossRef] [PubMed]
- Gordon-Shaag, A.; Millodot, M.; Shneor, E.; Liu, Y. The genetic and environmental factors for keratoconus. BioMed research international 2015, 2015. [Google Scholar] [CrossRef] [PubMed]
- Quartilho, A.; Gore, D.M.; Bunce, C.; Tuft, S.J. Royston- Parmar flexible parametric survival model to predict the probability of keratoconus progression to corneal transplantation. Eye 2020, 34, 657–662. [Google Scholar] [CrossRef] [PubMed]
- Augustin, V.A.; Son, H.S.; Baur, I.; Zhao, L.; Auffarth, G.U.; Khoramnia, R. Detecting subclinical keratoconus by biomechanical analysis in tomographically regular keratoconus fellow eyes. European Journal of Ophthalmology 2022, 32, 815–822. [Google Scholar] [CrossRef] [PubMed]
- Toprak, I.; Yaylalı, V.; Yildirim, C. A combination of topographic and pachymetric parameters in keratoconus diagnosis. Contact Lens and Anterior Eye 2015, 38, 357–362. [Google Scholar] [CrossRef] [PubMed]
- Kymes, S.M.; Walline, J.J.; Zadnik, K.; Gordon, M.O.; of Keratoconus (CLEK) Study Group, C.L.E.; others. Quality of life in keratoconus. American journal of ophthalmology 2004, 138, 527–535. [Google Scholar] [CrossRef] [PubMed]
- Li, Y.; Chamberlain, W.; Tan, O.; Brass, R.; Weiss, J.L.; Huang, D. Subclinical keratoconus detection by pattern analysis of corneal and epithelial thickness maps with optical coherence tomography. Journal of Cataract & Refractive Surgery 2016, 42, 284–295. [Google Scholar]
- Masiwa, L.E.; Moodley, V. A review of corneal imaging methods for the early diagnosis of pre-clinical Keratoconus. Journal of Optometry 2020, 13, 269–275. [Google Scholar] [CrossRef]
- Rubinfeld, R.S.; Caruso, C.; Ostacolo, C. Corneal cross-linking: the science beyond the myths and misconceptions. Cornea 2019, 38, 780–790. [Google Scholar] [CrossRef]
- Matthaei, M.; Sandhaeger, H.; Hermel, M.; Adler, W.; Jun, A.S.; Cursiefen, C.; Heindl, L.M. Changing indications in penetrating keratoplasty: a systematic review of 34 years of global reporting. Transplantation 2017, 101, 1387–1399. [Google Scholar] [CrossRef] [PubMed]
- Lalgudi, V.G.; Shetty, R.; Nischal, K.K.; Ziai, S.; Koaik, M.; Sethu, S. Biochemical and molecular alterations and potential clinical applications of biomarkers in keratoconus. Saudi Journal of Ophthalmology 2022, 36, 7–16. [Google Scholar] [CrossRef] [PubMed]
- Miyakoshi, A.; Hayashi, A.; Oiwake, T. Ophthalmic Examination Parameters for the Timing of Corneal Crosslinking Indications in Patients with Keratoconus 2022.
- Kobashi, H.; Rong, S.S.; others. Corneal collagen cross-linking for keratoconus: systematic review. BioMed Research International 2017, 2017. [Google Scholar] [CrossRef] [PubMed]
- Greenstein, S.A.; Shah, V.P.; Fry, K.L.; Hersh, P.S. Corneal thickness changes after corneal collagen crosslinking for keratoconus and corneal ectasia: one-year results. Journal of Cataract & Refractive Surgery 2011, 37, 691–700. [Google Scholar]
- Badawi, A.E.; Abou Samra, W.A.; others. Predictive factors of the standard cross-linking outcomes in adult keratoconus: one-year follow-up. Journal of ophthalmology 2017, 2017. [Google Scholar] [CrossRef] [PubMed]
- Kırgız, A.; Atalay, K.; Çabuk, K.Ş.; Kaldırım, H.; Taşkapılı, M. Factors affecting visual acuity after accelerated crosslinking in patients with progressive keratoconus. Arquivos brasileiros de oftalmologia 2016, 79, 151–154. [Google Scholar] [CrossRef]
- Lenk, J.; Herber, R.; Oswald, C.; Spoerl, E.; Pillunat, L.E.; Raiskup, F. Risk factors for progression of keratoconus and failure rate after corneal cross-linking. Journal of Refractive Surgery 2021, 37, 816–823. [Google Scholar] [CrossRef] [PubMed]
- Muftuoglu, O.; Ayar, O.; Ozulken, K.; Ozyol, E.; Akıncı, A. Posterior corneal elevation and back difference corneal elevation in diagnosing forme fruste keratoconus in the fellow eyes of unilateral keratoconus patients. Journal of Cataract & Refractive Surgery 2013, 39, 1348–1357. [Google Scholar]
- Jonnazarov Eldor, I.; Avetisov Sergey, E.; Cervatiuc Maria, I. Improvement of the visual acuity assessment system in deaf-mute children.
- AlQahtani, B.S.; Alshahrani, S.; Khayyat, W.W.; Abdalla-Elsayed, M.E.; Altalhi, A.A.; Saifaldein, A.A.; Taha, M.A. Outcomes of corneal topography among progressive keratoconus Patients 12 months following Corneal Collagen Cross-Linking. Clinical Ophthalmology.
- Cagini, C.; Di Lascio, G.; Messina, M.; Riccitelli, F.; Dua, H. Correlation of central and peripheral keratometric parameters after corneal collagen cross-linking in keratoconus patients. International Ophthalmology 2019, 39, 2041–2048. [Google Scholar] [CrossRef]
- Chan, T.C.; Tsui, R.W.; Chow, V.W.; Lam, J.K.; Wong, V.W.; Wan, K.H. Accelerated corneal collagen cross-linking in progressive keratoconus: Five-year results and predictors of visual and topographic outcomes. Indian Journal of Ophthalmology 2022, 70, 2930. [Google Scholar]
- Godefrooij, D.A.; Boom, K.; Soeters, N.; Imhof, S.M.; Wisse, R.P. Predictors for treatment outcomes after corneal crosslinking for keratoconus: a validation study. International ophthalmology 2017, 37, 341–348. [Google Scholar] [CrossRef] [PubMed]
- Koc, M.; Uzel, M.M.; Tekin, K.; Kosekahya, P.; Ozulken, K.; Yilmazbas, P. Effect of preoperative factors on visual acuity, corneal flattening, and corneal haze after accelerated corneal crosslinking. Journal of Cataract & Refractive Surgery 2016, 42, 1483–1489. [Google Scholar]
- Kling, S.; Hafezi, F. An algorithm to predict the biomechanical stiffening effect in corneal cross-linking. Journal of Refractive Surgery 2017, 33, 128–136. [Google Scholar] [CrossRef] [PubMed]
- Kránitz, K.; Kovács, I.; Miháltz, K.; Sándor, G.L.; Knorz, M.C.; Nemeth, J.; Nagy, Z.Z. Corneal changes in progressive keratoconus after cross-linking assessed by Scheimpflug camera. Journal of refractive surgery 2012, 28, 645–649. [Google Scholar] [CrossRef] [PubMed]
- Toprak, I.; Yaylalı, V.; Yildirim, C. Factors affecting outcomes of corneal collagen crosslinking treatment. Eye 2014, 28, 41–46. [Google Scholar] [CrossRef] [PubMed]
- Subasinghe, S.K.; Ogbuehi, K.C.; Mitchell, L.; Dias, G.J. Morphological alterations of the cornea following crosslinking treatment (CXL). Clinical Anatomy 2021, 34, 859–866. [Google Scholar] [CrossRef] [PubMed]
- Kuechler, S.J.; Tappeiner, C.; Epstein, D.; Frueh, B.E. Keratoconus progression after corneal cross-linking in eyes with preoperative maximum keratometry values of 58 diopters and steeper. Cornea 2018, 37, 1444–1448. [Google Scholar] [CrossRef] [PubMed]
- Steinberg, J.; Ahmadiyar, M.; Rost, A.; Frings, A.; Filev, F.; Katz, T.; Linke, S.J. Anterior and posterior corneal changes after crosslinking for keratoconus. Optometry and Vision Science 2014, 91, 178–186. [Google Scholar] [CrossRef] [PubMed]
- Nattis, A.; Donnenfeld, E.D.; Rosenberg, E.; Perry, H.D. Visual and keratometric outcomes of keratoconus patients after sequential corneal crosslinking and topography-guided surface ablation: early United States experience. Journal of Cataract & Refractive Surgery 2018, 44, 1003–1011. [Google Scholar]
- Ozek, D.; Karaca, E.E.; Kemer, O.E. Accelerated corneal cross-linking with hypo-osmolar riboflavin in thin keratoconic corneas: 2-year follow-up. Arquivos Brasileiros de Oftalmologia 2020, 83, 277–282. [Google Scholar] [CrossRef]
- Patel, S.; Tutchenko, L. The refractive index of the human cornea: A review. Contact Lens and Anterior Eye 2019, 42, 575–580. [Google Scholar] [CrossRef]
- Cunha, A.M.; Correia, P.J.; Alves, H.; Torrão, L.; Moreira, R.; Falcão-Reis, F.; Pinheiro-Costa, J. Keratoconus enlargement as a predictor of keratoconus progression. Scientific Reports 2021, 11, 21079. [Google Scholar] [CrossRef] [PubMed]
- Hayes, S.; Jaycock, P.; Rees, N.; Figueiredo, F.C.; O’Brart, D.P.; Meek, K.M. National survey of corneal cross-linking (CXL) practice patterns in the United Kingdom during 2019. Eye 2023, 37, 2511–2517. [Google Scholar] [CrossRef] [PubMed]
- Choi, J.A.; Kim, M.S. Progression of keratoconus by longitudinal assessment with corneal topography. Investigative ophthalmology & visual science 2012, 53, 927–935. [Google Scholar]
- Holopainen, J.M.; Krootila, K. Transient corneal thinning in eyes undergoing corneal cross-linking. American journal of ophthalmology 2011, 152, 533–536. [Google Scholar] [CrossRef] [PubMed]
- Brown, S.E.; Simmasalam, R.; Antonova, N.; Gadaria, N.; Asbell, P.A. Progression in keratoconus and the effect of corneal cross-linking on progression. Eye & contact lens 2014, 40, 331–338. [Google Scholar]
- Wisse, R.P.; Godefrooij, D.A.; Soeters, N.; Imhof, S.M.; Van der Lelij, A. A multivariate analysis and statistical model for predicting visual acuity and keratometry one year after cross-linking for keratoconus. American Journal of Ophthalmology 2014, 157, 519–525. [Google Scholar] [CrossRef]
- Tian, M.; Ma, P.; Zhou, W.; Feng, J.; Mu, G. Outcomes of corneal crosslinking for central and paracentral keratoconus. Medicine 2017, 96. [Google Scholar] [CrossRef]
- Kato, N.; Negishi, K.; Sakai, C.; Tsubota, K. Baseline factors predicting the need for corneal crosslinking in patients with keratoconus. PloS one 2020, 15, e0231439. [Google Scholar] [CrossRef]
- Kato, N.; Masumoto, H.; Tanabe, M.; Sakai, C.; Negishi, K.; Torii, H.; Tabuchi, H.; Tsubota, K. Predicting keratoconus progression and need for corneal crosslinking using deep learning. Journal of clinical medicine 2021, 10, 844. [Google Scholar] [CrossRef]
- Kamiya, K.; Ayatsuka, Y.; Kato, Y.; Shoji, N.; Miyai, T.; Ishii, H.; Mori, Y.; Miyata, K. Prediction of keratoconus progression using deep learning of anterior segment optical coherence tomography maps. Annals of Translational Medicine 2021, 9. [Google Scholar] [CrossRef]
Figure 1.
Schematic presentation of elevation back parameters.
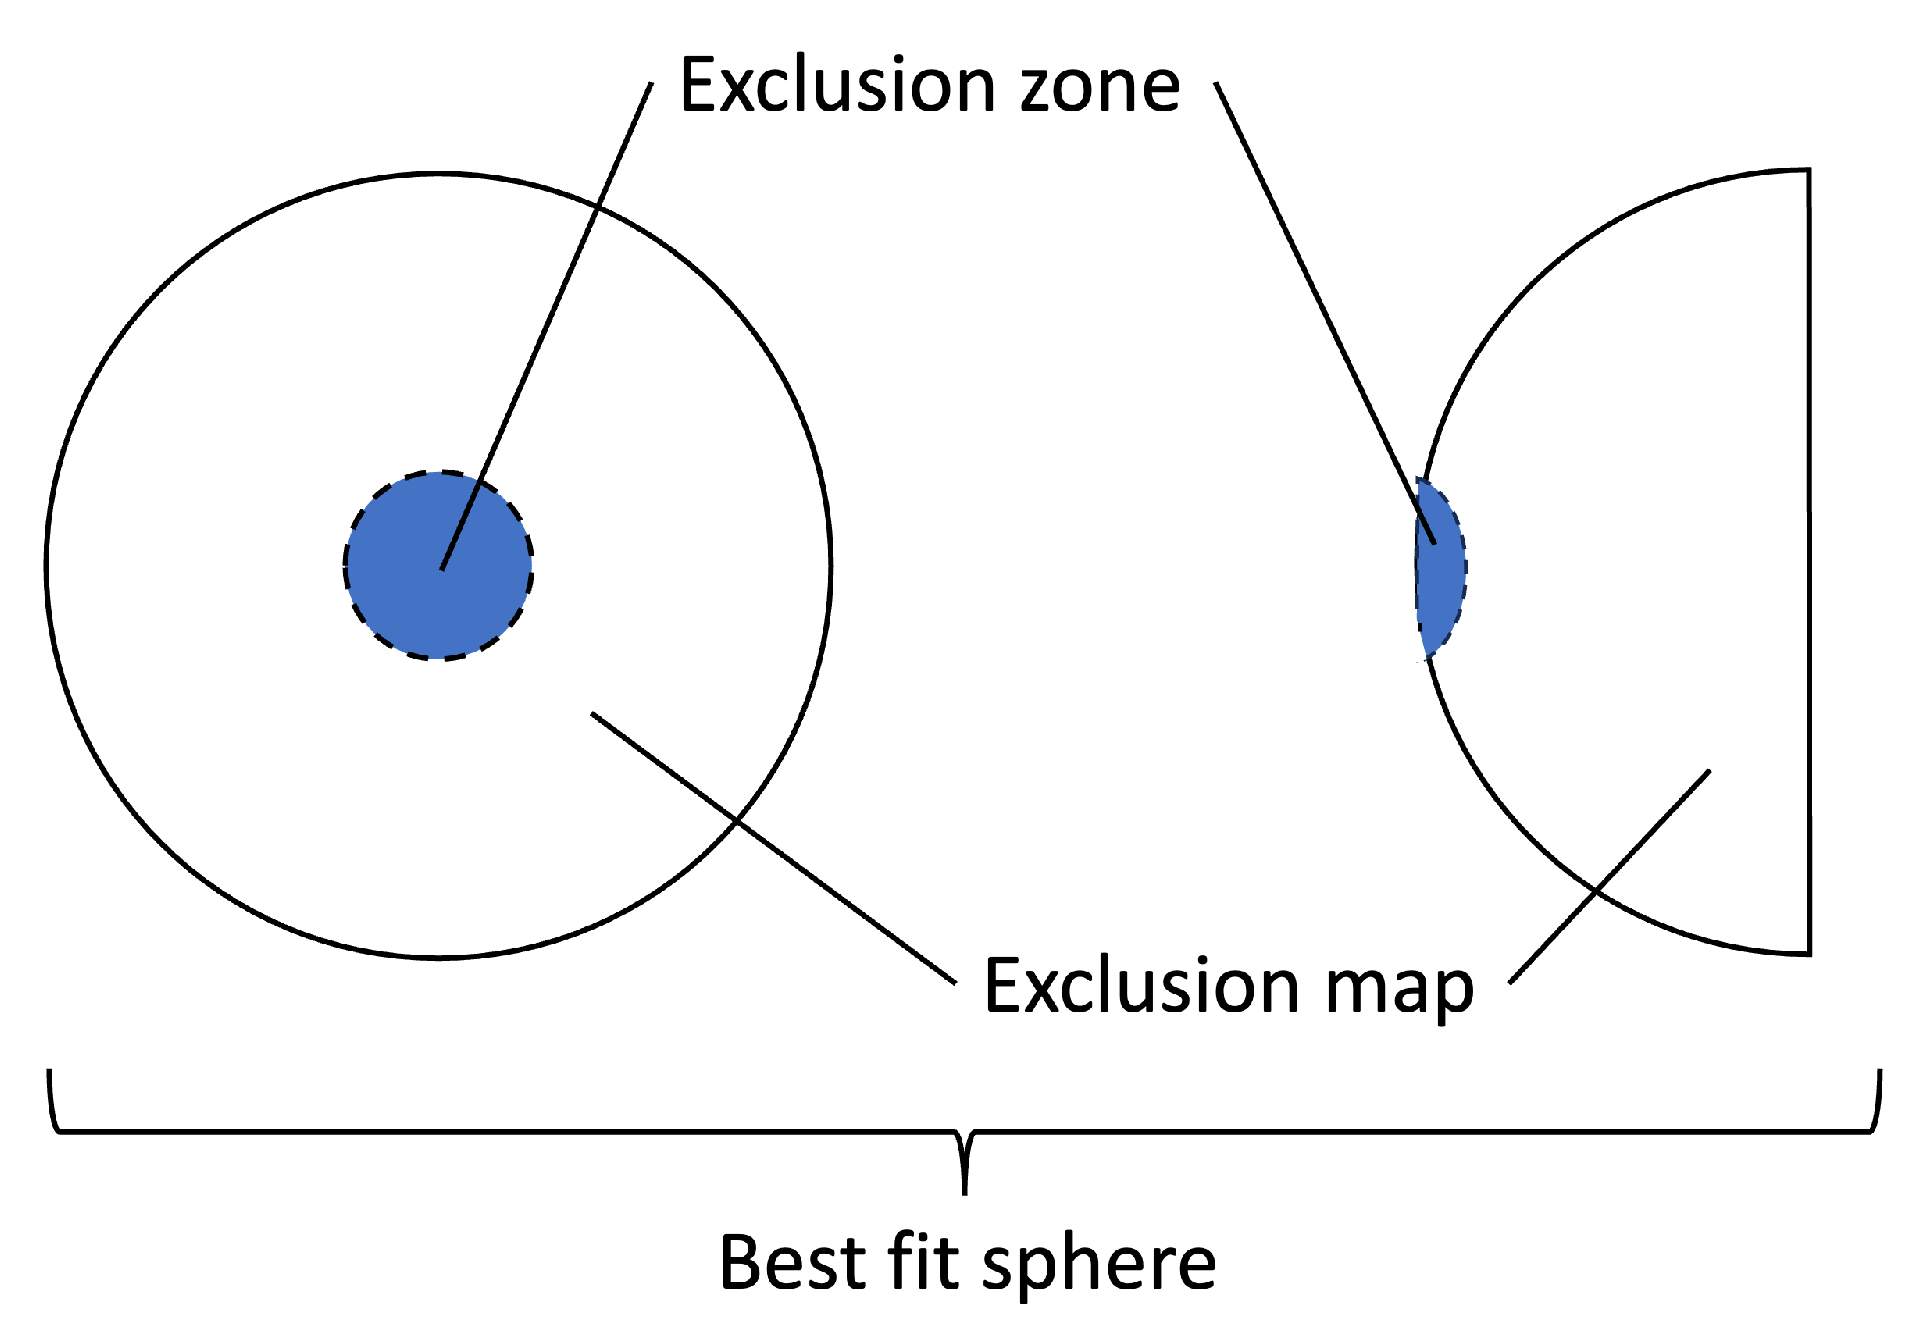
Figure 2.
Coefficients of Pearson correlations between corneal thickness before and after CXL (p<0.05).
Figure 2.
Coefficients of Pearson correlations between corneal thickness before and after CXL (p<0.05).
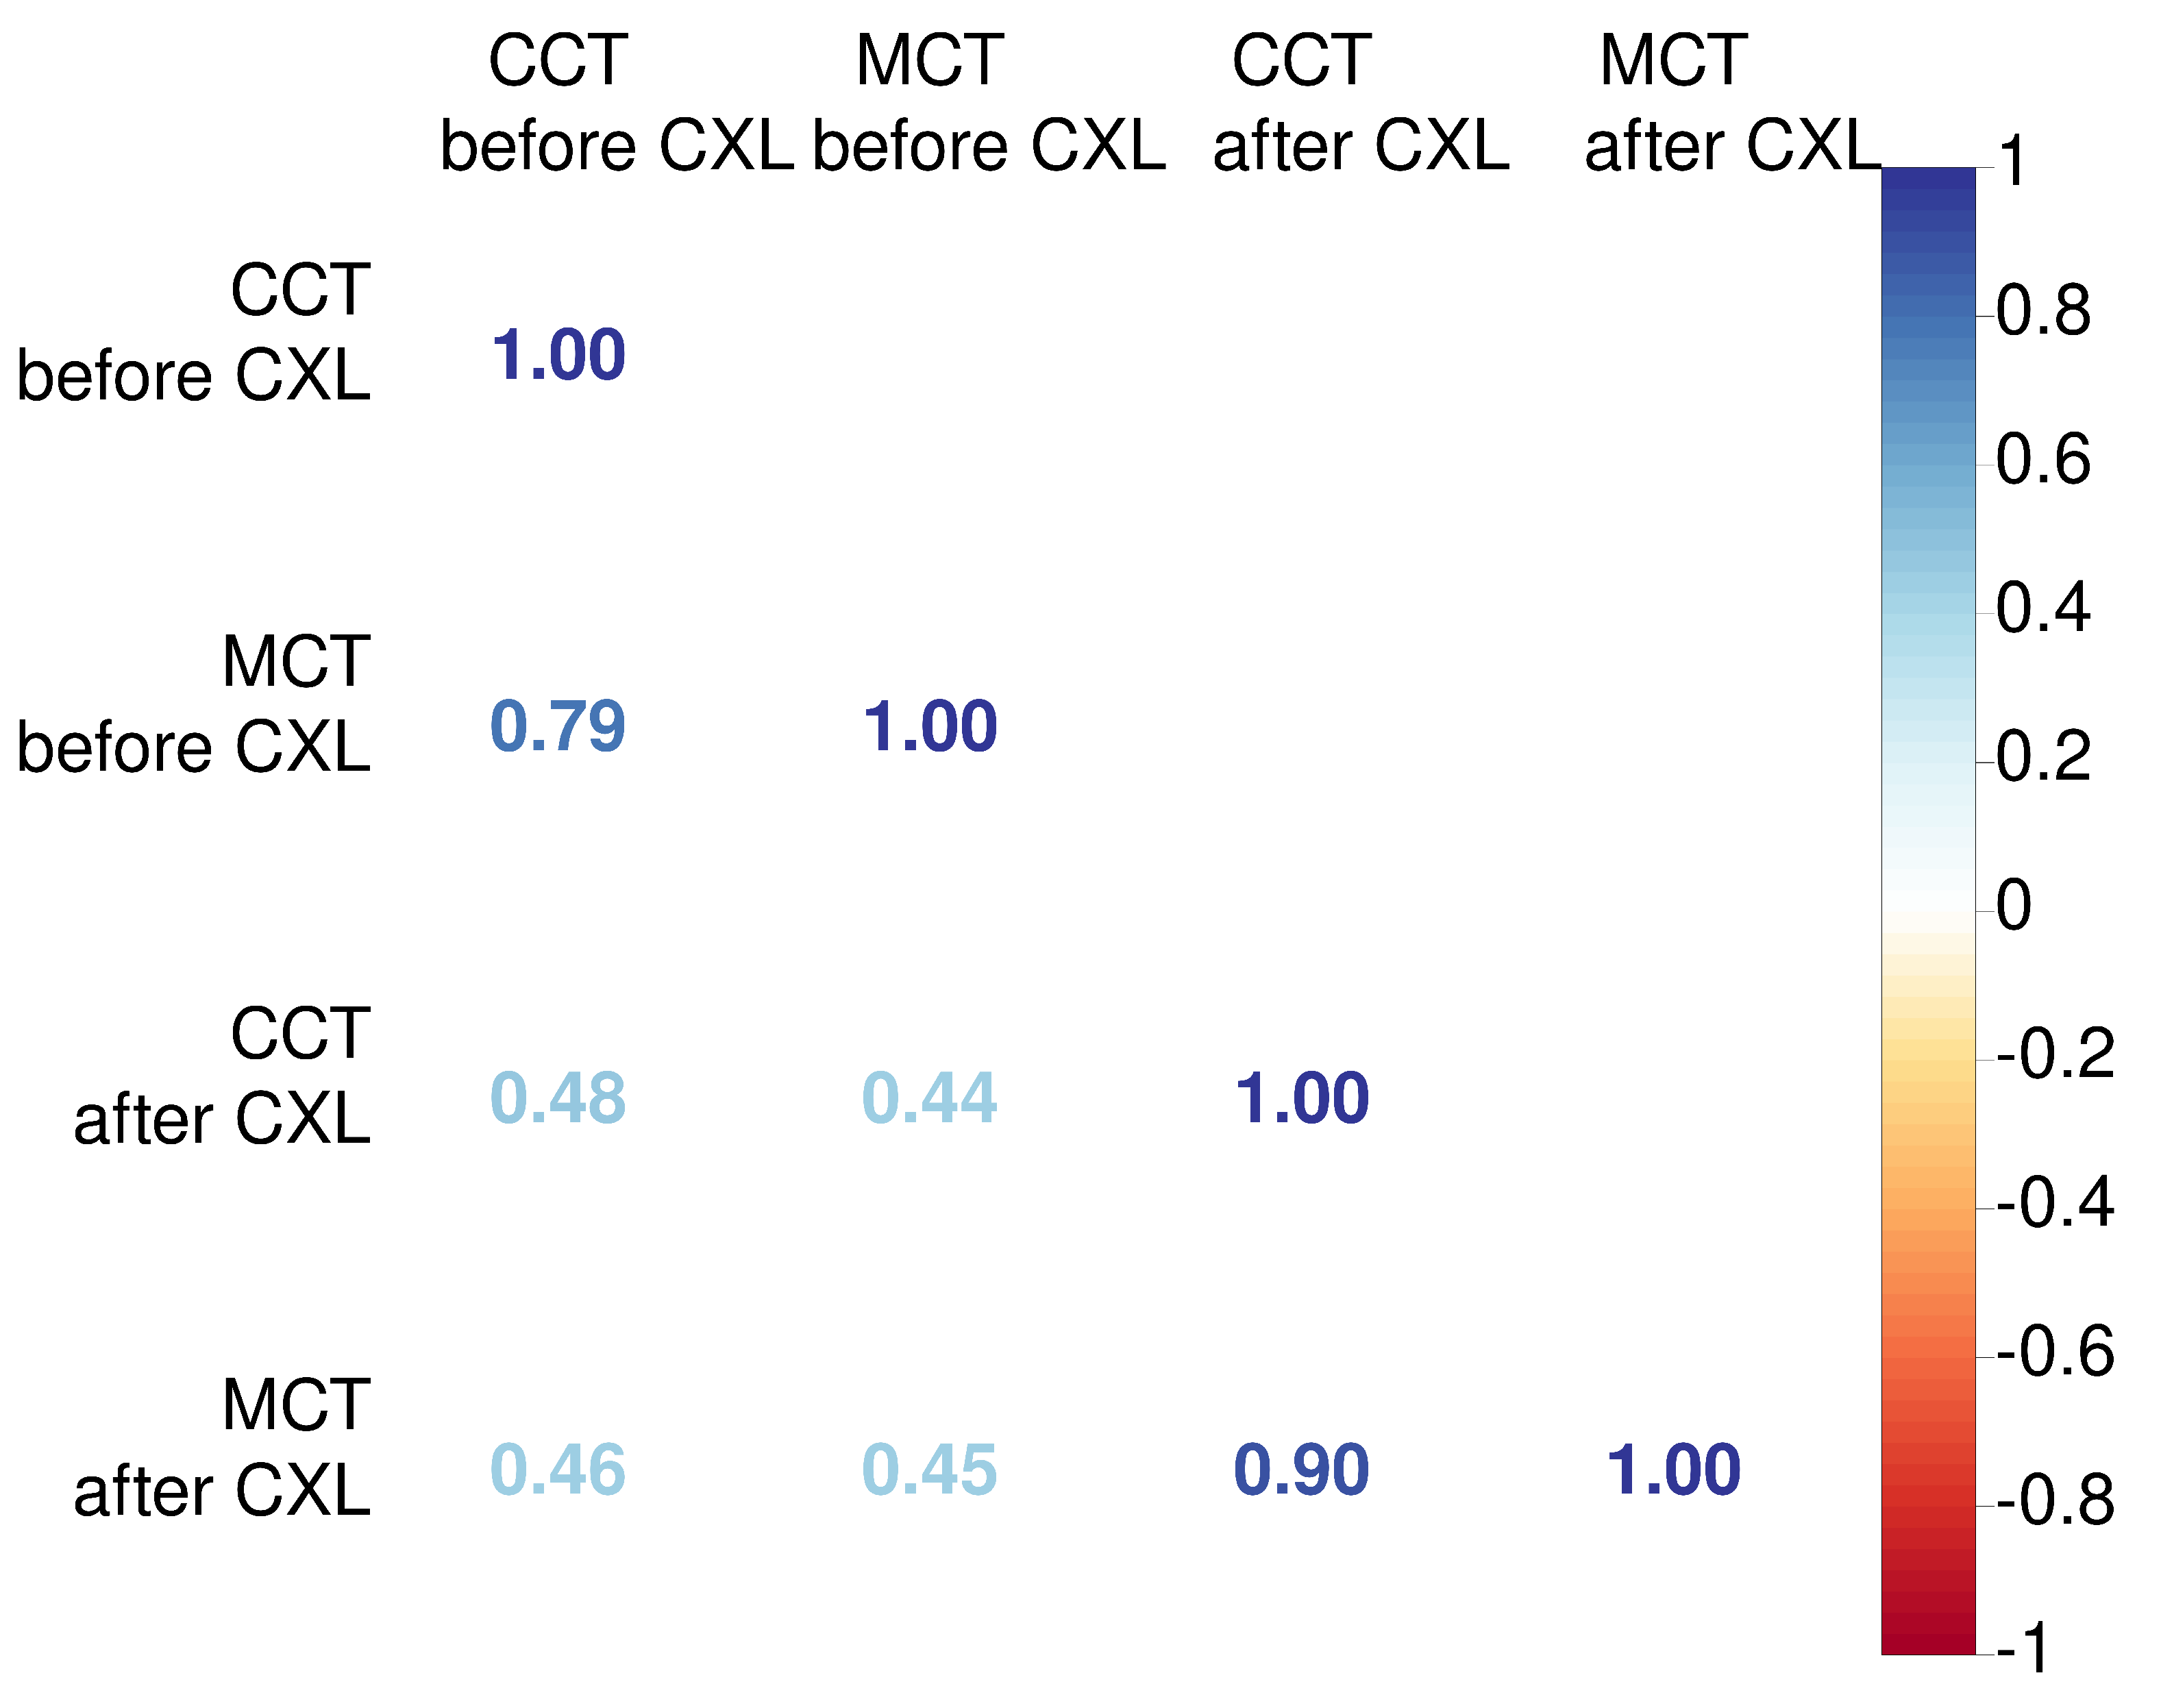
Figure 3.
Pearson correlations of postoperative corneal thickness with keratometry, pachymetry and visiorefractometry findings before CXL (A), corneal topography and deviation indices before CXL (B). Colour of numbers encodes p-level, insignificant associations are marked with crosses.
Figure 3.
Pearson correlations of postoperative corneal thickness with keratometry, pachymetry and visiorefractometry findings before CXL (A), corneal topography and deviation indices before CXL (B). Colour of numbers encodes p-level, insignificant associations are marked with crosses.
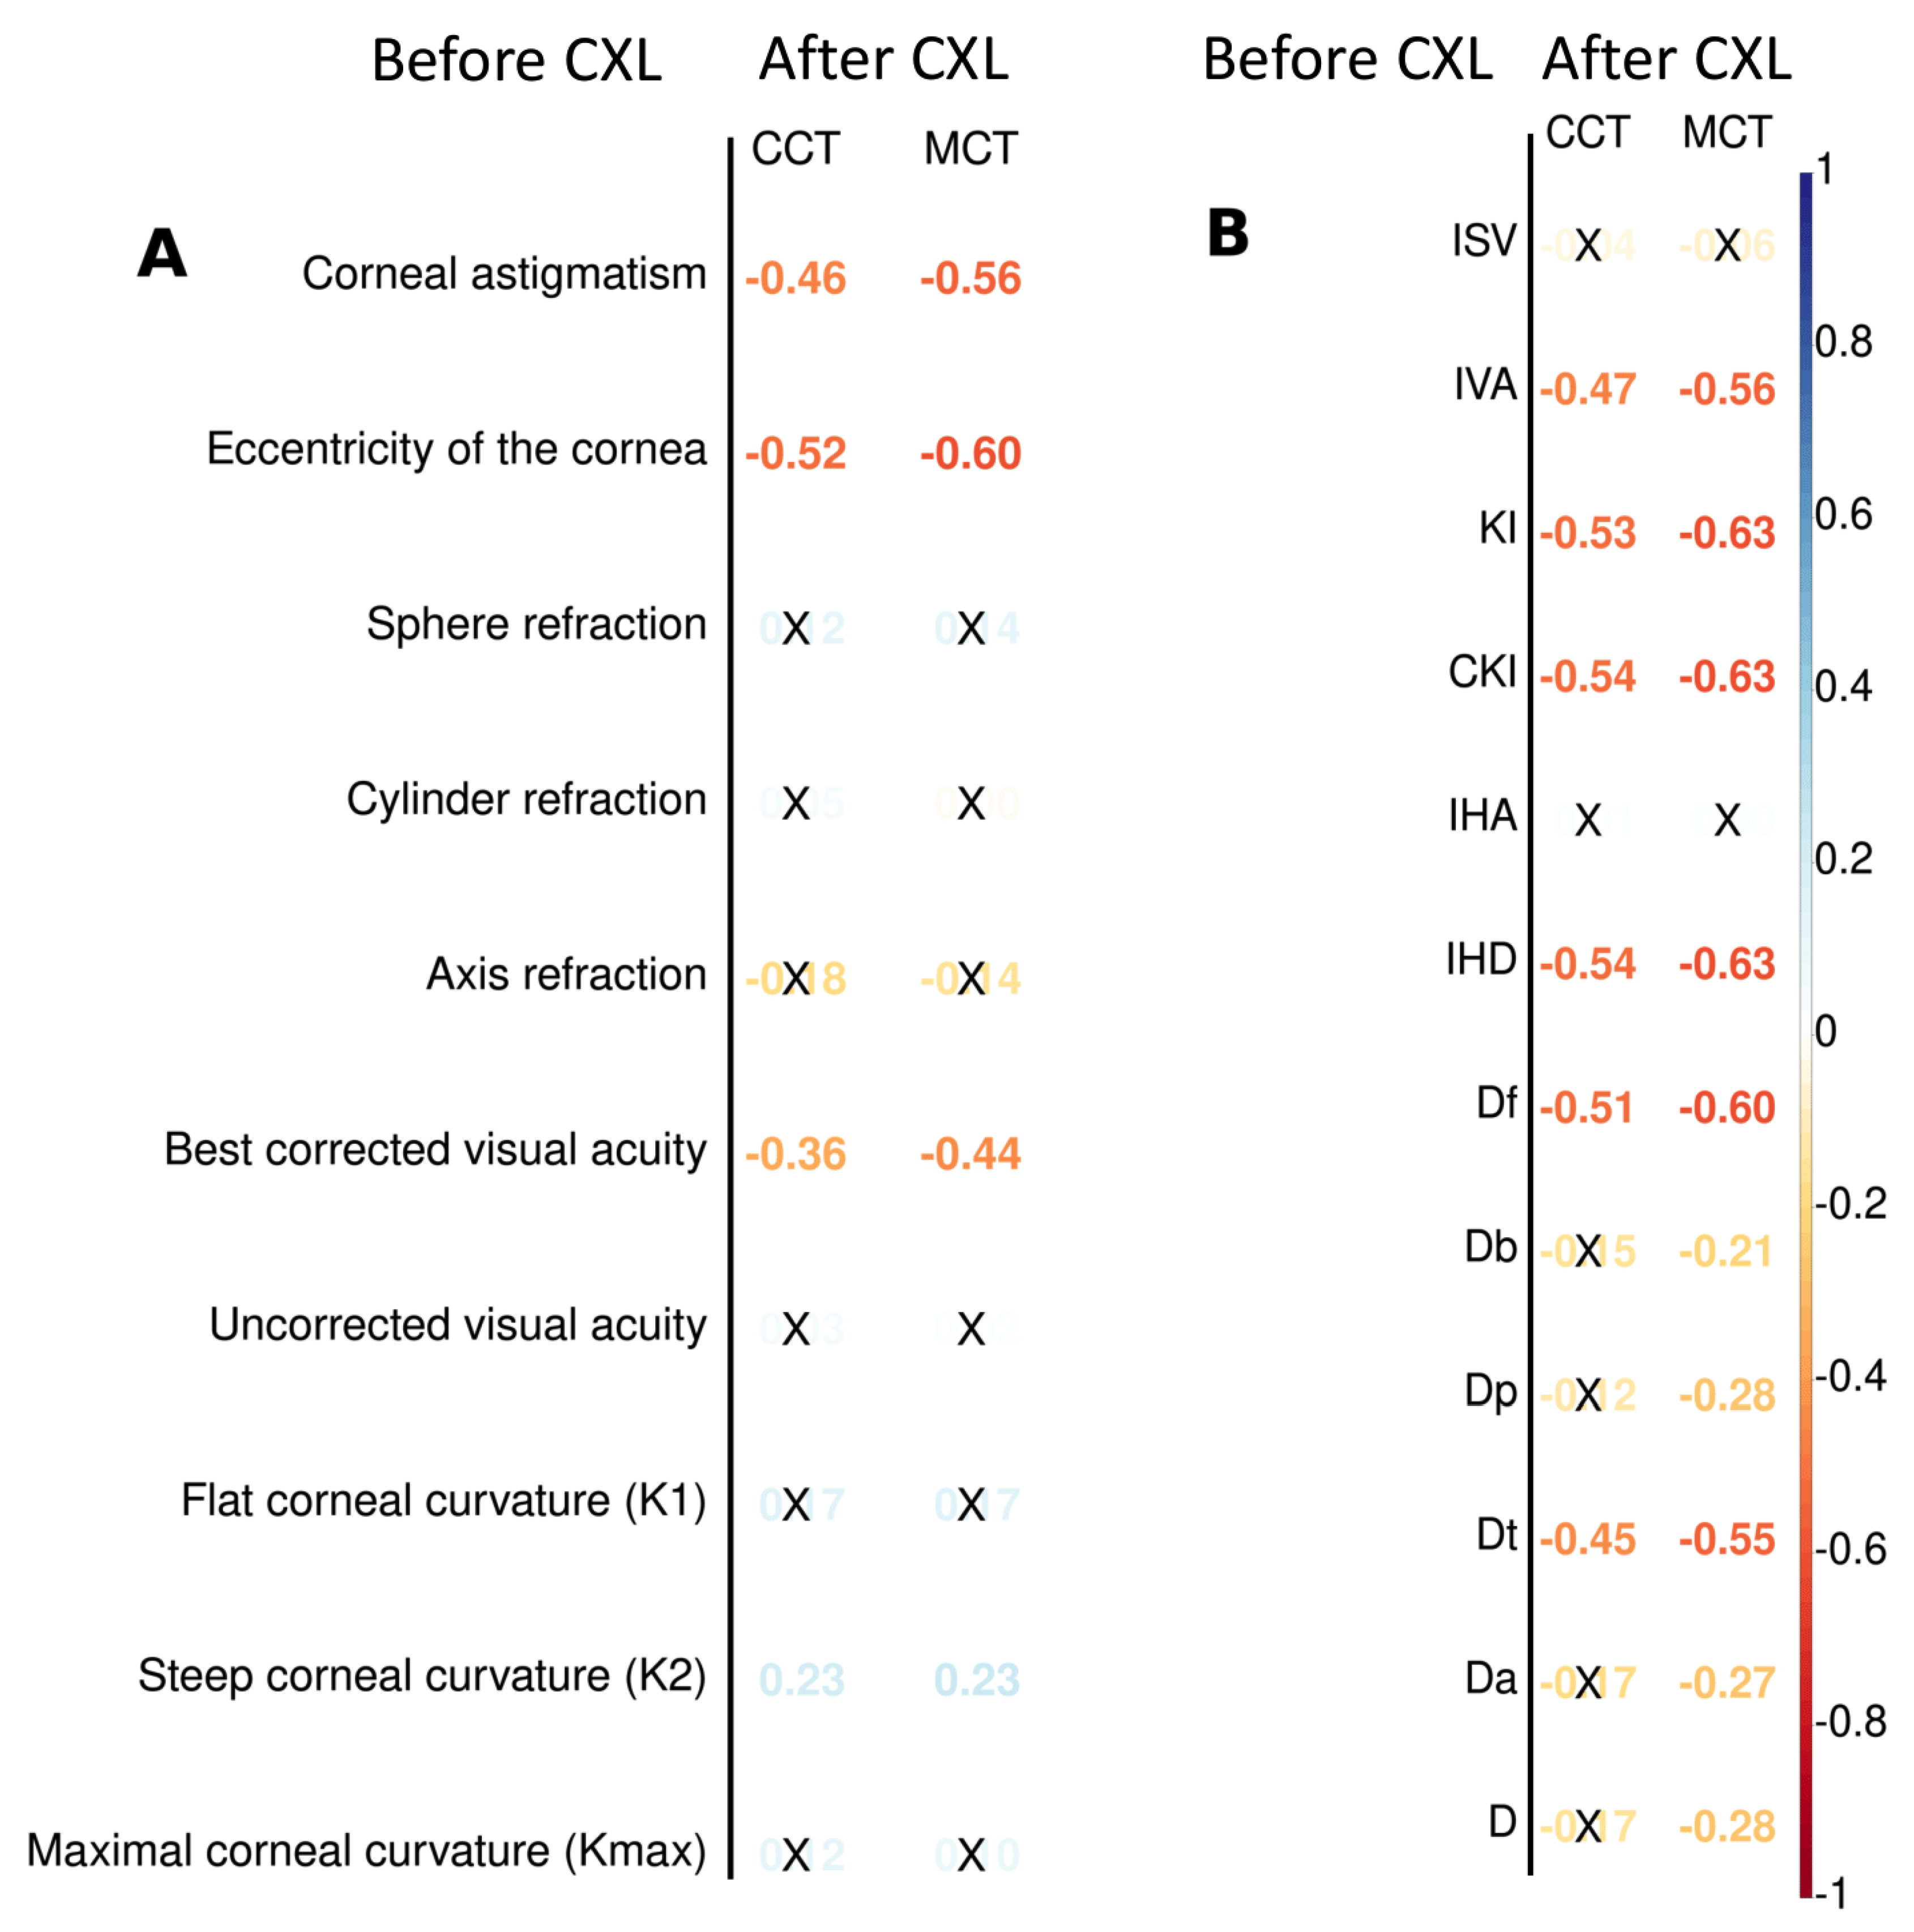
Figure 4.
Pearson correlations of postoperative corneal thickness with preoperative parameters of elevation back maps: posterior elevation (A), posterior elevation with the best fit sphere (B); exclusion map (C), exclusion zone (D). Numbers show correlation coefficients for significant associations.
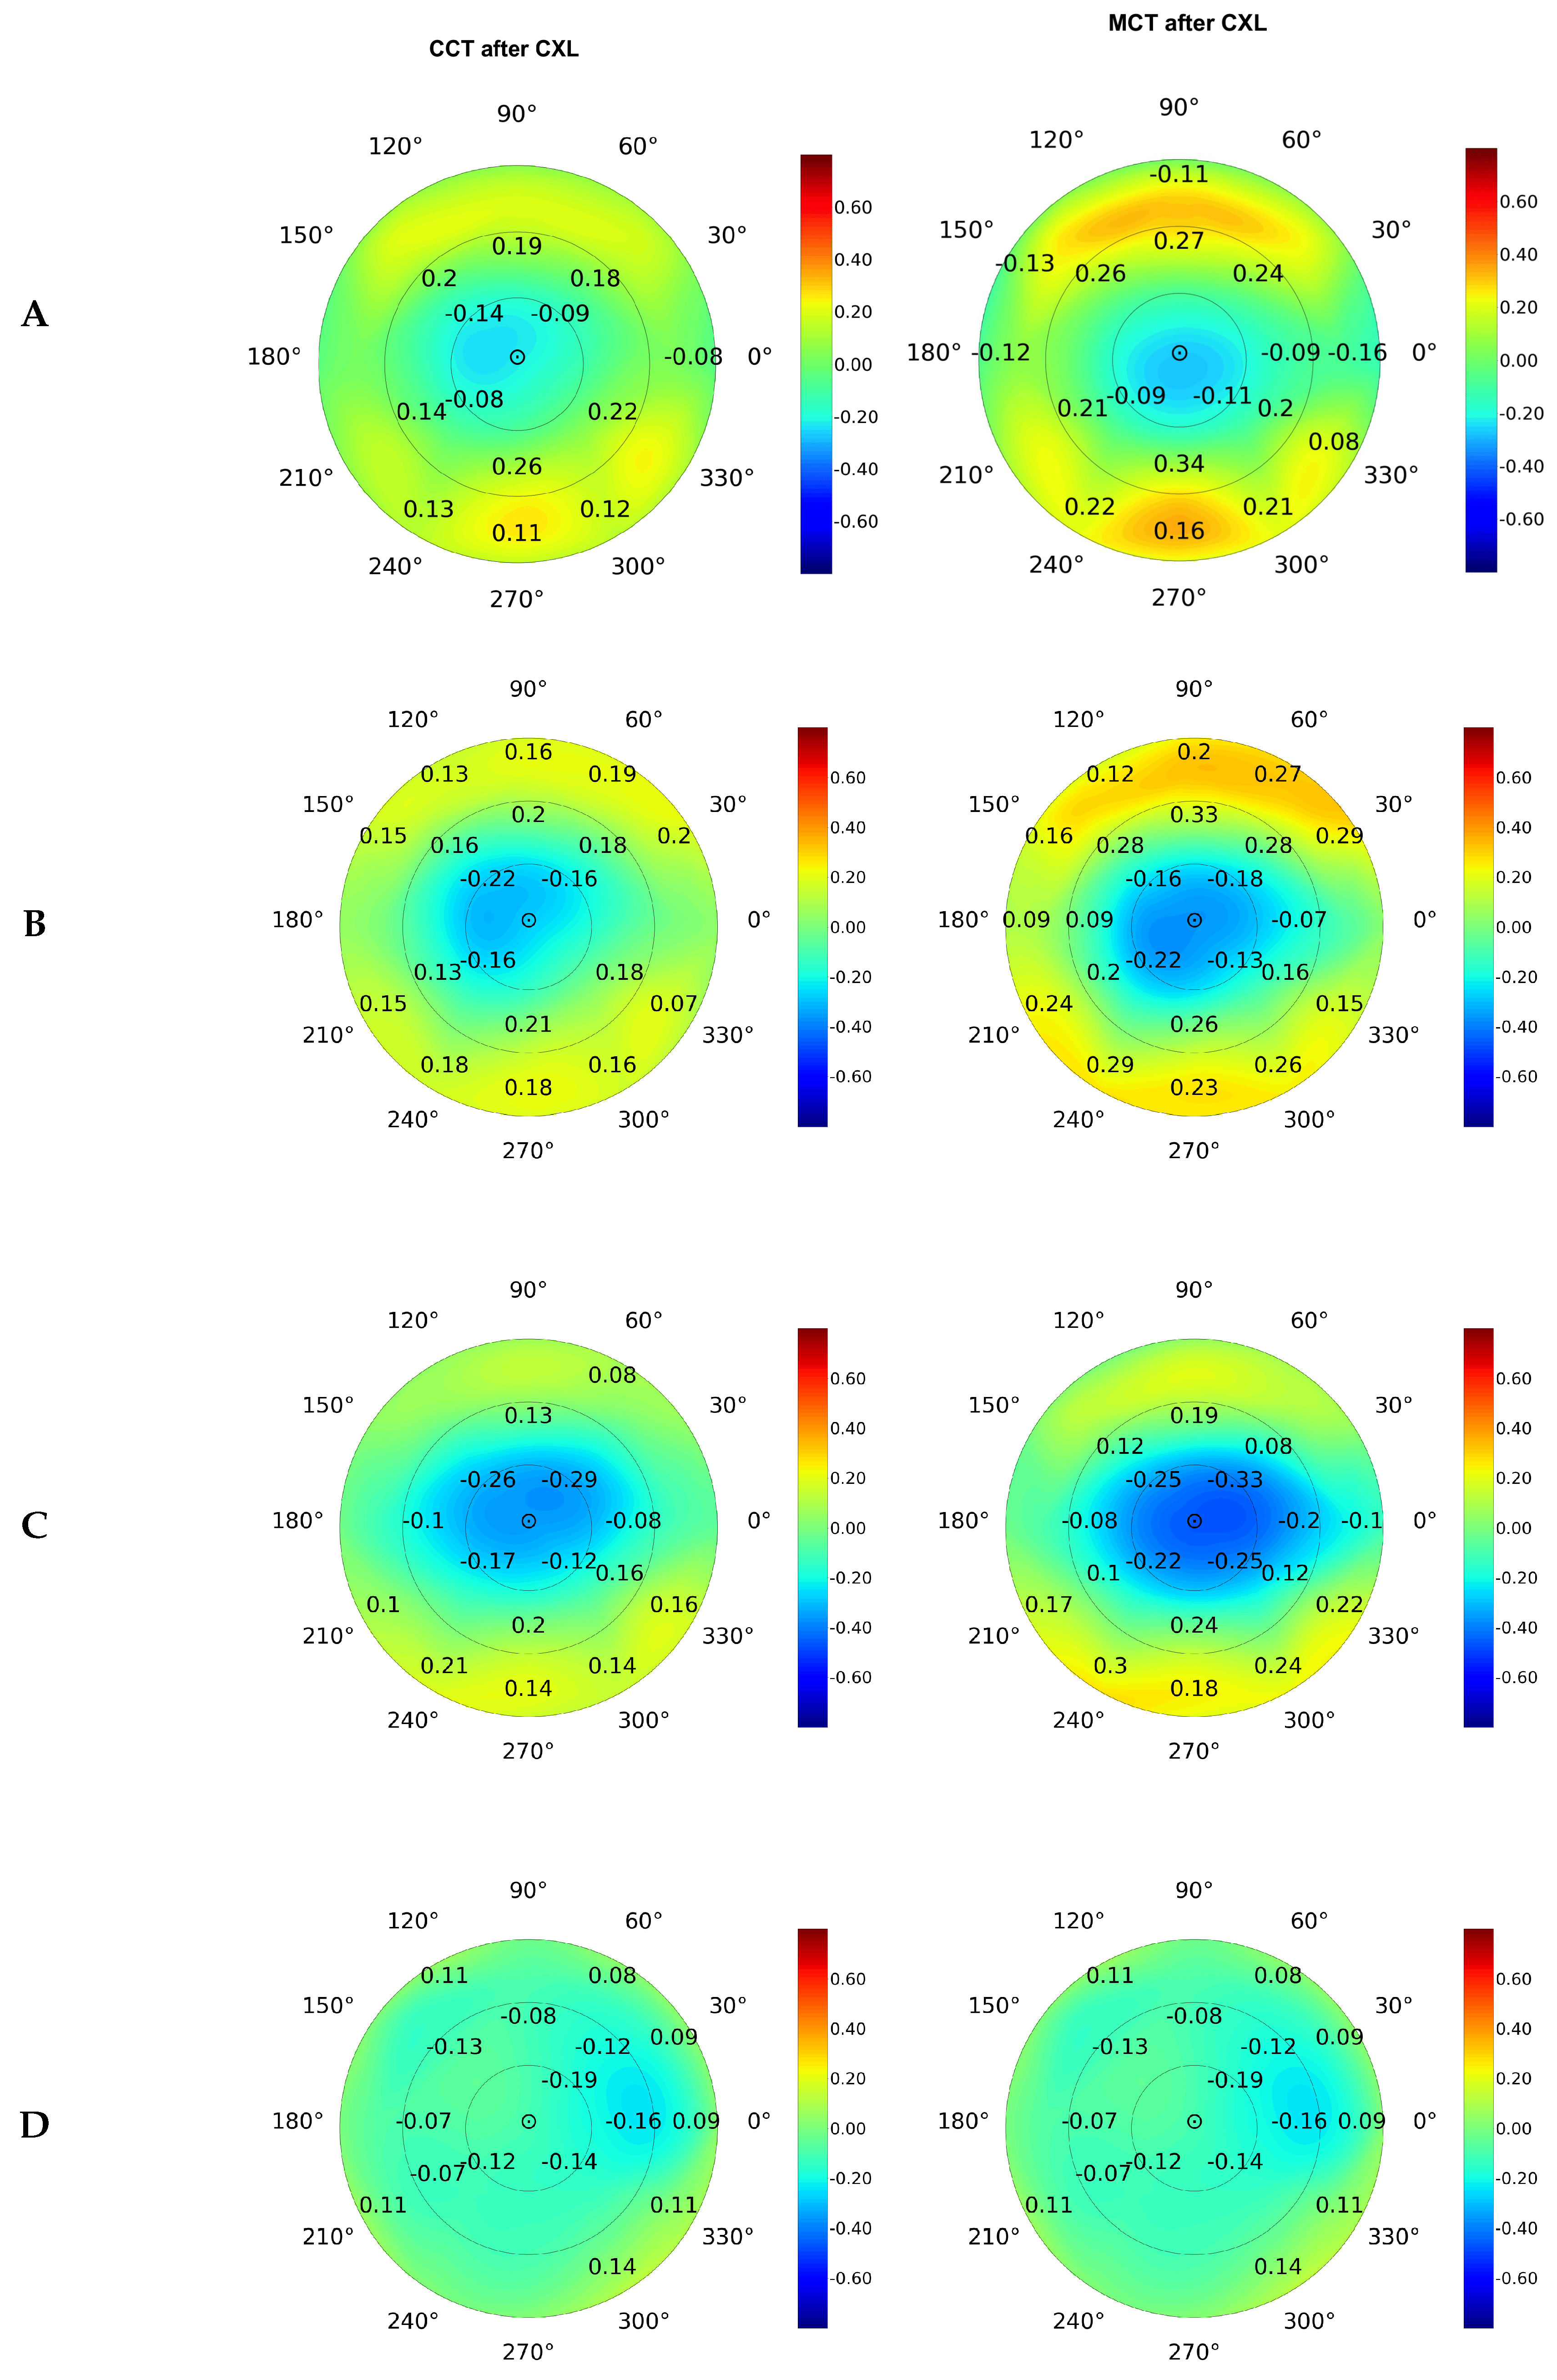
Figure 5.
Postoperative changes in central (A) and minimal (B) corneal thickness.
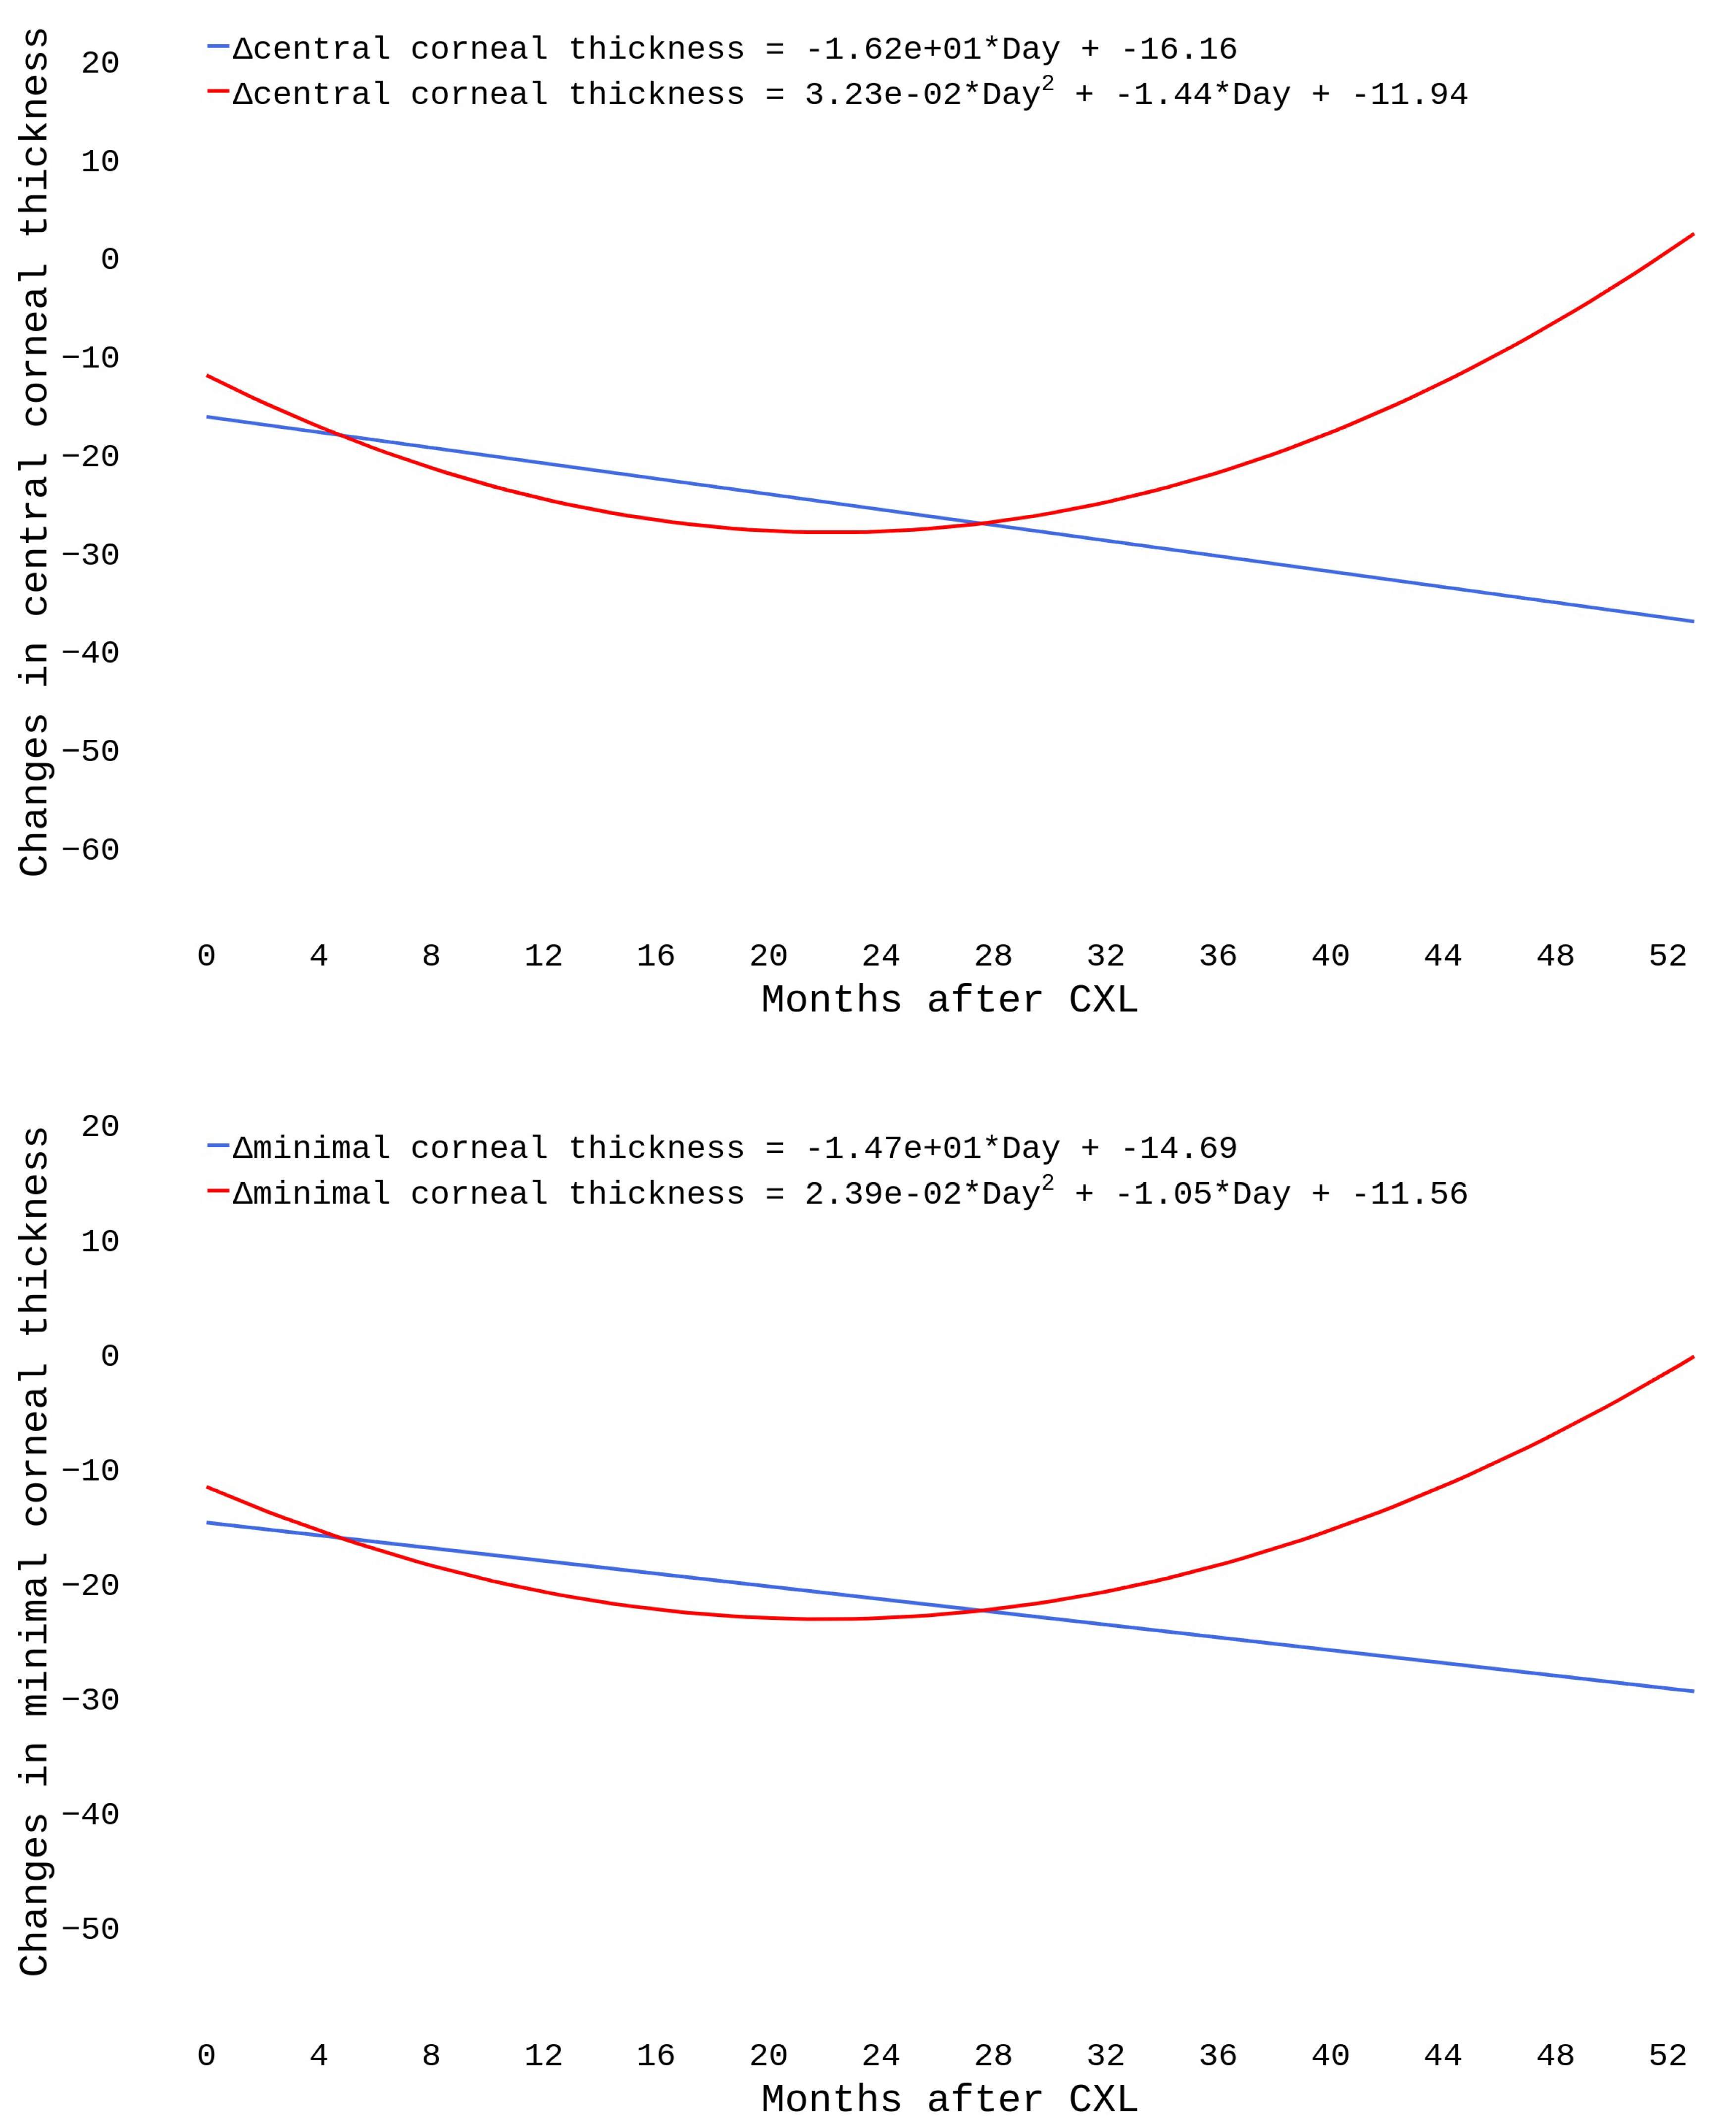
Figure 6.
Accuracy of regression models trained to predict postoperative changes in central and minimal corneal thickness from different input data.
Figure 6.
Accuracy of regression models trained to predict postoperative changes in central and minimal corneal thickness from different input data.
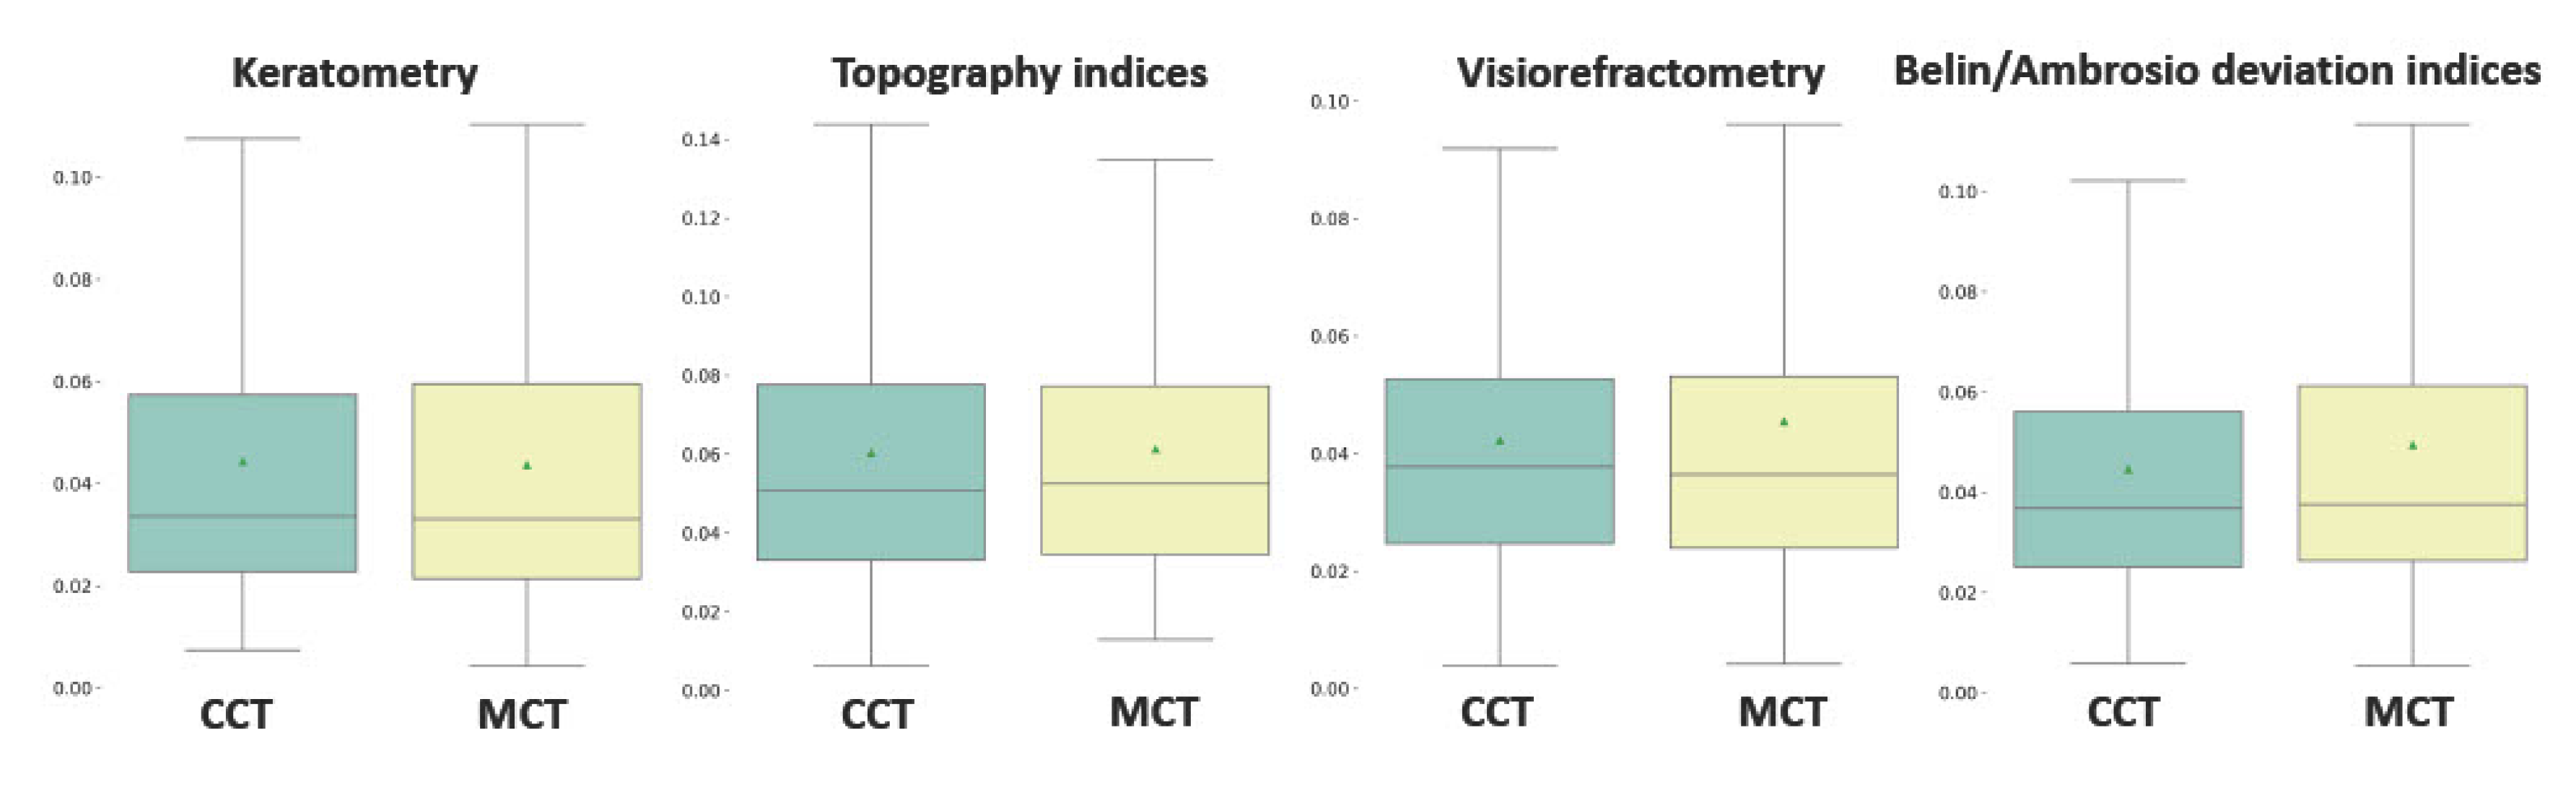

Table 1.
Characteristics of study participants before and after CXL.
| Parameter | Unit | Before CXL | After CXL | p-value |
|---|---|---|---|---|
| n1=131 | n2=110 | |||
| VISIOREFRACTOMETRY | ||||
| Sphere refraction | SE | -3.06 ± 3.93 | -3.63 ± 4.28 | 0.1891 |
| Axis refraction | SE | 83.65 ± 49.92 | 94.14 ± 55.22 | 0.1057 |
| Uncorrected visual acuity | DEC | 0.27 ± 0.23 | 0.33 ± 0.3 | 0.0286 |
| Corrected (sphere) visual acuity | D | -2.8 ± 3.54 | -3.12 ± 3.09 | 0.3461 |
| Corrected (cylinder) visual acuity | D | -3.49 ± 2.37 | -2.98 ± 2.46 | 0.0744 |
| Corrected (axis) visual acuity | 90.41 ± 42.63 | 93.34 ± 48.08 | 0.5946 | |
| Best corrected visual acuity | DEC | 0.62 ± 0.25 | 0.62 ± 0.26 | 0.9995 |
| PACHYMETRY | ||||
| Central corneal thickness | m | 479.21 ± 38.35 | 465.57 ± 42.36 | <0.0001 |
| Minimal corneal thickness | m | 457.74 ± 35.56 | 442.15 ± 40.84 | <0.0001 |
| KERATOMETRY | ||||
| Corneal astigmatism | D | -1.79 ± 3.96 | -1.68 ± 3.81 | 0.6398 |
| Flat corneal curvature, K1 | D | 45.64 ± 3.83 | 44.96 ± 4.03 | <0.0001 |
| Steep corneal curvature, K2 | D | 49.08 ± 4.54 | 48.61 ± 4.58 | 0.0082 |
| Maximal corneal curvature, Kmax | D | 56.68 ± 6.44 | 55.61 ± 6.5 | <0.0001 |
| Radius of K1 | mm | 7.45 ± 0.60 | 7.57 ± 0.63 | <0.0001 |
| Radius of K2 | mm | 6.9 ± 0.60 | 6.99 ± 0.65 | 0.0047 |
| Radius of Kmax | mm | 7.15 ± 0.59 | 7.26 ± 0.61 | 0.0002 |
| Eccentricity of the cornea | – | 0.81 ± 0.41 | 0.71 ± 0.47 | 0.0004 |
| Average radius of curvature | mm | 8.01 ± 0.42 | 9.35 ± 13.1 | 0.2867 |
| Smallest radius of curvature | mm | 6.02 ± 0.66 | 6.13 ± 0.68 | 0.0009 |
| n1=131 | n2=110 | |||
| TOPOGRAPHY INDICES | ||||
| Index of surface variance, ISV | – | 98.15 ± 36.72 | 93.21 ± 38.53 | 0.0166 |
| Index of vertical asymmetry, IVA | – | 1.10 ± 0.46 | 1.05 ± 0.51 | 0.0386 |
| Keratoconus index, KI | – | 1.27 ± 0.11 | 1.25 ± 0.13 | 0.0154 |
| Central keratoconus index, CKI | – | 1.07 ± 0.06 | 1.05 ± 0.08 | 0.0039 |
| Index of height asymmetry, IHA | – | 31.22 ± 27.51 | 33.49 ± 33.76 | 0.5460 |
| Index of height decentration, IHD | – | 0.15 ± 0.07 | 0.14 ± 0.07 | 0.0012 |
| BELIN/AMBROSIO DEVIATION INDICES | ||||
| SD of changes in the front elevation, Df | – | 11.58 ± 6.33 | 10.17 ± 6.74 | <0.0001 |
| SD of changes in the back elevation, Db | – | 9.28 ± 5.42 | 9.42 ± 5.72 | 0.6484 |
| SD of pachymetric progression, Dp | – | 9.85 ± 5.04 | 12.83 ± 6.7 | <0.0001 |
| SD of thinnest point thickness, Dt | – | 2.83 ± 1.44 | 3.54 ± 1.75 | <0.0001 |
| SD of thinnest point displacement, Da | – | 3.26 ± 0.68 | 3.37 ± 0.57 | 0.0932 |
| Complex index, D | – | 9.5 ± 3.45 | 9.86 ± 4.01 | 0.0770 |
| *Data are expressed as mean ± SD. The mean length of observation is 14.01 ± 9.98 months. | ||||
Disclaimer/Publisher’s Note: The statements, opinions and data contained in all publications are solely those of the individual author(s) and contributor(s) and not of MDPI and/or the editor(s). MDPI and/or the editor(s) disclaim responsibility for any injury to people or property resulting from any ideas, methods, instructions or products referred to in the content. |
© 2024 by the authors. Licensee MDPI, Basel, Switzerland. This article is an open access article distributed under the terms and conditions of the Creative Commons Attribution (CC BY) license (http://creativecommons.org/licenses/by/4.0/).
Copyright: This open access article is published under a Creative Commons CC BY 4.0 license, which permit the free download, distribution, and reuse, provided that the author and preprint are cited in any reuse.


