Submitted:
26 May 2024
Posted:
28 May 2024
You are already at the latest version
Abstract
The burden of hypertension remains unacceptably high globally, particularly in low- and middle-income countries (LMICs). Workplace offer enormous potential as an idea setting for early detection and treatment of hypertension among the working class. Analysis of such a Workplace Screening Programme can reveal information about its potential impact. Machine learning techniques such as k-Means Clustering are untapped tools for such analyses. We set out to deploy this tool for the analysis of our university annual medical screening of workforce for hypertension. An anonymized dataset containing the demography and blood pressure measurements values obtained from staffs of different departments/units in an academic institution was obtained. The total number of samples or data points are 1, 723 in which the input dataset contains six features, including year category (2018, 2019, 2021,2022), Department/Unit (academic and non-academic), gender (male and female), while the target output is the blood pressure status (low, normal and high) respectively. Analysis of the dataset was carried out using machine learning techniques. In this retrospective analysis, it was observed that the mean age for this working class is 42 years old. Similarly, it was discovered that hypertension was prevalent among members of staff above the age of 40 irrespective of their gender or professional category (academic or non-academic). The analysis also revealed that there was a steady decline in the prevalence of hypertension from 2018 to 2022. From the research, it is evident that the adoption of machine learning techniques for periodic analyses of workplace health status screening initiative (especially for hypertension) is effective, feasible, and sustainable to diagnose and control hypertension among the working class.
Keywords:
Machine learning
; Hypertension
; Analysis
; Prediction
; Medical record.
1. Introduction
Hypertension, simply known as elevated blood pressure, is the number one risk factor for death globally, significantly increasing the risk of developing cardiovascular, brain, and kidney diseases [1]. Globally, 1.28 billion people between the ages of 30 and 79 were reported to have hypertension in 2019. Two-thirds of these adults reside in low- and middle-income nations [2]. Regrettably, the WHO African Region has the highest prevalence of hypertension (27%) while the WHO Americas Region has the lowest prevalence of hypertension (18%) [2]. Sadly, an estimated 46% of persons with hypertension are ignorant of their disease and only 21% of persons with hypertension have it under control [3]. Screening programmes for hypertension could help to reduce morbidity and mortality associated with the condition in adults [4].
Employee’s health status is of great importance to the stability and development of any institution and the society at large. However, it has been reported that the cardiovascular health status of occupational population worldwide is not optimal [5]. Fortunately, workplace health programme such as employee’s periodic screening have been shown to protect the individual employee’s overall health [6], improve his/her productivity [7], lower the overall medical costs [7], and reduce disease prevalence in general [8,9]. Occupational screening of employees at work is an effective approach of identifying undiagnosed hypertensive people [10].
K-Means Clustering is a machine-learning technique capable of providing useful insight into the behavior and patterns of data [11]. It has been applied in diverse areas in medical science such as cancerous cell detection, segmentation of brain images, skin treatment, intrathoracic airway trees, and abnormality detection of heart ventricles [12,13]. Analysis of workplace and occupational screenings, where patient data may be complex, multidimensional, and subject to variable degrees of uncertainty, is particularly well-suited for k-Means clustering. In this study, we applied k-Means Clustering algorithm to analyze health medical records from the university workforce.
2. Methodology
2.1. Study Site and Participants
This retrospective study was carried out between December 17, 2018, and December 20, 2022, at the Bowen University Hospital located in the urban setting of Iwo (population range of 250,000-499,999 inhabitants), Osun State in southwestern Nigeria. Bowen University, founded by the Nigerian Baptist Convention in 2001, is one of the oldest private coeducational institutions of higher education in Nigeria. This retrospective study included 1723 rows of datasets from the workforce at Bowen University across different academic and non-academic units of the university.
2.2. Dataset Acquisition
The dataset was collated from staff in different units of an academic institution for a period of four years (2018, 2019, 2021 and 2022). The blood pressure measurements used in this screening programme were taken by nurses and community health extension workers trained in manual blood pressure measurement, including proper body positioning during measurement. BPs were measured manually using a stethoscope and the appropriate sized brachial pressure cuff with a sphygmomanometer. The participants did not smoke or ingest caffeine or other stimulants or food in the 30 minutes before the measurements, which were taken after at least 5 minutes of rest in a quiet and calm environment Two BP readings were taken on both arms of employees in a sitting position and at 2-minute interval. If the first two readings differ by more than 10mmHg, additional readings were obtained in line with American Heart Association (AHA) recommendations [14].
Equipment was inspected on a routine basis to ensure accuracy. Employees with measurements outside of the recommended range during the screening programme were advised to follow up with medical doctors at the Bowen University Hospital. High blood pressure (hypertension) at the time of screening is defined as a systolic blood pressure of 140 mmHg or higher or a diastolic blood pressure of 90 mmHg or higher .National Heart, Lung, and Blood Institute [15].
2.3. Data Preprocessing
The dataset needs to be pre-processed before model training because each input sample contains different features with missing and inconsistent values. Most of the missing data in the dataset are measured values from staffs, therefore, the study employed data cleaning technique. This entails locating and fixing mistakes or discrepancies in the data, including duplicates, outliers, and missing numbers. The data cleaning was accomplished with a variety of methods, including imputation, removal, and transformation.
2.4. Data Correlation
Data mining task plays an important role to discover patterns in data. This study employed feature correlation and k-means clustering to find relevant and non-redundant features in the data. Pearson correlation coefficient was employed to understand the linear relationships between variables. The Pearson Correlation Coefficient between two variables X and Y is computed as:
Where cov is the covariance, is the standard deviation of variable X and Y
2.5. Data Clustering
K-means clustering algorithms [25] is used to discover the structure of data and form the cluster. This is achieved by dividing dataset into clusters according to data similarity. The technique involves initially selecting ‘k’ features randomly from original dataset D, as initial cluster centres. Based upon the distance between the features and cluster mean, the most similar object is assigned to the cluster. New mean value is then calculated for each cluster. The latter step is repeated until there is no redistribution of features in any cluster.
2.6. Ethical Consideration
This study was conducted using de-identified data obtained from the health medical record unit of the University Hospital. Ethical approval was sought and obtained from the Directorate of Research and Strategic Partnerships of the University.
3. Results
3.1. Initial Dataset Exploration
The dataset contains both sociodemographic and medical records. The data set is summarized in Table 1 based on different features. The dataset contains seven features which are stated as year, age, systolic and diastolic values, blood pressure status, department or unit, and gender. There are 1723 rows in dataset and the mean age is 42.64 years old, mean systolic and diastolic measurement are 120.91 and 78.4 respectively.
The dataset contains bio and blood pressure measurements values obtained from staffs of different department/ Unit in an academic institution. The total number of samples or data points are 1, 723 in which the input dataset contains six features, including year category (2018, 2019, 2021,2022), Department/Unit (academic and non-academic), gender (male and female), while the target output is the blood pressure status (low, normal and high) respectively.

Table 1.
Summarized Dataset.
| Statistic | Year | Age | Systolic_Blood_Press | Diatolic_Blood_Press | Blood_Press_Status | Dept_Unit | Gender | Category |
|---|---|---|---|---|---|---|---|---|
| count | 1723 | 1723 | 1723 | 1723 | 1723 | 1723 | 1723 | 1723 |
| unique | NaN | NaN | NaN | NaN | 3 | 239 | 2 | 2 |
| top | NaN | NaN | NaN | NaN | Normal | Registry | M | Non-academic |
| freq | NaN | NaN | NaN | NaN | 1237 | 288 | 891 | 1172 |
| mean | 2019 | 42.6 | 120.9 | 78.4 | NaN | NaN | NaN | NaN |
| std | 1.3 | 9.7 | 18.6 | 23.1 | NaN | NaN | NaN | NaN |
| min | 2018 | 17 | 80 | 10 | NaN | NaN | NaN | NaN |
| 25% | 2018 | 35 | 110 | 70 | NaN | NaN | NaN | NaN |
| 50% | 2019 | 42 | 120 | 80 | NaN | NaN | NaN | NaN |
| 75% | 2019 | 50 | 130 | 80 | NaN | NaN | NaN | NaN |
| max | 2022 | 76 | 230 | 910 | NaN | NaN | NaN | NaN |
The number of individuals with normal blood pressure is higher than low or high blood pressure as shown in Figure 1. The mean for systolic blood pressure value is about 124. Insight from Figure 1a and b show that high blood pressure is prevalent among staffs above the age of 40 irrespective of their gender or category (academic or non-academic).
Figure 2 shows the relationship plots of the dataset variables. The graphs revealed that there has been relative decline in high blood pressure between 2018 and 2022. As against 29% high blood pressure in 2018, there has been a relatively significant fall to 18% in 2022 which account for 11% improvement in healthcare of individual staff by reason of blood pressure. Conversely, there seem to be slight rise (3%) in low blood pressure from 2% in 2018 to 5% in 2022; this may be another trend to really pay attention to and the attendant contributive factors.
From the age-range variable, high blood pressure is prevalent among the age range 60 – 69 with 49% prevalent rate while the age group 20 – 29 has the lowest rate of 8%. In terms of low blood pressure, the age group 20 – 29 has the highest rate of 7% while the age group 40 – 49 has the lowest rate in low blood pressure of 1%.
For staff category, the difference in high blood pressure rate is not so significant as there is only a difference of 1% between academic and non academic staff. Non academic staff members has a high blood pressure rate of 25% while the academic category of staff has 24%.
3.2. Features Correlation
After looking at the trends for the main variables in the previous section, the study considered the potential correlations between various variables. Figure 3 shows the Pearson Correlation matrix with significant values obtained from the dataset. Significant values have been identified as values with a 95% confidence and different from zero [24]. However, study have shown that variable correlation can be full of noise or misrepresentation. To prevent such in our results, the study performed t-test [25] and the result is presented in Figure 4. This shows that there is a strong correlation between systolic and age as well as diatolic and age.
3.3. Insight through Unsupervised learning: Clustering
4. Discussion
This study highlights the potential impact of workplace screening programme for hypertension among university workforces. In this retrospective analysis of our university workforce health records using k-Means Clustering, we observed that the mean age for this working class was observed to be 42 years old. Similarly, we discovered that hypertension was prevalent among members of staff above the age of 40 irrespective of their gender or professional category (academic or non-academic). The analysis also revealed that there was a steady decline in the prevalence of hypertension from 2018 to 2022. We particularly found using k-Means Clustering relevant and appropriate for this analysis.
The average age for working population in this analysis was observed to be 42 year. Evidence on the benefits of screening programme for hypertension in adults in this age bracket is well-established. The United State Preventive Services Task Force (USPSTF) strongly recommends screening for high blood pressure in adults aged 18 years or older [16]. Similarly, the Canadian Task Force on Preventive Health Care continues to recommend screening for hypertension in adults aged 18 years and older without previously diagnosed hypertension [17]. Similar recommendations were made by the World Health Organisation and the International Society of Hypertension [18]. This makes workplace an ideal setting for hypertension screening programme and other health promotion interventions. It provides a convenient and accessible platform to reach many people who constitute up a stable population and it may promote sustained positive peer support [19,20].
Furthermore, we discovered that the prevalence of hypertension among members of staff increases with age and that hypertension prevalence is particularly high above the age of 40. This is not unusual because it is well-established in the literature that age is a predisposing factor for the development of primary hypertension [21]. A similar finding has been reported in another Nigerian study where age was found to be a risk factor for the high prevalence of hypertension among the urban population in Nigeria[22]. Given the earlier reported mean age of 40 for this working class, there is adequate evidence for the screening of employees for hypertension.
This analysis revealed that there was a steady decline in the prevalence of hypertension from 2018 to 2022 which implies that the screening programme helps to identify and better control blood pressure over the subsequent years. The reason for this is not far-fetched as this annual screening programme, carried out on staff members in the university community, serves as a regular sensitization mechanism put in place by the University, contributing to timely identification of undiagnosed hypertension and appropriate treatment of hypertension among the employees which promotes better blood pressure control. Similar benefits have earlier been attributed to workplace health promotion programmes[8,9,23].
Limitations
Due to COVID-19 pandemic lockdown in Nigeria, the annual screening programme could not be conducted in 2020. Hence, there was no dataset on hypertension among the employees in 2020. Furthermore, since the employer bears the health care costs of the screening of the workforce in the setting of this study, there is a need for caution in the generalizability of the findings of this analysis to a very different context.
Conclusions
We have shown with the use of machine learning techniques that periodic workplace screening programme for hypertension is an effective, feasible, and sustainable strategy to diagnose and control hypertension among the working class. Workplace is as an idea setting for early detection and treatment of hypertension among the working class. However, further research is needed to evaluate the barriers and facilitators of implementations of similar workplace health promotion programmes in the appropriate way.
References
- Chobanian AV, Bakris GL, Black HR, et al. Seventh report of the Joint National Committee on Prevention, Detection, Evaluation, and Treatment of High Blood Pressure. Hypertension. 2003 Dec. 42(6):1206-52.
- B. Zhou et al., “Worldwide trends in hypertension prevalence and progress in treatment and control from 1990 to 2019: a pooled analysis of 1201 population-representative studies with 104 million participants,” The Lancet, vol. 398, no. 10304, pp. 957–980, Sep. 2021. [CrossRef]
- S. Okello et al., “Hypertension prevalence, awareness, treatment, and control and predicted 10-year CVD risk: a cross-sectional study of seven communities in East and West Africa (SevenCEWA),” BMC Public Health, vol. 20, no. 1, Dec. 2020. [CrossRef]
- Legorreta, A.P.; Schaff, S.R.; Leibowitz, A.N.; van Meijgaard, J. Measuring the effects of screening programs in asymptomatic employees. Journal of occupational and environmental medicine. 2015 Jun 1;57(6):682-6.
- Shockey, T.M.; Sussell, A.L.; Odom, E.C. Cardiovascular Health Status by Occupational Group - 21 States, 2013. MMWR Morb Mortal Wkly Rep. 2016;65(31):793–8.
- Harden, A.; Peersman, G.; Oliver, S.; Mauthner, M.; Oakley, A. A systematic review of the effectiveness of health promotion interventions in the workplace. Occupational medicine. 1999;49(8):540–8.
- Hochart, C.; Lang, M. Impact of a comprehensive worksite wellness program on health risk, utilization, and health care costs. Population health management. 2011;14(3):111–6. 10.1089/pop.2010.0009.
- Jung, H.; Lee, B.; Lee, J.E.; Kwon, Y.H.; Song, H. Efficacy of a programme for workers with metabolic syndrome based on an e-health system in the workplace: a pilot study. Journal of telemedicine and telecare. 2012;18(6):339–43. 10.1258/jtt.2012.120318.
- Boshtam M, Sarafzadegan N, Zare K, Sadeghi S, Sajjadi F, Rabiei K, et al. Effects of 5-year interventions on cardiovascular risk factors of factories and offices employees of isfahan and najafabad: worksite intervention project-isfahan healthy heart program. ARYA atherosclerosis. 2010;6(3):94–101.
- Seibt, R.; Hunger, B.; Stieler, L.; Stoll, R.; Kreuzfeld, S. Early detection of undiagnosed hypertension based on occupational screening in the hotel and restaurant industry. BioMed Research International. 2018 Apr 8;2018.
- Carter, R.L. (2006) Solutions for Missing Data in Structural Equation Modeling. Research & Practice in Assessment, 1, 20-27. - References - Scientific Research Publishing.” Accessed: Sep. 30, 2023. [Online]. Available: https://www.scirp.org/(S(lz5mqp453edsnp55rrgjct55.))/reference/referencespapers.aspx?referenceid=2792502.
- Liu, J. , et al., A comparative study of texture measures for human skin treatment. In the Proceedings of International Conference on Information, Communications, and Signal Processing. 1997. Singapore. pp. 170-174.
- Pal, N.R. and Pal, S.K., A review on image segmentation techniques. Pattern Recognition, 1993. 26(9): pp. 1277-1294.
- Pickering TG, Hall JE, Appel LJ, Falkner BE, Graves J, Hill MN, et al. Recommendations for blood pressure measurement in humans and experimental animals: part 1: blood pressure measurement in humans: a statement for professionals from the Subcommittee of Professional and Public Education of the American Heart Association Council on High Blood Pressure Research. Circulation 2005; 111:697-716.
- The Seventh Report of the Joint National Committee on Prevention, Detection, Evaluation, and Treatment of High Blood Pressure. US Department of Health and Human Services, National Institutes of Health; 2003. Available at: http://www.nhlbi.nih.gov/files/docs/ guidelines/jnc7full.pdf. Accessed December 20, 2023.
- Krist, A.H.; Davidson, K.W.; Mangione, C.M.; Cabana, M.; Caughey, A.B.; Davis, E.M.; Donahue, K.E.; Doubeni, C.A.; Kubik, M.; Li, L.; Ogedegbe, G. Screening for hypertension in adults: US Preventive Services Task Force reaffirmation recommendation statement. Jama. 2021 Apr 27;325(16):1650-6.
- Lindsay, P.; Gorber, S.C.; Joffres, M.; Birtwhistle, R.; McKay, D.; Cloutier, L. Recommendations on screening for high blood pressure in Canadian adults. Canadian Family Physician. 2013 Sep 1;59(9):927-33.
- Nugroho, P.; Andrew, H.; Kohar, K.; Noor, C.A.; Sutranto, A.L. Comparison between the world health organization (WHO) and international society of hypertension (ISH) guidelines for hypertension. Annals of Medicine. 2022 Dec 31;54(1):837-45.
- Faculty of Public Health Medicine Committee on Health Promotion. Health Promotion in the Workplace. Guidelines for Health Promotion No. 40. London, UK: Royal College of Physicians, 1995.
- Tones, K.; Tilford, S. Health Education: Effectiveness and Efficiency and Equity. London, UK: Chapman and Hall,1994.
- Isuezo, S.A. Systemic hypertension in blacks. An overview of current concepts of pathogenesis. Nigerian Postgraduate Medical Journal. 2003;10:144-53.
- Olatunbosun, S.T.; Kaufman, J.S.; Cooper, R.S.; Bella, A.F. Hypertension in a black population: prevalence and biosocial determinants of high blood pressure in a group of urban Nigerians. Journal of human hypertension. 2000 Apr;14(4):249-57.
- Goetzel, R.Z. ; KahrTY; Aldana, S.G.; Kenny, G.M. An evaluation of Duke University’s Live for Life Health Promotion program and its impact on employee health. Am J Health Prom 1996; 10: 340-341.
- Benjamin, D.J.; Berger, J.O.; Johannesson, M.; Nosek, B.A.; Wagenmakers, E.J.; Berk, R.; Bollen, K.A.; Brembs, B.; Brown, L.; Camerer, C.; Cesarini, D. Redefine statistical significance. Nature human behaviour. 2018 Jan;2(1):6-10.
- Dhillon, I.S.; Modha, D.S. Concept decompositions for large sparse text data using clustering. Machine learning. 2001 Jan;42:143-75.
Figure 1.
Blood Status against Age across different a) years, b) gender, c) category.
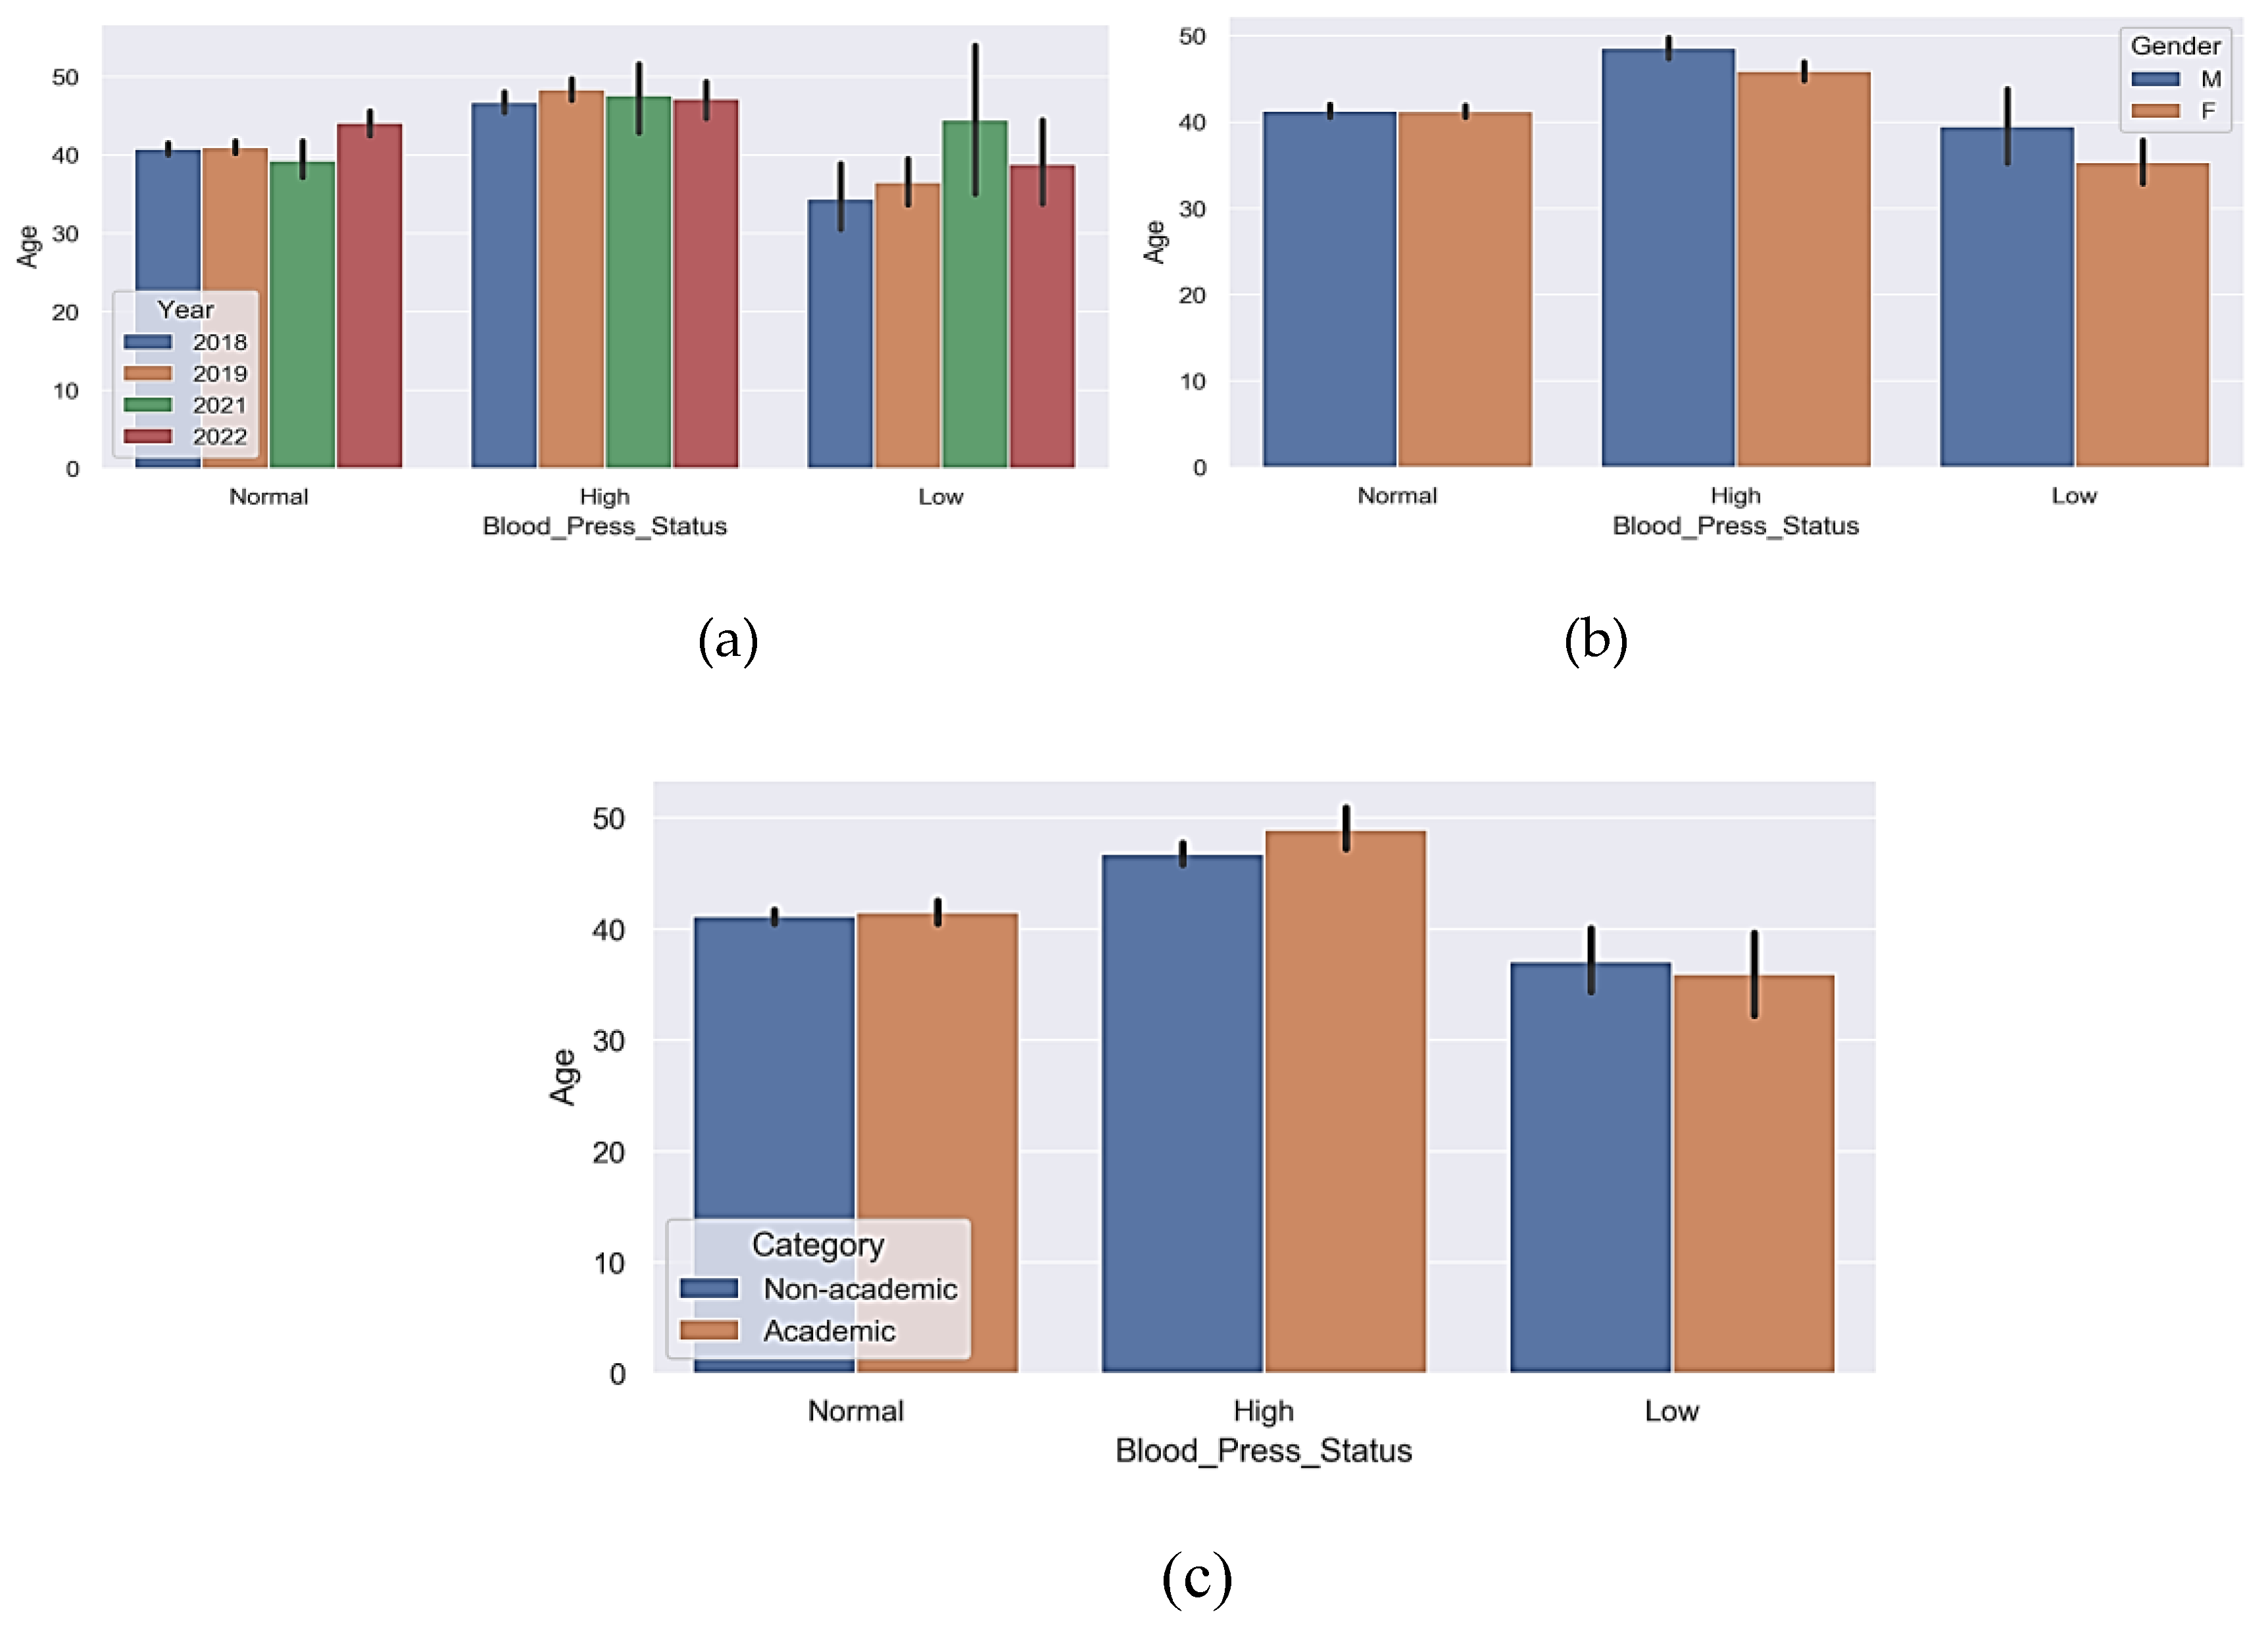
Figure 2.
Relationship plots of the variables in the dataset: a) Distribution of blood pressure status in fuction of year; b) Distribution of blood pressure status in fuction of Age-group; c) Distribution of blood pressure status in fuction of categories.
Figure 2.
Relationship plots of the variables in the dataset: a) Distribution of blood pressure status in fuction of year; b) Distribution of blood pressure status in fuction of Age-group; c) Distribution of blood pressure status in fuction of categories.
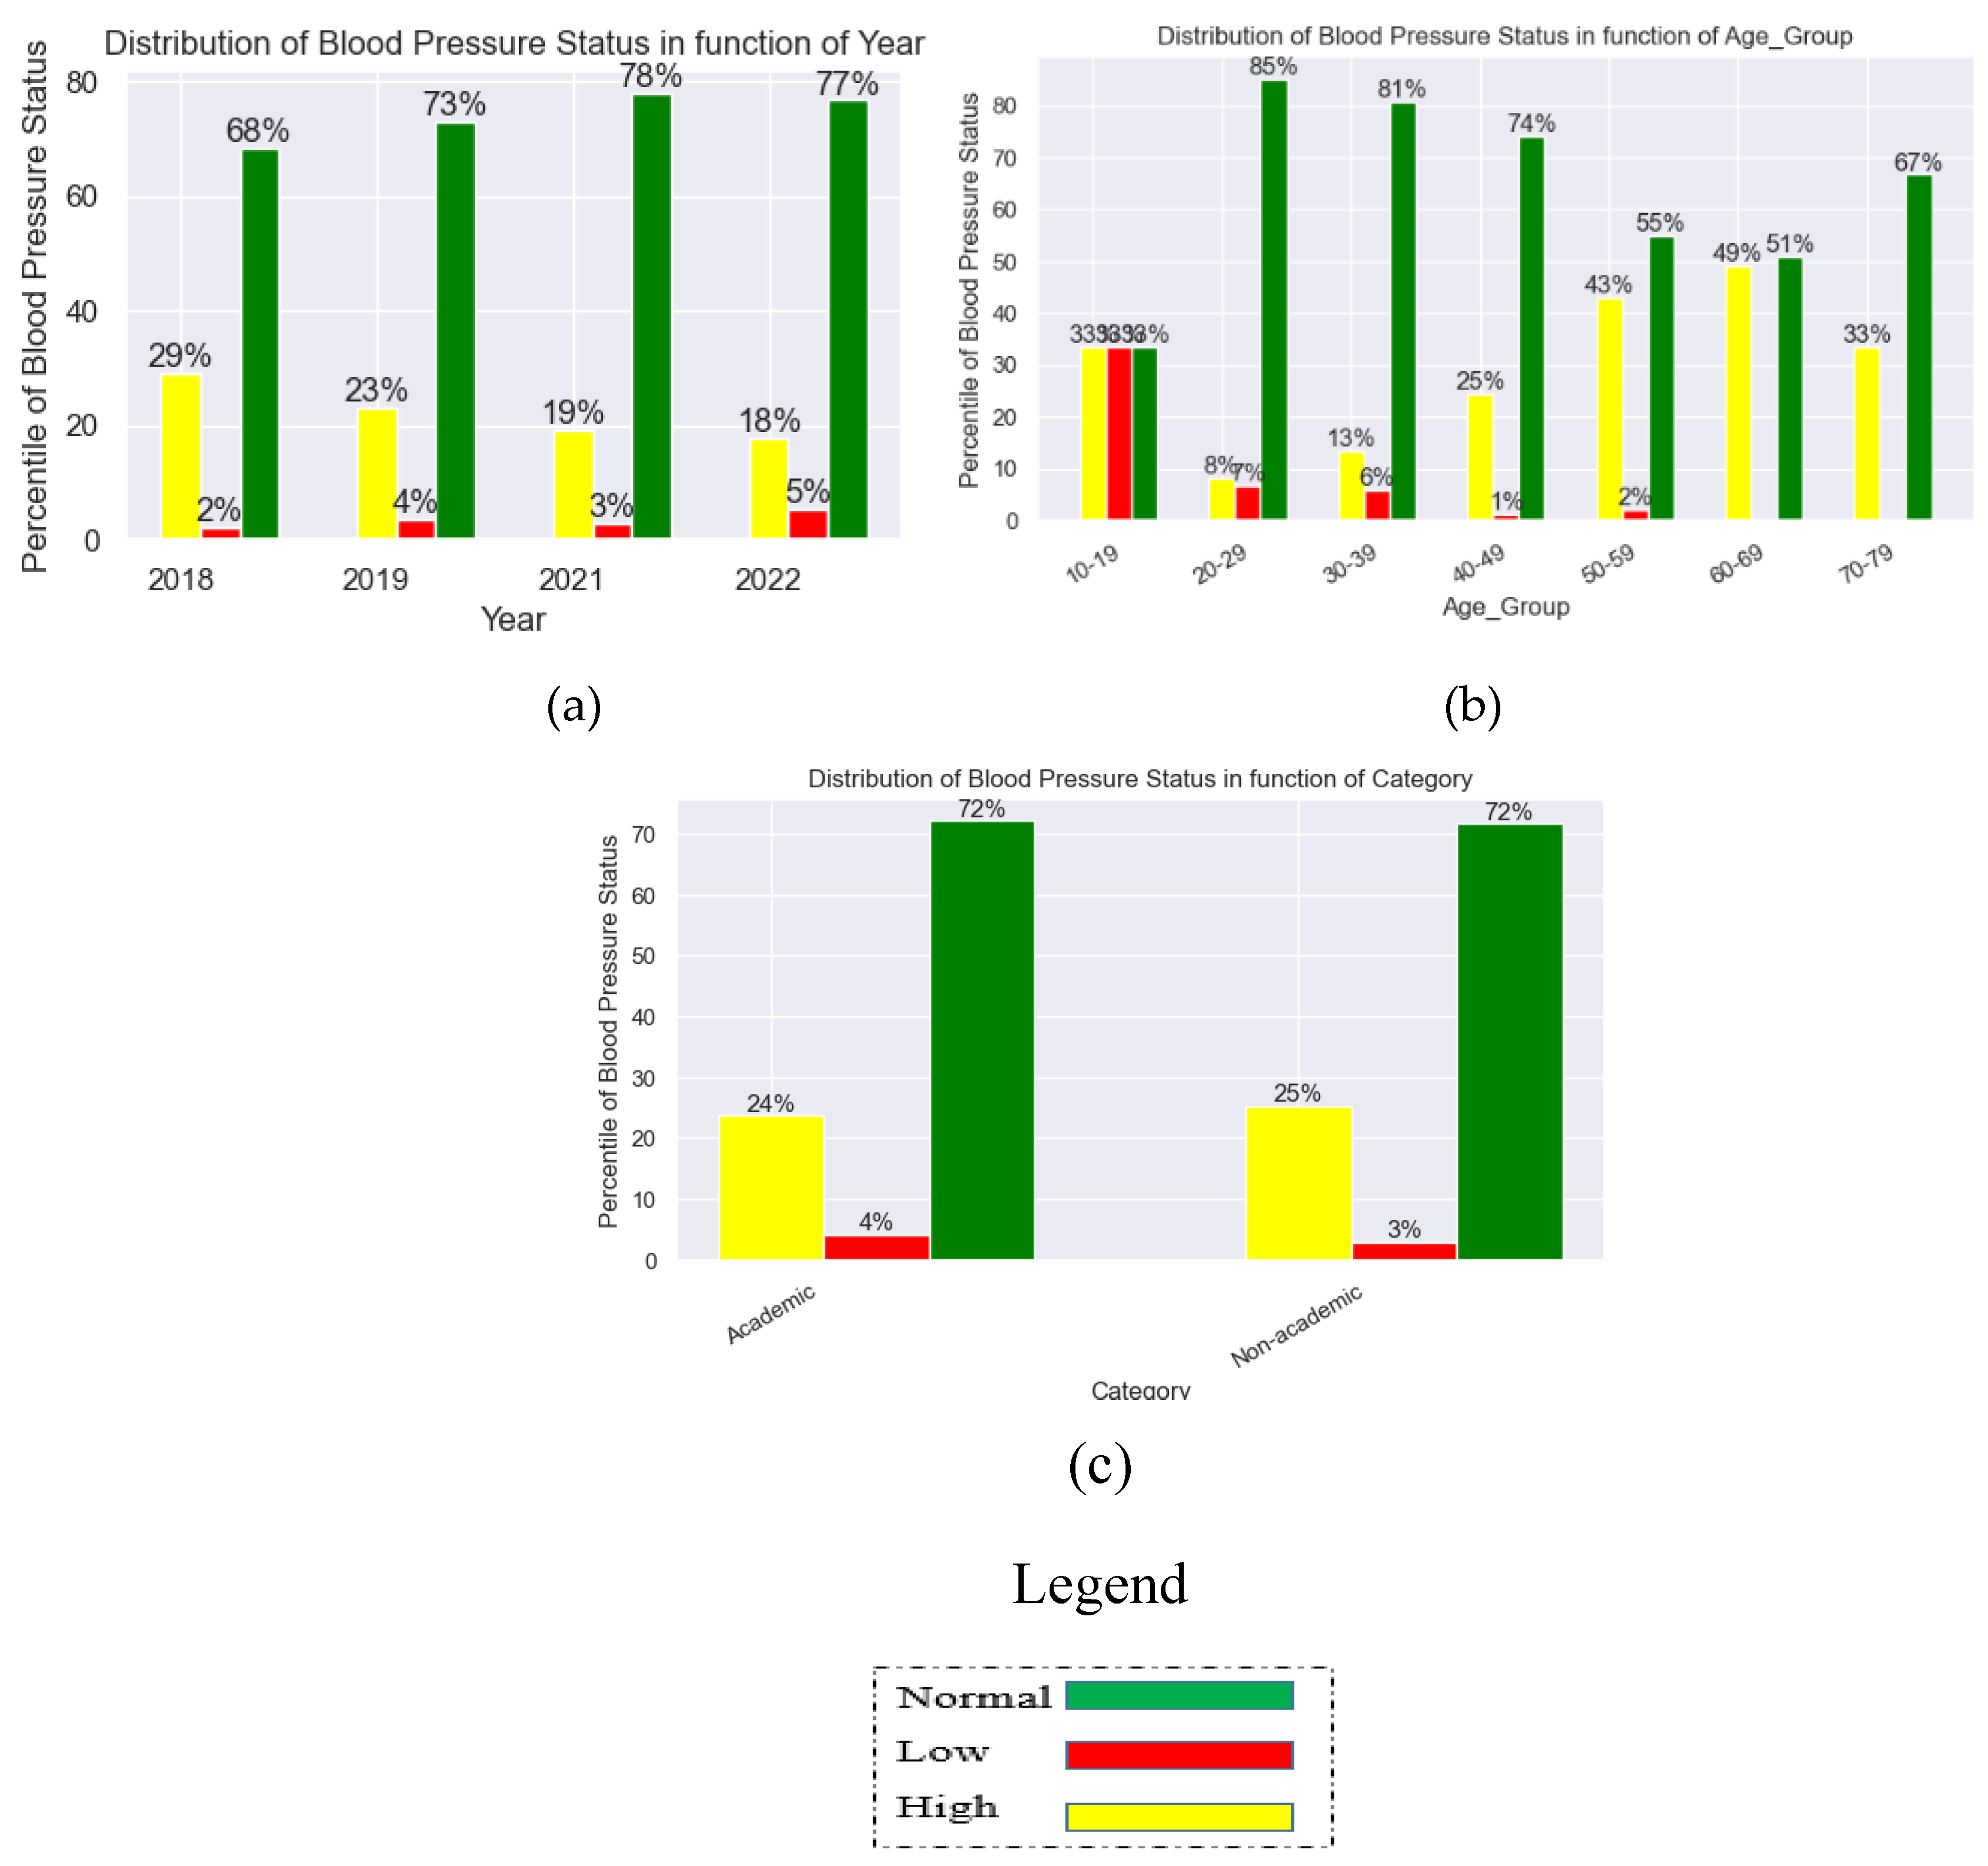
Figure 3.
Pearson Correlation Matrix of the Variables in the dataset.
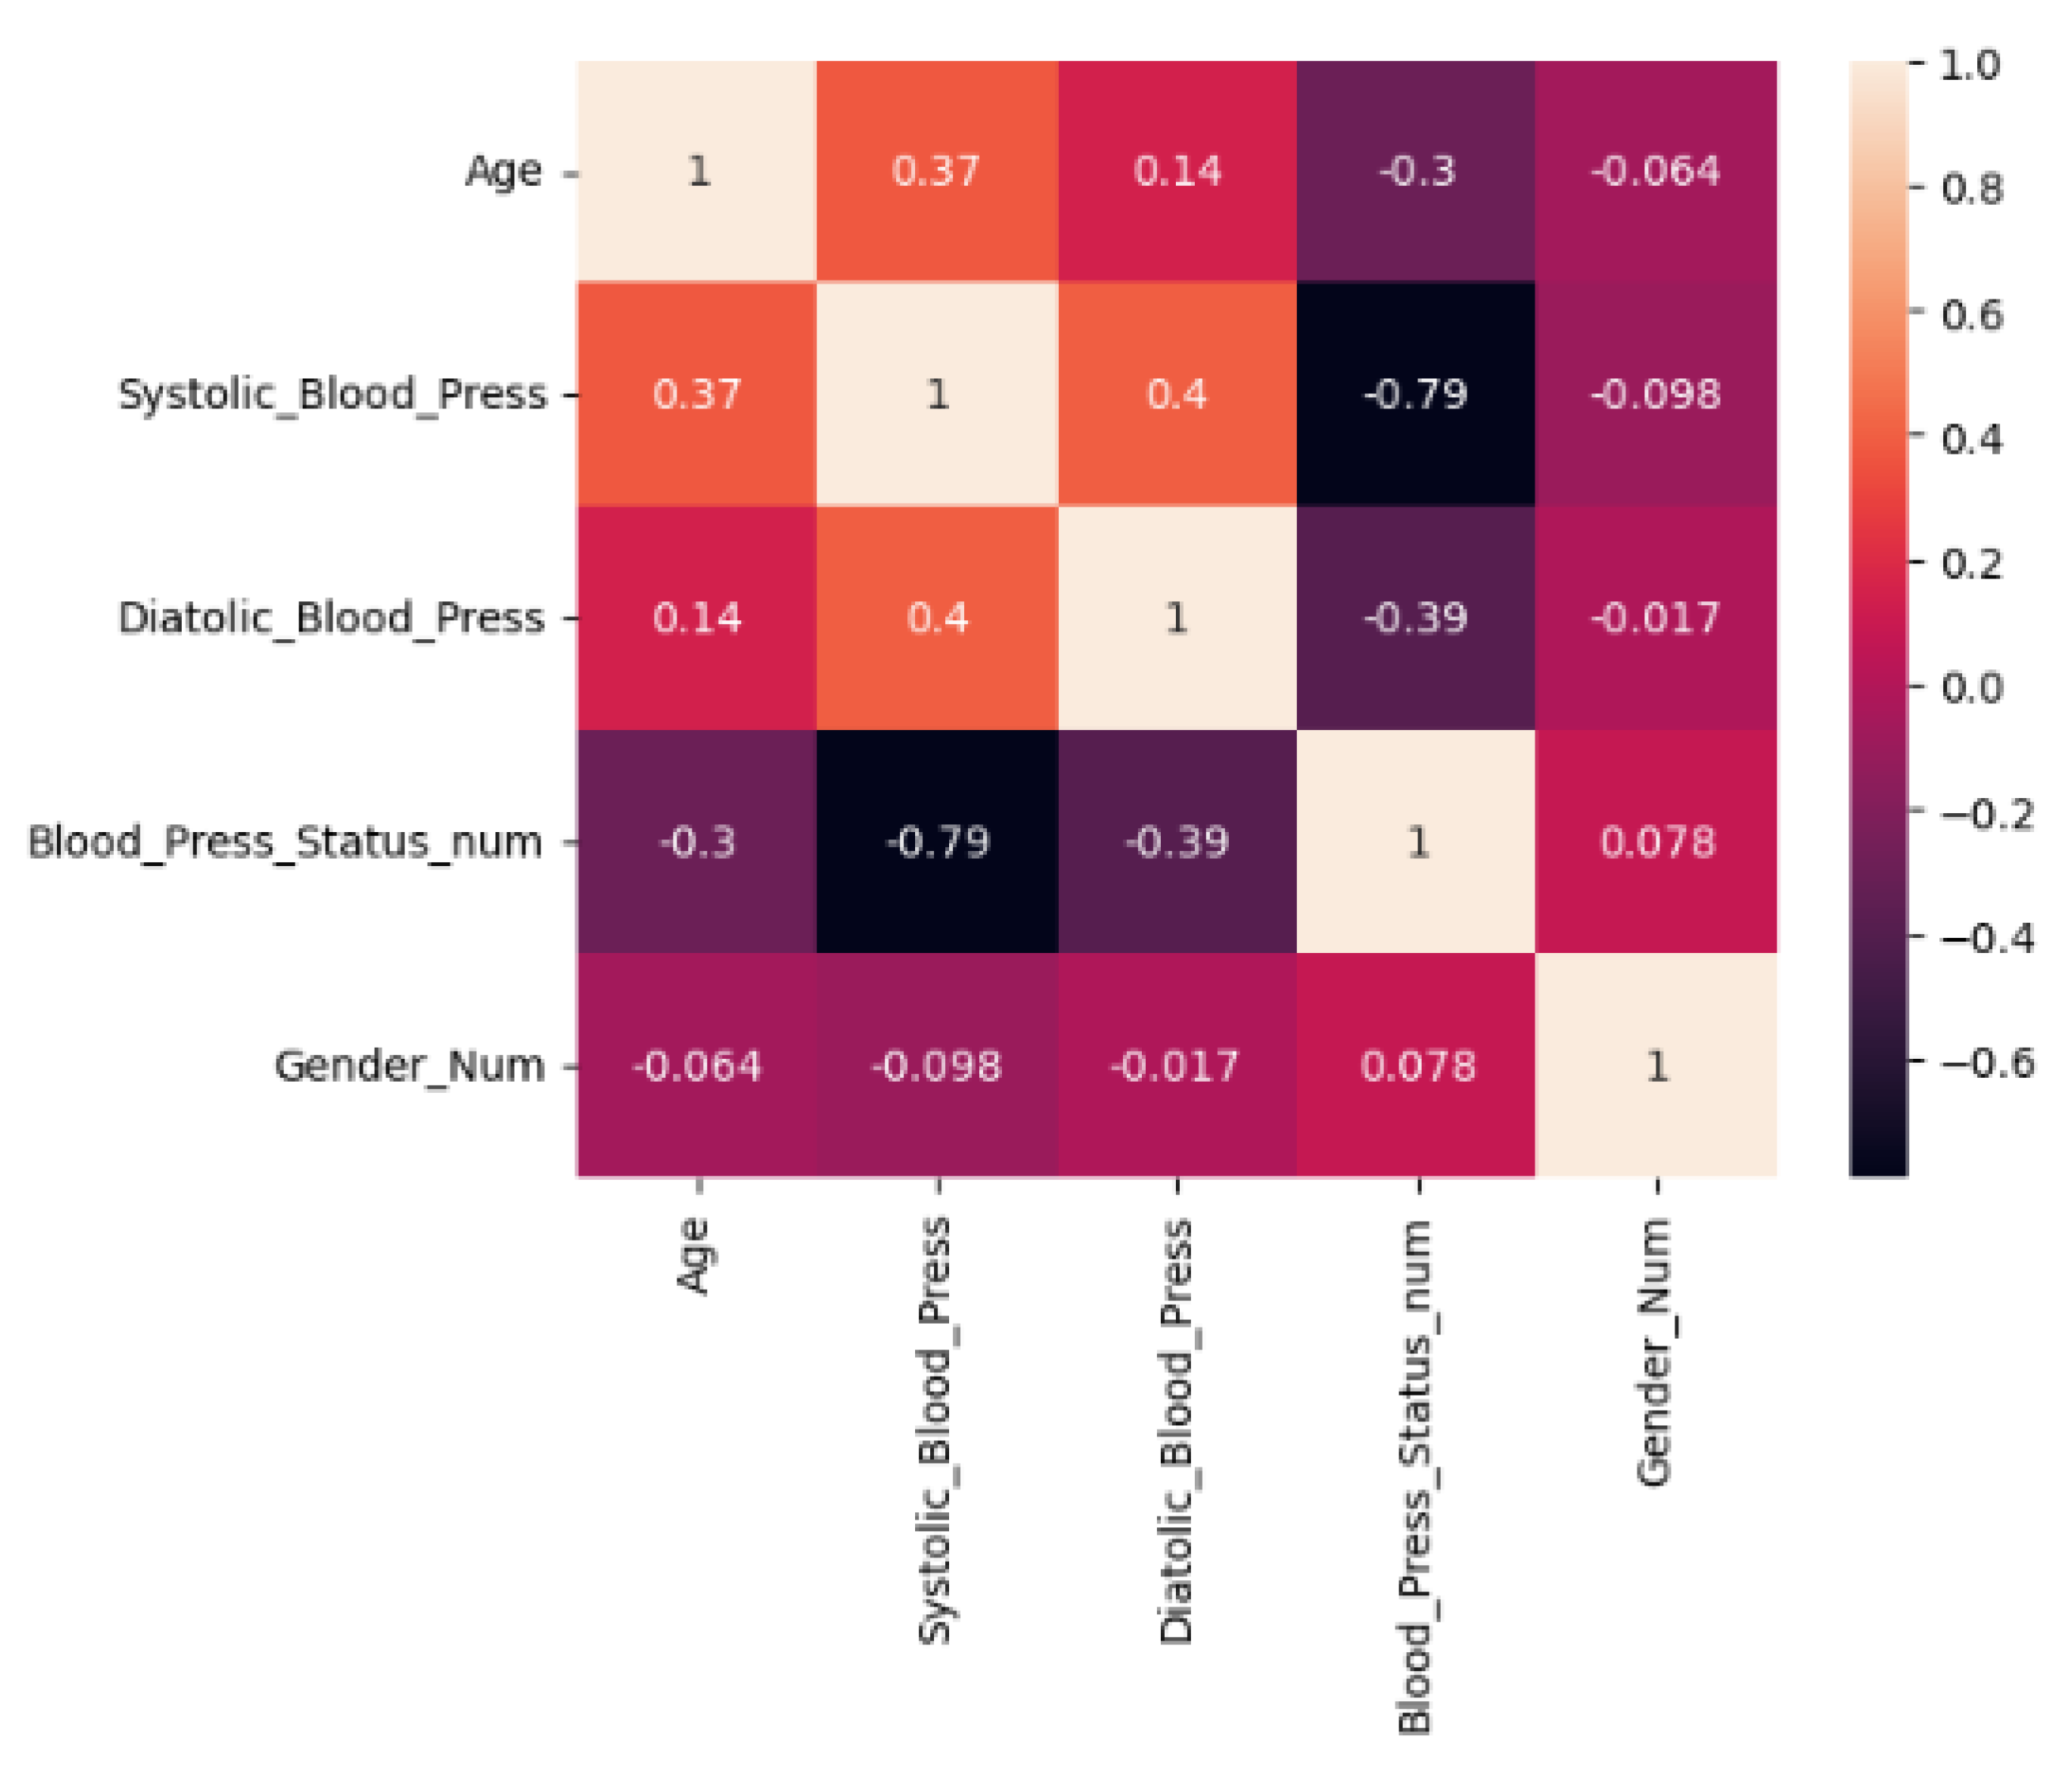
Figure 4.
Pearson Correlation Matrix of the Variables in the dataset with non-significant values and the upper triangular filtered out.
Figure 4.
Pearson Correlation Matrix of the Variables in the dataset with non-significant values and the upper triangular filtered out.
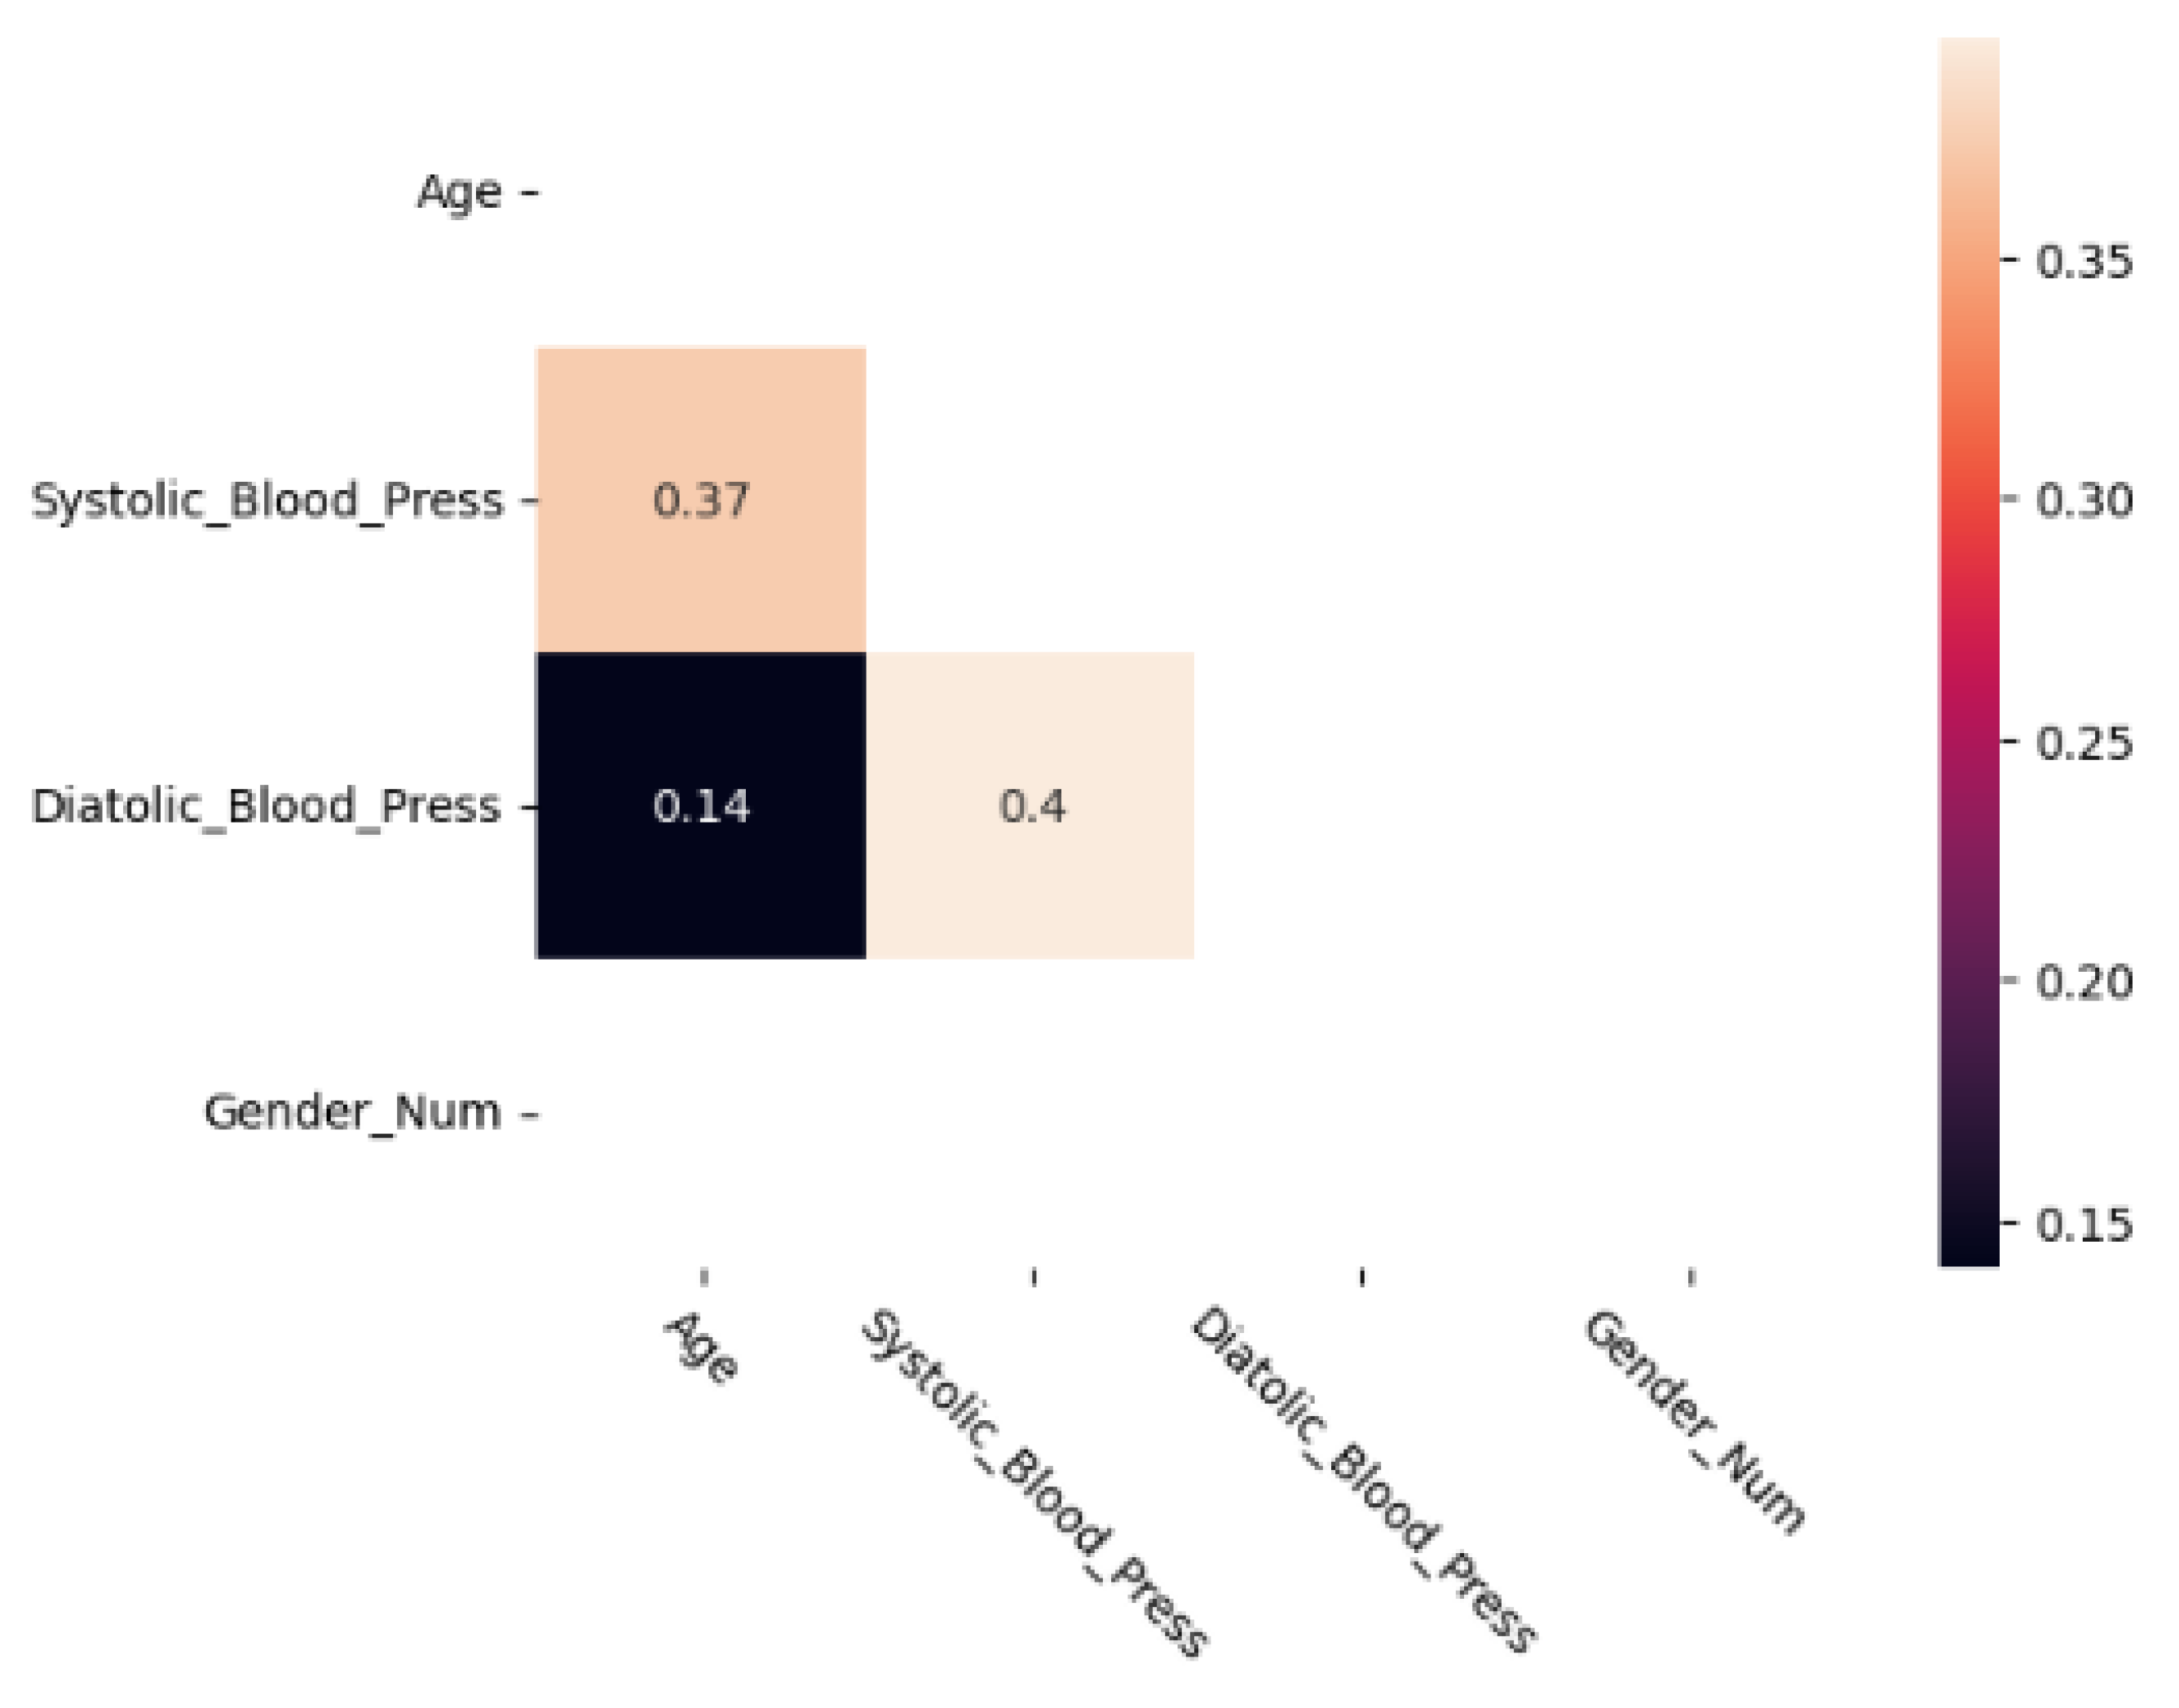
Figure 5.
Clustering based on a) blood pressure status (systolic) and age; b) blood pressure status (diastolic) and age.
Figure 5.
Clustering based on a) blood pressure status (systolic) and age; b) blood pressure status (diastolic) and age.
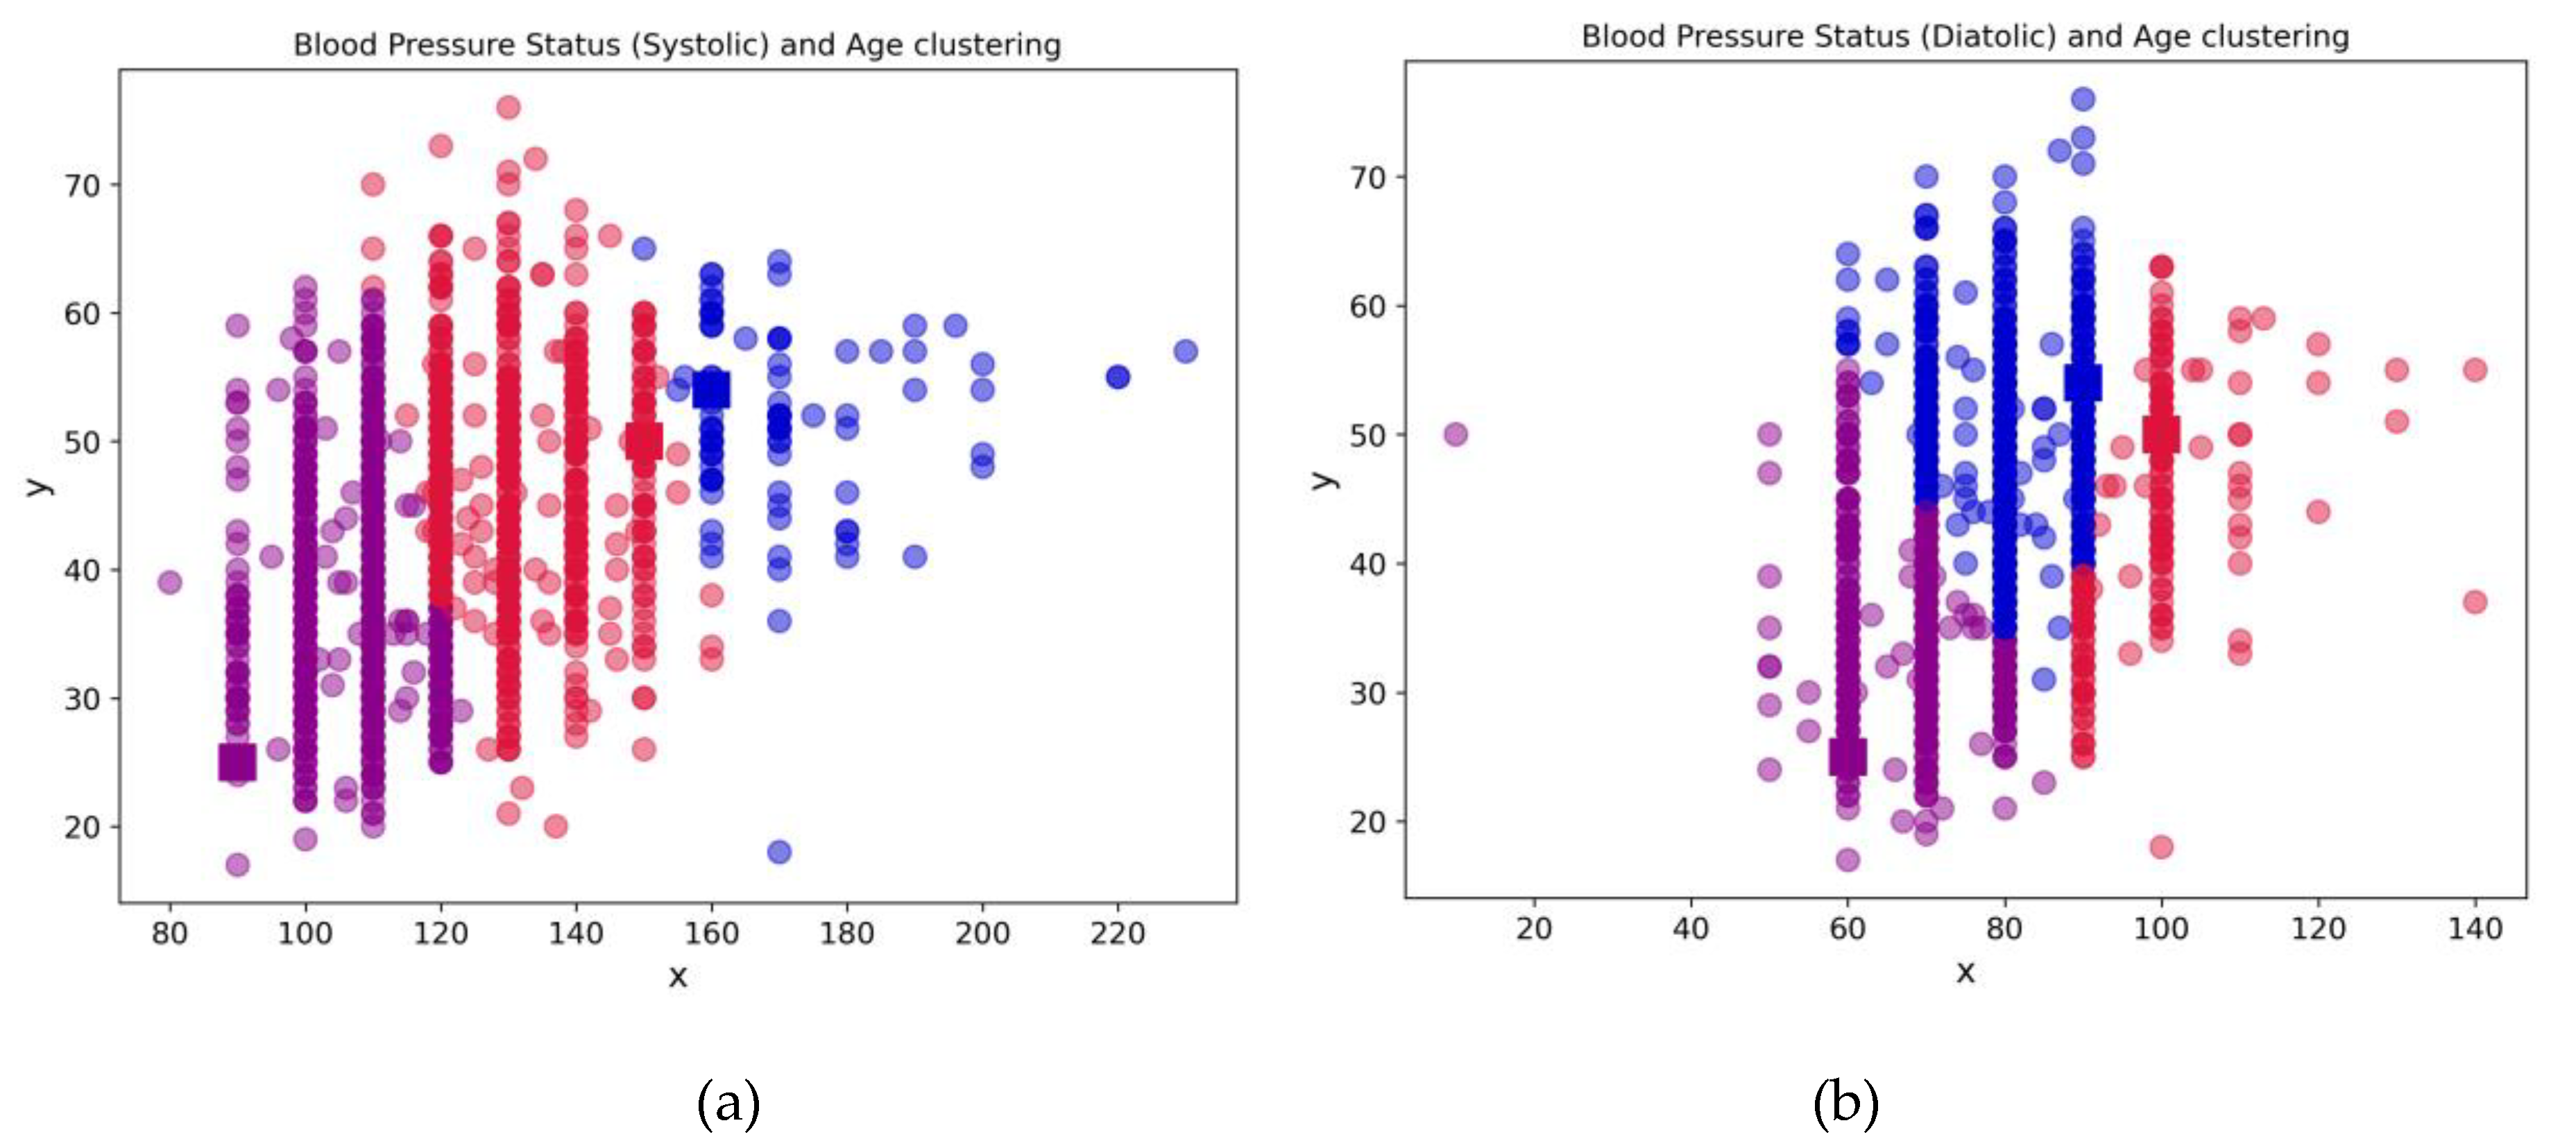
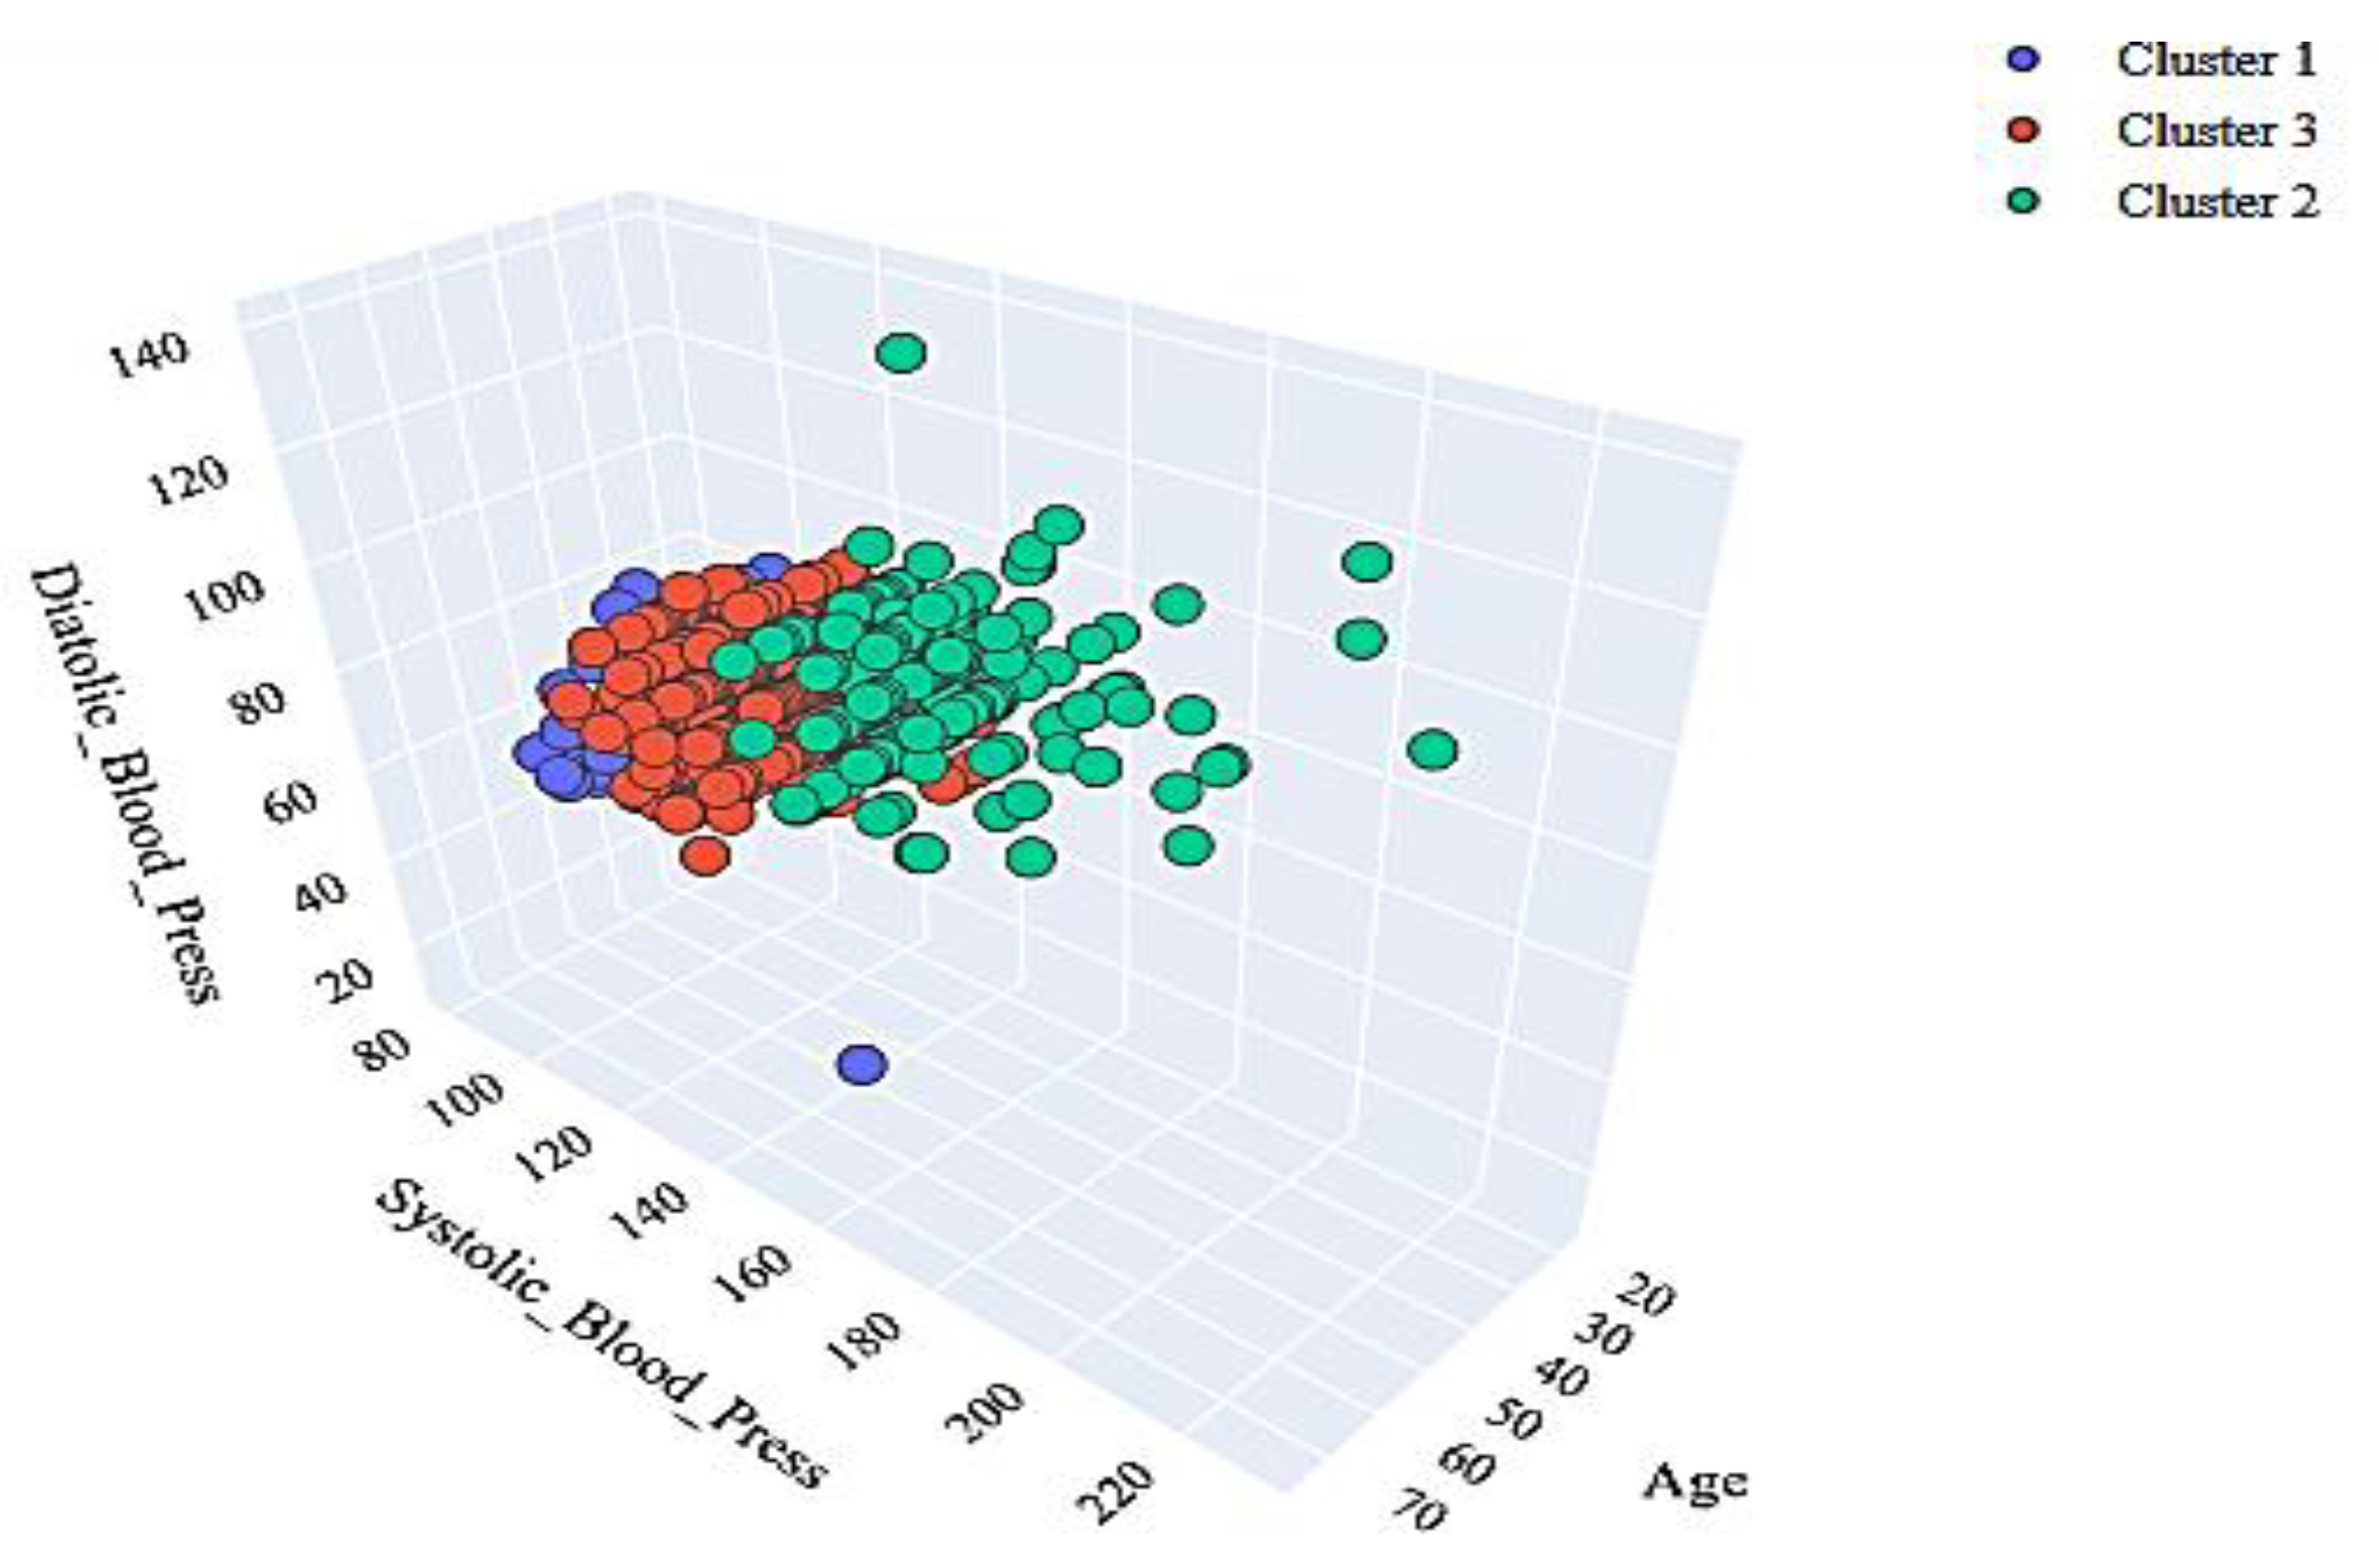
Figure 6.
Clustering in 3D.
Disclaimer/Publisher’s Note: The statements, opinions and data contained in all publications are solely those of the individual author(s) and contributor(s) and not of MDPI and/or the editor(s). MDPI and/or the editor(s) disclaim responsibility for any injury to people or property resulting from any ideas, methods, instructions or products referred to in the content. |
© 2024 by the authors. Licensee MDPI, Basel, Switzerland. This article is an open access article distributed under the terms and conditions of the Creative Commons Attribution (CC BY) license (http://creativecommons.org/licenses/by/4.0/).
Copyright: This open access article is published under a Creative Commons CC BY 4.0 license, which permit the free download, distribution, and reuse, provided that the author and preprint are cited in any reuse.


