1. Introduction
Glaucoma, being one of the leading causes for blindness, is a group of eye diseases which poses a significant threat to permanent loss of vision if left untreated. Recognized risk factors for glaucoma encompass occurrence of elevation in intra-ocular pressure, older age, myopia, and family history are some of the risk factors mentioned for glaucoma [
1,
2,
3,
4,
5]. And these factors will lead to gradual onset of optic nerve damage, culminating in irreversible vision loss. These risk factors mainly targets the ganglion cells within the human retina, which are responsible for collective information transmission from retina to brain for further interpretation. The ganglion cell axons leave the retina and converges at the optic disc (OD), which is the blind spot of the retina. The OD being the focal point of information transmission, makes it an ideal region of the human eye to early detect the pathological changes that indicates glaucomatous progression.
At clinical level, glaucoma screening mainly involves analysis of intra-ocular pres-sure, visual field testing, and evaluation of the OD region. Specific to the OD, the fundus images and videos that are captured from this region of the human retina are a pivotal methodology for comprehensive glaucoma assessment. Hence, obtaining clear and precise fundus images is crucial as it directly influences the accuracy of decisions made by healthcare professionals or artificial intelligence (AI) models in diagnosing and managing the occurrence of the disease [
6].
In recent years, technological advancements, particularly in smartphone-based fundoscopy devices, have shown a promise in facilitating convenient and accessible acquisition of fundus images [
7,
8,
9,
10,
11]. The cost-effectiveness, user-friendliness, and portability of these devices made them as potential game-changers, for revolutionizing glaucoma screening by reaching to the resource-constrained rural areas of most of the developing countries. However, a common limitation associated with the majority of these smartphone-based fundoscopy devices is the inherently lower image quality they produce when compared to conventional digital fundus cameras. This reduced image quality poses a significant challenge in accurately localizing the optic disc region within the smartphone-captured fundus images. Unlike the clear images of the OD obtained with standard medical devices, those captured by low cost smartphone-based ophthalmoscope devices such as [
7,
11] often exhibit lower quality and are susceptible to image noise, making it more challenging for the OD localization task.
Recent advancements in computer vision and deep learning domains, especially You Only Look Once (YOLO) families, offer a promising performance in object localization tasks across various domains such as in [
12,
13,
14,
15]. The precise object detection capability of these models has created opportunities for their application in the field of ophthalmology, particularly in the context of accurately identifying and localizing the OD within the fundus images. This paper aims to contribute to the broader objective of developing cost-effective smartphone-based glaucoma screening devices by proposing the application of the YOLO-version-8-nano (YOLOv8n) model [
16], a lightweight and state-of-the-art neural network architecture, to address the challenges associated with precise OD localization in low-quality fundus images captured with smartphone-based devices. This directly helps to reach out to those areas that have a limited access, thereby addressing critical gaps in eye care accessibility.
2. Related works
The OD region localization is a crucial step in glaucoma screening tasks, and many studies have been done related to this task. Different techniques from traditional algorithms like Harris corner detection in [
17] and deep learning based models like [
18] have been implemented for OD localization. In [
19], they have proposed a hybrid model to segment the OD and optic cup (OC) regions for glaucoma diagnosis, which is a hybrid of two modules, a Convolutional Neural Network (CNN)-transformer module and polar transformation network. The first component of the hybrid module extracts image features at high resolution, incorporating global self-attenuation during the aggregation process. The second part of the hybrid model executes a differentiable log-polar transform. This involves optimizing the polar transformations through the sampling of images in Cartesian space and subsequently mapping them back to the polar coordinate system for the purpose of reconstructing masked image. The CNN-transformer module then combines the CNN network with the transformer to get the input image’s polar representation. They evaluated the performance on REFUGE [
20], DRISHTI-GS [
21], and RIM-ONE-v3 [
22] dataset and made a comparison with other methods, such as U-Net variants and DeepLabV3 [
23], and mentioned that their approach outperforms in terms of accuracy.
The faster Regions with CNN (faster-RCNN) [
24] was used by [
25] for localizing OD. For annotating the images, they have implemented semi-automatic ground truth generation method for training the RCNN-based model to do feature extraction and disc localization. For removing the fringes from the images, they have used Otsu-thresholding during the pre-processing step. Evaluating the performance on publicly available dataset, they have recorded an area under the curve (AUC) of 0.868 for localizing the OD.
In [
26], the authors presented a method for retinal fundus image segmentation using a two-stage Mask R-CNN, which is a network developed by the Facebook AI Research group in 2017 [
27]. Their approach involves localizing the optic nerve head and cropping the image, followed by segmentation on the cropped image. The study was based in public dataset like REFUGE, Magrabi, and MESSIDOR. The outcomes indicated that the model successfully produced bounding boxes and segmentation masks for the OD and OC regions. The authors concluded that their method achieved an accuracy between 0.96-0.98 for segmenting the OD on the fundus images in different experimental setups.
In the work of [
28], they have utilized a deep learning-based model called Efficient-Net-B0, which was developed by Google brain team [
29], for localizing the OD area for glaucoma screening. As part of the work, the deep features from the input image were calculated using the EfficientNet-B0 model. Subsequently, a top-down and bottom-up keypoints fusion was performed on the features extracted by the EfficientNet-B0 through the bi-directional feature pyramid network module to localize the target region. For evaluating the performance, they have used publicly available dataset called ORIGA, and mean average precision (mAP) of 0.971 was recorded on this dataset for target detection.
The work of [
30] proposed OD localization algorithm based on YO-LO-version-5-small (YOLOv5s) network. In the preprocessing stage, they have applied Gaussian smoothing filter and normalization on each channel to enhance image quality before feeding to the model. The YOLOv5s model was fined-tuned by training for 150 epochs using those images from the public dataset library. The model’s performance was assessed using various metrics, and achieved an overall recall of 0.996, precision of 0.996, a mAP@.5 of 0.996, and a mAP@.95 of 0.826. The results of their approach indicated that the proposed YOLOv5s model can localize the OD with good accuracy.
A kernelized least-square classifier based approach was suggested by [
31] to localize the OD region in the fundus images. To find the center of the OD, they computed the coordinates of the convergence point for the blood vessels. The method was evaluated on two dataset: a public dataset called DRIVE, and a private dataset which is owned by the authors. The algorithm attained an accuracy rate of 97.52% in localizing the OD.
[
32] have proposed a method that employs enhanced Mask-RCNN framework to localize and segment the OD and OC from blurred retinal images. The proposed method utilizes a Densenet-77-based Mask-RCNN framework for feature extraction and deep key point computation. Data augmentation and blurriness addition are performed to increase data diversity. The feature extraction phase of Mask-RCNN utilized the Densenet-77 framework to generate deep key points. These computed features are subsequently applied for the localization and segmentation of both the OD and OC. The ORIGA dataset is used for performance evaluation. The method proposed in their study attained an average precision, recall, F-measure, and intersection over union (IOU) of 0.965, 0.963, 0.97, and 0.972, respectively.
[
33] proposed a hybrid algorithm for OD localization in retinal images, especially considering for fundus images with unbalanced shade, low contrast OD, and bright reflections. Their approach begins by segmenting the field of view on the input image using global filtering algorithm. Image smoothing and contrast enhancement were also used alongside Hough transform to identify OD candidate locations. A voting method was then used to locate the final OD position. The presented methodology assessed on seven openly accessible dataset: DIARETDB1, DIARETDB0, MESSIDOR, E-OPHTHA, ROC, ARIA, and HRF databases. They have used accuracy as an evaluation metric, and performance of the proposed method on the publicly available datasets is as follows: 99.23%, 100.00%, 98.58%, 99.00%, 96.34%, 100.00%, and 91.61%, respectively.
The machine learning and deep learning methods implemented in the above mention studies mainly focuses on images that are captured with standard fundus camera that can deliver fundus images with high quality. For this reason, most of these authors achieved a good performance in terms of localizing the OD. In this study, we want to localize the OD using YOLOv8n model on low quality fundus images that are captured with smartphone-based fundus cameras, where the majority area of the images is covered with unwanted noises like reflections, artefacts, low contrast, and so on. For this task, we have used the YOLOv8n model. The result of this work will help to understand the YOLOv8n model’s performance, which has the smallest number of parameters compared to other object detection models, on smartphone for automated glaucoma prediction applications.
3. Materials and Methods
3.1. Data collection and processing
On this study, smartphone-based images from the public dataset called Brazil Glaucoma (BrG) dataset [
34] is used. The dataset was collected in Brazil, Hospital de Olhos and Policlínica de Unai MG, between April 2021 and February 2022, and is composed of images from 1000 volunteers. The data is evenly split into two categories: 50% for glaucomatous and the remaining 50% for non-glaucomatous images. Using an Apple iPhone 6S connected to Welch Allyn panoptic direct ophthalmoscope [
35], powered by battery of 3.5V, the device offers a field of view up to 25º with focus adjustment raning between -20 and +20 diopters. Each volunteer underwent photography for both eyes, thus resulting in a total of 2000 color fundus images captured. The dataset comes with masks for all the images, but doesn’t have ground truth bounding box coordinates. Hence, we used these circular masks to extract the ground truth bounding boxes for all the images.
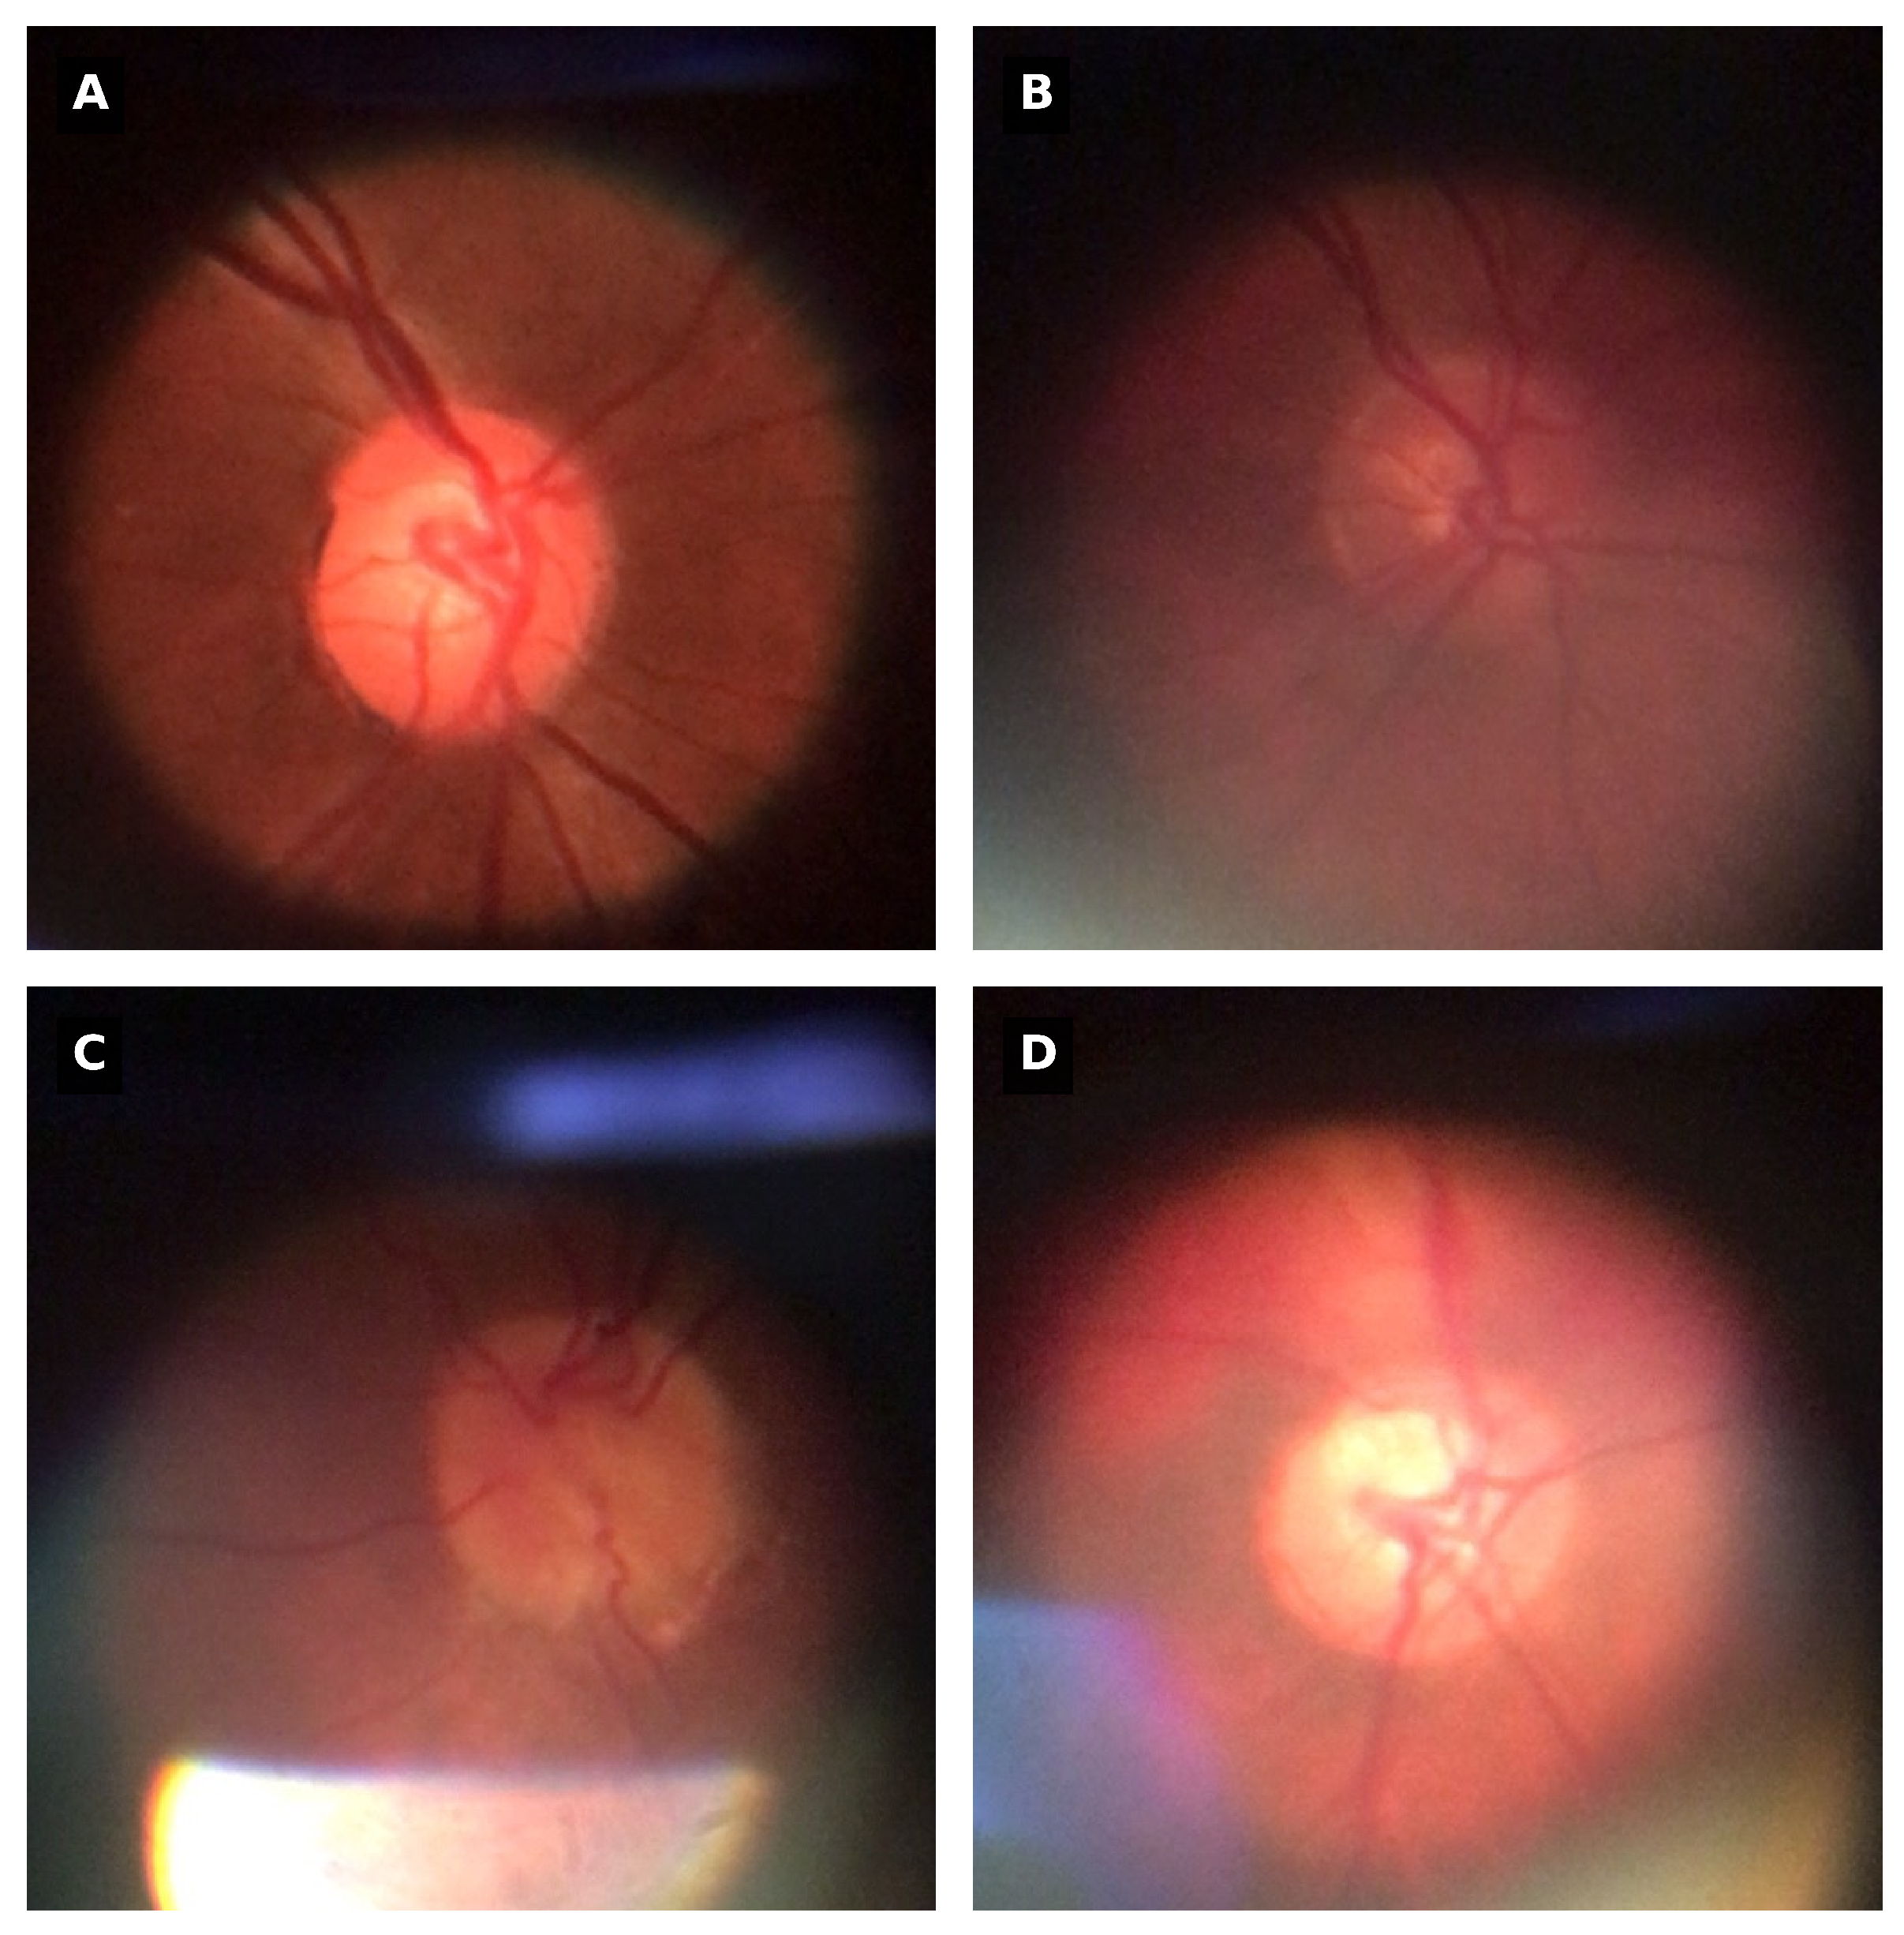
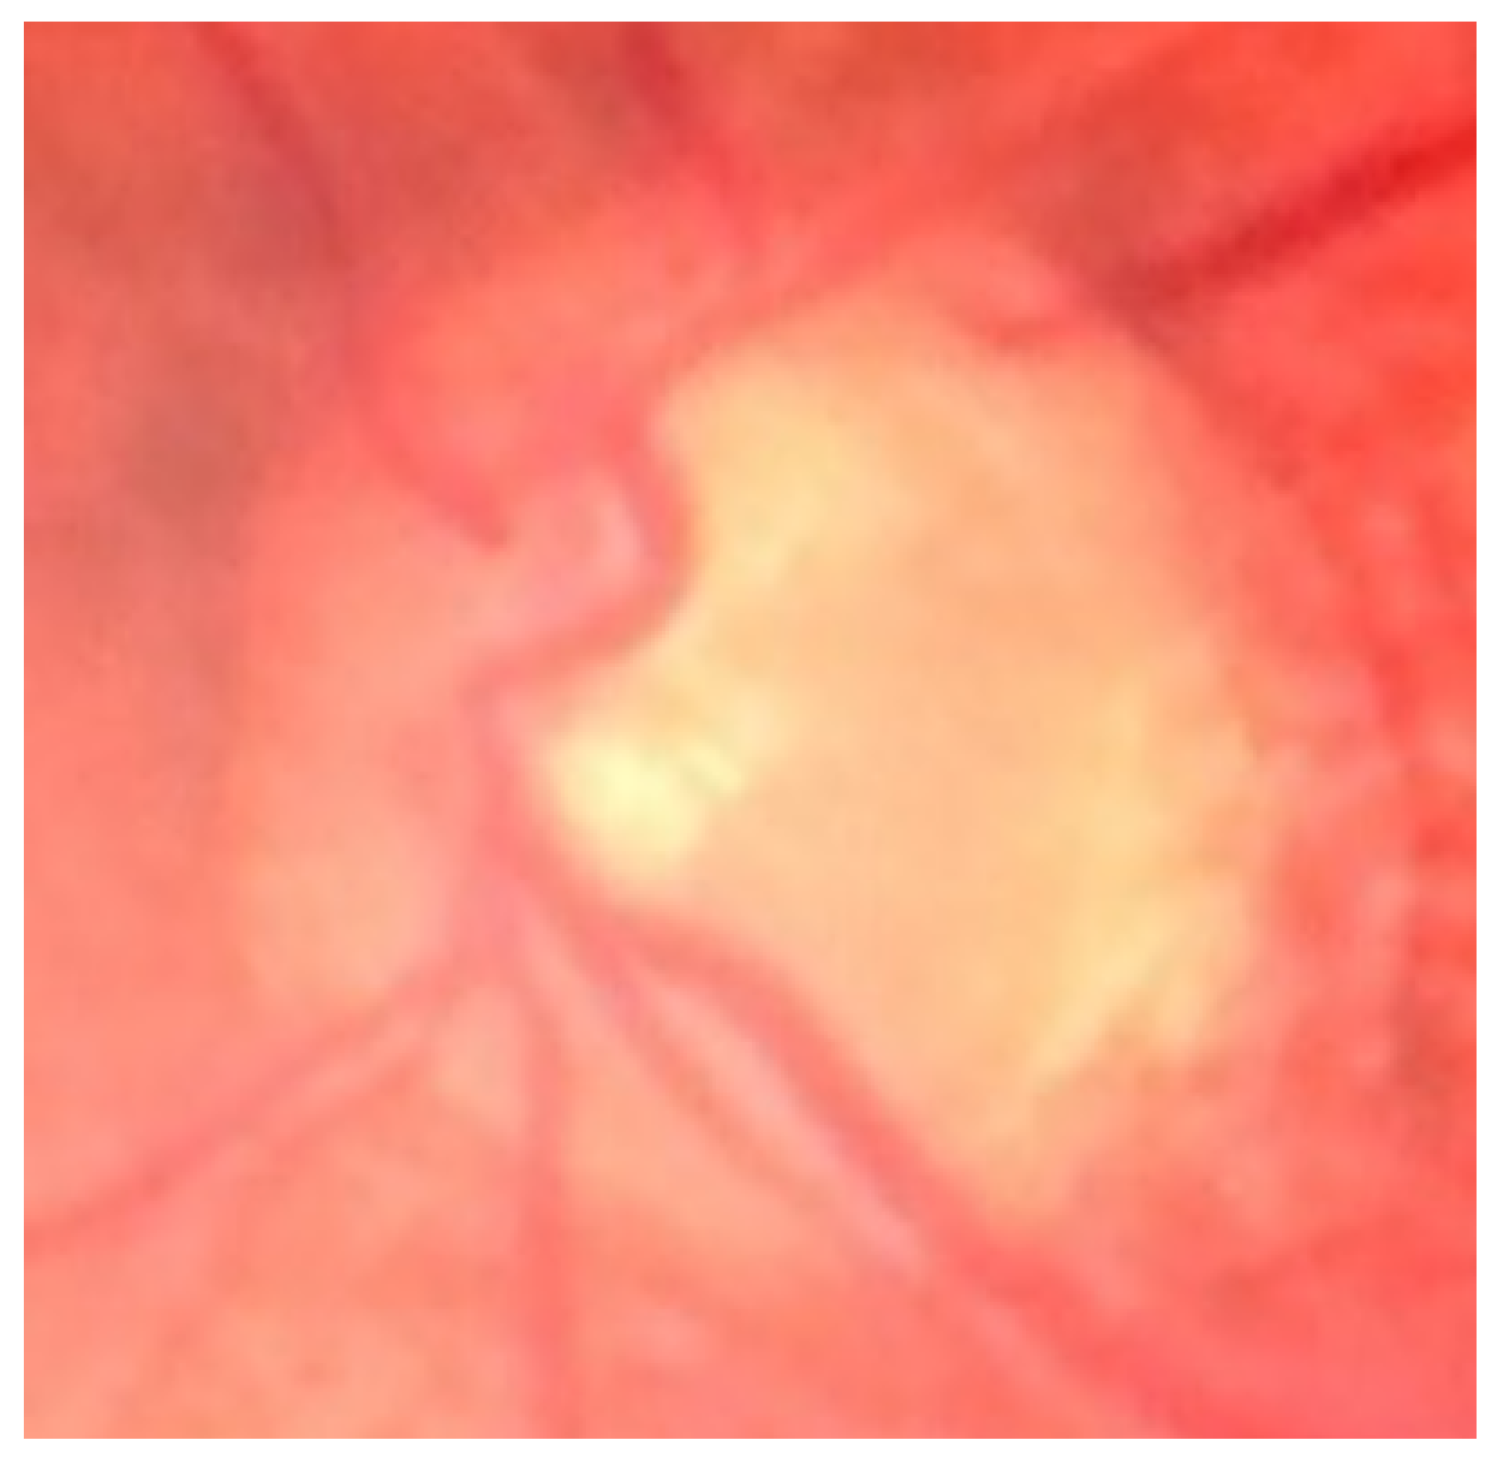
Three common types of noises were found on the BrG dataset that could influence the performance of the proposed OD detection method. The first one is low-contrast on images due to improper lighting conditions, and the second is light artifacts from external sources, like the surrounding environment light. The third type of noise present are reflections originated from the device’s lighting [
34].
Figure 1 represent some examples of the different types of noises that exist on the dataset.
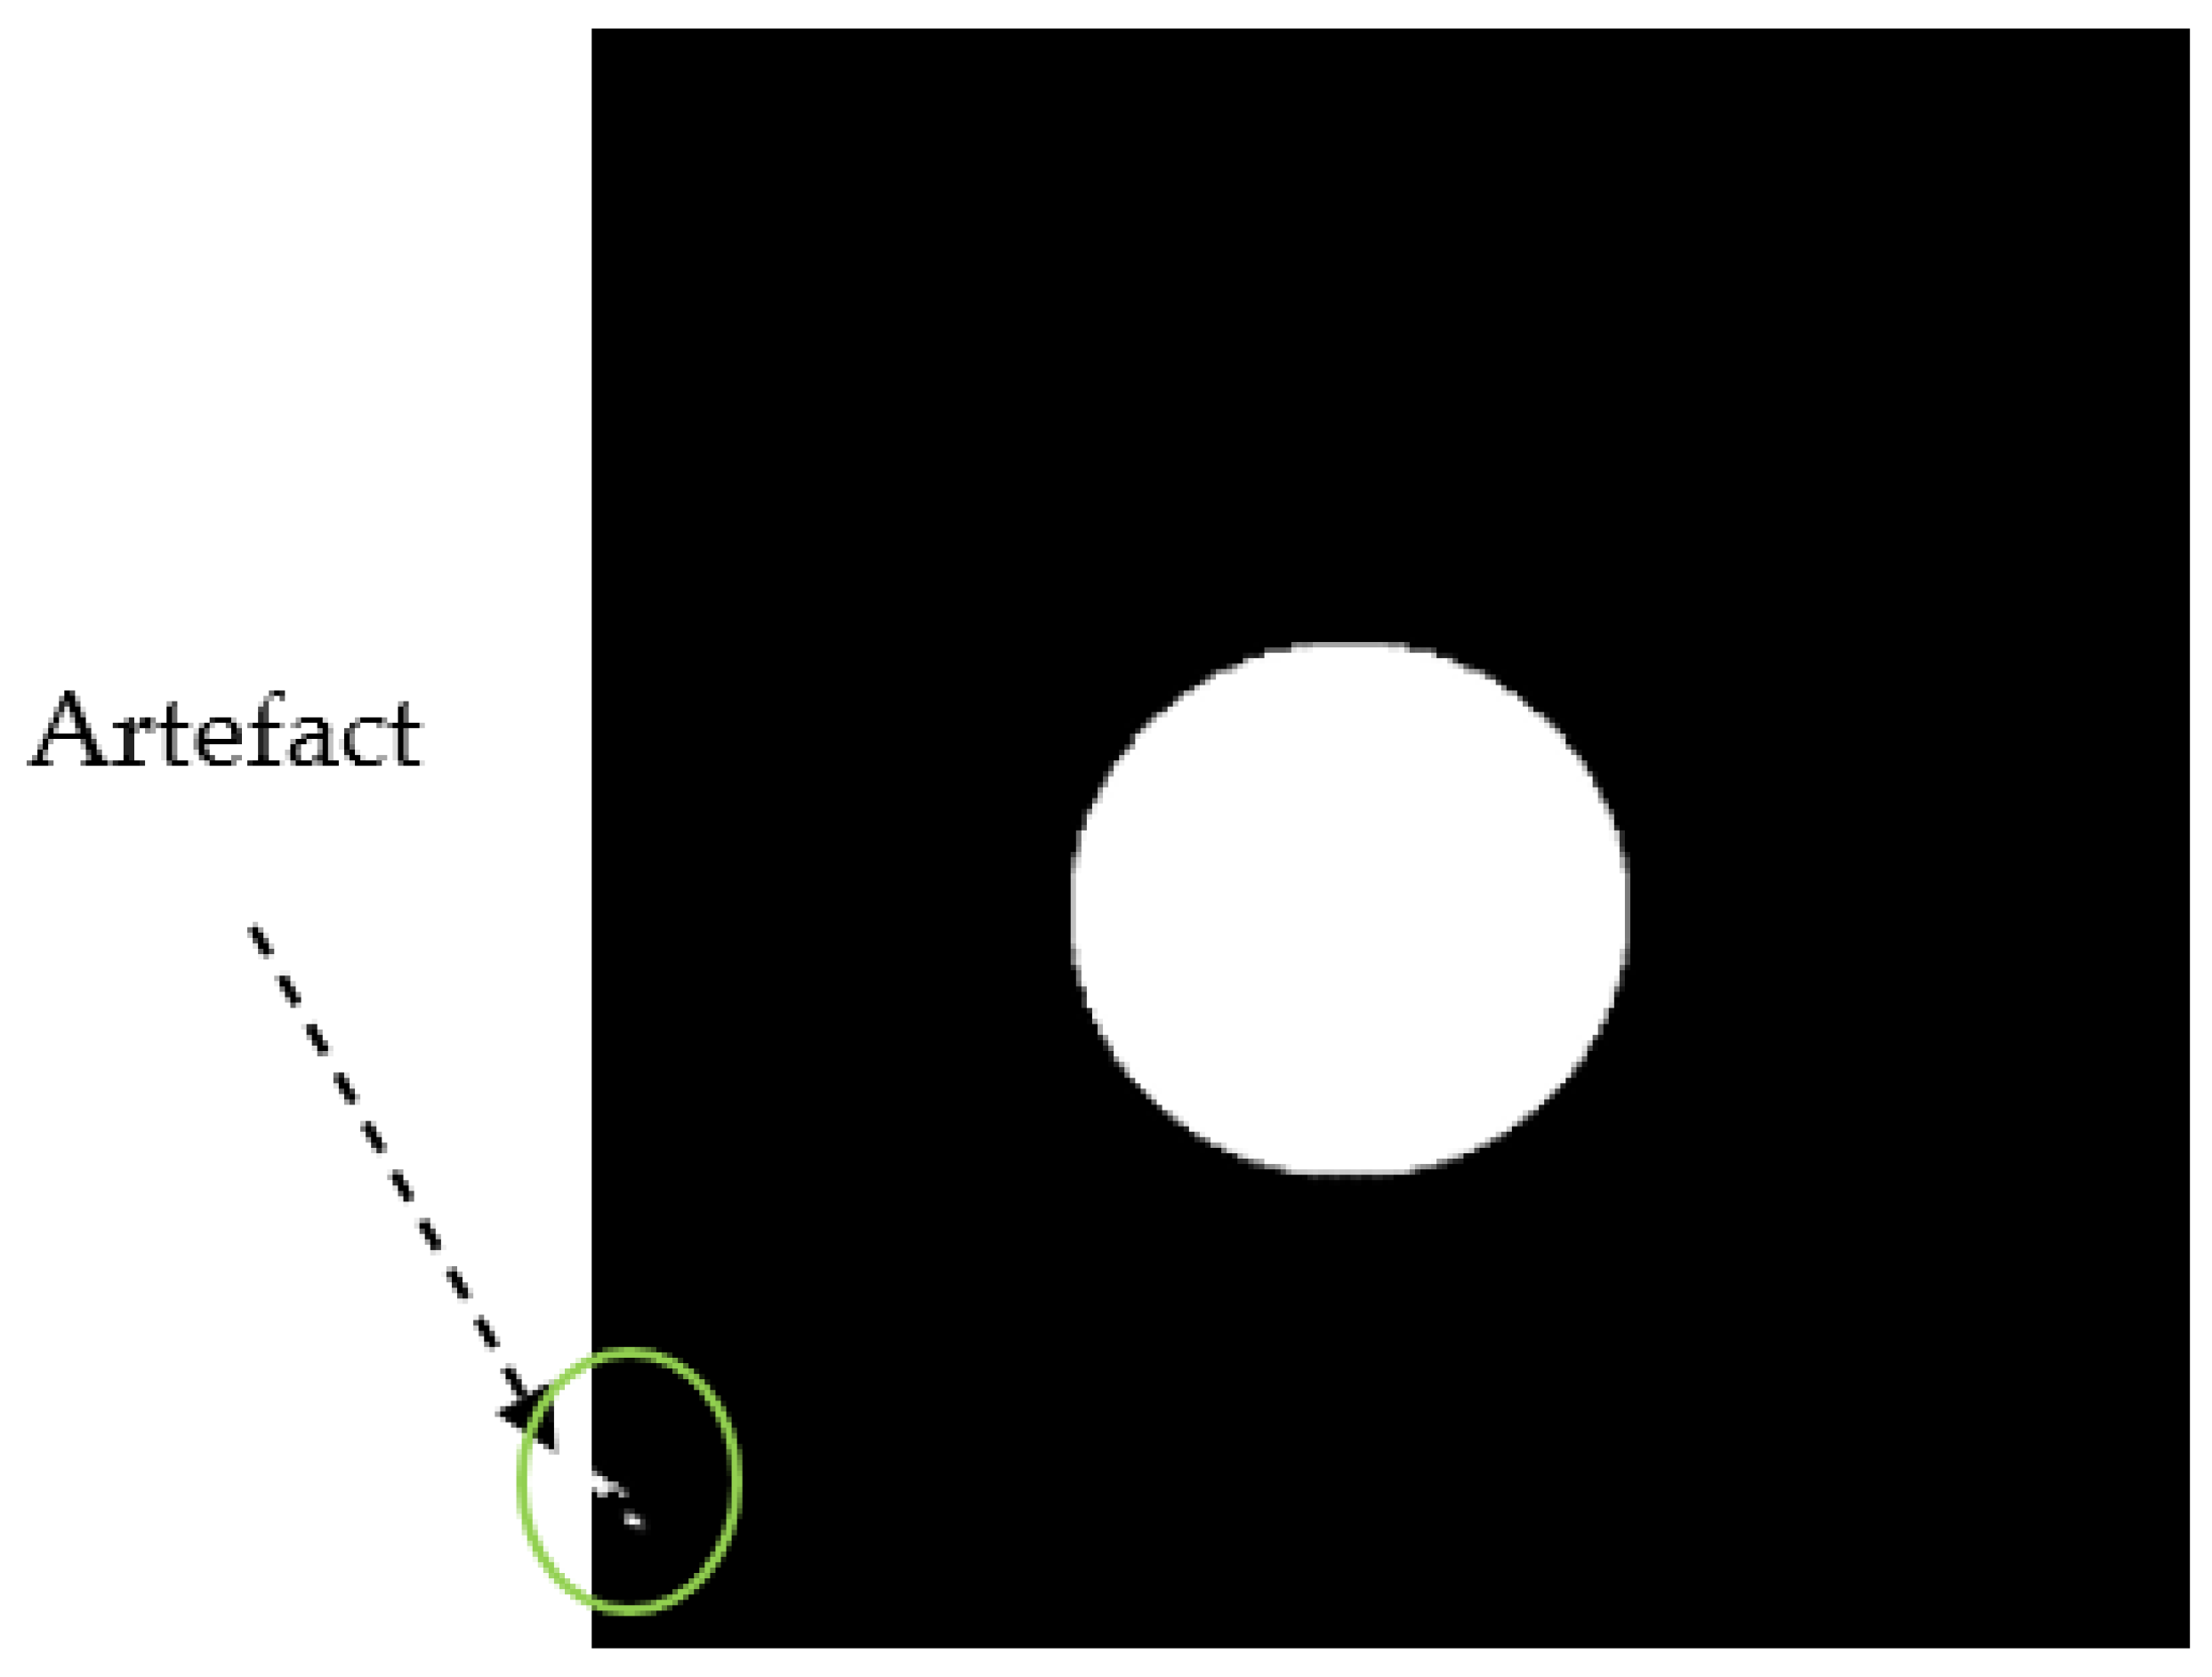
During the pre-processing stage, the input images are resized to 416x416 since the original images have different size. Training a YOLO model requires a color image and their corresponding bounding box labels in YOLO format. Since the dataset doesn’t have coordinate labels, to get these values from the BrG dataset, we used the circular binary image masks of the fundus images to extract the rectangular bounding box values by taking the maximum and minimum coordinates in the XY-plane. Hence, these values were then normalized, and saved in YOLO format, which comprises the class, center coordinates, height, and width of the bounding box. As shown in
Figure 2, some of the masks have artifacts around the edges that leads to wrong bounding box values. We have multiplied the corners with zero to make sure that all such artifacts don’t exist, so then we will have the correct annotations for all the images.
3.2. The YOLOv8n model
The YOLO series models are typical one-stage object detection models. From those, YOLOv8 is the latest of YOLO’s computer vision models developed by the YOLOv5 team [
36]. The YOLOv8n is a simplified version of the YOLOv8 model, with 225 layers and nearly 3 million parameters. It has small number of parameters, has the least mAP and latency and utilizes less memory compared to the other models from the YOLO series. The model was originally trained on COCO dataset with 80 pre-trained classes. For our task, we have replaced the class from 80 to 1 class since OD is the only target we have for this work.
3.3. Model training parameters and evaluation metrics
The pre-trained weights of YOLOv8n were used for transfer learning on object detection task of a single class, which is the OD. As shown in
Table 1, the dataset was randomly partitioned into 60% for training, 15% for validation and 25% for testing the model’s performance. Google Collaboratory was used to write and implement fine-tuning on the YOLOv8n using the custom dataset. The weights of the specific model used in this study was downloaded from Ultralytics [
16]. The model was trained for 50 epochs with a batch size of 16, and AdamW [
37] was employed as optimizer with hyperparameter values set to a learning rate of 0.002 and momentum of 0.9.
To assess the performance of the fine-tuned model on the low quality fundus images, IOU, Precision-Recall (PR)-curve, and mAP@0.5 were used as the evaluation metrics. The IOU metric quantifies the overlap between the predicted and ground truth bounding box. The higher IOU values indicates that the model is performing well. The mAP@0.5 is calculated at a specific IOU threshold value to quantify the overall object detection performance of the model. The PR-curve is a graphical representation with Recall on the X-axis and Precision on the Y-axis. The Precision defines the ratio of correctly predicted positive instances (bounding boxes for our case), while Recall represents the ratio of actual positive instances that were successfully identified by the model. Apart from the common metrics that we use for evaluation of object detection tasks, we have also added two more parameters; center proximity (CP) and radius difference (RD). The CP will help us to see how far the predicted BB coordinate’s center is compared to the BB coordinate center of the GT. The RD indicates the difference between the predicted and GT’s length of radius. These two metrics helps more to validate the OD localization task. The equations in (1) and (2) defines for CP and RD, respectively.
Where, , is center coordinate of predicted bounding box.
is center coordinate for ground truth bounding box.
is the radius of the predicted bounding box, and is either the width or height of
the predicted bounding box, whoever the maximum is.
is the radius of the ground truth bounding box, and is either the width or height of
the ground truth bounding box, whoever the maximum is.
4. Results
Taking into account of the pre-defined parameters of the model during the training stage, the box-loss of the model for OD localization is around 0.5 for the training and validation after 50 epochs (
Figure 3), which seems to be the minimum loss value that the model can go. It had good performance for classifying the OD and the background, with a classification-loss of around 0.2. Noticing the quality of the images we used, these results can be considered as acceptable. The confusion matrix result shown in
Table 2 indicates that the YOLOv8n model predicts the OD location with 100% accuracy on the test images with an IOU of above 80%, which shows how well this model can be with such low quality images.
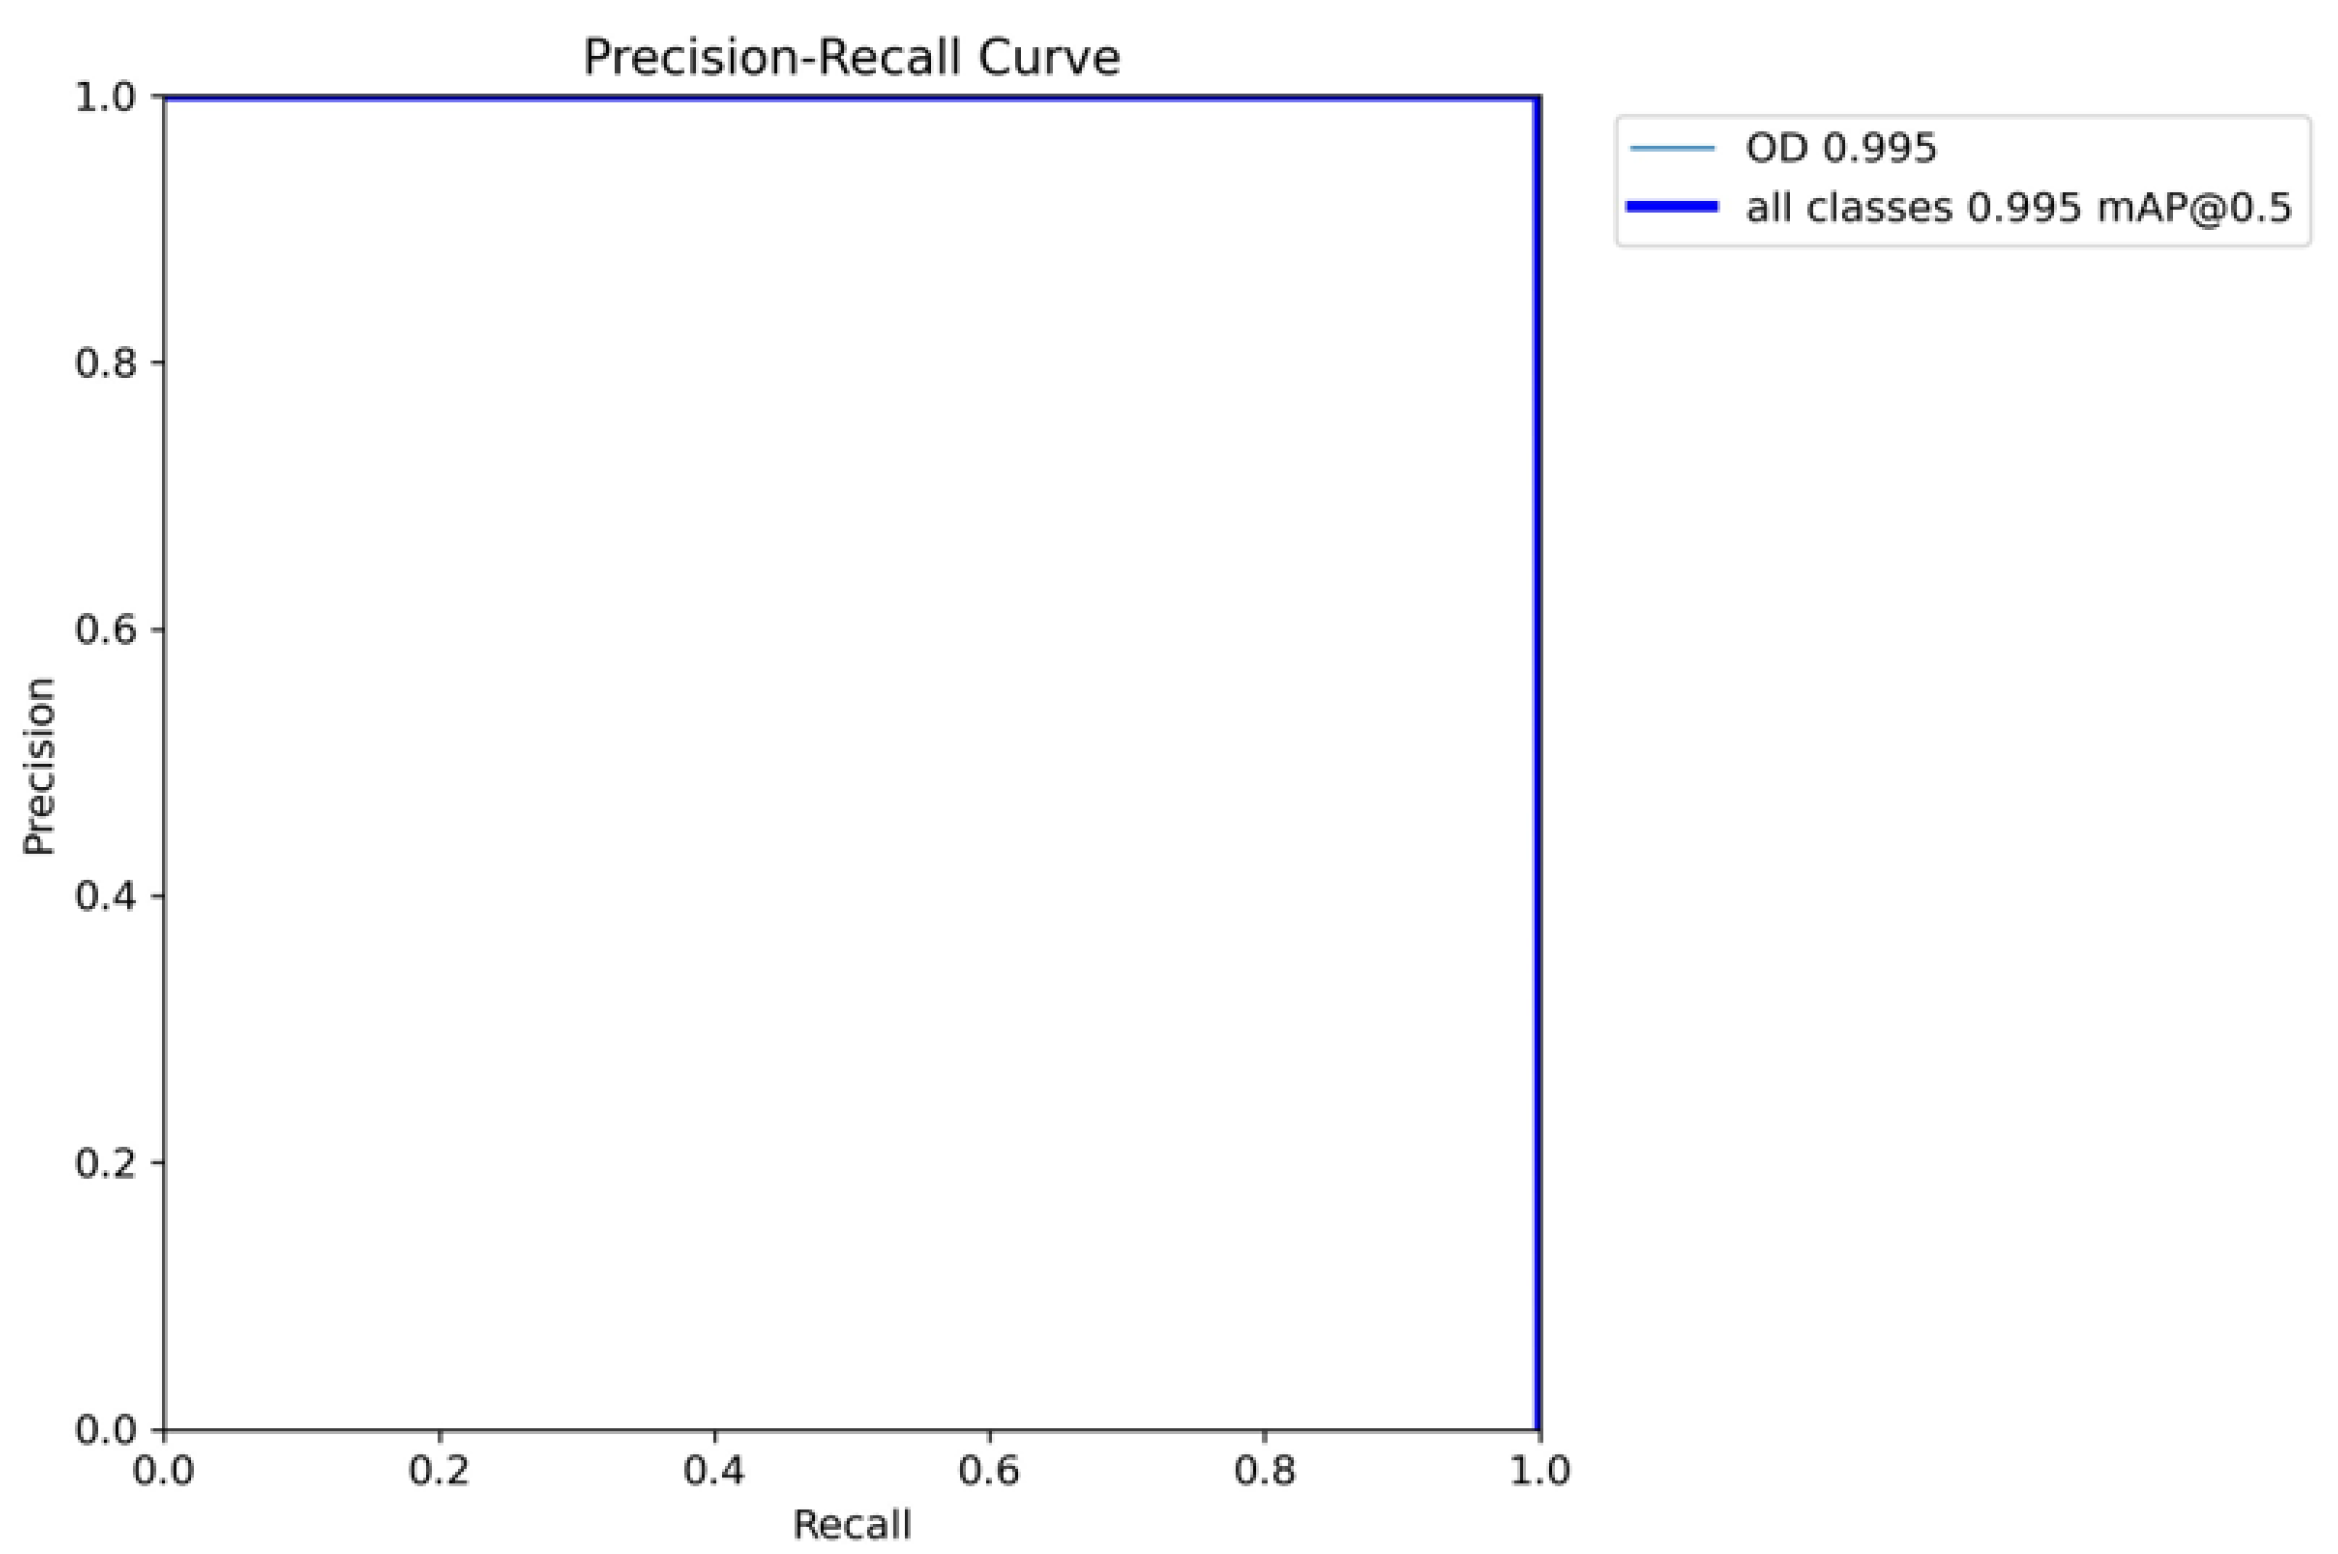
Referring to
Figure 4, the model has near-to-perfect PR-curve, indicating that the correct bounding boxes are detected on the test images with mAP@0.5 of 0.995 and mAP@0.5:0.95 of 0.905.
With a model’s confidence of above 0.5, the model has an IOU of above 0.85 on 97% of test images (
Table 3). An IOU greater than 0.85 is safe for object detection model evaluation and can be considered as a precise localization. This indicates that the model can perform well even with fundus images that has the lowest quality.
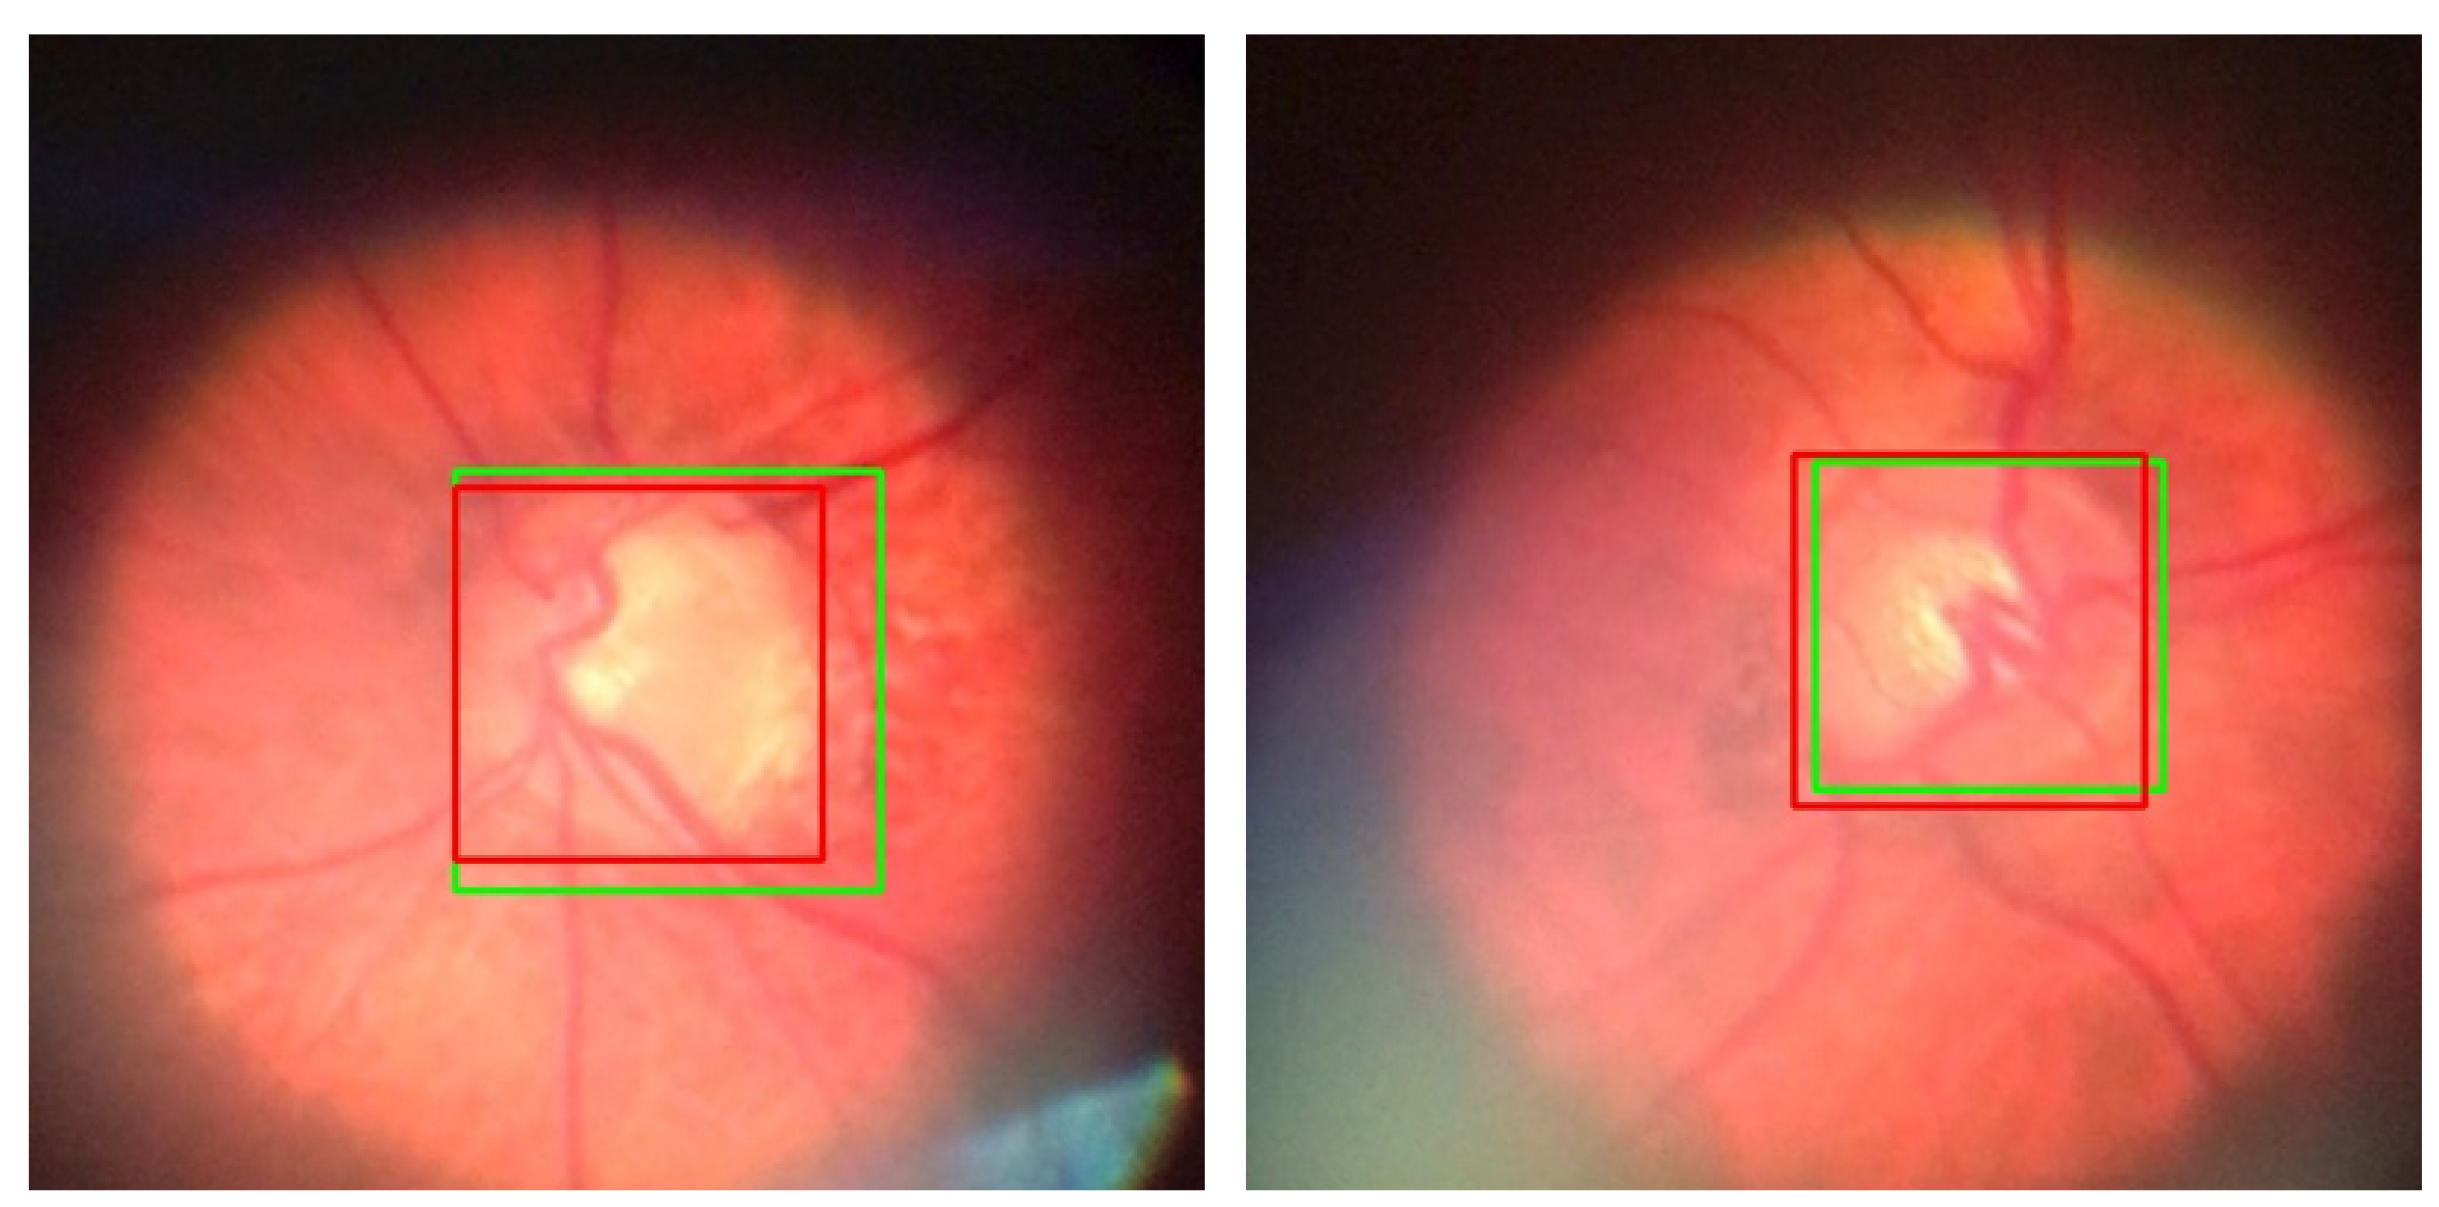
For the images with an IOU values ranging between 0.7 and 0.85, the model’s performance, while not reaching the levels of higher IOU values, remains acceptable (
Figure 6). It still effectively localizes the region that we wanted to select for glaucoma screening, indicating a satisfactory level of accuracy in identifying the OD from the background. When we crop the OD area, some pixel values will be added to all sides of the bounding box, so then we will have the image like in (
Figure 6) to proceed with screening. Accordingly, a test result with an IOU of at least 0.7 could be considered as an acceptable output.
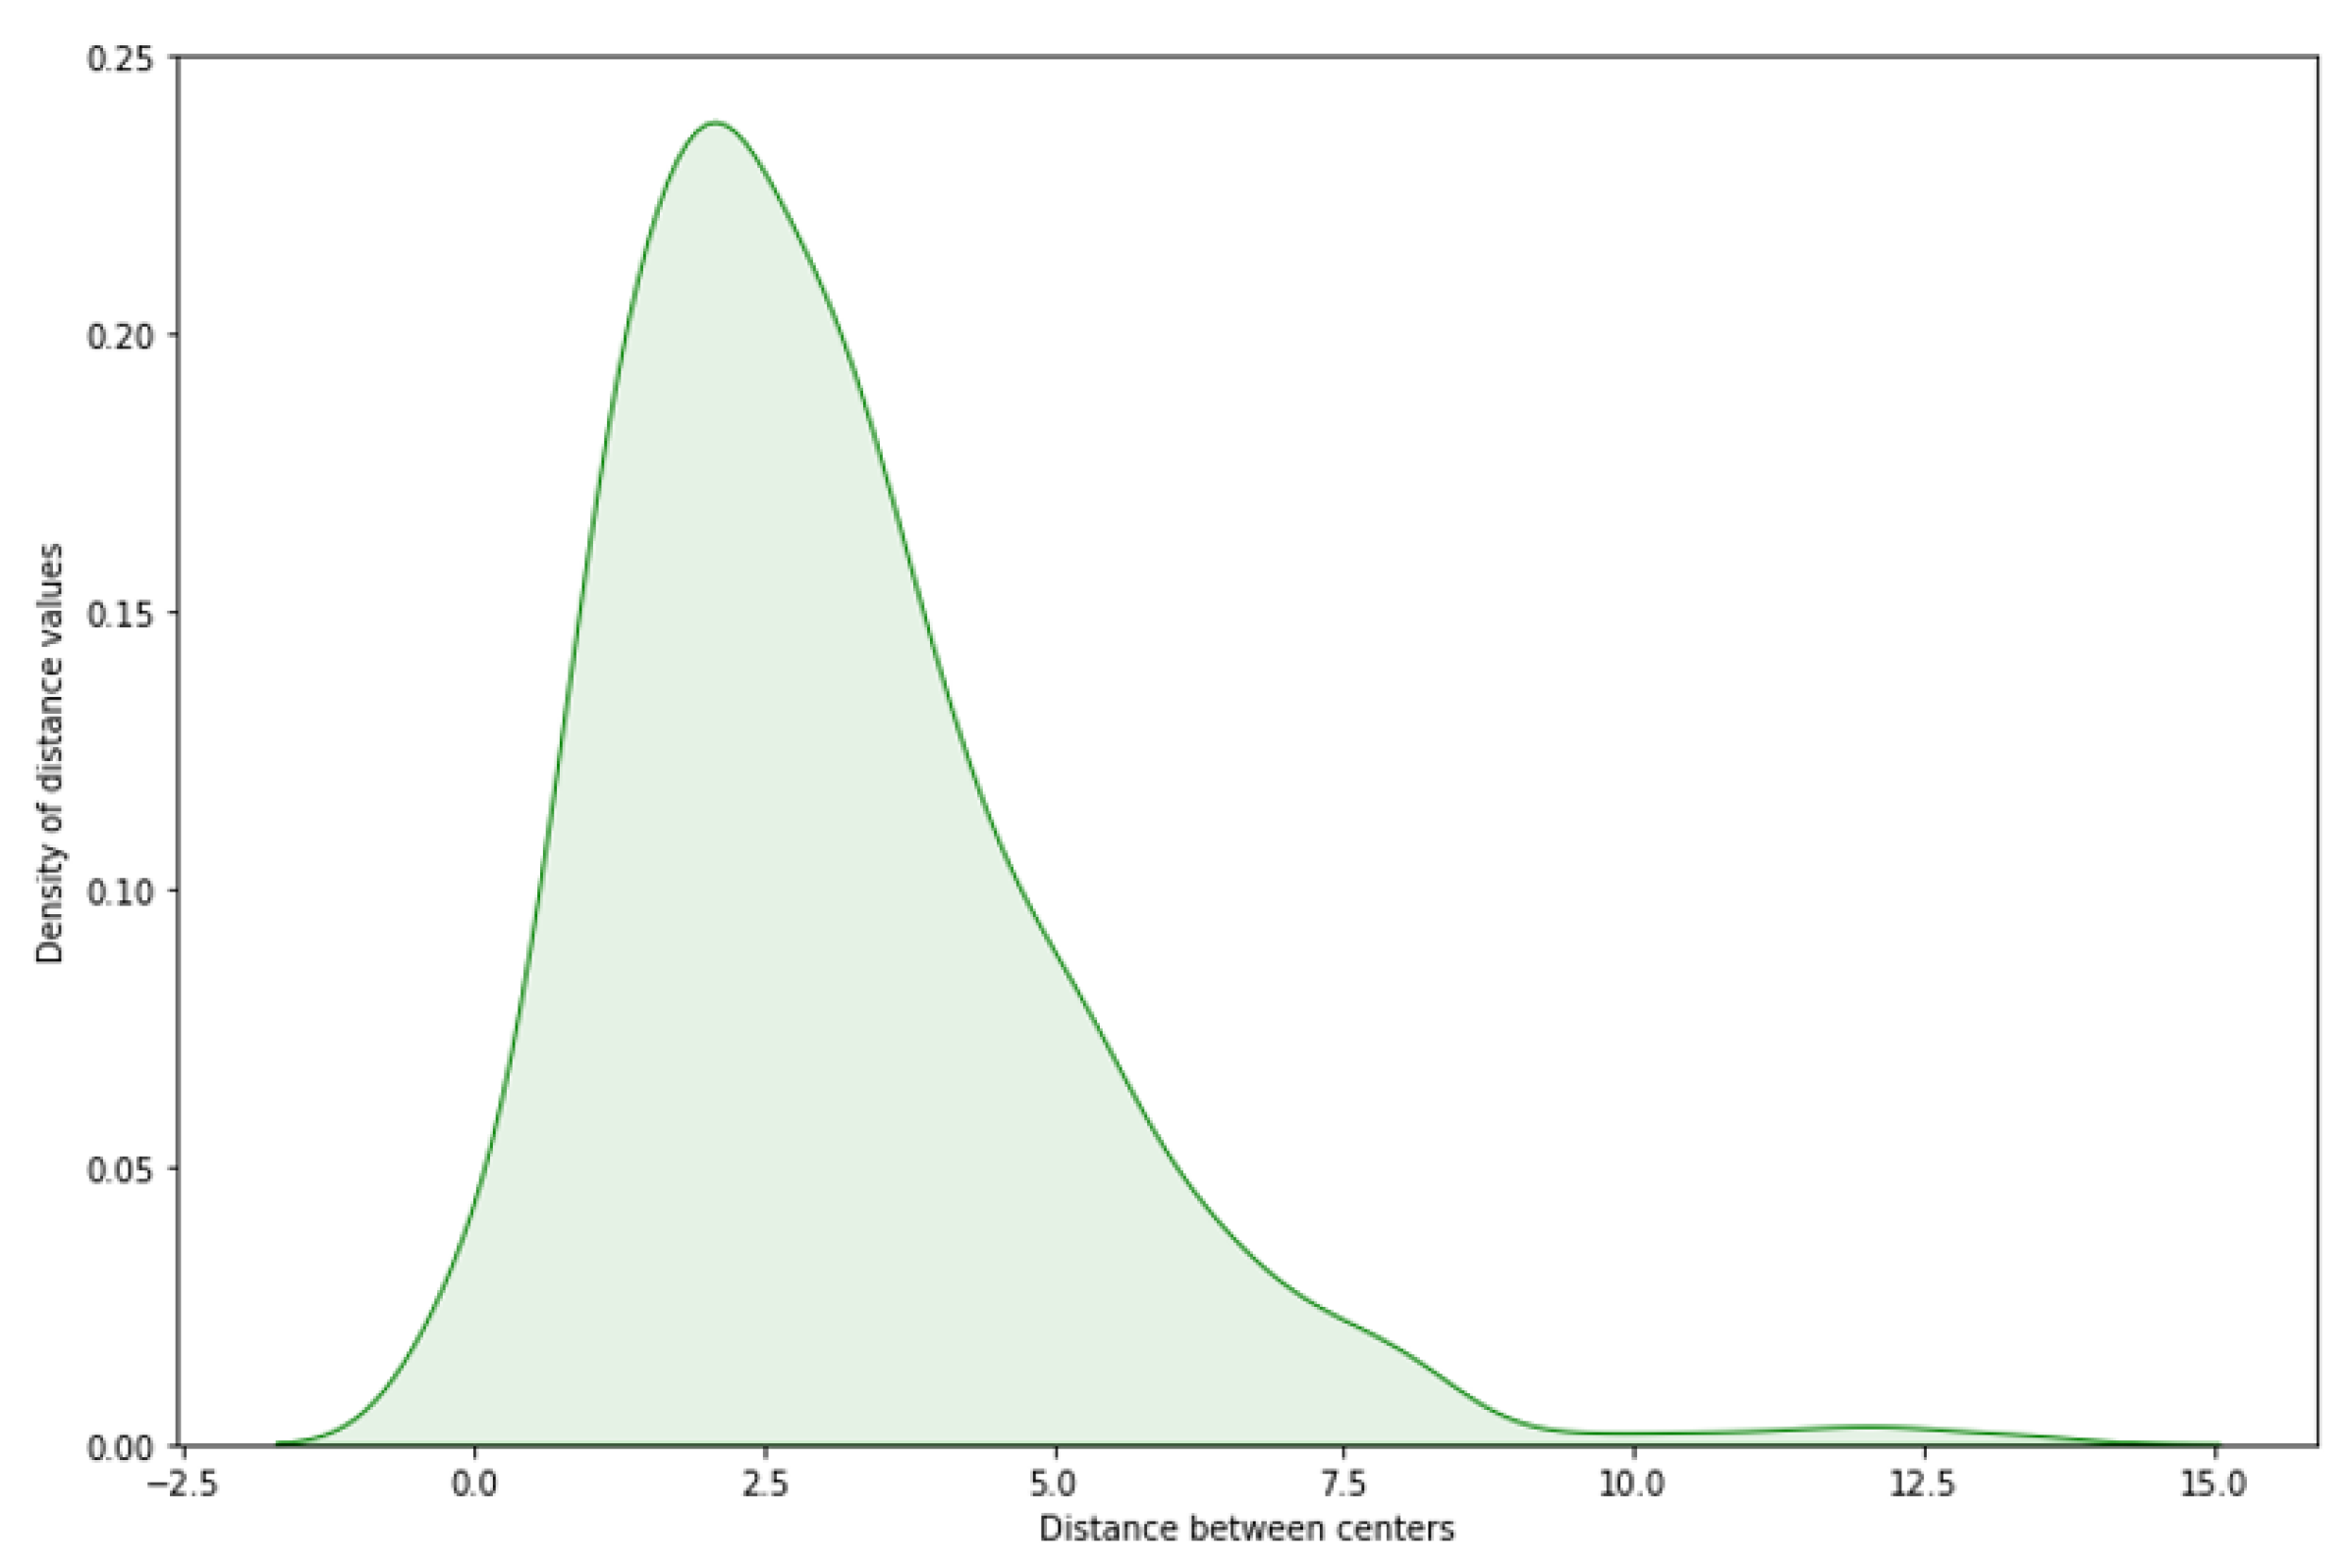
For evaluating the center proximity between the center of GT and predicted center, we have calculated the distance by drawing a linear line between the two centers, and applying trigonometric equations 1 and 2. Referring to
Figure 7, it shows that on above 95% of the test images, the distance between the predicted center of the new bounding box and the GT’s center of bounding box is between zero and seven pixels, where 99% of these test images have an IOU greater than 85%. The observed consistency, particularly within the zero to seven-pixel range, justifies to the precision of the model in capturing the anatomical center of the OD on majority of the test cases.
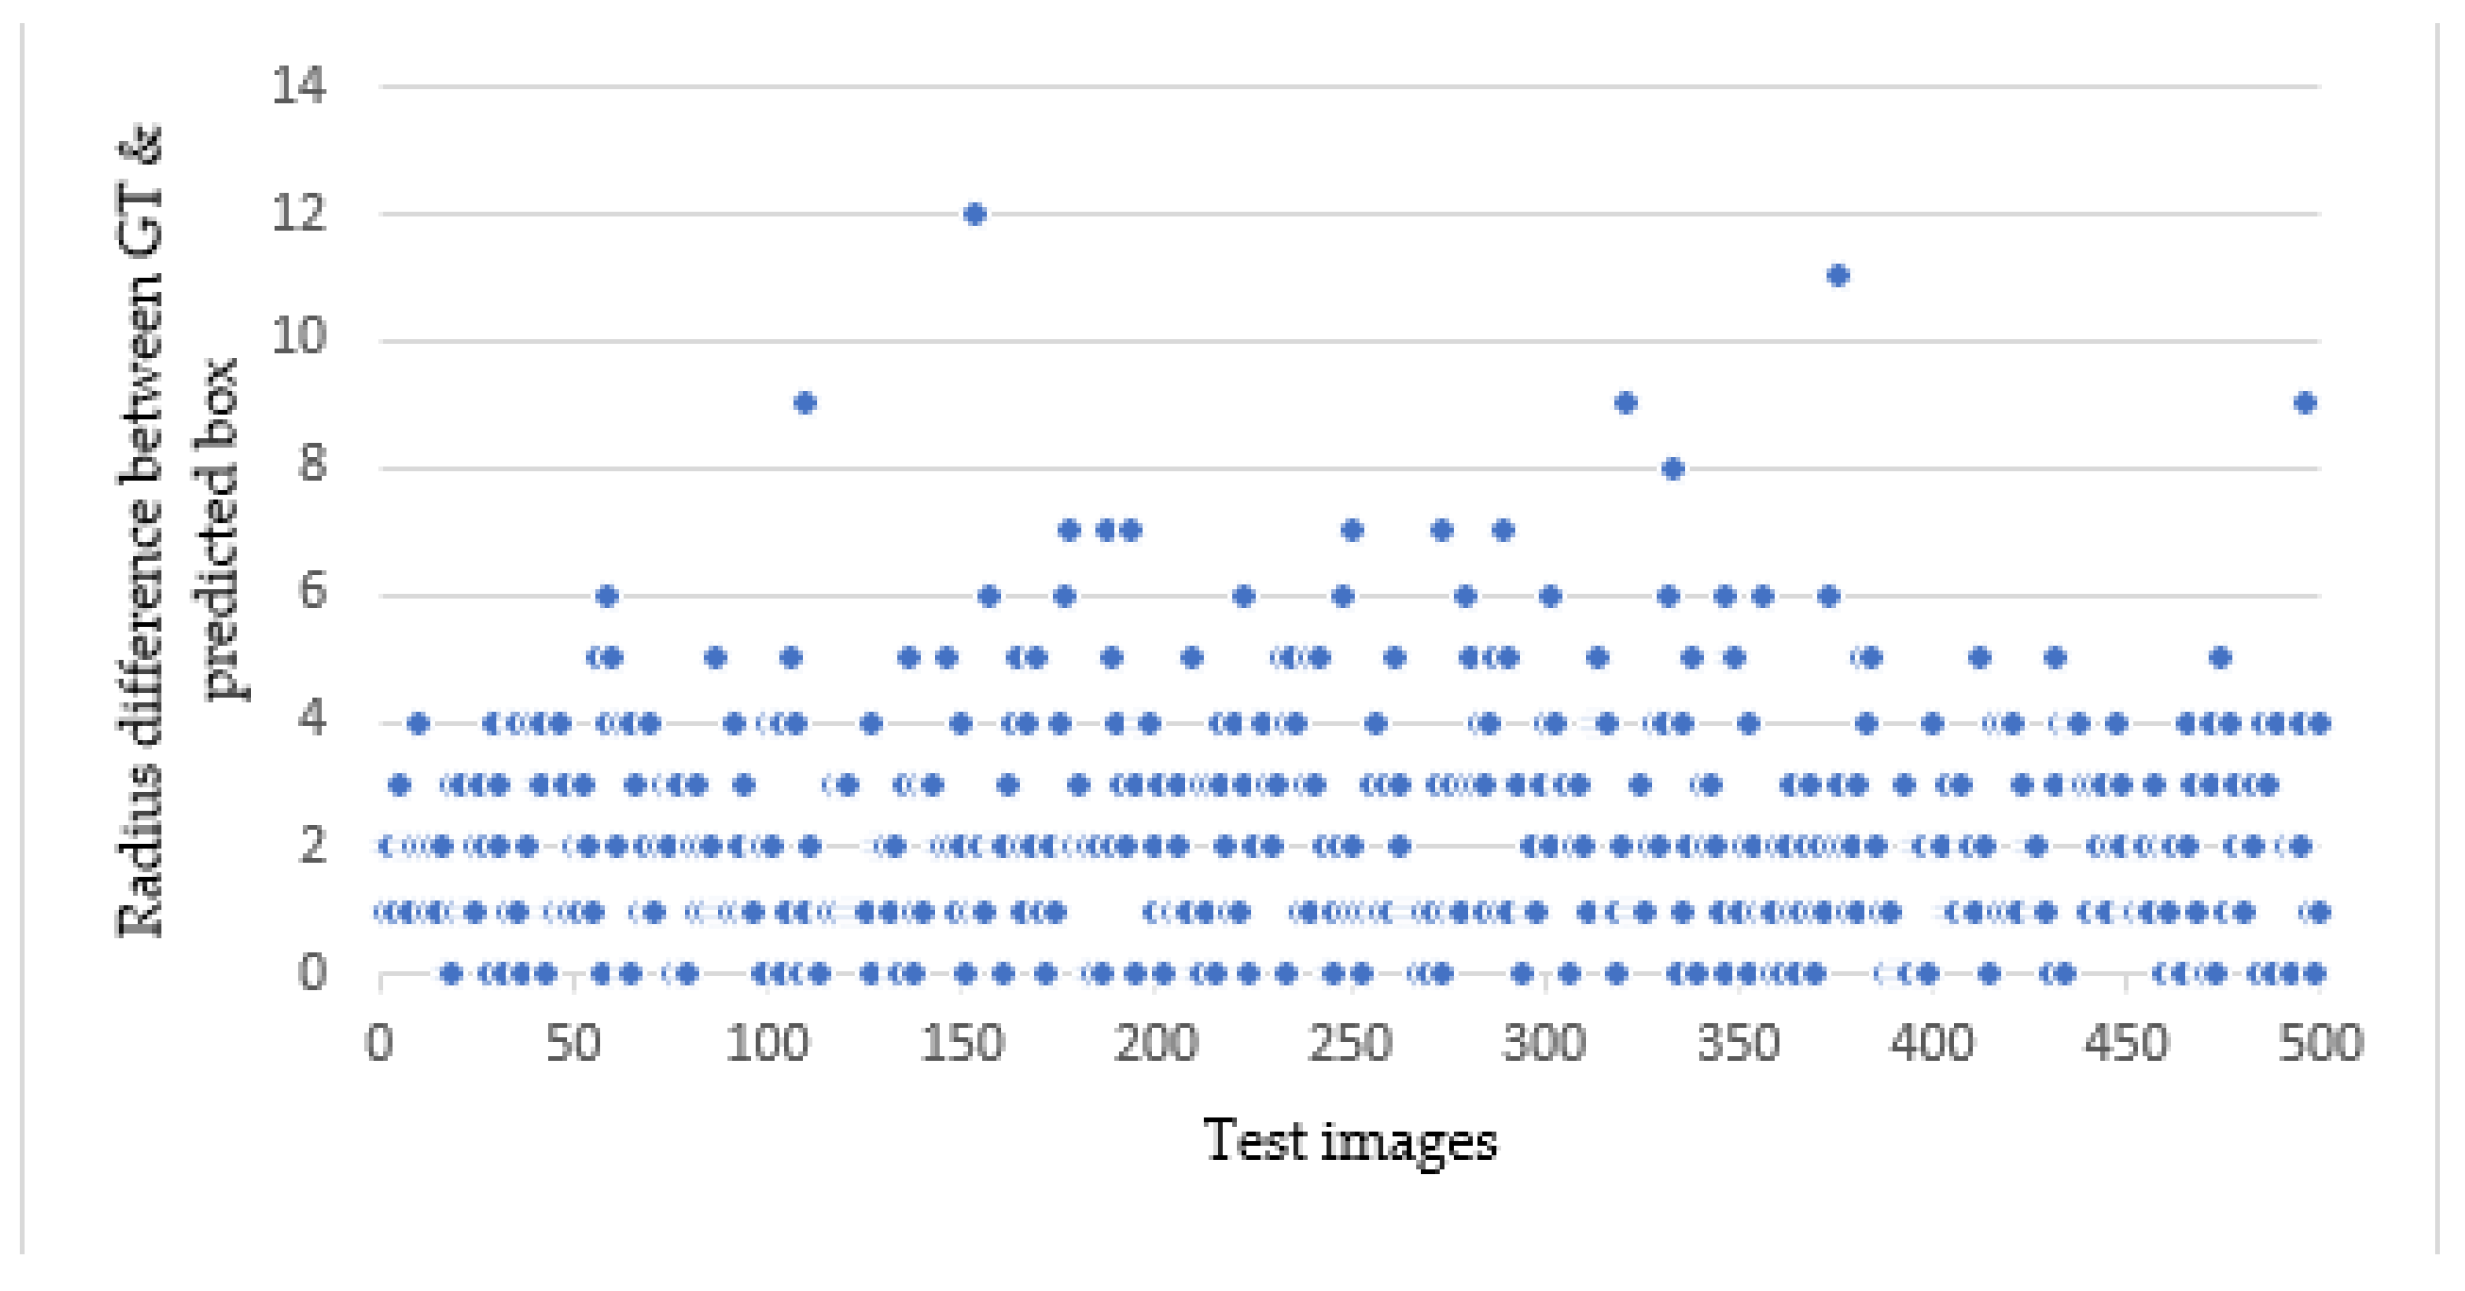
Considering CP as a single metrics for evaluating the object detection may not always provide a comprehensive assessment, particularly in scenarios where the CP is close to zero, but the IOU falls below the acceptable threshold. This happens for conditions where the area of the predicted box is too small or too large than the GT, while maintaining almost close to zero for CP. In such cases, combining the CP with RD would minimize the errors by identifying the points that have large radius difference between them (
Figure 8).
5. Discussion
Affordable technologies often come at the expense of image quality, like for the images captured with most of low price smartphone-based fundoscopies. However, integrating AI to overcome such challenges would make enhance the use of these devices in areas where there is limited access to the standard equipment. The YOLOv8n model is an ideal deep learning solution, demonstrating outstanding performance achieved on the low quality fundus images. The results, including an IOU of above 0.85 for over 97% of test images and a remarkably short distance (within zero to seven pixels) between the centers of GT and predicted bounding box for over 95% of the test images, highlight the model’s effectiveness and its ability to handle images of even lower quality than those considered in this study.
For performing glaucoma screening on smartphones, the first step is to accurately locate and crop the OD region automatically. The YOLOv8n model can be considered as an ideal model for this task due to its high precision in locating the OD, compact size that doesn’t demand sophisticated resources, and other advantageous features. This becomes especially important for expanding glaucoma screening in areas where obtaining advanced medical equipment is challenging.
Since there is only one public dataset as of writing this paper, future research could focus on expanding various dataset, as one of the study’s limitations is the lack of publicly available datasets specifically designed for fundus images captured with smartphones. A larger and more diverse dataset would help to further refine the model’s generalization capabilities.
6. Conclusion
Worldwide, glaucoma has contributed to the increasing number of people with vision loss, especially in developing countries. To reduce the risks, early screening is what has been advised by professional, but there is a resource limitation in these places. The smartphone-based approach is being a focus in recent years, so then every hospital could have what is needed to conduct glaucoma screening, but it comes with limitations like low fundus image quality even though the technology is affordable compared to the standard devices. Being OD localization as a crucial step in automated glaucoma screening, the quality directly affects the screening process. On this study, we have tried to demonstrate the performance of YOLOv8n model for OD localization on smartphone-captured fundus images that have inherent noises that came from different reasons like from the in-device reflections, external reflections, or related to the low contrasts. We considered fundus images which are captured using smartphone-based fundoscopy portable devices, unlike previous studies like [
17,
19,
25,
26] that primarily used high-quality images, or added artificial noise to the images like in [
33].
We have applied transfer learning on the pretrained weights of YOLOv8n, which has 225 convolutional layers, using the publicly available dataset [
34] that is collected using smartphone. The images were resized to 416x416 to make them match with the input layer of the model. We have also used the default pre-processing of the model on the way. To assess the model’s performance, we looked at different metrics like mAP, IOU, the closeness of centers of predicted and ground truth, and by looking at the similarity of the radius. Accordingly, the results show that the YOLOv8n model performs well, achieving higher mAP@0.5 of 0.995, and mAP@0.5:0.95 of 0.905 even with very low-quality images. Importantly, the predicted bounding box centers & radius closely match the ground truth, demonstrating the model’s ability to accurately localize the OD on conditions where there is a quality degradation.
The outcome of this study has important implications, especially given the growing demand of smartphone-based fundoscopy in resource-limited settings. The success of YOLOv8n in localizing the OD in low-quality images highlights its potential as a powerful tool for improving glaucoma screening and other ophthalmic diagnostic applications, especially where standard fundus cameras may be impractical or unavailable.
Funding
This research was funded by Group T Academy with grant number ZKD7969-00-W01.
Data Availability Statement
Conflicts of Interest
The authors declare no conflict of interest.
References
- Ha, Q. The number of people with glaucoma worldwide in 2010 and 2020. Br j ophthalmol 2006, 90, 262–267. [CrossRef]
- Coleman, A.L.; Miglior, S. Risk factors for glaucoma onset and progression. Survey of ophthalmology 2008, 53, S3–S10. [CrossRef]
- Marcus, M.W.; de Vries, M.M.; Montolio, F.G.J.; Jansonius, N.M. Myopia as a risk factor for open-angle glaucoma: a systematic review and meta-analysis. Ophthalmology 2011, 118, 1989–1994. [CrossRef]
- McMonnies, C.W. Glaucoma history and risk factors. Journal of optometry 2017, 10, 71–78. [CrossRef]
- Glaucoma: Causes, Symptoms, Treatment, (accessed on 22 November 2023). Available online: https://gbr.orbis.org/en/avoidable-blindness/glaucoma-causes-symptoms-treatment.
- Jonas, J.B.; Budde, W.M. Diagnosis and pathogenesis of glaucomatous optic neuropathy: morphological aspects1. Progress in retinal and eye research 2000, 19, 1–40. doi: 10.1016/s1350-9462(99)00002-6.
- Russo, A.; Morescalchi, F.; Costagliola, C.; Delcassi, L.; Semeraro, F.; others. A novel device to exploit the smartphone camera for fundus photography. Journal of ophthalmology 2015, 2015. doi: 10.1155/2015/823139.
- Haddock, L.J.; Kim, D.Y.; Mukai, S. Simple, inexpensive technique for high-quality smartphone fundus photography in human and animal eyes. Journal of ophthalmology 2013, 2013. doi: 10.1155/2013/518479.
- oDocs nun Ophthalmoscope, (accessed on 22 November 2023). Available online: https://www.odocs-tech.com/nun.
- Volk Optical iNview, (accessed on 22 November 2023). Available online: https://www.volk.com/products/inview-for-iphone-6-6s.
- iEXAMINER, (accessed on 22 November 2023). Available online: https://www.welchallyn.com/en/microsites/iexaminer.html.
- Diwan, T.; Anirudh, G.; Tembhurne, J.V. Object detection using YOLO: Challenges, architectural successors, datasets and applications. multimedia Tools and Applications 2023, 82, 9243–9275. [CrossRef]
- Liu, C.; Tao, Y.; Liang, J.; Li, K.; Chen, Y. Object detection based on YOLO network. 2018 IEEE 4th information technology and mechatronics engineering conference (ITOEC). IEEE, 2018, pp. 799–803.
- Chen, B.; Miao, X. Distribution line pole detection and counting based on YOLO using UAV inspection line video. Journal of Electrical Engineering & Technology 2020, 15, 441–448. [CrossRef]
- Wu, D.; Lv, S.; Jiang, M.; Song, H. Using channel pruning-based YOLO v4 deep learning algorithm for the real-time and accurate detection of apple flowers in natural environments. Computers and Electronics in Agriculture 2020, 178, 105742. [CrossRef]
- GitHub - ultralytics/ultralytics: NEW - YOLOv8 in PyTorch > ONNX > OpenVINO > CoreML > TFLite., (accessed on 22 November 2023). Available online: https://github.com/ultralytics/ultralytics.
- Han, S.; Yu, W.; Yang, H.; Wan, S. An improved corner detection algorithm based on harris. 2018 Chinese Automation Congress (CAC). IEEE, 2018, pp. 1575–1580.
- Liu, C.; Tao, Y.; Liang, J.; Li, K.; Chen, Y. Object detection based on YOLO network. 2018 IEEE 4th information technology and mechatronics engineering conference (ITOEC). IEEE, 2018, pp. 799–803.
- Feng, Y.; Li, Z.; Yang, D.; Hu, H.; Guo, H.; Liu, H. Polarformer: Optic Disc and Cup Segmentation Using a Hybrid CNN-Transformer and Polar Transformation. Applied Sciences 2022, 13, 541. [CrossRef]
- Orlando, J.I.; Fu, H.; Breda, J.B.; Van Keer, K.; Bathula, D.R.; Diaz-Pinto, A.; Fang, R.; Heng, P.A.; Kim, J.; Lee, J.; others. Refuge challenge: A unified framework for evaluating automated methods for glaucoma assessment from fundus photographs. Medical image analysis 2020, 59, 101570. [CrossRef]
- Sivaswamy, J.; Krishnadas, S.; Joshi, G.D.; Jain, M.; Tabish, A.U.S. Drishti-gs: Retinal image dataset for optic nerve head (onh) segmentation. 2014 IEEE 11th international symposium on biomedical imaging (ISBI). IEEE, 2014, pp. 53–56.
- Fumero, F.; Alayón, S.; Sanchez, J.L.; Sigut, J.; Gonzalez-Hernandez, M. RIM-ONE: An open retinal image database for optic nerve evaluation. 2011 24th international symposium on computer-based medical systems (CBMS). IEEE, 2011, pp. 1–6.
- Chen, L.C.; Zhu, Y.; Papandreou, G.; Schroff, F.; Adam, H. Encoder-decoder with atrous separable convolution for semantic image segmentation. Proceedings of the European conference on computer vision (ECCV), 2018, pp. 801–818.
- Ren, S.; He, K.; Girshick, R.; Sun, J. Faster r-cnn: Towards real-time object detection with region proposal networks. Advances in neural information processing systems 2015, 28.
- Bajwa, M.N.; Malik, M.I.; Siddiqui, S.A.; Dengel, A.; Shafait, F.; Neumeier, W.; Ahmed, S. Two-stage framework for optic disc localization and glaucoma classification in retinal fundus images using deep learning. BMC medical informatics and decision making 2019, 19, 1–16. [CrossRef]
- Almubarak, H.; Bazi, Y.; Alajlan, N. Two-stage mask-RCNN approach for detecting and segmenting the optic nerve head, optic disc, and optic cup in fundus images. Applied Sciences 2020, 10, 3833. [CrossRef]
- He, K.; Gkioxari, G.; Dollár, P.; Girshick, R. Mask r-cnn. Proceedings of the IEEE international conference on computer vision, 2017, pp. 2961–2969.
- Nawaz, M.; Nazir, T.; Javed, A.; Tariq, U.; Yong, H.S.; Khan, M.A.; Cha, J. An efficient deep learning approach to automatic glaucoma detection using optic disc and optic cup localization. Sensors 2022, 22, 434. [CrossRef]
- Tan, M.; Pang, R.; Le, Q.V. Efficientdet: Scalable and efficient object detection. Proceedings of the IEEE/CVF conference on computer vision and pattern recognition, 2020, pp. 10781–10790.
- Ali, H.M.; El Abbadi, N.K. Optic Disc Localization in Retinal Fundus Images Based on You Only Look Once Network (YOLO). International Journal of Intelligent Engineering & Systems 2023, 16. [CrossRef]
- Wang, R.; Zheng, L.; Xiong, C.; Qiu, C.; Li, H.; Hou, X.; Sheng, B.; Li, P.; Wu, Q. Retinal optic disc localization using convergence tracking of blood vessels. Multimedia Tools and Applications 2017, 76, 23309–23331. [CrossRef]
- Nazir, T.; Irtaza, A.; Starovoitov, V. Optic disc and optic cup segmentation for glaucoma detection from blur retinal images using improved mask-RCNN. International Journal of Optics 2021, 2021, 1–12. [CrossRef]
- Luangruangrong, W.; Chinnasarn, K. Optic disc localization in complicated environment of retinal image using circular-like estimation. Arabian Journal for Science and Engineering 2019, 44, 4009–4026. [CrossRef]
- Bragança, C.P.; Torres, J.M.; Soares, C.P.d.A.; Macedo, L.O. Detection of glaucoma on fundus images using deep learning on a new image set obtained with a smartphone and handheld ophthalmoscope. Healthcare. MDPI, 2022, Vol. 10, p. 2345. [CrossRef]
- PanOptic Ophthalmoscope., (accessed on 22 November 2023). Available online: https://www.welchallyn.com/content/welchallyn/emeai/me/products/categories/physical-exam/eye-exam/ophthalmoscopes–wide-view-direct/panoptic_ophthalmoscope.html.
- GitHub - ultralytics/yolov5: YOLOv5 in PyTorch > ONNX > CoreML > TFLite., (accessed on 22 November 2023). Available online: https://github.com/ultralytics/yolov5.
- Loshchilov, I.; Hutter, F. Decoupled weight decay regularization. arXiv preprint arXiv:1711.05101 2017. arXiv:1711.05101 2017.
|
Disclaimer/Publisher’s Note: The statements, opinions and data contained in all publications are solely those of the individual author(s) and contributor(s) and not of MDPI and/or the editor(s). MDPI and/or the editor(s) disclaim responsibility for any injury to people or property resulting from any ideas, methods, instructions or products referred to in the content. |
© 2023 by the authors. Licensee MDPI, Basel, Switzerland. This article is an open access article distributed under the terms and conditions of the Creative Commons Attribution (CC BY) license (http://creativecommons.org/licenses/by/4.0/).
