
Submitted:
03 February 2023
Posted:
07 February 2023
You are already at the latest version
Abstract
Machine Learning (ML) methods have become important to enhance the performance of decision-support predictive models. However, class imbalance is one of the main challenges for developing ML models, because it limits the generalization of these models, and biases the learning algorithms. In this paper, we consider oversampling methods for generating synthetic categorical clinical data aiming to improve the predictive performance in ML models, and the identification of risk factors for cardiovascular diseases (CVDs). We performed a comparative study of several categorical synthetic data generation methods, including Generative Adversarial Networks (GANs). Then, we assessed the impact of combining oversampling strategies and linear and nonlinear supervised ML methods. Lastly, we conducted a post-hoc model interpretability based on the importance of the risk factors. Experimental results show the potential of GAN-based models for generating high-quality categorical synthetic data, yielding probability mass functions that are highly close to real data, maintaining relevant insights, and contributing to increase the predictive performance. The GAN-based model and a linear classifier outperforms other oversampling techniques, improving 2\% the area under the curve. These results demonstrate the capability of synthetic data to help both in determining risk factors and building models for CVD prediction.
Keywords:
Synthetic categorical data generation
; generative adversarial networks
; imbalance learning
; CTGAN
; interpretable machine learning
; cardiovascular disease
1. Introduction
With the ongoing development in information and communication technologies, unprecedented amounts of data have been generated in multiple fields of healthcare [1]. Data-driven models offer great research opportunities, allowing us to extract clinical knowledge and support decision-making. Along with data proliferation, the use of Artificial Intelligence (AI) has been intensified in recent years fostered by advances in computer processing, software platforms and automatic differentiation [2]. Within AI, Machine Learning (ML) methods have attracted significant attention in both academia and industry, being used in multiple domains ranging from computer vision to natural language processing [3] and for different tasks such as classification, regression, and clustering among others.
Despite the potential of ML methods, most of them are generally hampered by the class imbalance problem, which occurs when the proportion of samples of one class greatly outnumbers the others [4,5]. Since most ML algorithms are built to work with balanced datasets, the classifiers are biased toward the majority class. To deal with this, several methods have been proposed in the literature [4,5,6,7], which can be classified into two types, algorithmic-level and data-level approaches. The former adapts the loss function of the algorithm by assigning a higher weight to the misclassification of samples associated with the minority classes during the training process [8]. Examples of these approaches include cost-sensitive learning and ensemble methods [8]. In contrast, data-level approaches balance the class distribution by undersampling the majority class, oversampling the minority classes, or considering a hybrid approach that combines undersampling and oversampling approaches [9].
In this paper, we primarily focus on oversampling techniques. Among them, Synthetic Minority Oversampling Technique (SMOTE) [10] is one of the most used. SMOTE relies on the algorithm of nearest neighbors that aims to generate new samples that are mid-way between two near neighbors in any particular class. SMOTE has been used to generate numerical data and improve the generalization of predictive models in tasks such as regression and classification [11,12,13]. However, many real-world applications present high-dimensional and heterogeneous data (mixed-type) with numerical and categorical features. SMOTEN, a variant of SMOTE for categorical data has been used in various applications [10], however, the quality of generated synthetic data is not the best [14,15,16].
Recently, generative models based on Artificial Neural Networks (ANNs) have revolutionized the outcomes in multiple knowledge areas due to their outstanding performance for creating synthetic data, particularly in computer vision and image applications [17]. Despite these outcomes, a few strategies have been studied for generating tabular (structured) data. For instance, a variant of the Variational Autoencoder (VAE) called Tabular VAE (TVAE) has been proposed, which uses two ANNs and trains using evidence lower-bound loss with the goal of creating mixed-type data [18]. Also, the techniques based on Generative Adversarial Networks (GANs) emerge as a potential tool for creating synthetic data, frequently enhancing the model’s performance in classification tasks, while also addressing data privacy issues. Although the application of GANs has been validated in different domains [17], they have not been well studied when considering Electronic Health Records (EHRs) with structured and categorical and continuous data [19]. Because tabular data typically contains a mix of categorical and continuous features, generating realistic synthetic data is not an easy task. In this sense, Conditional Tabular GANs (CTGANs) have been created for modeling tabular data distributions and sampling entries from them [18] by employing a conditional generative antagonistic network. Furthermore, in several real-world datasets, CTGAN has outperformed Bayesian approaches [18].
In healthcare applications, class imbalance is a recurrent challenge to build predictive models with a reasonable generalization capacity, because a highly skewed distribution of training data will be prone to force the learning algorithm biased towards the majority class. In particular, we focus our research on Cardiovascular Diseases (CVDs) since it is the most significant cause of death worldwide [20]. Specifically, we analyze data collected by smartphone-based method from a population group in Norway [21]. The dataset comprises a series of survey questions related to socioeconomic factors, alcohol, and drug use, Physical Activity (PA), dietary intake, and one question indicating current/previous non-communicable diseases. Working with categorical features in ML is challenging due to most algorithms work adequately with numerical data, being one-hot encoding one of the most popular approaches to transform categories into numbers [22]. However, this approach generally returns a sparse matrix, increasing the amount of features (dimensions) that the model handles, and the risk of the curse of dimensionality problem [23]. Furthermore, when the feature includes an excessive number of categories, the majority of which are irrelevant for the prediction, this is amplified. To cope with these issues, we applied a target encoding strategy [22]. The goal of this approach to encode the categories by substituting them for a measurement of the impact they may have on the target.
This research aims to perform a comparative study of synthetic categorical data generation methods, with a special focus on GAN-based models. To this end, we have generated new samples with oversampling methods that seek to maintain the same feature categories as the original data, similar probability distribution of attributes, and the dependence between them, thus addressing the problem of data imbalance. All of this enables enhancing the effectiveness and accuracy of the developed classifiers. However, some ML methods use nonlinear transformations, leading to a lack of interpretability and creating black-box models [24]. Interpretation is defined as the process of generating human-understandable explanations of outcomes provided by computational models [24,25]. Several approaches have been proposed for gaining interpretability for improving model understandability and reliability, highlighting model-specific and model-agnostic methods [26]. The former is based on feature weighting, which seeks to identify the contributions of the features that determine the predictions of ML models. Although feature weighting is easy to apply to simple linear models, these models tend to have limited predictive performance and, therefore, have also limited interpretive relevance. The second approach outlined above, the model-agnostic approach, appears to address this limitation, which aims to extract post-hoc explanations by treating the original model as a black box.
Concerning the model interpretability, among the most popular interpretable models, the generalized linear and tree-based models are of great value to interpreting model predictions [27,28]. In this work, two linear models were considered: Least Absolute Shrinkage and Selection Operator (LASSO) [29] and Linear Support Vector Machine (SVM) [30]. The goal was to extract the most relevant features by analyzing the weights of the coefficients of each of the features to give information about their significance for predicting the output class. As a nonlinear model, a Decision Tree (DT) was considered since it provides the importance of each feature [31]. Additionally, the inherent characteristics of various ML models, due to nonlinear transformations in the learning process, make them powerful in terms of predictive performance, but they lack interpretability. In the case of the nonlinear ML classifier such as K-Nearest Neighbors (KNN) [32], we focus on post-hoc interpretability called Shapley Additive Explanations (SHAP) [33], which is founded on game theory and local explanations. Since SHAP provides the contribution of each feature in the model’s output, it can be considered a tool for model interpretability.
We summarize next our main contributions: (i) a comparative of different resampling and neural network generative models, highlighting oversampling techniques, for generating categorical data and their influence in the binary classification performance, and (ii) a methodology to interpret the more representative risk factors/features for identifying CVD subjects by using a dataset composed by sociodemographic, lifestyle and clinical categorical variables.
The remaining article is organized as follows. Section 2 describes the dataset and the pre-processing method. Also, we present the foundations of categorical encoding techniques, and the resampling techniques for addressing the imbalance learning problem. Section 3 shows the experimental setup, classification performance, and model interpretability outcomes of the linear and nonlinear models that were considered. Finally, the discussion and conclusions are presented in Section 4 and Section 5, respectively.
2. Materials and Methods
First, this section presents the dataset description and the pre-processing method. Then, the workflow followed in the paper is introduced, where we present the foundations of categorical encoding techniques and resampling techniques, and highlighting GAN-based models. Finally, we introduce several quality metrics for evaluating the synthetic data generated by oversampling methods.
2.1. Dataset description and pre-processing
Data acquisition was carried out as part of a three-year project conducted by the Norwegian Centre for E-health Research, UiT The Arctic University of Norway, and Healthcom [21]. This study was approved by the Data Protection Section of the University Hospital of North Norway, and all participants signed the corresponding informed consent. The dataset was obtained through a survey questionnaire made to a population from Norway using a smartphone-based solution over a 2-year period [21]. The responses to the survey were anonymized after their submission. The aim was to track modifiable risk factors for four non-communicable diseases: CVD, diabetes, cancer, and chronic respiratory illness. However, during the data acquisition campaign, only individuals affected by CVD (), cancer (), and both CVD and cancer () diseases were collected. Also, 1578 healthy individuals filled out the questionnaire. Due to the low number of individuals with cancer and both diseases, in this work, we only focus on CVD and healthy subjects. In summary, a total of 2043 individuals were included in the subsequent analysis. The dataset consists of 26 features and was organized into five different groups: background, substance use, PA, dietary intake, and income. Questions related to alcohol follow disorders identification test [34], and information about PA was based on International Physical Activity Questionnaire [35]. A summary of the categories associated with each feature is presented in Table 1.
Since all features in our study are categorical, for an exploratory analysis, we follow a one-hot encoding strategy to encode the information of each category in a specific variable by assigning the value of `0’/`1’. To better characterize and visually analyze the prevalence of certain categories compared to others, we built a representation named profile [36], which provides us with information on the possible risk factors associated with a specific disease. The profile is a one-dimensional visual representation, where the x-axis shows all the categories and the y-axis represents the frequency ratio of occurrence of each of the categories for a specific group of individuals. Figure 1 shows the profiles for both healthy and CVD subjects related to the five main groups of variables previously presented.
In Figure 1(a), focusing on the features with the highest frequency of appearance (age), we observe that for CVD subjects, the population aged between 60 and 69 years old predominates. By analyzing sex, we observe that there is a high number of male subjects with CVD, while in the healthy group the frequency of occurrence is higher in women. Regarding BMI, there is a higher frequency of healthy people with a healthy weight (HW) with respect to the CVD group. Finally, if we analyze the high cholesterol, in the group of subjects with CVD, this is clearly linked to the presence of CVD. In Figure 1(b), related to the consumption of harmful substances, we observe that in both groups of individuals, there is no tobacco consumption and, in general, all groups of people report alcohol consumption. However, this alcohol use is usually one or two units per week. Figure 1(c) shows how PA is performed. It has been found that both healthy and CVD subjects engage in severe and moderate PA on average one to two times per week, walk seven days per week, and spend three to five hours per day sitting down. The features related to dietary intake (see Figure 1(d)) show that there is a high number of CVD subjects who never ingest salt compared to the healthy group (who take it occasionally). In none of the groups, individuals drink sugary beverages. As for fruit consumption, there is a higher frequency of one or two pieces per day in both groups. In Figure 1(e), we can observe that healthy individuals have the highest salaries and that two older people live in the home most frequently. In the case of CVD subjects, there is a higher number of people with no minors living in the same house.
2.2. Workflow for predicting cardiovascular diseases
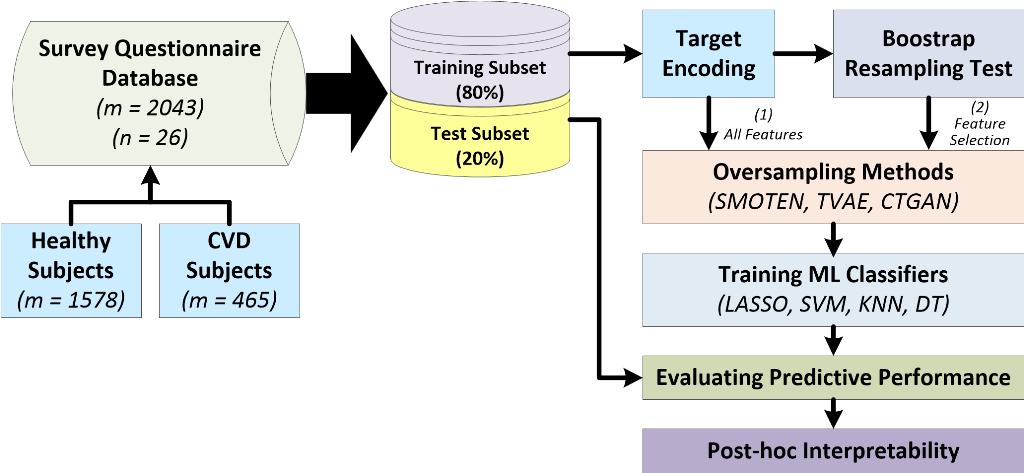
The proposed pipeline for predicting CVD and identifying associated risk factors using ML methods is based on three stages (see Figure 2). First, the target encoding is carried out to transform categorical features into numerical values. Next, we present and evaluate two different approaches: (1) considering all features, and (2) considering a Feature Selection (FS) strategy based on a bootstrap resampling test to identify the most relevant features. Finally, using the training subset, we implement different strategies of undersampling and oversampling methods for data balancing. Then, we train several classifiers with the balanced datasets to predict whether an individual is affected or not by CVD. Finally, using only real data from the test subset that has not been used for training, the performance metrics are evaluated, analyzing also the most important features using post-hoc interpretability models.
2.2.1. Encoding categorical data
Databases with categorical features are widely common in real-world applications and provide relevant information for predictive tasks. A categorical feature is composed of a discrete set of values called categories. In ML, working with categorical features is challenging because most algorithms work adequately with numerical data [22]. To make proper use of the information on these features, a pre-processing stage named encoding is needed, which consists in transforming all the categories of the feature into numerical values. In the literature, several techniques have been proposed to encode categorical data considering target-agnostic or target-based methods [22]. One of the most popular target-agnostic methods is one-hot encoding, which creates arrays of `0’/`1’ based on the presence/absence of a category in the feature [37]. Despite its extensive use, this technique brings two shortcomings [22]. First, the dimension of the input space directly increases with the number of categories in the encoded features, thus substantially augmenting the dimensionality [22]. Second, the new features created are characterized to be sparse.
To overcome the limitations raised by one-hot encoding, a target-based method called target encoding has been proposed by [22]. In this technique, framed within Bayesian encoding techniques, each value of the categorical feature is mapped to a target mean conditional (target’s posterior probability) on the value of the variable [22]. Broadly speaking, the target variable’s mean for each category is computed and the original category is replaced by this value. The target encoding is obtained as follows:
being the computed mean that will replace categorical data, N the number of samples, the estimated mean for each category of a feature taking into account the target, w the smoothing parameter and m the overall mean of the target.
This encoding technique is not affected by the increase of dimensionality, is computationally less demanding, and allows us to work with numerical data [22,38]. Despite these advantages, the main drawback of this technique is that it can be affected by overfitting since the encoding depends on the target [38]. Furthermore, a bias can be introduced in the ML model when categories with few samples are replaced by values close to the desired target feature since the model over-trusts the target encoded feature and makes the model prone to overfitting. To overcome this problem, we apply a regularization-based approach that uses a smoothing parameter w aiming to shrink the effects toward the global mean [22].
2.2.2. Feature selection using bootstrap resampling test
The performance of ML models can be affected by the number of input features [30]. To cope with this problem, FS techniques aim to find a subset of the input features that best describes the underlying structure of the data [39]. In this paper, we used a non-parametric technique called bootstrap resampling to estimate the distribution of a statistic (e.g., the mean) by obtaining samples from a population without replacement [40,41]. To do this, we resampled individuals of both classes 3000 times with the same amount of samples each time (balancing the classes). For each resampling, we determined the mean difference between the populations and the 95% percentile confidence range for each feature [41]. The null hypothesis holds true if ; the alternative hypothesis holds true when (no overlapping of the with the zero value). For further classification analysis, features satisfying will be selected in the set , being .
2.2.3. Resampling techniques for imbalance learning
Most ML algorithms work reasonably well when the number of samples in the different classes is almost equal (balanced dataset) [42]. Nevertheless, in real-world scenarios, it is common that the distribution of samples for each class is skewed. This hampers the application of ML algorithms since the learning process can be monopolized by the representativeness of the samples of the majority class, impacting the generalization and performance of the ML models [42]. To address this, class balancing strategies, which include oversampling, undersampling, and a hybrid approach are used to modify the class distribution of imbalanced datasets [8]. In undersampling, a random number of samples of the majority class is discarded [43], whereas, in oversampling techniques, the aim is to increase the number of samples by randomly creating samples from the minority class. In this latter approach, exact copies of samples in the minority class can be created, and therefore, the generalization capabilities may decrease [10]. In the case of the hybrid strategy, the two approaches that have just been exposed are used. The idea is to balance the number of samples in both classes by first oversampling the minority class and then undersampling the majority class.
In this paper, we compare oversampling methods, using Random Under Sampling (RUS) as a benchmark, based on the quality of the synthetic data created. Among the most common oversampling methods, SMOTE [10] and several variants such as SMOTE nominal (SMOTEN) have been applied in prior works for balancing datasets, improving the performance of predictive models [11,12]. SMOTE algorithm is based on oversampling the minority class by adding random synthetic samples from the minority class [44]. Since SMOTE only deals with continuous features, SMOTEN [10] has been proposed for dealing with categorical features.
This section also presents the two generative neural network models implemented in this work: TVAE [45] and GANs [46]. TVAE is based on VAE, a latent generative model proposed by Kingma and Welling [45], which is composed of two parts: a generative and an inference model. In the generative part, a probabilistic decoder, where given a sample x, produces a distribution over the latent values z. In the inference part, a probabilistic encoder outputs a latent variable z into . The variational lower boundary of the marginal likelihood of the input data is the objective function of VAE. In recent years, VAE has been extensively used in different applications such as image/text classification, anomaly detection or image generation [47]. In order to generate structured/tabular data, the variant proposed in [18] called TVAE is used, allowing to generate mixed-type tabular data.
GANs were proposed by Goodfellow [46] and are generative models composed of two ANNs: (i) A generator G that takes a random vector from a distribution and it projects to a vector ; and (ii) a discriminator D that seeks to differentiate real and synthetic data. The goal of is to generate synthetic data with characteristics that are as close to real data as feasibly possible. and aim to optimize a zero-sum min-max game with the value function as follows:
where and are the distribution of the real data and the G, respectively. and represent the samples from the input and the latent space, and and are the expected log-likelihood from the different outputs of both real and generated samples.
GANs have been used in a variety of applications due to their great performance in generating synthetic data, particularly receiving a lot of interest in the computer vision field due to their ability to generate synthetic images [17]. Although GANs have been extensively applied for generating new images, only a few research studies have proposed these models when dealing with structured data. Among them, CTGAN proposed by [18] has been proposed for generating tabular mixed data (handling both continuous and categorical features). As stated, categorical features present a challenge for GANs since both the generator and the discriminator need to be differentiable. To solve this, the Wasserstein divergence and the weight-clipping with a gradient penalty are used by the CTGAN [18].
2.2.4. Quality metrics for synthetic data
Let us a dataset represented by a matrix, consisting of samples and features, with the i-th sample represented by a vector . is partitioned into training subset and test subset , with 80% and 20% of the samples, respectively. From , we select the samples associated with the data of minority class (real data) and oversampling techniques were used for creating synthetic data . The number of synthetic samples generated directly depends on the IR defined as . With and indicating the number of samples of the minority and the majority class, respectively. and are comprised of the same d columns (features) identified as , which are considered random variables. To obtain the underlying data structure of these random variables, their corresponding probability distributions are estimated. Since our features are categorical, the Probability Mass Function (PMF) is obtained for each feature. Assuming that and are the column-vectors of and for a common feature, we define , as their corresponding PMFs.
The main goal of oversampling techniques is to generate synthetic samples from original data that capture underlying data structure, including the distribution of features and correlations between them. To examine whether the features of the synthetic dataset truly mimic the real features, we use several data quality metrics. To quantify the similarity between a pair of real and synthetic PMFs of and , and for measuring univariate attribute fidelity, we used the symmetric Kullback-Leibler Divergence (KLD) [48] and the Hellinger Distance (HD) [49].
- KLD [48] measures the similarity of the two PMFs, and is computed over a pair of real and synthetic marginal PMFs for a given feature. It is defined as:Note that denotes the nonsymmetric KLD. When both distributions are identical the symmetric KLD is zero, while larger values indicate a larger discrepancy between the two PMFs.
- HD [49] quantifies the similarity between two probability distributions for a specific feature, and it is calculated as:
HD is ranged between 0 and 1, with 0 indicating that the two distributions are practically identical and 1 showing that they are the furthest apart.
To complement the information provided by the aforementioned metrics, we additionally propose two metrics, named Mean Absolute Error Probability (MAEP) and Repeated Sample Vector Rate (RSVR).
- MAEP measures the absolute difference between the PMFs associated with each category of a common feature in and . For a given feature, MAEP is defined as:where is the number of categories for a given feature, and are the common categories of a feature, and and are the probabilities assigned in the corresponding PMF for such category. Note that KLD, HD and MAEP allow assessing univariate attribute fidelity, determining that all marginal distributions of and are properly matching.
- RSVR indicates the rate of repeated sample vectors in the synthetic data , denoting how well the oversampling methods create unique vectors. It is worth noting that this metric is directly related to the number of samples generated, as the IR increases, the likelihood of the onset of repeated vectors is high and consequently, RSVR could augment. It is important to remark that KLD, HD, and MAEP are defined at the feature level, i.e., they are computed for a single feature. To calculate an overall metric, the average value across all features is computed, adding the contribution of each feature.
Furthermore, to evaluate if the oversampling methods capture adequately the relationships between features, the Pairwise Correlation Difference (PCD) [50] and the Log-Cluster Metric (LCM) [51] are considered.
- PCD [50] quantifies the difference, in terms of the Frobennius norm, of the Pearson correlation matrices of and . PCD is defined as:
Small PCD values indicate that is more similar to in terms of linear correlations across the features.
- LCM [51] measures the similarity of the underlying latent structure of and in terms of clustering. This metric relies on two steps. Firstly, and are merged into one single dataset, and then, a cluster analysis using the k-means algorithm [52] is performed on this dataset with a fixed number of clusters k [50]. LCM is defined as follows:being the number of samples in the j-th cluster, the number of samples from the real dataset in the j-th cluster, and (where and are the numbers of real and synthetic samples, respectively) [50]. High values of LCM denote disparities in the cluster memberships, indicating high differences in the distribution of and [50].
2.2.5. ML classifiers and figures of merit
The ML classifiers used in this work were the following: LASSO [29], SVM [30], DT [31] and KNN [32]. To select the best hyperparameters for the classifiers, we considered a k-fold Cross Validation (CV) [30] strategy with the training subset. We follow the 3-fold CV approach, and the sensitivity and the Area Under the Curve (AUC) of the receiver operating characteristic were considered as figures of merit to evaluate the predictive performance of the classifiers. Most evaluation metrics for classification tasks treat all classes as equally important, leading to provide more importance to the majority class in imbalanced problems. The sensitivity measures the impact on the predictive performance of the minority class (binary scenario), while AUC gives us a tradeoff-metric between sensitivity and specificity. The following hyperparameters were tuned: for the LASSO model, C for the SVM model, the maximum tree depth and the minimum number of samples to split a node for DT, and the number of neighbors for KNN. The performance and post-hoc interpretability of the classifiers (LASSO, SVM, DT, KNN) were obtained when considering different resampling techniques (RUS and oversampling techniques (SMOTEN, TVAE, and CTGANs) and different class balancing strategies (only undersampling strategy, only oversampling strategy, and hybrid strategy) using different Imbalance Ratios (IRs).
3. Results
In this section, we analyze the impact of combining different oversampling and ML classifiers in a binary classification scenario for healthy individuals and CVD subjects. The experimental setup, and then the figures of merit obtained are presented, including a comparison of classification performance by using all features and those selected by FS. Finally, post-hoc model interpretability based on the importance of the features is conducted.
3.1. Experimental setup
The dataset was randomly split into training (80%) and test (20%) subsets (see Figure 2), and five independent training and test partitions were considered to further evaluate the performance of the model. The training subset was used for the model design, while the test subset was used to evaluate the model performance (i.e., to evaluate its generalization capacity). Bootstrap resampling was used to remove those features that were non-relevant and uninformative for predicting the target variable. Using this method, features were selected from the initial study features. Before training the classifiers, different values of the smoothing parameter w (between ) were investigated to ensure proper use of the target encoding technique selected, addressing the over-fitting issue raised by target-agnostic approaches. The AUC values were used to select the best w for our dataset. Experimental results showed that lower values of w offer better AUC values, and consequently were more suitable for the binary classification scenario. In this paper, a regularization smoothing parameter of was chosen for subsequent analyses.
3.2. Quality evaluation of synthetic clinical data
Several data quality metrics were considered to evaluate the similarity between synthetic and real data according to different IRs. As stated in Section 2.2.4, the PMFs associated with the different features are estimated as the previous step for computing these metrics. In Figure 3, the PMFs associated with age, BMI, sex, and high cholesterol are depicted. The panels in the first column of the figure show the PMFs of real data, and the remaining represent the PMFs obtained from synthetic data using SMOTEN, TVAE and CTGAN. We aim to measure the similarity of the PMF of real data and those obtained with synthetic data, comparing how well the PMF is learned by the different oversampling methods considered.
Remarkably, the PMFs of data generated with TVAE do not follow the probability distribution of the PMF of real data, showing a lack of probability values in certain categories. For instance, if we look at the age feature (see Figure 3(a)), in the PMF of synthetic data obtained with TVAE (third column), there are categories without probability values, specifically for 18-20, 30-39 and NA. In the same manner, for BMI feature (see Figure 3(b)), the categories HW, NA, OBC-II and OBC-III do not have values. Additionally, in some categories, the probability is much higher than those obtained in real PMF (see OW in BMI feature). TVAE is the method that worst mimics the distribution for the four features considered. This further points out the low performance of TVAE for replicating samples of categorical data. By analyzing SMOTEN, we find similar insights that in TVAE. There are categories in the PMF without values (see panels (a) and (b) associated with age and BMI). Regarding CTGAN, the PMFs obtained in the data generated are quite similar to real ones. All categories have probability values and these are similar to the observed in the real PMF. The insights drawn from these figures allow us to understand how similar are the synthetic and real data in terms of univariate attribute fidelity, being CTGAN which emulates more precisely the real distributions.
The next step is to analyze the data quality metrics considering different IR values (see Figure 4). We observed that in terms of KLD, HD, MAEP, and RSVR (panels (a), (b), (c) and (d), respectively), CTGAN showed the best results. Note that lower values in these metrics indicate more similar distribution probabilities associated with features. Regarding PCD (Figure 4(e)), which measures whether the correlations between features are preserved, CTGAN also reached the highest values compared to SMOTEN and TVAE. For LCM, where the lower values indicate fewer differences in the distribution of and , it was TVAE that reached the optimal values. Note that CTGAN obtained the second one with the lowest values.
Table 2 presents a summary of the quality metrics that analyzes: (i) the similarity between the features of and (KLD, HD, and MAEP) and (ii) the relationships between features captured (PCD and LCM). Note that these metrics were obtained considering and 5 different training partitions, and we present the mean and the standard deviation (std). As previously mentioned, CTGAN more accurately simulated true distributions, achieving the best KLD, HD, and MAEP values. Regarding PCD, which measures how well the correlations between features are captured, CTGAN also reached the best performance (the highest value). It is in LCM where TVAE reached a better performance (lowest values). Therefore, we conclude the potential of CTGAN for generating categorical synthetic data.
3.3. Classification performance
This section presents the classification results provided by linear (LASSO and SVM) and nonlinear (DT and KNN) classifiers using SMOTEN, TVAE, and CTGAN and considering different resampling strategies.
In Figure 5, we show the mean and std of sensitivity and AUC values on 5 test subset partitions and considering different classifiers (LASSO, SVM, DT and KNN) and oversampling strategies. It can be seen that there is a direct relationship between the IR and the model performance in terms of sensitivity and AUC, indicating that the higher the number of synthetic samples generated, the better the performance of ML models. By analyzing Figure 5(a), (c) and (e), it can be observed that the sensitivity values present high variability for the DT model and all oversampling methods. On the contrary, the linear models LASSO and SVM present lower variability (low std), being the most robust classifiers. For small IR values (0.4), the AUC is around 0.6 for all models (see Figure 5 (b), (d) and (f)), achieving better performance when the IR is increased. The highest AUC values are obtained when CTGAN linear models are considered (see Figure 5(f)).
In general, the best figures of merits are obtained when applying linear models and considering SMOTEN and CTGAN techniques. The results obtained for TVAE are slightly different, where higher values are obtained with the nonlinear KNN model than with the linear models, specifically, when IR increases. We can conclude that the best performance is obtained when considering CTGAN and IR=1.0, i.e., when the number of samples of minority and majority classes is the same.
Next, we show in Figure 6, the sensitivity and AUC values when using different classifiers and the hybrid resampling approach. Two main insights can be drawn. Firstly, in general terms and referring to the six panels, it can be observed that the increase in the amount of IR (from 0.5 to 1.0) which refers to the increase in the generation of the number of samples of the minority class, does not impact on the classification measures (neither for sensitivity nor for AUC). For this approach, generating high number of synthetic samples from the minority class and training the ML models with a more substantial number of synthetic data does not imply obtaining better predictive performance. This indicates that after a given percentage of IR, this technique has learned the data distribution, and no matter how many additional samples are added, the distribution remains unchanged. To remark that the predictive performance of the linear models (LASSO and SVM) using SMOTEN and CTGAN, both in terms of sensitivity and AUC is greater than the obtained values using nonlinear models (DT and KNN).
Table 3 summarizes the best sensitivity and AUC values using different resampling methods and class balancing strategies. These results are presented considering all variables () and only using the selected variables () with the bootstrap resampling method. Comparing the figure of merit obtained using all features and only using those selected by the bootstrap resampling method, it is observed that the models using the previously selected features show a slight improvement in the classification performance of most of the models. Mainly, this improvement can be seen when considering TVAE and the hybrid technique (AUC value of 0.66 with all variables versus 0.70 with FS). However, the best performance is obtained when CTGAN and the hybrid strategy are considered for both, with and without FS. Finally, CTGAN provides better performance than when an undersampling approach is considered. This is crucial because it highlights the benefit of this way of creating synthetic samples, which, in addition to producing high-quality synthetic data, also improves the performance of the classifiers compared to the undersampling strategy, which only considers real data.
3.4. Analyzing risk factors using interpretability methods
Figure 7 shows the values of coefficients assigned to each feature when training the linear models with different oversampling methods (SMOTEN, TVAE, and CTGAN), with an oversampling class balancing strategy and an IR ranging from 0.5 to 1.0 (this IR refers to the increase only in the number of samples of the minority class until the number of samples of the majority class is reached).
In Figure 7, we can observe that as the IR goes from 0.5 to 1.0, the values of the coefficients associated with each feature do not change much. As a result, we conclude that the increasing fraction of synthetic samples generated has not much impact on the fact that some features are more relevant to predict CVD. It can also be shown that while dealing with the LASSO model and the DT model for each specific oversampling approach, the coefficient values are similar, with many of them being zero in both models, nullifying the impact of that variable. However, the value of the coefficients fluctuates between positive and negative values for the SVM model (middle panels), with positive values indicating a greater influence of the variable on the prediction of subjects with CVD and negative values indicating a greater influence of the variable on the prediction of healthy individuals.
Note also that the weight (coefficient) assigned to each variable varies depending on the oversampling strategy used. This means that the considered method to generate synthetic samples could influence the features that are deemed most important to decide the final classification. In this sense, when applying SMOTEN and CTGAN, and especially when comparing LASSO and DT, the pattern of the coefficient values is comparable, with age, BMI, high cholesterol, and sex being the most significant factors in predicting CVD. TVAE, on the other hand, exhibits a somewhat different pattern; in this case, while age remains the most important predictor in predicting CVD, it is followed by preprocessed meat, intense activity, and BMI.
We focus now on SHAP, a post-hoc interpretability approach used for noninterpretable ML models. Figure 8 shows the SHAP summary plot when training the nonlinear model KNN with the CTGAN oversampling method, the oversampling class balancing strategy, and . The summary plot provides different information concerning the interpretability of the model. It presents the importance of the features as well as their impact on the prediction. Each point represented in the summary plot is a Shapley value for a specific feature and a specific sample. The position on the x-axis shows the Shapley value assigned to each sample whereas the y-axis shows the relevance of the features in descending order. For our model, we can see how the three most relevant variables in the prediction are the presence of high cholesterol, sex, and age, all of them coinciding with the interpretability results obtained for the linear models. As for the colors, these represent the value of the feature from lowest (blue) to highest (red). Thus, observing the most relevant variables, we can conclude that higher values of cholesterol, sex, and age are related to the prediction of subjects with CVD and lower values of these variables are associated with the prediction of healthy individuals. On the contrary, for example, in the case of the alcohol variable, the opposite occurs since higher values of this variable are relevant in predicting healthy individuals, and lower values are related to predicting subjects with CVD.
4. Discussion
In this work, different resampling methods were used, highlighting the use of CTGANs as an oversampling technique to generate synthetic data for achieving data balance among different classes in a classification problem. In particular, a dataset with real-world data from healthy individuals and individuals with CVD was employed to carry out the synthetic data generation. The results from different metrics for quality assessment of the generated synthetic datasets were analyzed and discussed.
These results demonstrated the high potential of CTGANs for generating categorical data, keeping relevant information, and improving classification performance. The following five findings are particularly important to this study. Firstly, the GAN-based model generates high-quality synthetic data, yielding PMF that was highly close to the PMF of real data. This makes a significant contribution to the literature, demonstrating the potential of GANs in the clinical setting [18]. Secondly, the use of an oversampling strategy, instead of a hybrid technique, improves sensitivity and AUC scores in all ML models, due to the quantity of IR increases. This is an important contribution to the literature since oversampling outperforms undersampling approaches regarding ML classifiers’ performance. Thirdly, it has been demonstrated that linear classifiers outperform nonlinear ones when using target encoding. Fourthly, the combination of the GAN and LASSO-based models yields an AUC value of 71% (an improvement of 2% with respect to other oversampling strategies), improving 1% the results achieved with undersampling. Finally, because of the interpretive capabilities of our models, the findings of this study may help to improve both the prediction and prevention of CVD, and the knowledge of the risk factors related to CVD. The most important risk factors for CVD prediction identified in all models were the presence of high cholesterol, age, BMI, and sex.
These findings are consistent with the primary CVD risk factors identified in the literature [53,54,55]. According to [53], BMI is one of the most critical criteria to consider since excessive adiposity is a significant risk factor for morbidity and death from type 2 diabetes, CVD, and different types of cancer. On the one hand, individuals from high-income countries are more likely to consume healthy foods, according to to [56]. On the other hand, low-income people tend to consume more fat and less fiber, which explains the average importance of characteristics like fish or meat consumption in the prediction of CVD. Furthermore, individuals in low and middle-income countries are more likely to drink alcohol and smoke than socioeconomic groups in high-income countries, which explains the importance of these features to predict CVD, according to [57].
Despite the potential benefits of using clinical data for research, these data are highly sensitive, and their use is restricted by privacy legislation and organizational guidelines [58]. Additionally, patient data are regulated by laws protecting patients’ privacy such as the Health Insurance Portability and Accountability Act in the United States and the General Data Protection Regulation in the European Union [59]. Sharing of public health data has always been hampered by privacy concerns. Furthermore, in the clinical setting, most of the populations studied are commonly unbalanced, with the class of patients with a certain disease typically being smaller than the class of healthy individuals. In this way, synthetic data could allow researchers to delve deeper into complex medical issues, eliminating challenges such as a lack of access to protected data and addressing the issue of class imbalance [42].
Further work will assess the findings achieved in this work by employing several different real-world clinical and nonclinical datasets. Furthermore, the quality of the synthetic data could be assessed by designing specific classifiers able to provide discrimination between real and synthetic data, evaluating in this way the performance of the oversampling techniques. Finally, other FS techniques could be studied in order to confirm the findings of this work related to the most relevant features selected to improve the performance and the interpretability of the ML models.
5. Conclusions
ML methods have become increasingly important for improving the performance of prediction models that could support decision-making. However, although these approaches have been applied in real-world scenarios, the class imbalance problem is a significant drawback in the development and performance of ML models. The main challenge lies in the fact that skewed class distributions hinder the proper learning process. In the clinical setting, most of the populations being studied are undersampled compared to healthy individuals, which limits the application of ML models. Synthetic data allow researchers to gain insights into complicated medical situations, solving these issues, helping to enhance the efficacy of ML models, and allowing a better NCD prediction. Oversampling techniques, especially GAN-based models can solve the imbalance problem. The combination of the GAN-based model and LASSO achieved an AUC value of 71% (up 2 %), outperforming other oversampling strategies and outperforming the match-point method of undersampling strategy. These advances in health informatics could help with clinical decisions, potentially changing the course of a chronic disease or health condition. Finally, the favorable impact of these decisions on cost savings and patient satisfaction would be significant from both clinical and socioeconomic standpoints.
Author Contributions
Conceptualization, I.M.-J. and C.S.-R.; methodology, I.M.-J. and C.S.-R.; software, C.G.-V. and D.C.-M.; validation, I.M.-J., H.F. and C.S.-R.; formal analysis, I.M.-J. and C.S.-R.; investigation, C.G.-V. and D.C.-M.; resources, I.T.G., C.G. and C.S.-R.; data curation, I.T.G. and M.-L.L.; writing—original draft preparation, C.G.-V., D.C.-M., H.F. and C.S.-R.; writing—review and editing, I.M.-J., I.T.G., M.-L.L., C.G. and C.S.-R.; visualization, C.G.-V. and D.C.-M.; supervision, I.M.-J. and C.S.-R.; project administration, C.G. and C.S.-R.; funding acquisition, C.S.-R. All authors have read and agreed to the published version of the manuscript.
Funding
This work has been partly supported by European Commission through the H2020-EU.3.1.4.2., European Project WARIFA (Watching the risk factors: Artificial intelligence and the prevention of chronic conditions) under Grant Agreement 101017385; and by the Spanish Government by the Spanish Grants BigTheory (PID2019-106623RB-C41/AEI/ 10.13039/501100011033), and AAVis-BMR (PID2019-107768RA-I00/AEI/10.13039/501100011033); the Community of Madrid (YEI grant TIC-11649); Project Ref. 2020-661, financed by Rey Juan Carlos University and Community of Madrid; and by the Research Council of Norway (HELSE-EU-project 269882). This work was completed while Himar Fabelo was beneficiary of the FJC2020-043474-I funded by MCIN/AEI/10.13039/501100011033 and by the European Union “NextGenerationEU/PRTR”.
Data Availability Statement
The data can be provided under a reasonable official request.
Conflicts of Interest
All authors declare that they have no known competing financial interests or personal relationships that could have appeared to influence the work reported in this paper.
Abbreviations
The following abbreviations are used in this manuscript:
| AI | Artificial Intelligence |
| CTGAN | Conditional Tabular Generative Adversarial Network |
| CVD | Cardiovascular Disease |
| DT | Decision Tree |
| FS | Feature Selection |
| GAN | Generative Adversarial Network |
| HD | Hellinger Distance |
| IR | Imbalance Ratio |
| KLD | Kullback-Leibler Divergence |
| KNN | K-Nearest Neighbors |
| LASSO | Least Absolute Shrinkage and Selection Operator |
| LCM | Log-Cluster Metric |
| MAEP | Mean Absolute Error Probability |
| ML | Machine Learning |
| PA | Physical Activity |
| PCD | Pairwise Correlation Difference |
| RSVR | Repeated Sample Vector Rate |
| RUS | Random Under Sampling |
| SHAP | Shapley Additive Explanations |
| SMOTE | Synthetic Minority Oversampling Technique |
Abbreviations
| SMOTEN | Synthetic Minority Oversampling Technique Nominal |
| SVM | Support Vector Machine |
| TVAE | Tabular Variational Autoencoder |
References
- Raghupathi, W.; Raghupathi, V. Big data analytics in healthcare: promise and potential. Health Information Science and Systems 2014, 2, 1–10. [Google Scholar] [CrossRef] [PubMed]
- Bengio, Y.; Lecun, Y.; Hinton, G. Deep learning for AI. Communications of the ACM 2021, 64, 58–65. [Google Scholar] [CrossRef]
- LeCun, Y.; Bengio, Y.; Hinton, G. Deep learning. Nature 2015, 521, 436–444. [Google Scholar] [CrossRef]
- Chen, Z.; Lin, T.; Xia, X.; Xu, H.; Ding, S. A synthetic neighborhood generation based ensemble learning for the imbalanced data classification. Applied Intelligence 2018, 48, 2441–2457. [Google Scholar] [CrossRef]
- Ladeira Marques, M.; Moraes Villela, S.; Hasenclever Borges, C.C. Large margin classifiers to generate synthetic data for imbalanced datasets. Applied Intelligence 2020, 50, 3678–3694. [Google Scholar] [CrossRef]
- Liu, R. A novel synthetic minority oversampling technique based on relative and absolute densities for imbalanced classification. Applied Intelligence 2022, 1–18. [Google Scholar] [CrossRef]
- Pérez, J.; Arroba, P.; Moya, J.M. Data augmentation through multivariate scenario forecasting in Data Centers using Generative Adversarial Networks. Applied Intelligence 2022, 1–18. [Google Scholar] [CrossRef]
- Zhu, T.; Luo, C.; Zhang, Z.; Li, J.; Ren, S.; Zeng, Y. Minority oversampling for imbalanced time series classification. Knowledge-Based Systems 2022, 247, 108764. [Google Scholar] [CrossRef]
- Malhotra, R.; Kamal, S. An empirical study to investigate oversampling methods for improving software defect prediction using imbalanced data. Neurocomputing 2019, 343, 120–140. [Google Scholar] [CrossRef]
- Chawla, N.V.; Bowyer, K.W.; Hall, L.O.; Kegelmeyer, W.P. SMOTE: synthetic minority over-sampling technique. Journal of Artificial Intelligence Research 2002, 16, 321–357. [Google Scholar] [CrossRef]
- Fernández, A.; Garcia, S.; Herrera, F.; Chawla, N.V. SMOTE for learning from imbalanced data: progress and challenges, marking the 15-year anniversary. Journal of Artificial Intelligence Research 2018, 61, 863–905. [Google Scholar] [CrossRef]
- Liang, X.; Jiang, A.; Li, T.; Xue, Y.; Wang, G. LR-SMOTE–An improved unbalanced data set oversampling based on K-means and SVM. Knowledge-Based Systems 2020, 196, 105845. [Google Scholar] [CrossRef]
- Taft, L.; Evans, R.S.; Shyu, C.; Egger, M.; Chawla, N.; Mitchell, J.; Thornton, S.N.; Bray, B.; Varner, M. Countering imbalanced datasets to improve adverse drug event predictive models in labor and delivery. Journal of Biomedical Informatics 2009, 42, 356–364. [Google Scholar] [CrossRef] [PubMed]
- Engelmann, J.; Lessmann, S. Conditional Wasserstein GAN-based oversampling of tabular data for imbalanced learning. Expert Systems with Applications 2021, 174, 114582. [Google Scholar] [CrossRef]
- Mukherjee, M.; Khushi, M. SMOTE-ENC: A novel SMOTE-based method to generate synthetic data for nominal and continuous features. Applied System Innovation 2021, 4, 18. [Google Scholar] [CrossRef]
- García-Vicente, C.; Chushig-Muzo, D.; Mora-Jiménez, I.; Fabelo, H.; Gram, I.T.; Løchen, M.L.; Granja, C.; Soguero-Ruiz, C. Clinical Synthetic Data Generation to Predict and Identify Risk Factors for Cardiovascular Diseases. Heterogeneous Data Management, Polystores, and Analytics for Healthcare: VLDB Workshops, Poly 2022 and DMAH 2022, Virtual Event, September 9, 2022, Revised Selected Papers. Springer, 2023, pp. 75–91.
- Gui, J.; Sun, Z.; Wen, Y.; Tao, D.; Ye, J. A review on generative adversarial networks: Algorithms, theory, and applications. IEEE Transactions on Knowledge and Data Engineering 2021. [Google Scholar] [CrossRef]
- Xu, L.; Skoularidou, M.; Cuesta-Infante, A.; Veeramachaneni, K. Modeling tabular data using conditional gan. Advances in Neural Information Processing Systems 2019, 7335–7345. [Google Scholar]
- Choi, E.; Biswal, S.; Malin, B.; Duke, J.; Stewart, W.F.; Sun, J. Generating multi-label discrete patient records using generative adversarial networks. In Proceedings of the Machine Learning for Healthcare Conference, 2017, pp. 286–305.
- Meijers, W.C.; Maglione, M.; Bakker, S.J.; Oberhuber, R.; Kieneker, L.M.; de Jong, S.; Haubner, B.J.; Nagengast, W.B.; Lyon, A.R.; van der Vegt, B.; others. Heart failure stimulates tumor growth by circulating factors. Circulation 2018, 138, 678–691. [Google Scholar] [CrossRef] [PubMed]
- Gram, I.T.; Skeie, G.; Oyeyemi, S.O.; Borch, K.B.; Hopstock, L.A.; Løchen, M.L. A Smartphone-Based Information Communication Technology Solution for Primary Modifiable Risk Factors for Noncommunicable Diseases: Pilot and Feasibility Study in Norway. JMIR Formative Research 2022, 6, e33636. [Google Scholar] [CrossRef]
- Pargent, F.; Pfisterer, F.; Thomas, J.; Bischl, B. Regularized target encoding outperforms traditional methods in supervised machine learning with high cardinality features. Computational Statistics 2022, 1–22. [Google Scholar] [CrossRef]
- Berisha, V.; Krantsevich, C.; Hahn, P.R.; Hahn, S.; Dasarathy, G.; Turaga, P.; Liss, J. Digital medicine and the curse of dimensionality. NPJ Digital Medicine 2021, 4, 153. [Google Scholar] [CrossRef]
- Montavon, G.; Samek, W.; Müller, K.R. Methods for interpreting and understanding deep neural networks. Digital Signal Processing 2018, 73, 1–15. [Google Scholar] [CrossRef]
- Chushig-Muzo, D.; Soguero-Ruiz, C.; de Miguel-Bohoyo, P.; Mora-Jiménez, I. Interpreting clinical latent representations using autoencoders and probabilistic models. Artificial Intelligence in Medicine 2021, 122, 102211. [Google Scholar] [CrossRef]
- Stiglic, G.; Kocbek, P.; Fijacko, N.; Zitnik, M.; Verbert, K.; Cilar, L. Interpretability of machine learning-based prediction models in healthcare. Wiley Interdisciplinary Reviews: Data Mining and Knowledge Discovery 2020, 10, e1379. [Google Scholar] [CrossRef]
- Marchese Robinson, R.L.; Palczewska, A.; Palczewski, J.; Kidley, N. Comparison of the predictive performance and interpretability of random forest and linear models on benchmark data sets. Journal of Chemical Information and Modeling 2017, 57, 1773–1792. [Google Scholar] [CrossRef] [PubMed]
- Carvalho, D.V.; Pereira, E.M.; Cardoso, J.S. Machine learning interpretability: A survey on methods and metrics. Electronics 2019, 8, 832. [Google Scholar] [CrossRef]
- Rao, N.; Nowak, R.; Cox, C.; Rogers, T. Classification with the sparse group lasso. IEEE Transactions on Signal Processing 2015, 64, 448–463. [Google Scholar] [CrossRef]
- Bishop, C.M. Pattern Recognition and Machine Learning; Springer, 2006. [Google Scholar]
- Safavian, S.R.; Landgrebe, D. A survey of decision tree classifier methodology. IEEE Transactions on Systems, Man, and Cybernetics 1991, 21, 660–674. [Google Scholar] [CrossRef]
- Zhang, M.L.; Zhou, Z.H. ML-KNN: A lazy learning approach to multi-label learning. Pattern Recognition 2007, 40, 2038–2048. [Google Scholar] [CrossRef]
- Lundberg, S.M.; Lee, S.I. A unified approach to interpreting model predictions. In Proceedings of the Advances in Neural Information Processing Systems, 2017, pp. 4768––4777.
- Bush, K.; Kivlahan, D.R.; McDonell, M.B.; Fihn, S.D.; Bradley, K.A.; (ACQUIP, A.C.Q.I.P.; others. The AUDIT alcohol consumption questions (AUDIT-C): an effective brief screening test for problem drinking. Archives of Internal Medicine 1998, 158, 1789–1795. [CrossRef]
- Hagströmer, M.; Oja, P.; Sjöström, M. The International Physical Activity Questionnaire (IPAQ): a study of concurrent and construct validity. Public Health Nutrition 2006, 9, 755–762. [Google Scholar] [CrossRef] [PubMed]
- Chushig-Muzo, D.; Soguero-Ruiz, C.; Engelbrecht, A.P.; Bohoyo, P.D.M.; Mora-Jiménez, I. Data-driven visual characterization of patient health-status using electronic health records and self-organizing maps. IEEE Access 2020, 8, 137019–137031. [Google Scholar] [CrossRef]
- Cerda, P.; Varoquaux, G.; Kégl, B. Similarity encoding for learning with dirty categorical variables. Machine Learning 2018, 107, 1477–1494. [Google Scholar] [CrossRef]
- Micci-Barreca, D. A preprocessing scheme for high-cardinality categorical attributes in classification and prediction problems. ACM SIGKDD Explorations Newsletter 2001, 3, 27–32. [Google Scholar] [CrossRef]
- Cai, J.; Luo, J.; Wang, S.; Yang, S. Feature selection in machine learning: A new perspective. Neurocomputing 2018, 300, 70–79. [Google Scholar]
- Mora-Jiménez, Inmaculada and Tarancón-Rey, Jorge and Álvarez-Rodríguez, Joaquín and Soguero-Ruiz, Cristina. Artificial Intelligence to Get Insights of Multi-Drug Resistance Risk Factors during the First 48 Hours from ICU Admission. Antibiotics 2021, 10, 239.
- Martínez-Agüero, S.; Soguero-Ruiz, C.; Alonso-Moral, J.M.; Mora-Jiménez, I.; Álvarez Rodríguez, J.; Marques, A.G. Interpretable clinical time-series modeling with intelligent feature selection for early prediction of antimicrobial multidrug resistance. Future Generation Computer Systems 2022, 133, 68–83. [Google Scholar] [CrossRef]
- Haixiang, G.; Yijing, L.; Shang, J.; Mingyun, G.; Yuanyue, H.; Bing, G. Learning from class-imbalanced data: Review of methods and applications. Expert Systems with Applications 2017, 73, 220–239. [Google Scholar] [CrossRef]
- Liu, X.Y.; Wu, J.; Zhou, Z.H. Exploratory undersampling for class-imbalance learning. IEEE Transactions on Systems, Man, and Cybernetics, Part B (Cybernetics) 2008, 39, 539–550. [Google Scholar]
- Elreedy, D.; Atiya, A.F. A comprehensive analysis of synthetic minority oversampling technique (SMOTE) for handling class imbalance. Information Sciences 2019, 505, 32–64. [Google Scholar] [CrossRef]
- Kingma, D.P.; Welling, M. Auto-Encoding Variational Bayes. In Proceedings of the International Conference on Learning Representations (ICLR), 2014.
- Goodfellow, I.; Pouget-Abadie, J.; Mirza, M.; Xu, B.; Warde-Farley, D.; Ozair, S.; Courville, A.; Bengio, Y. Generative adversarial nets. Advances in Neural Information Processing Systems 2014, 27, 2672–2680. [Google Scholar]
- Zavrak, S.; İskefiyeli, M. Anomaly-based intrusion detection from network flow features using variational autoencoder. IEEE Access 2020, 8, 108346–108358. [Google Scholar] [CrossRef]
- Kullback, S.; Leibler, R.A. On information and sufficiency. The Annals of Mathematical Statistics 1951, 22, 79–86. [Google Scholar] [CrossRef]
- Le Cam, L.; LeCam, L.M.; Yang, G.L. Asymptotics in statistics: some basic concepts; Springer Science & Business Media, 2000. [Google Scholar]
- Goncalves, A.; Ray, P.; Soper, B.; Stevens, J.; Coyle, L.; Sales, A.P. Generation and evaluation of synthetic patient data. BMC Medical Research Methodology 2020, 20, 1–40. [Google Scholar] [CrossRef] [PubMed]
- Woo, M.J.; Reiter, J.P.; Oganian, A.; Karr, A.F. Global measures of data utility for microdata masked for disclosure limitation. Journal of Privacy and Confidentiality 2009, 1, 111–224. [Google Scholar] [CrossRef]
- MacQueen, J.; others. Some methods for classification and analysis of multivariate observations. In Proceedings of the fifth Berkeley symposium on mathematical statistics and probability, Oakland, CA, USA, 1967; 1, pp. 281–297.
- Malik, V.S.; Willett, W.C.; Hu, F.B. Global obesity: trends, risk factors and policy implications. Nature Reviews Endocrinology 2013, 9, 13–27. [Google Scholar] [CrossRef] [PubMed]
- Dahlöf, B. Cardiovascular disease risk factors: epidemiology and risk assessment. The American Journal of Cardiology 2010, 105, 3A–9A. [Google Scholar] [CrossRef] [PubMed]
- Wagner, K.H.; Brath, H. A global view on the development of non communicable diseases. Preventive Medicine 2012, 54, S38–S41. [Google Scholar] [CrossRef] [PubMed]
- Mayen, A.L.; Marques-Vidal, P.; Paccaud, F.; Bovet, P.; Stringhini, S. Socioeconomic determinants of dietary patterns in low-and middle-income countries: a systematic review. The American Journal of Clinical Nutrition 2014, 100, 1520–1531. [Google Scholar] [CrossRef]
- Marmot, M.; Bell, R. Social determinants and non-communicable diseases: time for integrated action. Bmj 2019, 364. [Google Scholar] [CrossRef]
- Benaim, A.R.; Almog, R.; Gorelik, Y.; Hochberg, I.; Nassar, L.; Mashiach, T.; Khamaisi, M.; Lurie, Y.; Azzam, Z.S.; Khoury, J.; others. Analyzing Medical Research Results Based on Synthetic Data and Their Relation to Real Data Results: Systematic Comparison From Five Observational Studies. JMIR Medical Informatics 2020, 8, e16492. [Google Scholar] [CrossRef] [PubMed]
- Yale, A.; Dash, S.; Dutta, R.; Guyon, I.; Pavao, A.; Bennett, K.P. Generation and evaluation of privacy preserving synthetic health data. Neurocomputing 2020, 416, 244–255. [Google Scholar] [CrossRef]
Figure 1.
Profiles for healthy and CVD individuals considering: (a) background; (b) substance use; (c) PA; (d) dietary intake; and (e) income features.
Figure 1.
Profiles for healthy and CVD individuals considering: (a) background; (b) substance use; (c) PA; (d) dietary intake; and (e) income features.
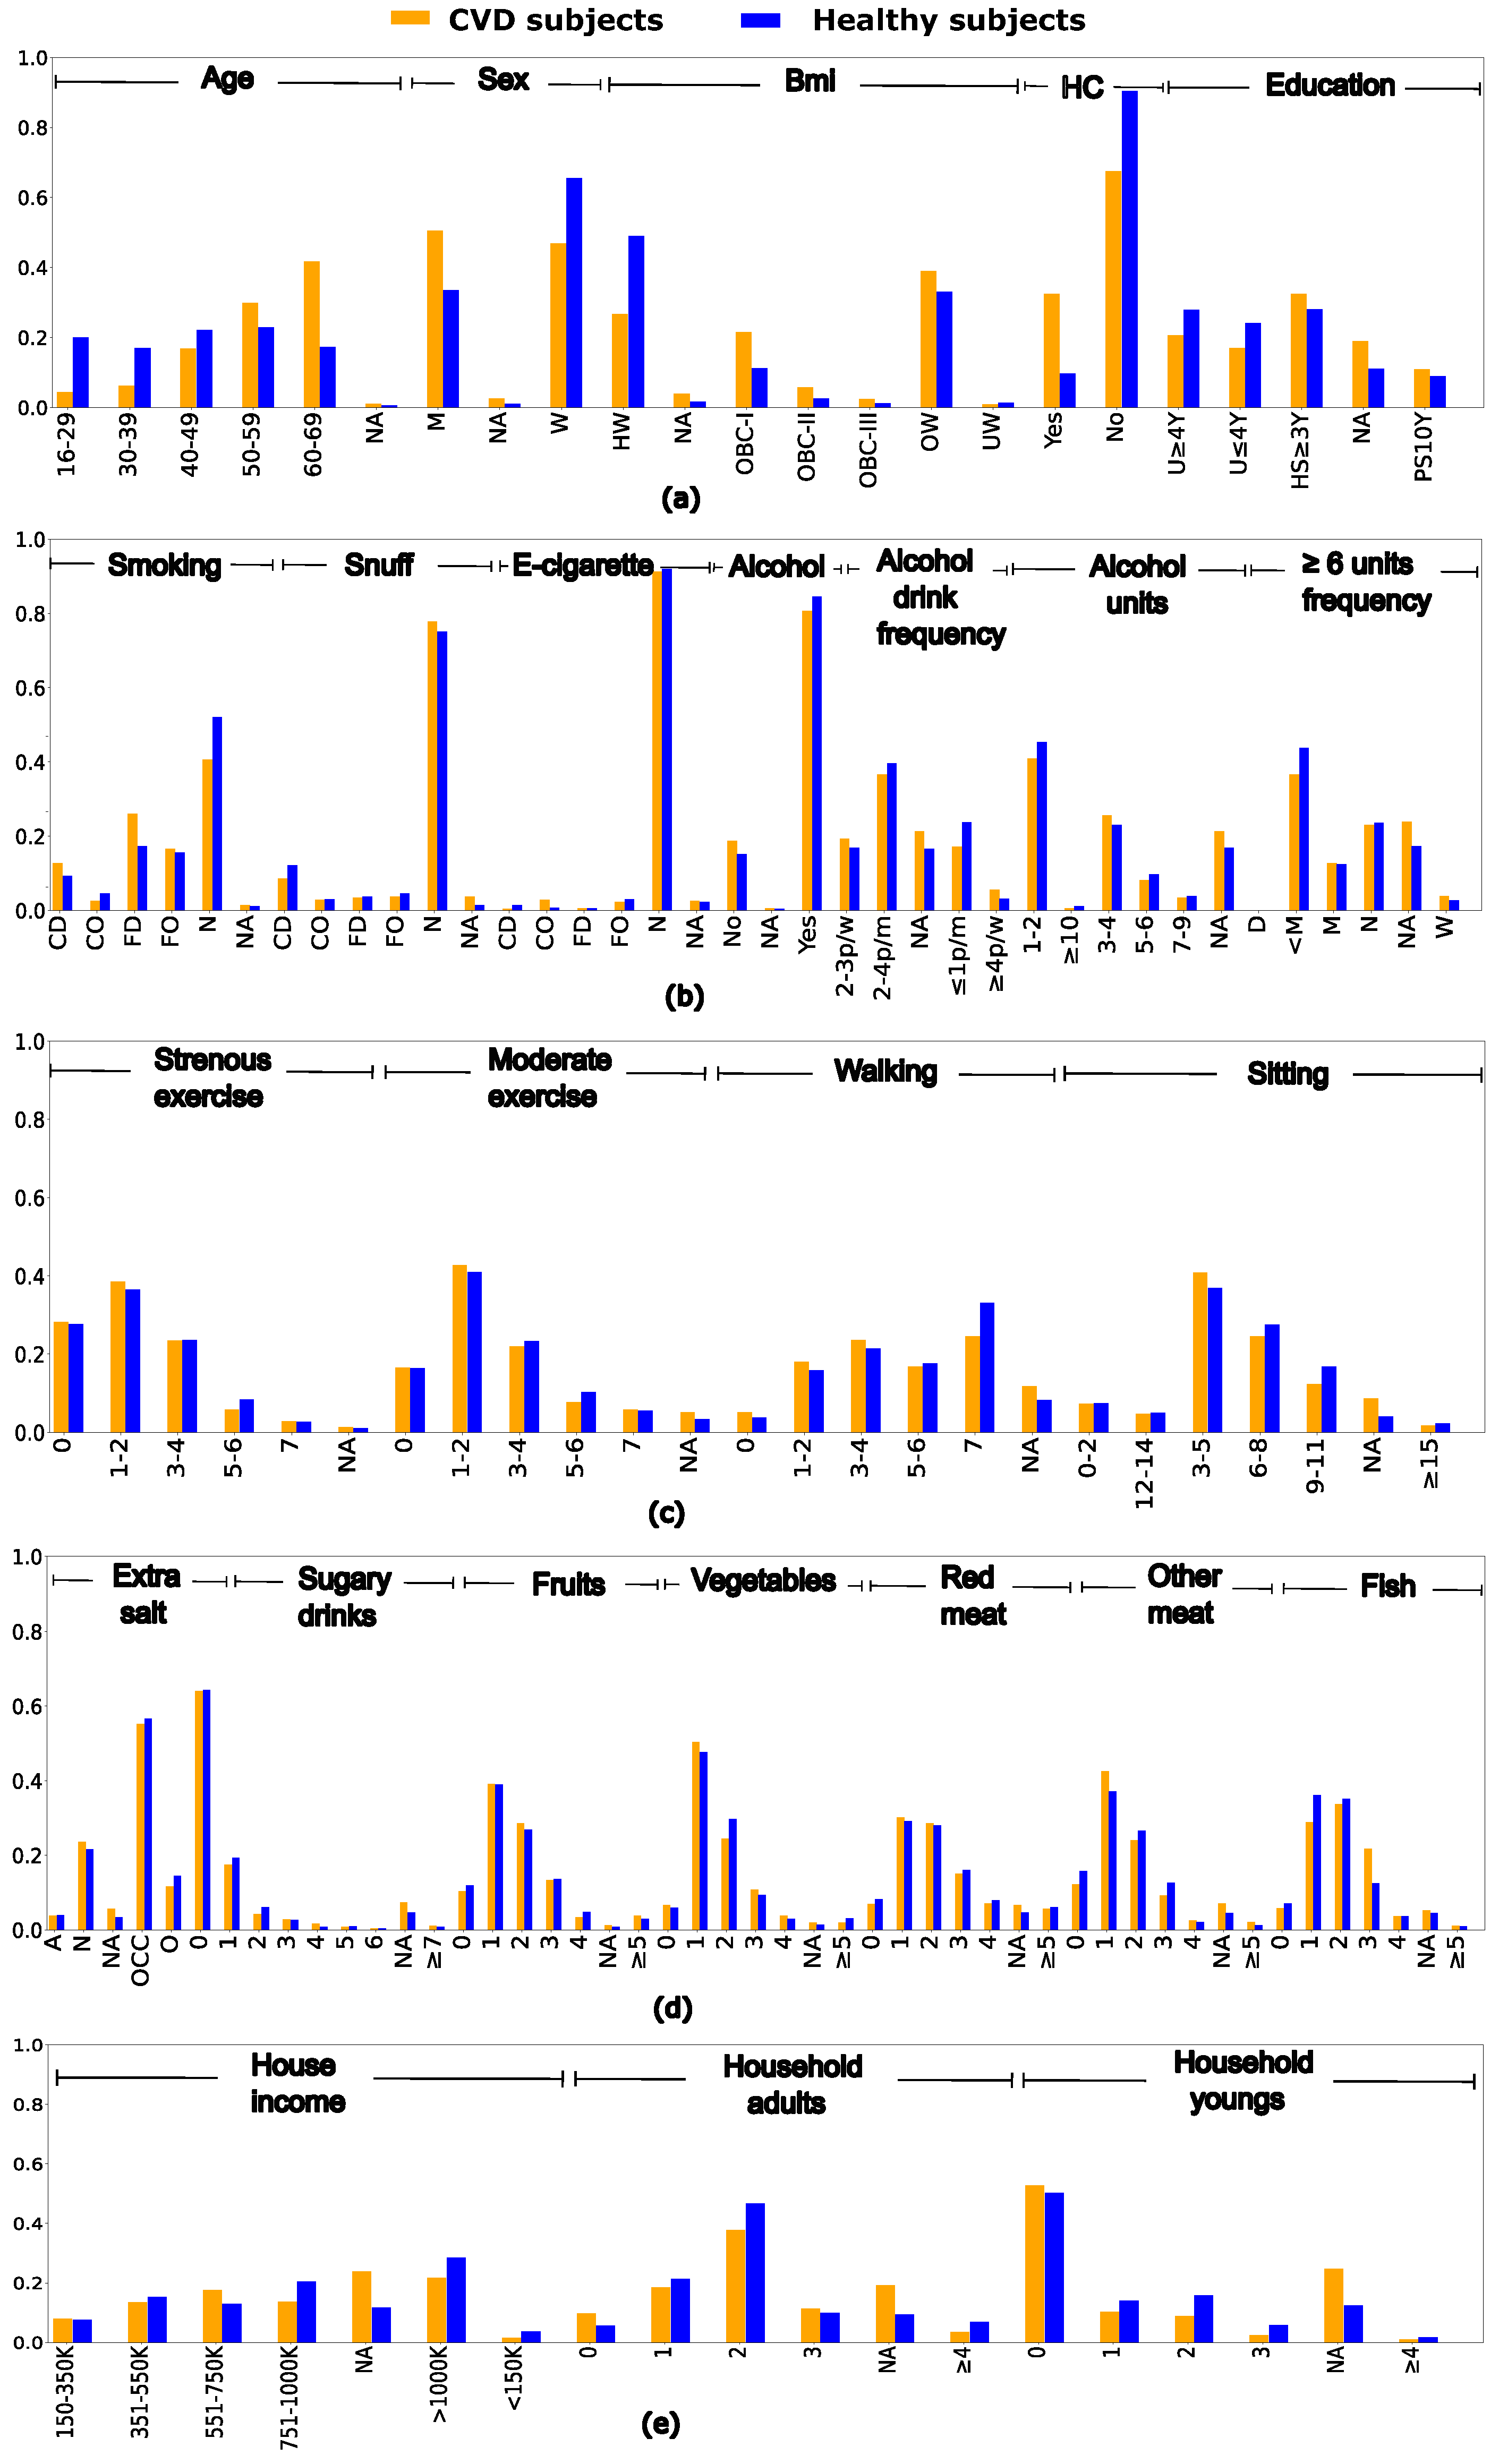
Figure 2.
Proposed workflow using oversampling techniques (SMOTEN, TVAE, CTGAN) and different ML classifiers.
Figure 2.
Proposed workflow using oversampling techniques (SMOTEN, TVAE, CTGAN) and different ML classifiers.
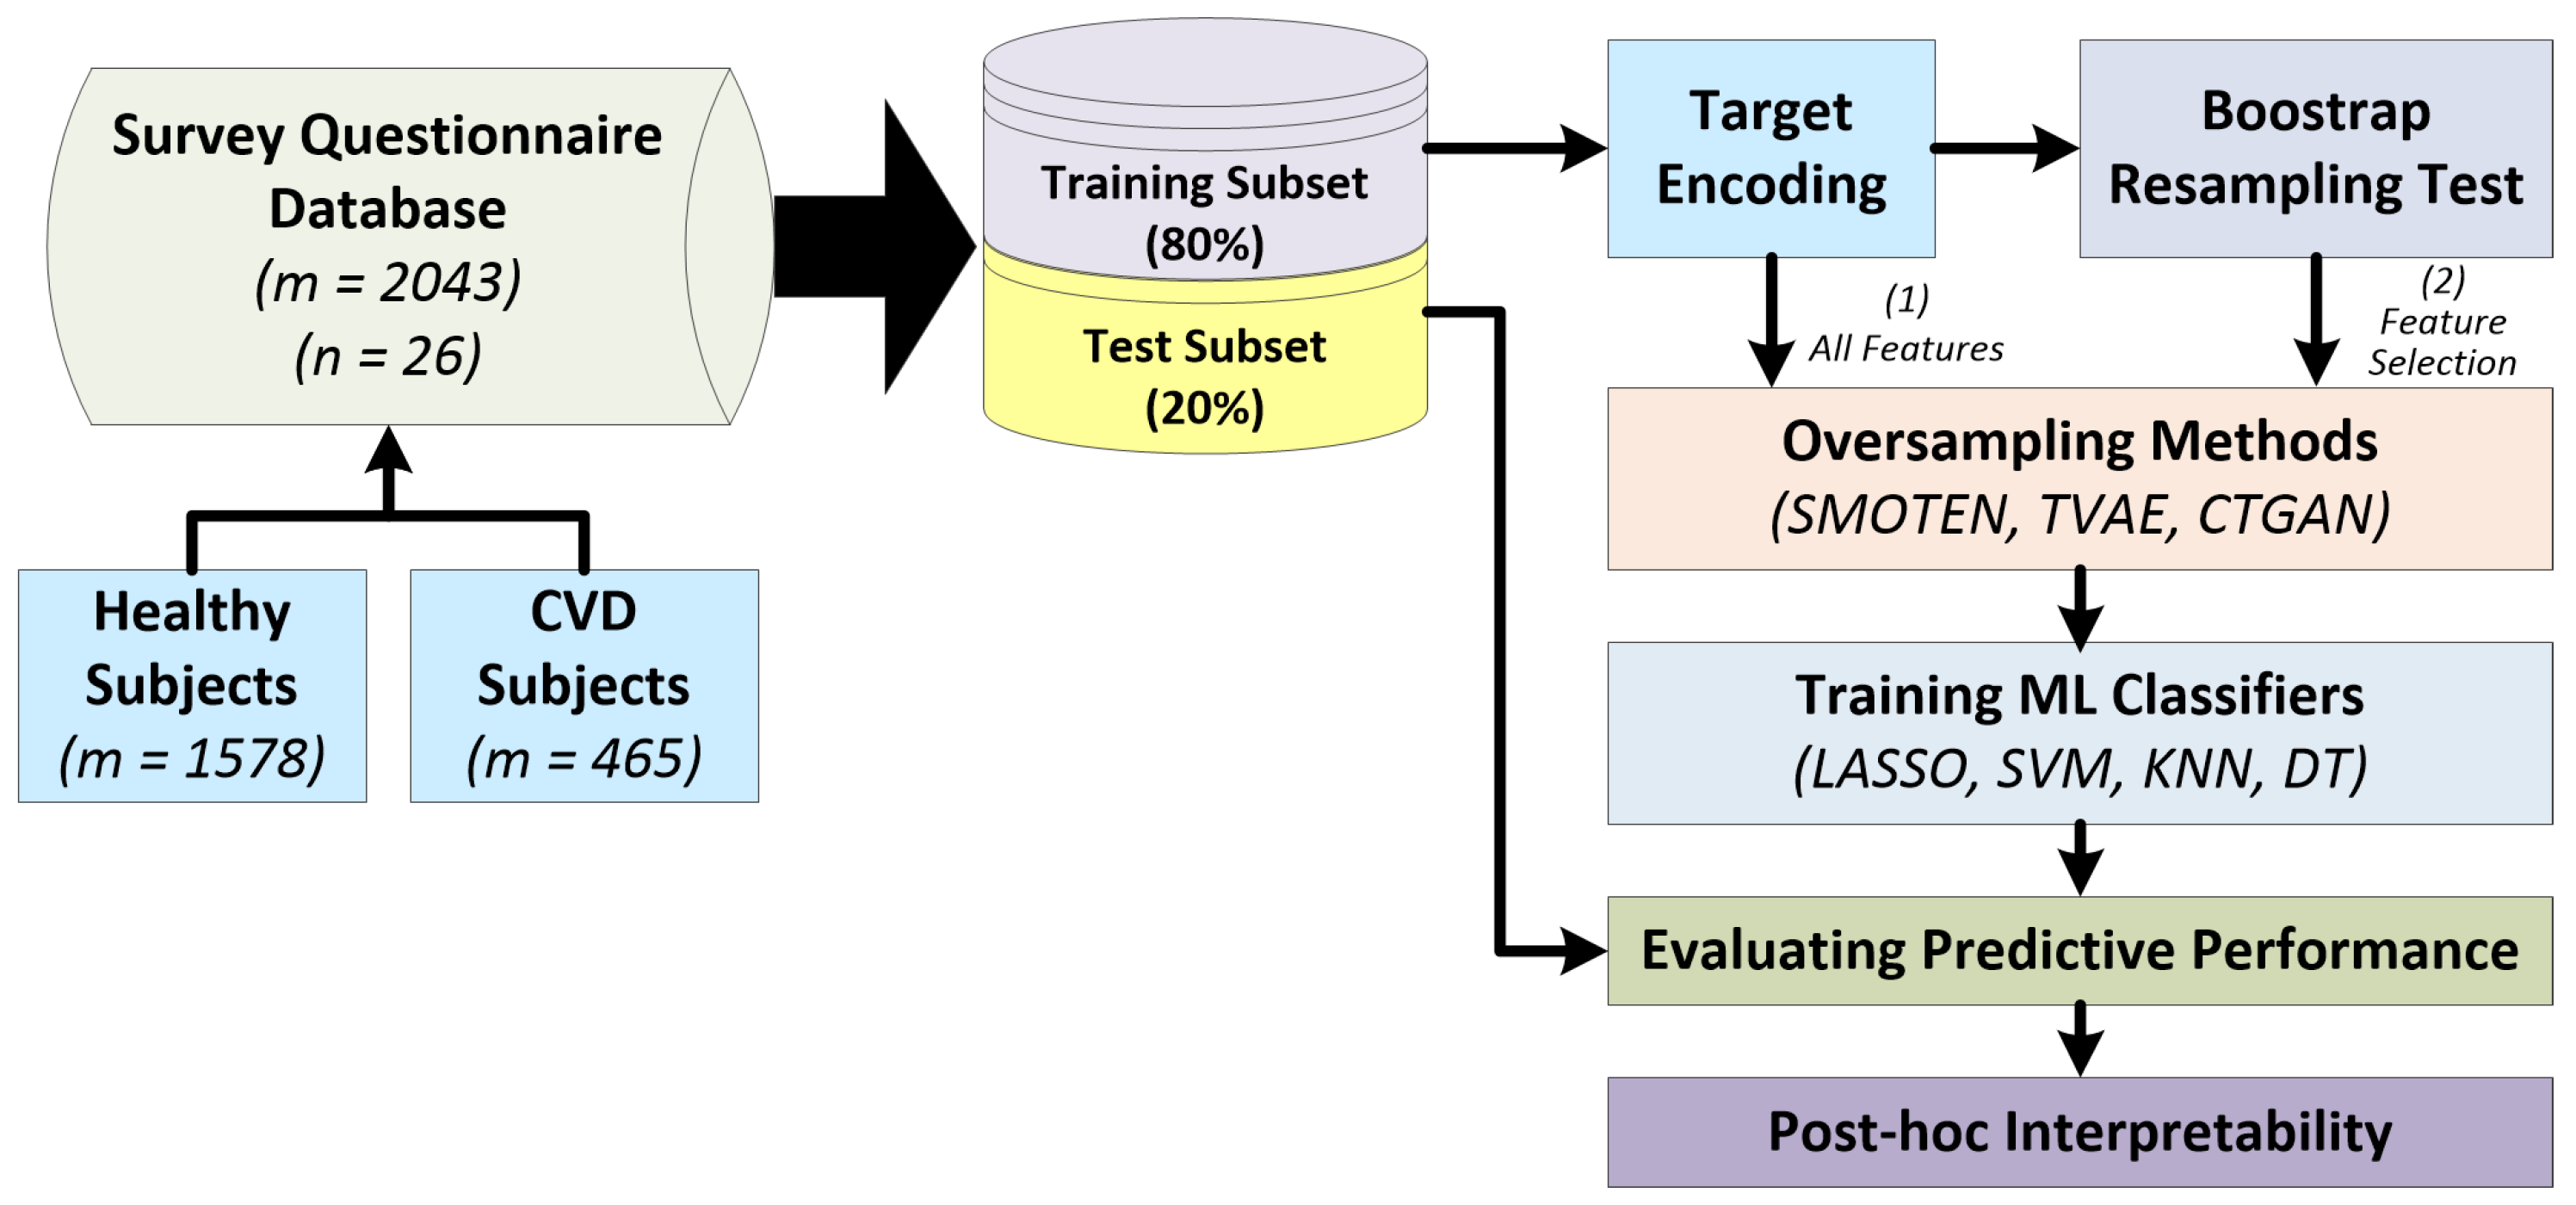
Figure 3.
PMFs associated with: (a) age; (b) BMI; (c) sex; and (d) high cholesterol. PMF obtained with real data (first column); SMOTEN (second column); TVAE (third column); and CTGAN (fourth column).
Figure 3.
PMFs associated with: (a) age; (b) BMI; (c) sex; and (d) high cholesterol. PMF obtained with real data (first column); SMOTEN (second column); TVAE (third column); and CTGAN (fourth column).
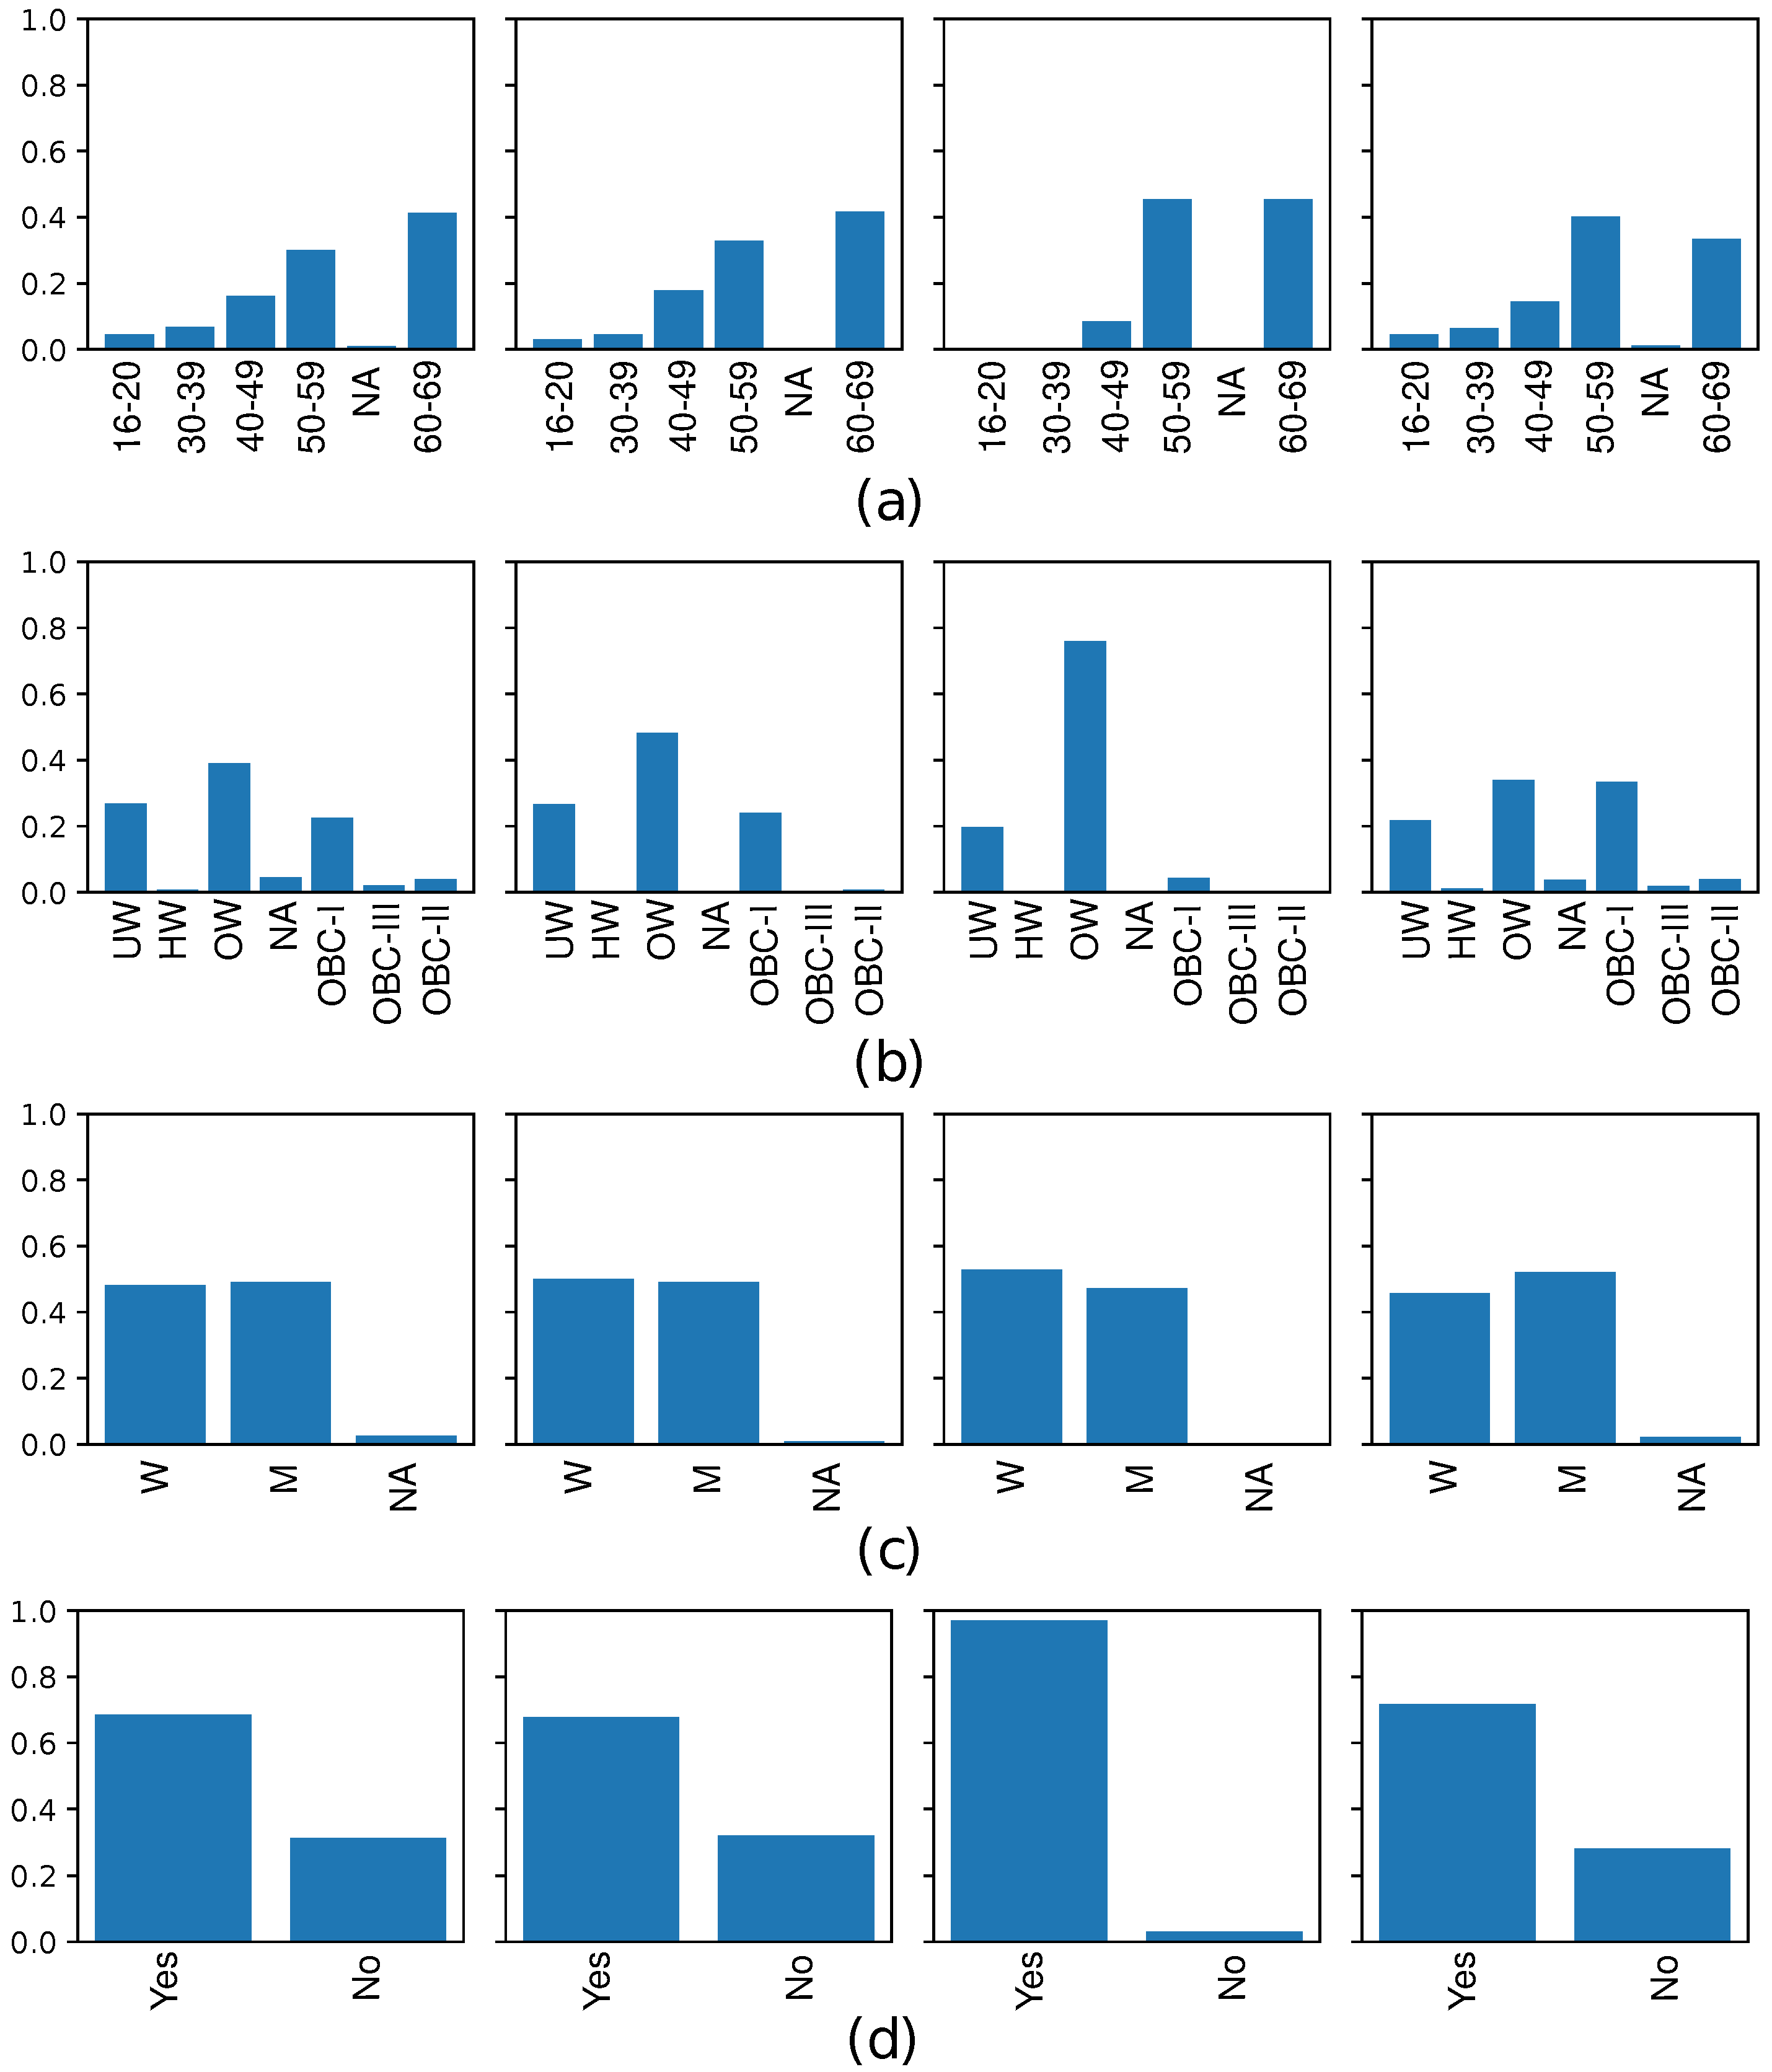
Figure 4.
Mean±std for the synthetic data quality metrics when considering different IR and oversampling techniques. (a) KLD; (b) HD; (c) MAEP; (d) RSVR; (e) PCD; (f) LCM.
Figure 4.
Mean±std for the synthetic data quality metrics when considering different IR and oversampling techniques. (a) KLD; (b) HD; (c) MAEP; (d) RSVR; (e) PCD; (f) LCM.
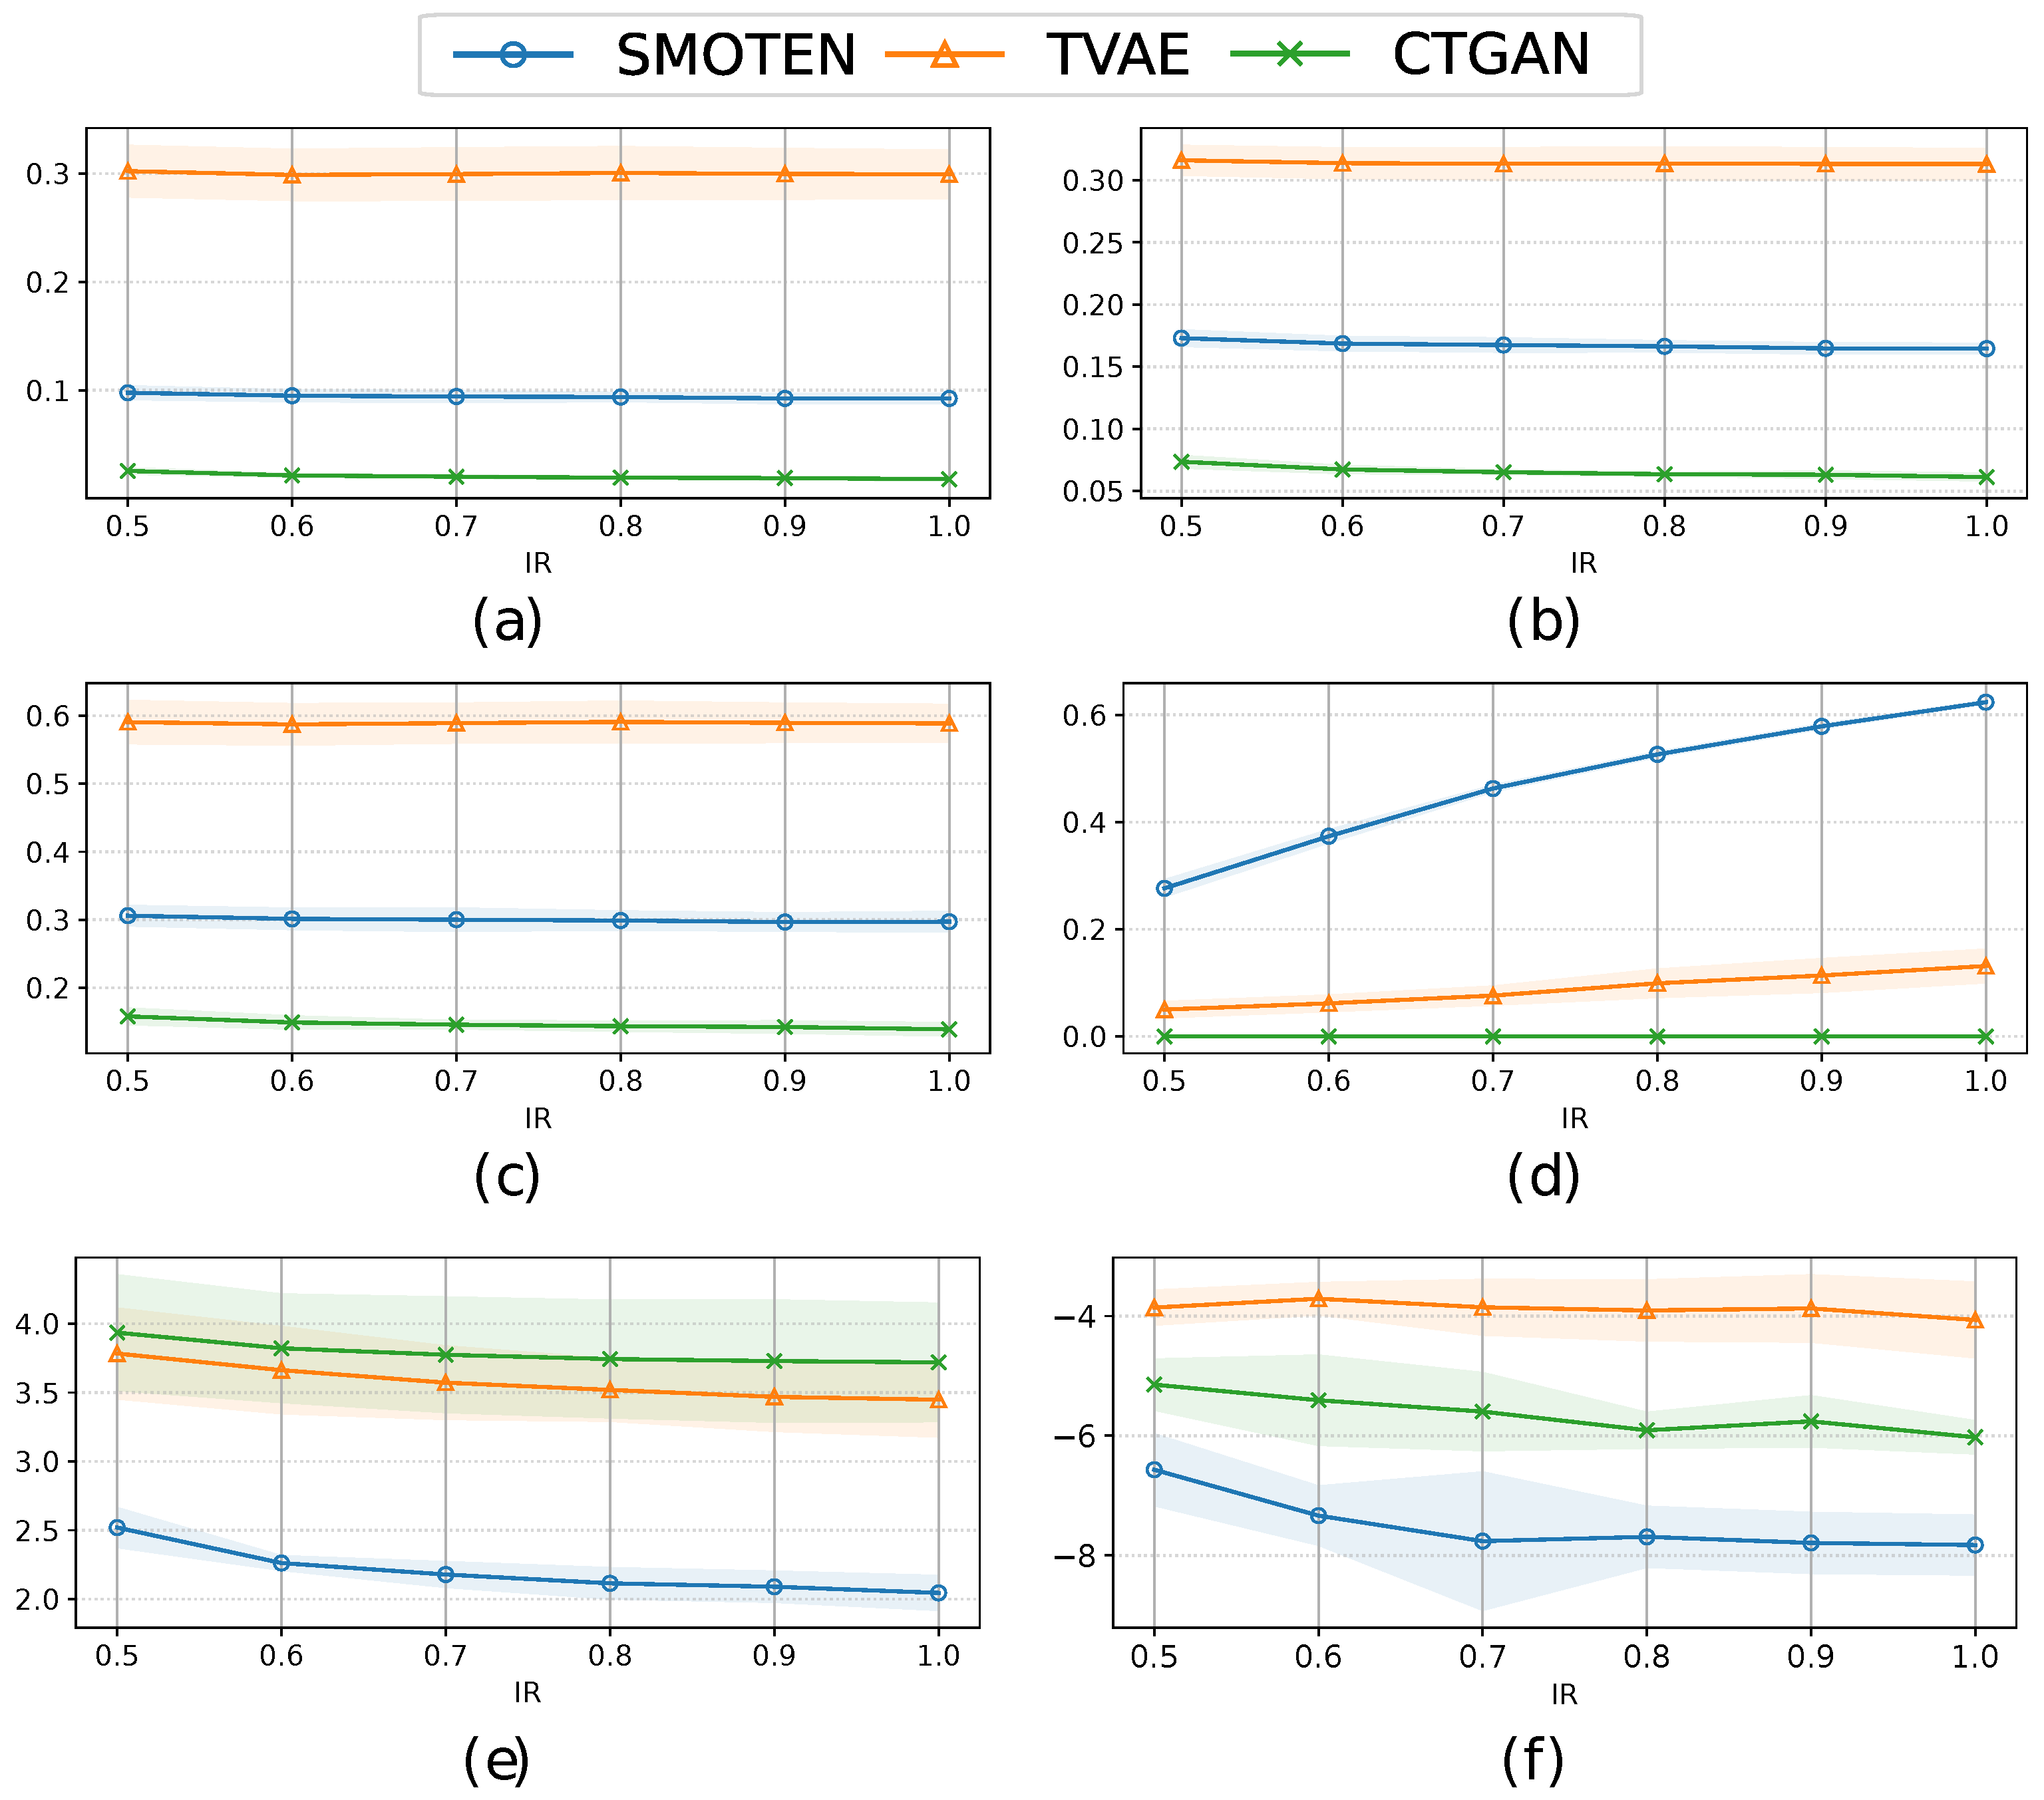
Figure 5.
Mean±std of the sensitivity (left panels) and AUC (right panels) considering 5 test subset partitions and different IRs, classifiers (LASSO, SVM, DT and KNN) and an oversampling approach with: (a,b) SMOTEN; (c,d) TVAE; and (e,f) CTGAN.
Figure 5.
Mean±std of the sensitivity (left panels) and AUC (right panels) considering 5 test subset partitions and different IRs, classifiers (LASSO, SVM, DT and KNN) and an oversampling approach with: (a,b) SMOTEN; (c,d) TVAE; and (e,f) CTGAN.
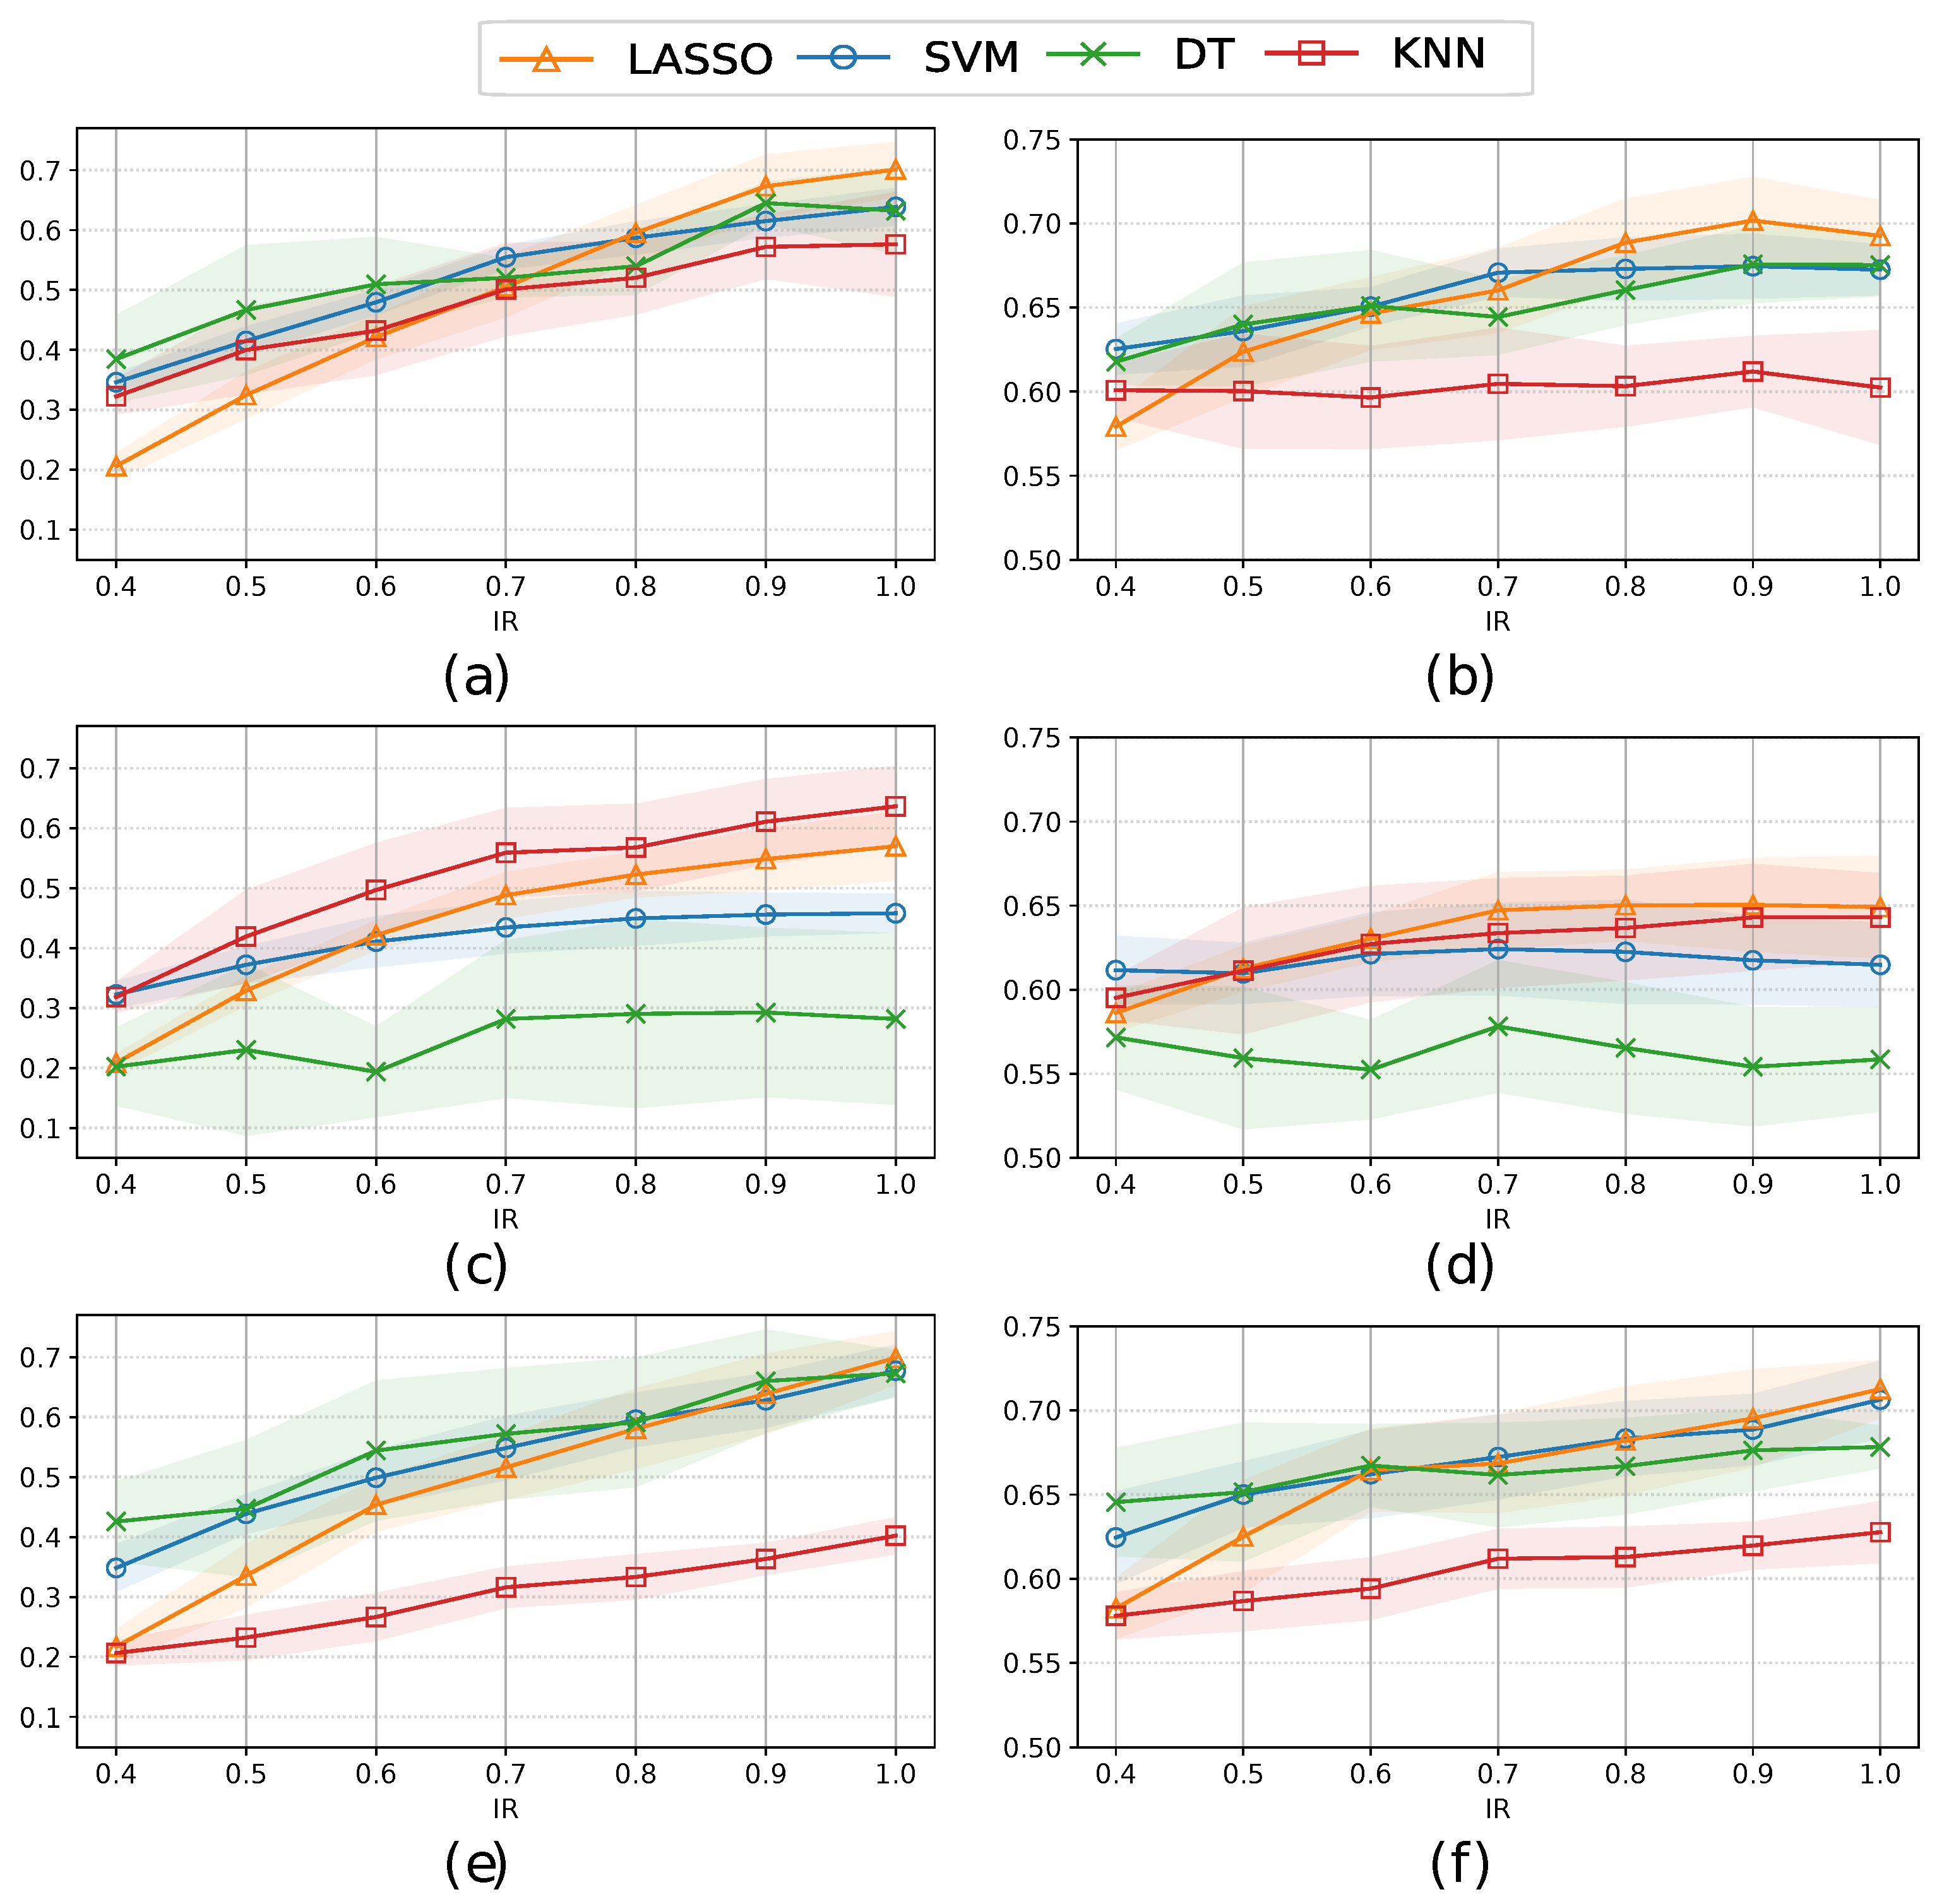
Figure 6.
Mean±std of the sensitivity (left panels) and AUC (right panels) considering 5 test subset partitions and different IRs, classifiers, and a hybrid approach (by combining undersampling and oversampling strategies) with: (a,b) SMOTEN; (c,d) TVAE; and (e,f) CTGAN.
Figure 6.
Mean±std of the sensitivity (left panels) and AUC (right panels) considering 5 test subset partitions and different IRs, classifiers, and a hybrid approach (by combining undersampling and oversampling strategies) with: (a,b) SMOTEN; (c,d) TVAE; and (e,f) CTGAN.
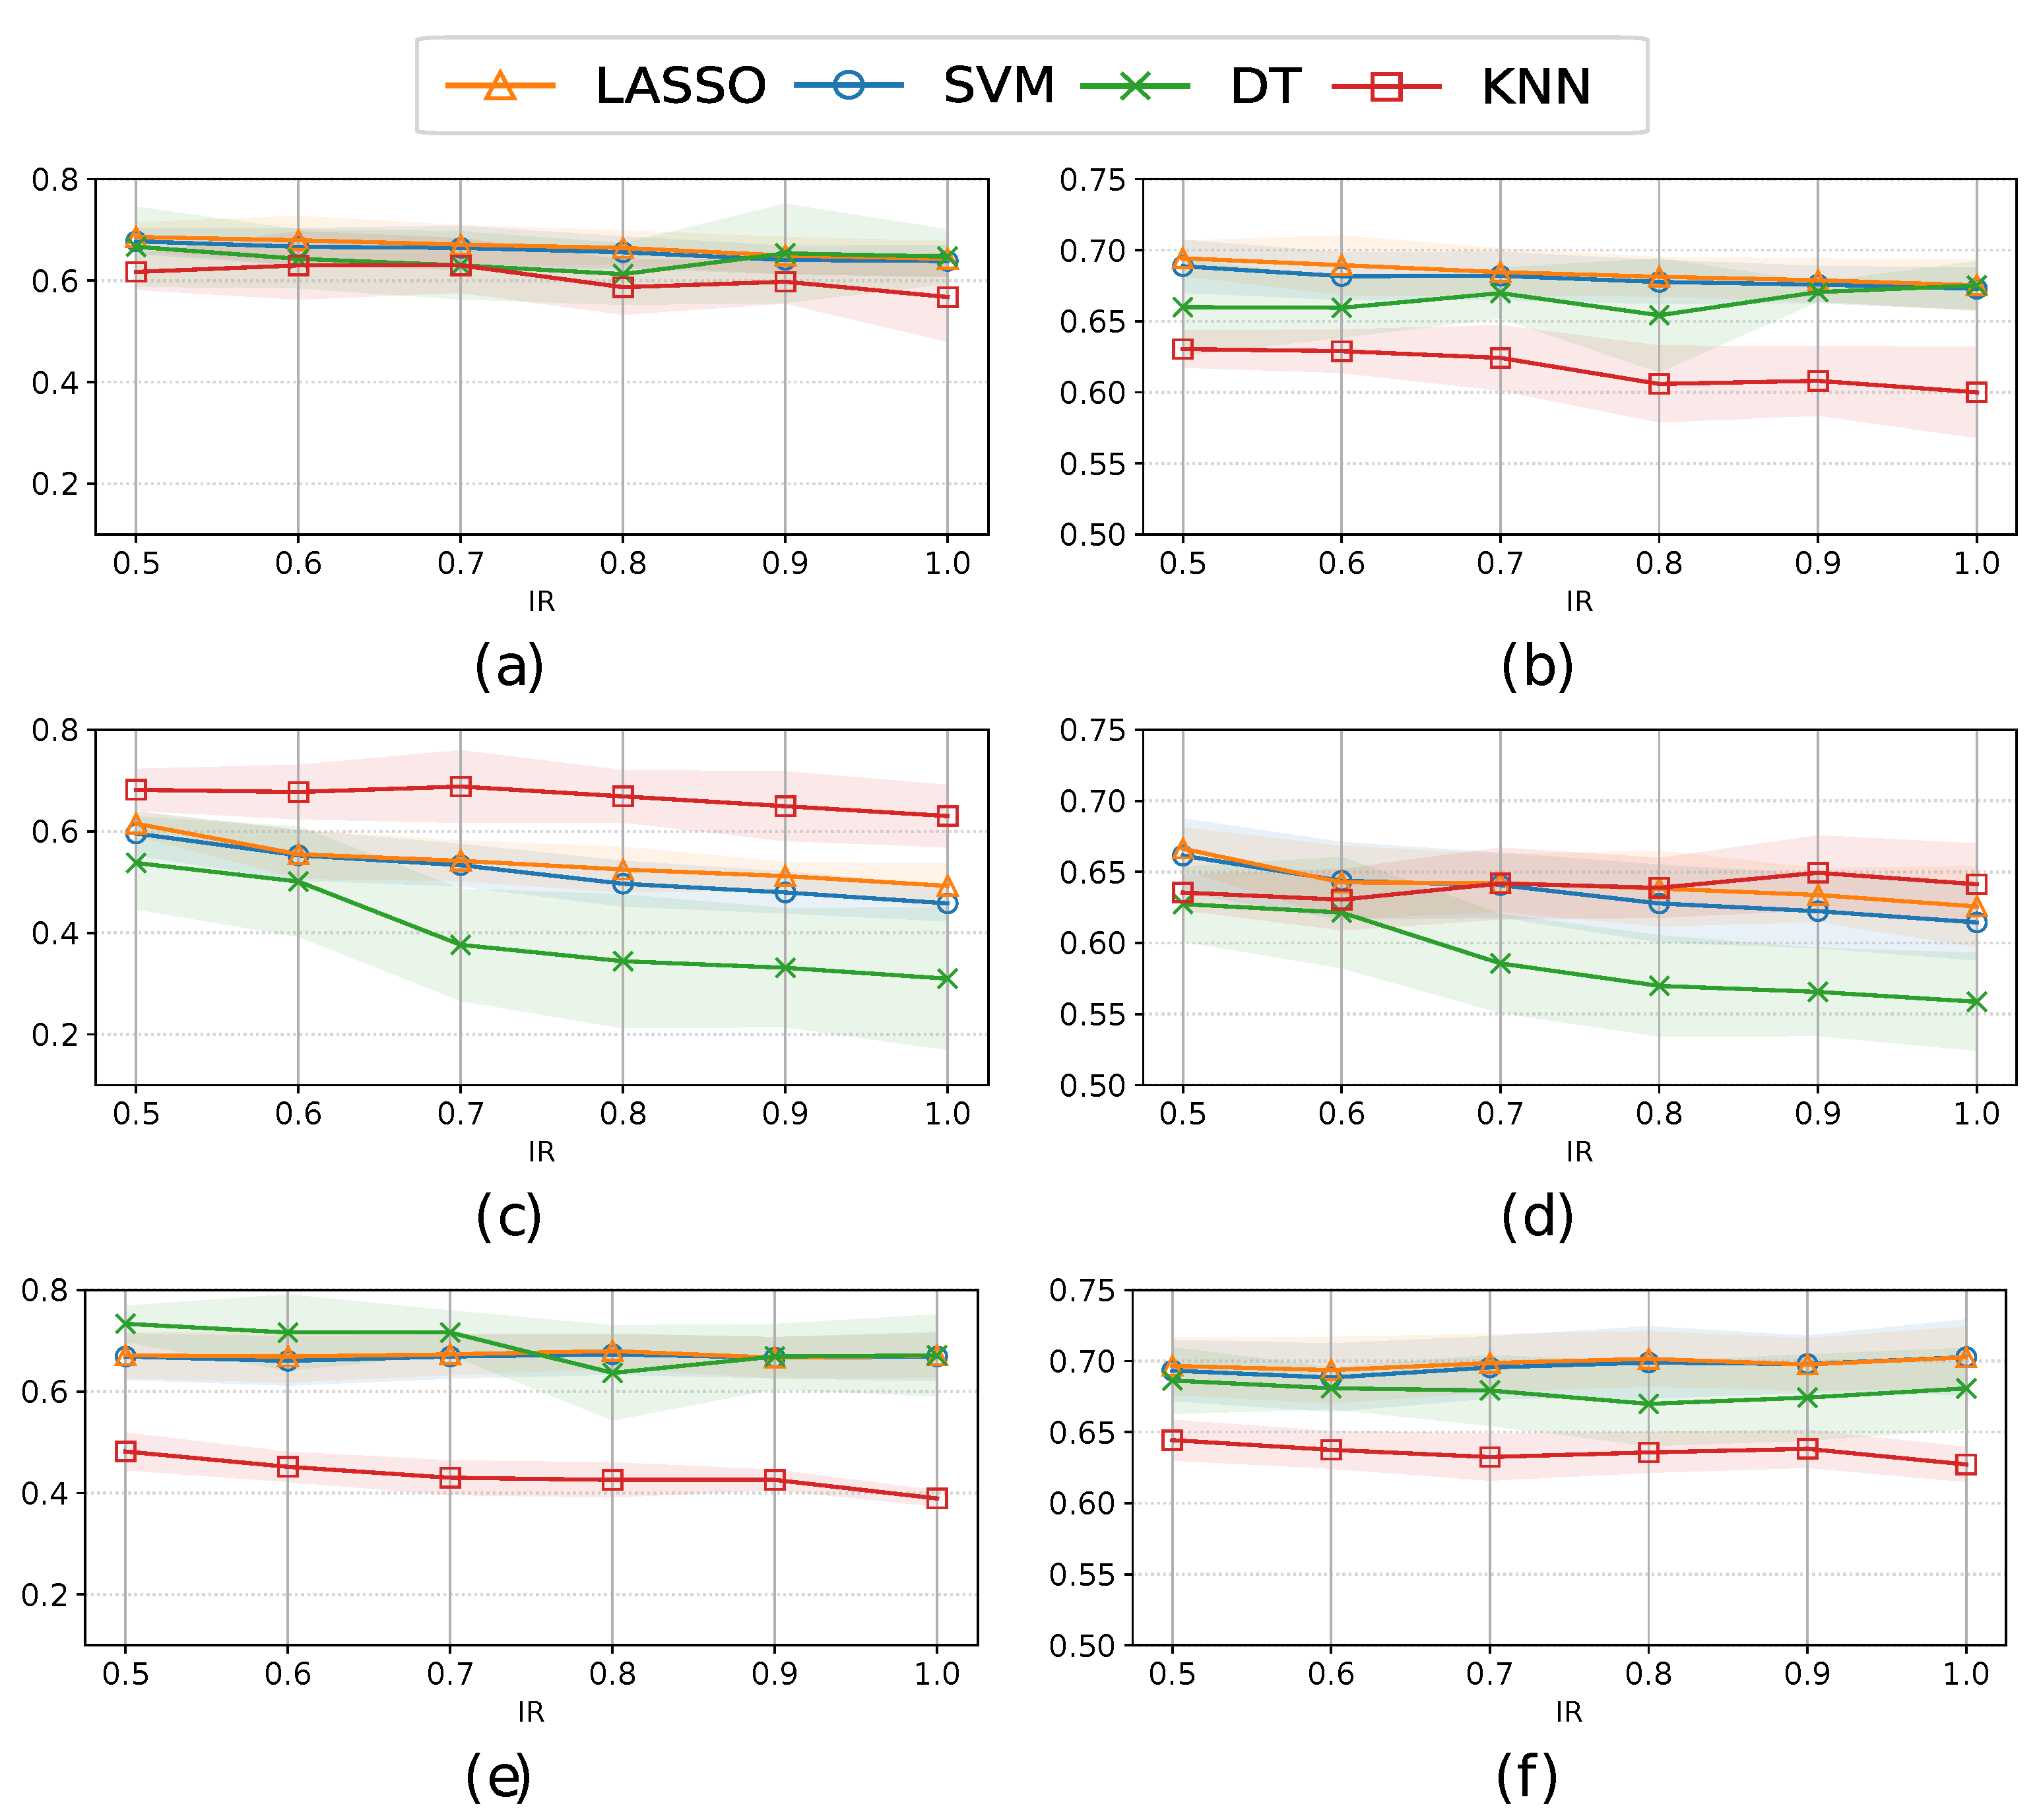
Figure 7.
Coefficient values for different IR when using LASSO (left panels), SVM (middle panels), and DT (right panels) and the oversampling methods: SMOTEN (first row); TVAE (second row); and CTGAN (third row).
Figure 7.
Coefficient values for different IR when using LASSO (left panels), SVM (middle panels), and DT (right panels) and the oversampling methods: SMOTEN (first row); TVAE (second row); and CTGAN (third row).
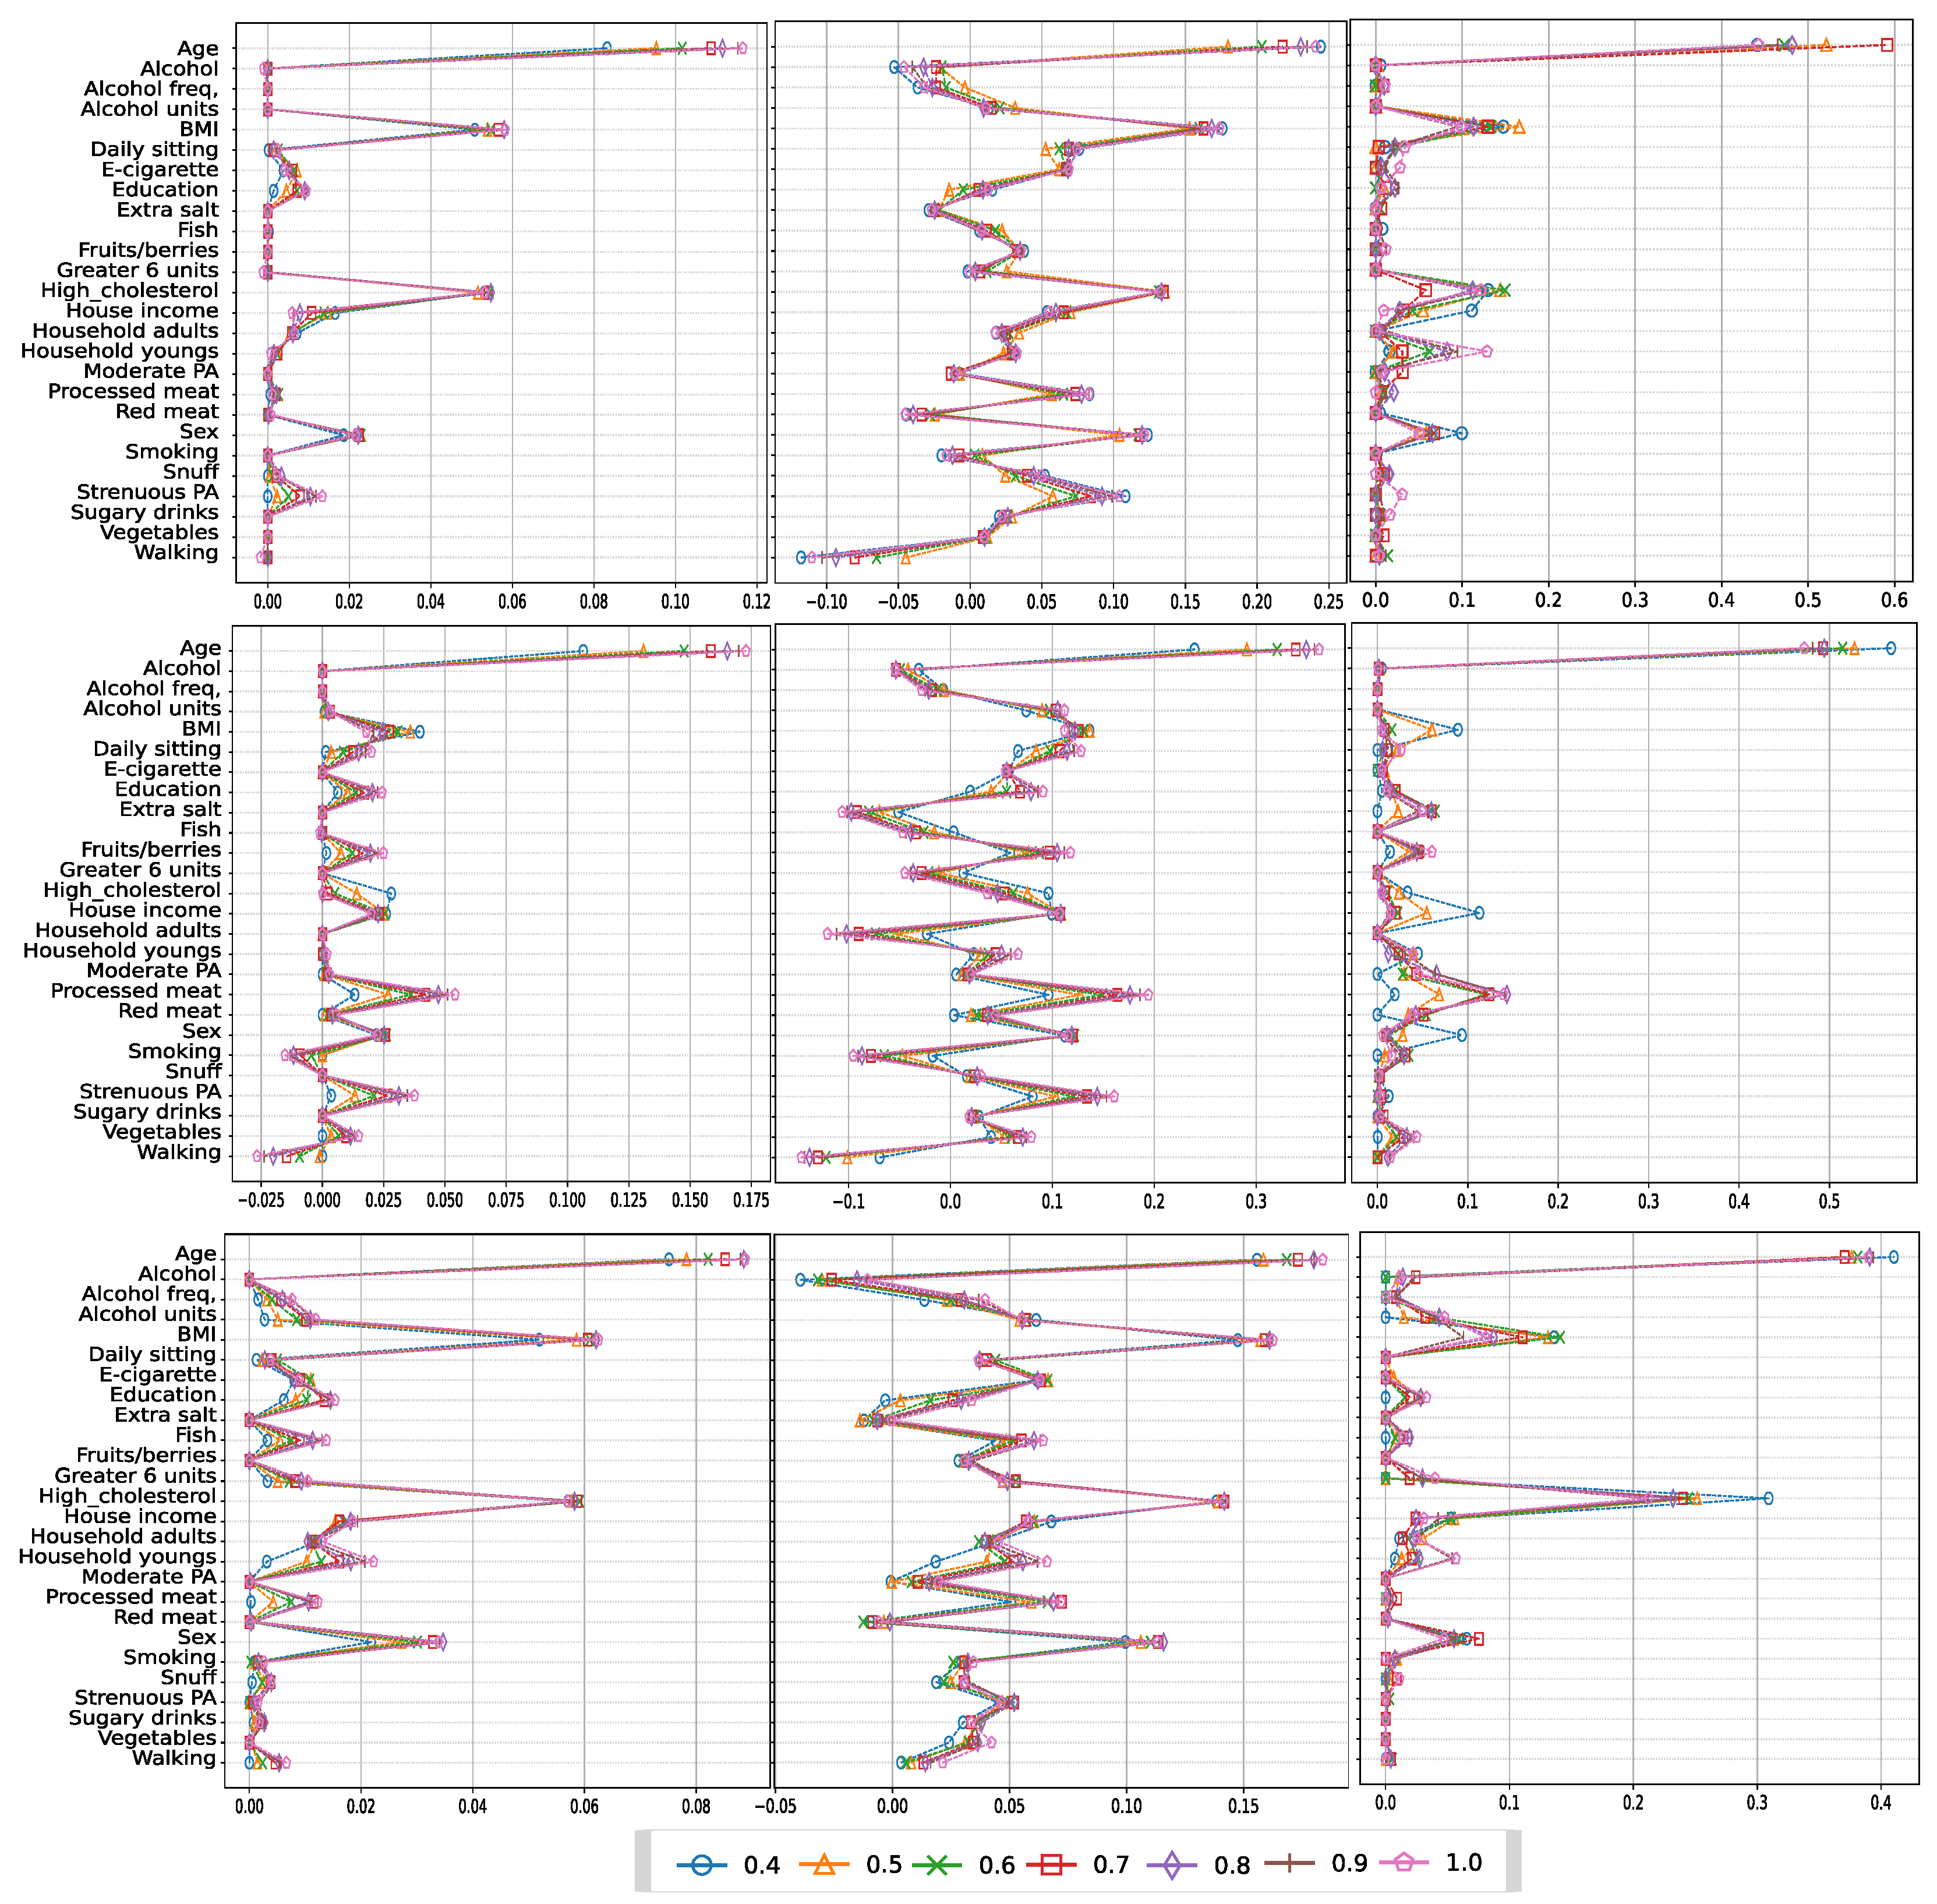
Figure 8.
SHAP summary plot of KNN model using the CTGAN oversampling technique and all subjects.
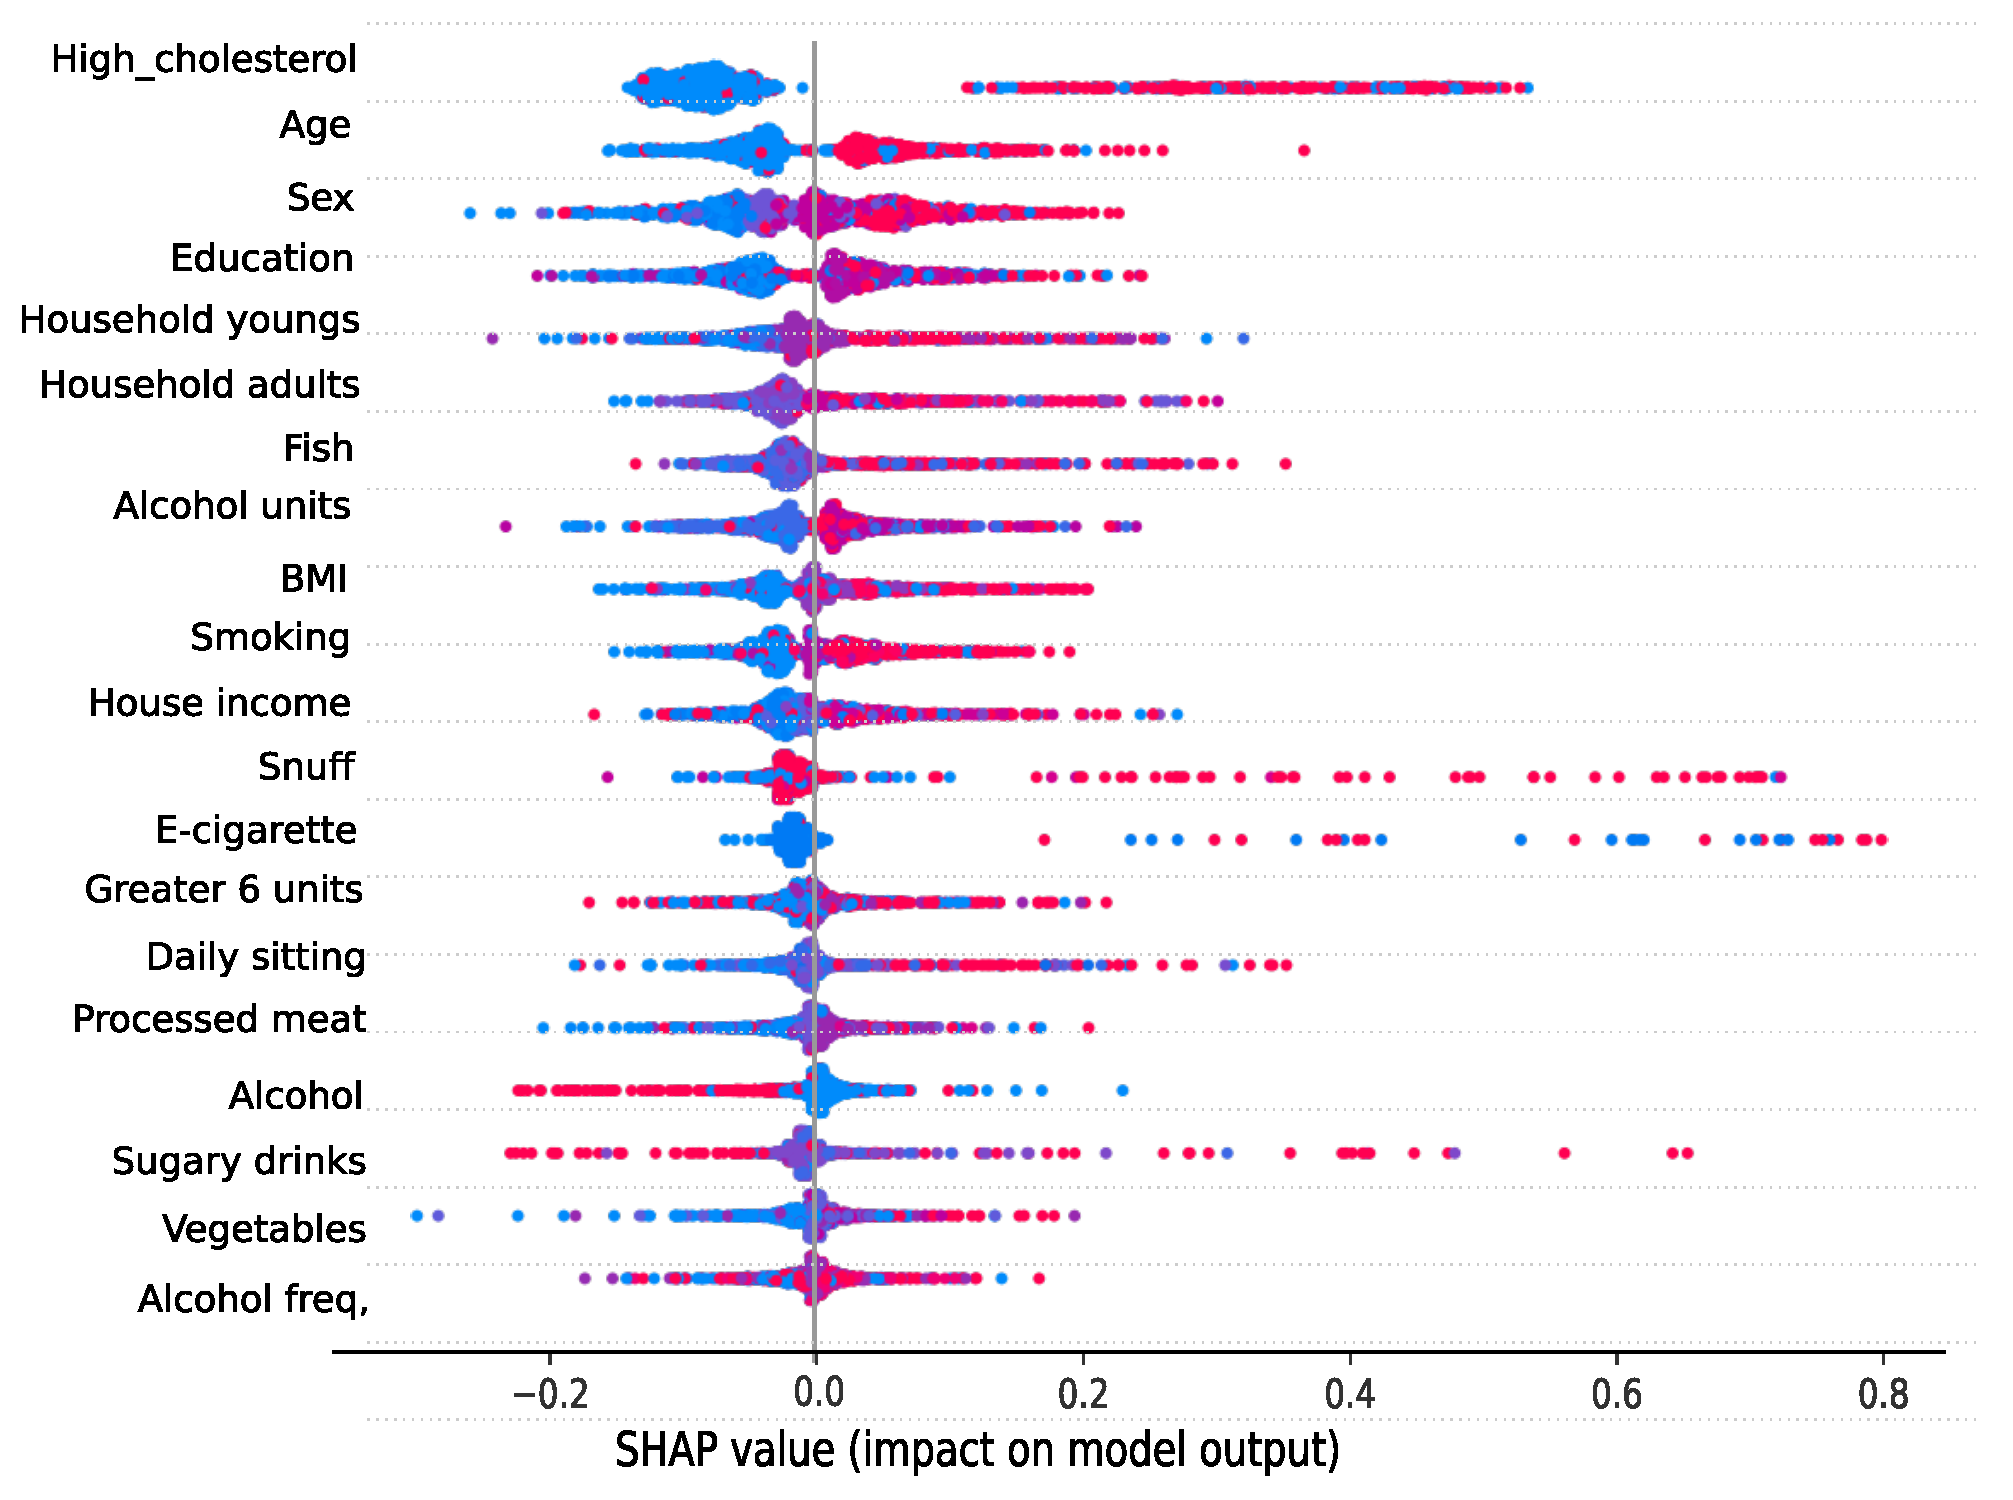

Table 1.
Summary of the features and categories in the dataset.
| Feature | Description | Categories | |
|---|---|---|---|
| Background | Age | Indiviual’s age | 16-29, 30-39, 40-49, 50-59, 60-69, NA |
| Sex | Indiviual’s sex | Woman (W), Man (M), NA | |
| BMI | Body mass index | HW, OBC-I, OBC-II, | |
| OBC-III, OW, UW, NA | |||
| Education | Education level achieved | U<4Y, U≥4Y, PS10Y, HS≥3Y, NA | |
| HC | Have cholesterol | Yes, No | |
| Substance use | Smoking | Cigarette use | CD, FO, FD, CO, N, NA |
| Snuff | Snuff use | CD, FO, FD, CO, N, NA | |
| E-cigarette | E-cigarette use | CD, FO, FD, CO, N, NA | |
| Alcohol | Alcohol consumption | Yes, No | |
| Alcohol freq. | Alcohol drink frequency | 2-3 p/w, 4 p/w, ≤ 1 p/m, 2-4 p/m, NA | |
| Alcohol units | # units consumed | 1-2, 3-4, 5-6, 7-9, ≥ 10, NA | |
| ≥ 6 units | ≥ 6 units of consumed alcohol | D, W, <M, M, N, NA | |
| PA | Strenuous PA | # days of strenuous PA | 0, 1-2, 3-4, 5-6, 7, NA |
| Moderate PA | # days of moderate PA | 0, 1-2, 3-4, 5-6, 7, NA | |
| Walking | # days of walking ≥10 minutes | 0, 1-2, 3-4, 5-6, 7, NA | |
| Daily sitting | # hours sitting on a weekday | 0-2, 3-5, 6-8, 9-11, 12-14, ≥15, NA | |
| Dietary intake | Extra salt | Freq. extra salt added to food | N, OCC, O, A, NA |
| Sugary drinks | # sweetened drinks | 0, 1, 2, 3, 4, 5, 6, ≥ 7, NA | |
| Fruits/Berries | Fruit servings and berries | 0, 1, 2, 3, 4, ≥5, NA | |
| Vegetables | Lettuce and vegetable servings | 0, 1, 2, 3, 4, ≥5, NA | |
| Red meat | # consumed red meat | 0, 1, 2, 3, 4, ≥5, NA | |
| Other meat | # consumed processed meat | 0, 1, 2, 3, 4, ≥5, NA | |
| Fish | # consumed fish products | 0, 1, 2, 3, 4, ≥5, NA | |
| Income | House income | Gross household income | ≤ 150K, 150-350K, 351-550K, |
| 551-750K, 751-1000K, ≥ 1000K, NA | |||
| Household adult | # household members ≥ 18 years | 0, 1, 2, 3, ≥4, NA | |
| Household young | # household members ≤ 18 years | 0, 1, 2, 3, ≥4, NA |
Description of categories. a For BMI: Underweight (UW), Healthy Weight (HW), Overweight (OW), and Obesity Class I (OBC-I), II (OBC-II), and III (OBC-III) b For education, Primary School up to 10 Years (PS10Y), High School (HS) minimum of 3 Years (HS≥3Y), less than 4 years (U<4Y) and 4 years or more of University (U) (U≥4Y). c For substance use: Currently Daily (CD), former occasional (FO), Former Daily (FD), Current Occasional (CO), and Never (N). c For consumption of ≥ six units of alcohol: Daily (D), less than once a month (<M), Monthly (M), Weekly (W), and Never (N). d For extra salt: Always (A), Often (O), Occasionally (OCC), and Never (N). e For red meat, other meat, and fish, they were measured per week (p/w). f For fruit servings and berries, vegetables, and sugary drinks were measured per day (p/d).
Table 2.
Mean±std (evaluated on 5 partitions) of data quality metrics for different oversampling techniques. The best values are shown in bold.
Table 2.
Mean±std (evaluated on 5 partitions) of data quality metrics for different oversampling techniques. The best values are shown in bold.
| Method | KLD | HD | MAEP | RSVR | PCD | LCM |
|---|---|---|---|---|---|---|
| SMOTEN | 0.092±0.004 | 0.168±0.006 | 0.298±0.014 | 0.609±0.011 | 2.011±0.135 | -8.116±0.407 |
| TVAE | 0.299±0.022 | 0.313±0.013 | 0.590±0.032 | 0.177±0.020 | 3.487±0.320 | -3.926±0.517 |
| CTGAN | 0.017±0.002 | 0.061±0.003 | 0.145±0.006 | 0.001±0.001 | 3.724±0.423 | -6.110±0.235 |
Table 3.
Sensitivity, AUC (mean±standard deviation) on 5 test subsets when training ML models using different resampling strategies with all features and FS. The highest average performance for each figure of merit is marked in bold.
Table 3.
Sensitivity, AUC (mean±standard deviation) on 5 test subsets when training ML models using different resampling strategies with all features and FS. The highest average performance for each figure of merit is marked in bold.
| Method | Balancing Strategy |
Sensitivity (All) | Sensitivity (FS) | AUC (All) | AUC (FS) |
| RUS | Under | 0.711±0.059 | 0.707±0.041 | 0.697±0.025 | 0.706±0.021 |
| SMOTEN | Over | 0.701±0.046 | 0.708±0.054 | 0.701±0.025 | 0.700±0.012 |
| Hybrid | 0.686±0.028 | 0.707±0.014 | 0.694±0.012 | 0.709±0.020 | |
| TVAE | Over | 0.636±0.067 | 0.640±0.013 | 0.650±0.027 | 0.668±0.024 |
| Hybrid | 0.615±0.023 | 0.694±0.041 | 0.661±0.026 | 0.704±0.016 | |
| CTGAN | Over | 0.699±0.044 | 0.695±0.021 | 0.702±0.026 | 0.707±0.017 |
| Hybrid | 0.716±0.043 | 0.709±0.036 | 0.712±0.017 | 0.711±0.021 |
Disclaimer/Publisher’s Note: The statements, opinions and data contained in all publications are solely those of the individual author(s) and contributor(s) and not of MDPI and/or the editor(s). MDPI and/or the editor(s) disclaim responsibility for any injury to people or property resulting from any ideas, methods, instructions or products referred to in the content. |
© 2023 by the authors. Licensee MDPI, Basel, Switzerland. This article is an open access article distributed under the terms and conditions of the Creative Commons Attribution (CC BY) license (http://creativecommons.org/licenses/by/4.0/).
Copyright: This open access article is published under a Creative Commons CC BY 4.0 license, which permit the free download, distribution, and reuse, provided that the author and preprint are cited in any reuse.


