

Submitted:
25 September 2026
Posted:
28 September 2026
You are already at the latest version
Abstract
This paper investigates intersectoral linkages in Czechia and Hungary pre-and post-European Union (EU) accession following Wassily Leontief’s Input-Output (IO) framework. This approach applies symmetric Supply and Use Tables (SUTs) in the derivation of structural input coefficients, sectoral output and income multipliers as well as intersectoral backward and forward linkages. The results suggest significant structural transformation in Czechia and Hungary after the EU accession with increased output and income multipliers in most sectors for example agriculture, manufacturing, construction, electricity and water. Furthermore, the results reveal increased forward linkages of agriculture, manufacturing, utilities, construction, information and communication as well as finance and insurance services after the EU accession. Additionally, the paper finds that mining shows the least forward linkages with the local economies. Finally, the results show that the contribution of sectors to value added growth increased after the EU accession and is dominated by industry (manufacturing and construction) and services sectors.
Keywords:
input-output
; structural change
; multipliers
; backward linkages
; forward linkages
1. Introduction
Input-Output (IO) models are used widely for defining and explaining economic, social and environmental issues (see Faridzad 2025). They show inter-sectoral linkages within an economy (Ilhan, 2011). They are also used to describe structural changes over a specified period. The theoretical foundation of IO models is traced to Leontief (1936) whose work was extended by Miller and Blair (2022). The calibration of IO models depends on the availability of Supply and Use tables (SUT). These SUTs are matrices that describe production processes and product transactions in detail (see Hutniczak 2022). This paper classifies industries or sectors according to the statistical classification of economic activities (NACE Rev. 2). The SUTs show the structure of production, costs and value-added (Eurostat, 2026). The SUTs are obtained from the Organization for Economic Cooperation and Development (see OECD) and Eurostat (see Eurostat 2026).
There is vast literature on input-output analysis. For example, Sturla, Ciulla and Rocchi (2023) analyzed a multi-dimensional input-output analysis of Italy and found that about 45% of the Italian external scarce water footprint is generated in China and India by manufacturing, agriculture, electricity, gas and water supply. Dagys, Heijman, Dries, Luvsandorj, Agipar, Ayush (2026) employed input-output models for the economy of Mongolia and found that energy and manufacturing are key sectors due to their strong linkages and multiplier effects on output, employment, and value-added. Brondino, Lucero and Roitbarg (2023) assessed productive specialization and integration in South America using input-output models and concluded that extra-regional demand activates 90% of South America’s value-added exports. Di Berardino, Doganieri, D’Angelo and Onesti (2023) investigated intersectoral and intercountry linkages as drivers of employment in emerging economies and found that an increasing amount of intermediate demand comes from producer services and substantial portion of manufacturing employment is generated by foreign final demand.
Despite these studies, emphasis on Czechia and Hungary is minimal and the few attempts have produced mixed results for example, According to Klimek (2024) post-accession, Central and Eastern European manufacturing sectors (especially automotive and electronics in Czechia, Slovakia, Hungary, and Poland) experienced an increased foreign backward linkage. According to Kordalska and Olczyk, (2021), domestic forward linkages in Poland, Hungary, and Slovakia increased because of transportation, logistics, and wholesale services. Tausl, and Nosková (2020) applied IO analysis to social enterprises in Czechia and confirmed that IO analysis is more appropriate for economic performance measurement of social enterprises. So far, these IO analysis on Central and Eastern European countries have not focused on the impact of the EU accession on structural coefficients, sectoral multipliers and intersectoral linkages. Therefore, there are two main motivations for this paper. First, Czechia and Hungary joined the European Union in 2004 hence there is the need to investigate the new input coefficients Second, changes in input coefficients imply changes in the economic interdependence among the industries (see Raa, 2017) hence the need to examine the inter-industry backward and forward linkages. The goal of this paper is thus twofold. First, to assess the level of structural changes in input coefficients in Czechia and Hungary. Second, to provide information on the level of intersectoral linkages.
The results suggest that the manufacturing sector benefited immensely from the EU integration in both Czechia and Hungary because of increased forward linkages toward the single market. This is explained by the increased role of Czechia and Hungary in the supply of intermediate goods to Western European countries for example, Germany. Furthermore, the results reveal increased contribution of industry and services to valued added growth after the EU accession indicating a marked shift from the traditional resource-based sectors toward manufacturing and services industries, especially information and communications, financial and insurance services and transportation etc. Finally, the results suggest increased backward linkage of agriculture attributed to access to EU funds which stimulated increased demand for advanced fertilizers, quality seeds, modern machinery and specialized services.
The rest of the paper is structured as follows: Chapter 2 covers materials and methods, Chapter 3 focuses on the results whereas Chapter 4 summarizes the paper and provides policy recommendations.
2. Materials and Methods
This paper assesses sectoral multipliers and intersectoral linkages of industries in Czechia and Hungary using IO analysis following the approach of Nchor and Konderla (2016). The data for the SUTs is obtained from the Organization for Economic Cooperation and Development (2025) and Eurostat (2023). The classification of industries follows the approach of second revision of the Statistical Classification of Economic Activities in the European Community (NACE Rev. 2).
2.1. The Classification of Sector
Table 1 shows the classification of sectors. In the Supply table, supply of goods and services are valued at basic prices. In the Use table they are valued at purchasers’ prices. Both Supply and Use are matched by trade, transport margins and net taxes on products. The total of trade margins by product is equal to the total of trade margins by trade industries, plus the secondary trade margins by other industries. The analysis requires that the IO table be symmetric. The IO tables show 44 economic activities excluding households. The sectors are aggregated into 15 industries by economic activities according to the approach of Mahony and Timmer (2009). The conversion of the supply and use tables into symmetric input-output table follows the method by, Soklis (2009).
2.2. The Leontief Inverse Matrix
Intermediate consumption is an matrix where is equal to the 15 sectors in the economy. Final consumption is an vector. Gross fixed capital formation is an vector. Net export is vector. Value added is a vector. The model follows the approaches developed by Miller and Blair (2009) as well as Nchor and Konderla (2016). The calculation of the requirements matrix or the input coefficients from the symmetric input-output table is given by:
Xj represents the total output of sector and depicts the intermediate input requirement of that sector. is the Leontief’s input coefficient matrix. The total output of each sector is calculated as
depicts purchases by the sector of the output produced by sector , depicts the sales from sector , to final demand and is the total output of sector .
2.3. The Output and Income Multipliers
The Leontief inverse matrix is derived from equation 3
The Leontief inverse matrix or the matrix of partial output multipliers is given by the matrix
Given that,
The output multipliers are derived as the column summations of equation 5
The total income multipliers (IM) are calculated as
where refers to the ratio of income from employment to total output of the industry.
2.4. Backward and Forward Linkages
Backward linkages are calculated as using equation 7 inverse (see Nchor, 2014).
Forward linkages are calculated using equation 8 inverse (see Nchor, 2014).
w depicts weights of final demand and is the partial output multipliers or the input coefficients in the Leontief inverse (see Nchor, 2014).
3. Results
This section gives economic interpretation to the results and discusses relative to existing literature. The first section focuses on the output (OM) and income multipliers (IM) while the second section concentrates on the backward linkages (BL) and forward linkages (FL) of the sectors in Czechia and Hungary.
3.1. Output and Income Multipliers
Table 2 shows the output and income multipliers of the two countries before the accession to the EU. The multipliers describe the total output generated because of 1 dollar change in final demand. Thus, an output multiplier of 1.31 implies that for every dollar of production in this industry, $1.319 of activity is generated in the economy: first, the original dollar and an additional $0.31. The results suggest that agriculture, manufacturing, electricity, construction and the water sectors have the highest output and income multipliers. Income multipliers, just like output multipliers, describe the change in income per industry resulting from a change in final demand. An income multiplier of 1.32 indicates that for every dollar of direct labor income in this industry another $0.32 of labor income is generated in the economy.
Table 3 shows the output and income multipliers of the two countries after the accession to the EU. The results show a significant increase in both output and income multipliers of most industries post-EU accession. Agriculture, manufacturing, electricity, water, construction and accommodation have the highest multiplier impact on output and income. Mining shows the lowest income multipliers. When a country joins the EU, structural transformations significantly deepen intersectoral linkages (European Commission, 2026). Furthermore, accession to the EU eliminated tariff and non-tariff barriers leading to increased labor mobility (Nchor, 2020).
3.2. Intersectoral Linkages and Interdependence
In this section, the paper assesses the interdependence amongst the industries focusing on backward and forward linkages. Forward linkages (FL) describe how an increase in output of an industry or sector encourages an increase in the output of other industries or sectors. They show how sectors use the output of other industries as intermediate input. Backward Linkages (BL) on the other hand describes how an increase in the output of certain sectors increases the input demands of other sectors. Table 4 shows the results for the period before accession to the EU. Values greater than 1 indicate high linkage and vice versa. It means that the sector has an above-average dependence on other sectors for inputs. Similarly, forward linkages values greater than 1 imply that the sector sells its output to other domestic sectors as intermediate goods and vice versa. The results suggest that mining had the lowest backward and forward linkages with other sectors of the economies of both countries before the EU integration. Agriculture, electricity and water had low backward linkage but high forward linkages. Manufacturing had high backward and forward linkages.
Table 5 shows backward and forward linkages post-EU accession. The results show improved linkages in most sectors of the economies of both countries. Agriculture, electricity, water, accommodation, transportation, construction, financial services as well as the information and communication sectors show high forward linkages but relatively low backward linkages. Manufacturing as well as wholesale and distribution sectors have high backward and forward linkages. The direct impact of mining is low for both backward and forward linkages.
3.3. Sectoral Contribution to Value Added Growth
Figure 1 shows the contribution of sectors to value added growth in Czechia and Hungary following the approach of (see Nchor, Kolman, Střelec and Darkwah, 2015). Agric consists of agriculture, forestry and fishing. Industry consists of manufacturing and construction while services consist of wholesale and retail trade; repair of motor vehicles and motorcycles, information and communication, financial and insurance activities, real estate activities, public administration and defense; compulsory social security, professional and scientific activities. The results suggest that the agric sector contributed the list to value added growth in Czechia between 1996 and 2025 whereas industry and services contribute the highest share of value-added growth. The impact of the global financial crisis and the Covid-19 pandemic was highly felt in services and industry. Furthermore, the contribution of services and industry increased significantly after the EU accession while agric increased marginally. The services sector has contributed the most to value added growth after the crisis.
In Figure 2, the paper assesses the contribution of the three sectors to value added growth in Hungary. Like Czechia, industry and services contribute the most, however, the contribution of agric increased significantly after the EU accession. The impact of the global financial crisis and Covid-19 pandemic was greater on services and industry, and the services sector has had the most dominant contribution after the crisis.
In Figure 3, the paper examines the contribution of sub-sectors under industry to value added growth in Czechia and Hungary. The essence is to ascertain the specific sectors driving growth in the industry. The results suggest significant manufacturing contribution (above 7 percentage points) in Czechia after the EU accession. The sector was, however, hit by the global financial crisis and has recovered but not to the pre-crisis level. The contribution of construction increased in both Czechia and Hungary but to below 1 percentage point. Manufacturing in Hungary also responded positively to the EU accession. The post-financial crisis period shows that the contribution of manufacturing to value-added growth in Czechia and Hungary are almost at par.
Figure shows the value-added contribution of services sectors in Czechia. Wholesale represents wholesale and retail trade; repair of motor vehicles and motorcycles. ICT represents information and communication technology. Finance represents financial and insurance activities, Real estate represents real estate activities, Professionals represent professional, scientific and technical activities; administrative and support service activities, Public adm represents public administration and defense; compulsory social security. Arts represent arts, entertainment and recreation; other service activities; activities of household and extra-territorial organizations and bodies. The results suggest that the Wholesale sector contributes the most to value added growth and was the sector most hit by the global financial crisis and the Covid-19 pandemic. Wholesale, information and technology and finance have the highest contribution to value added growth after the EU accession.
Figure 4.
Contribution of Services Sectors to Value Added Growth in Czechia Source: Author’s own work data.
Figure 4.
Contribution of Services Sectors to Value Added Growth in Czechia Source: Author’s own work data.
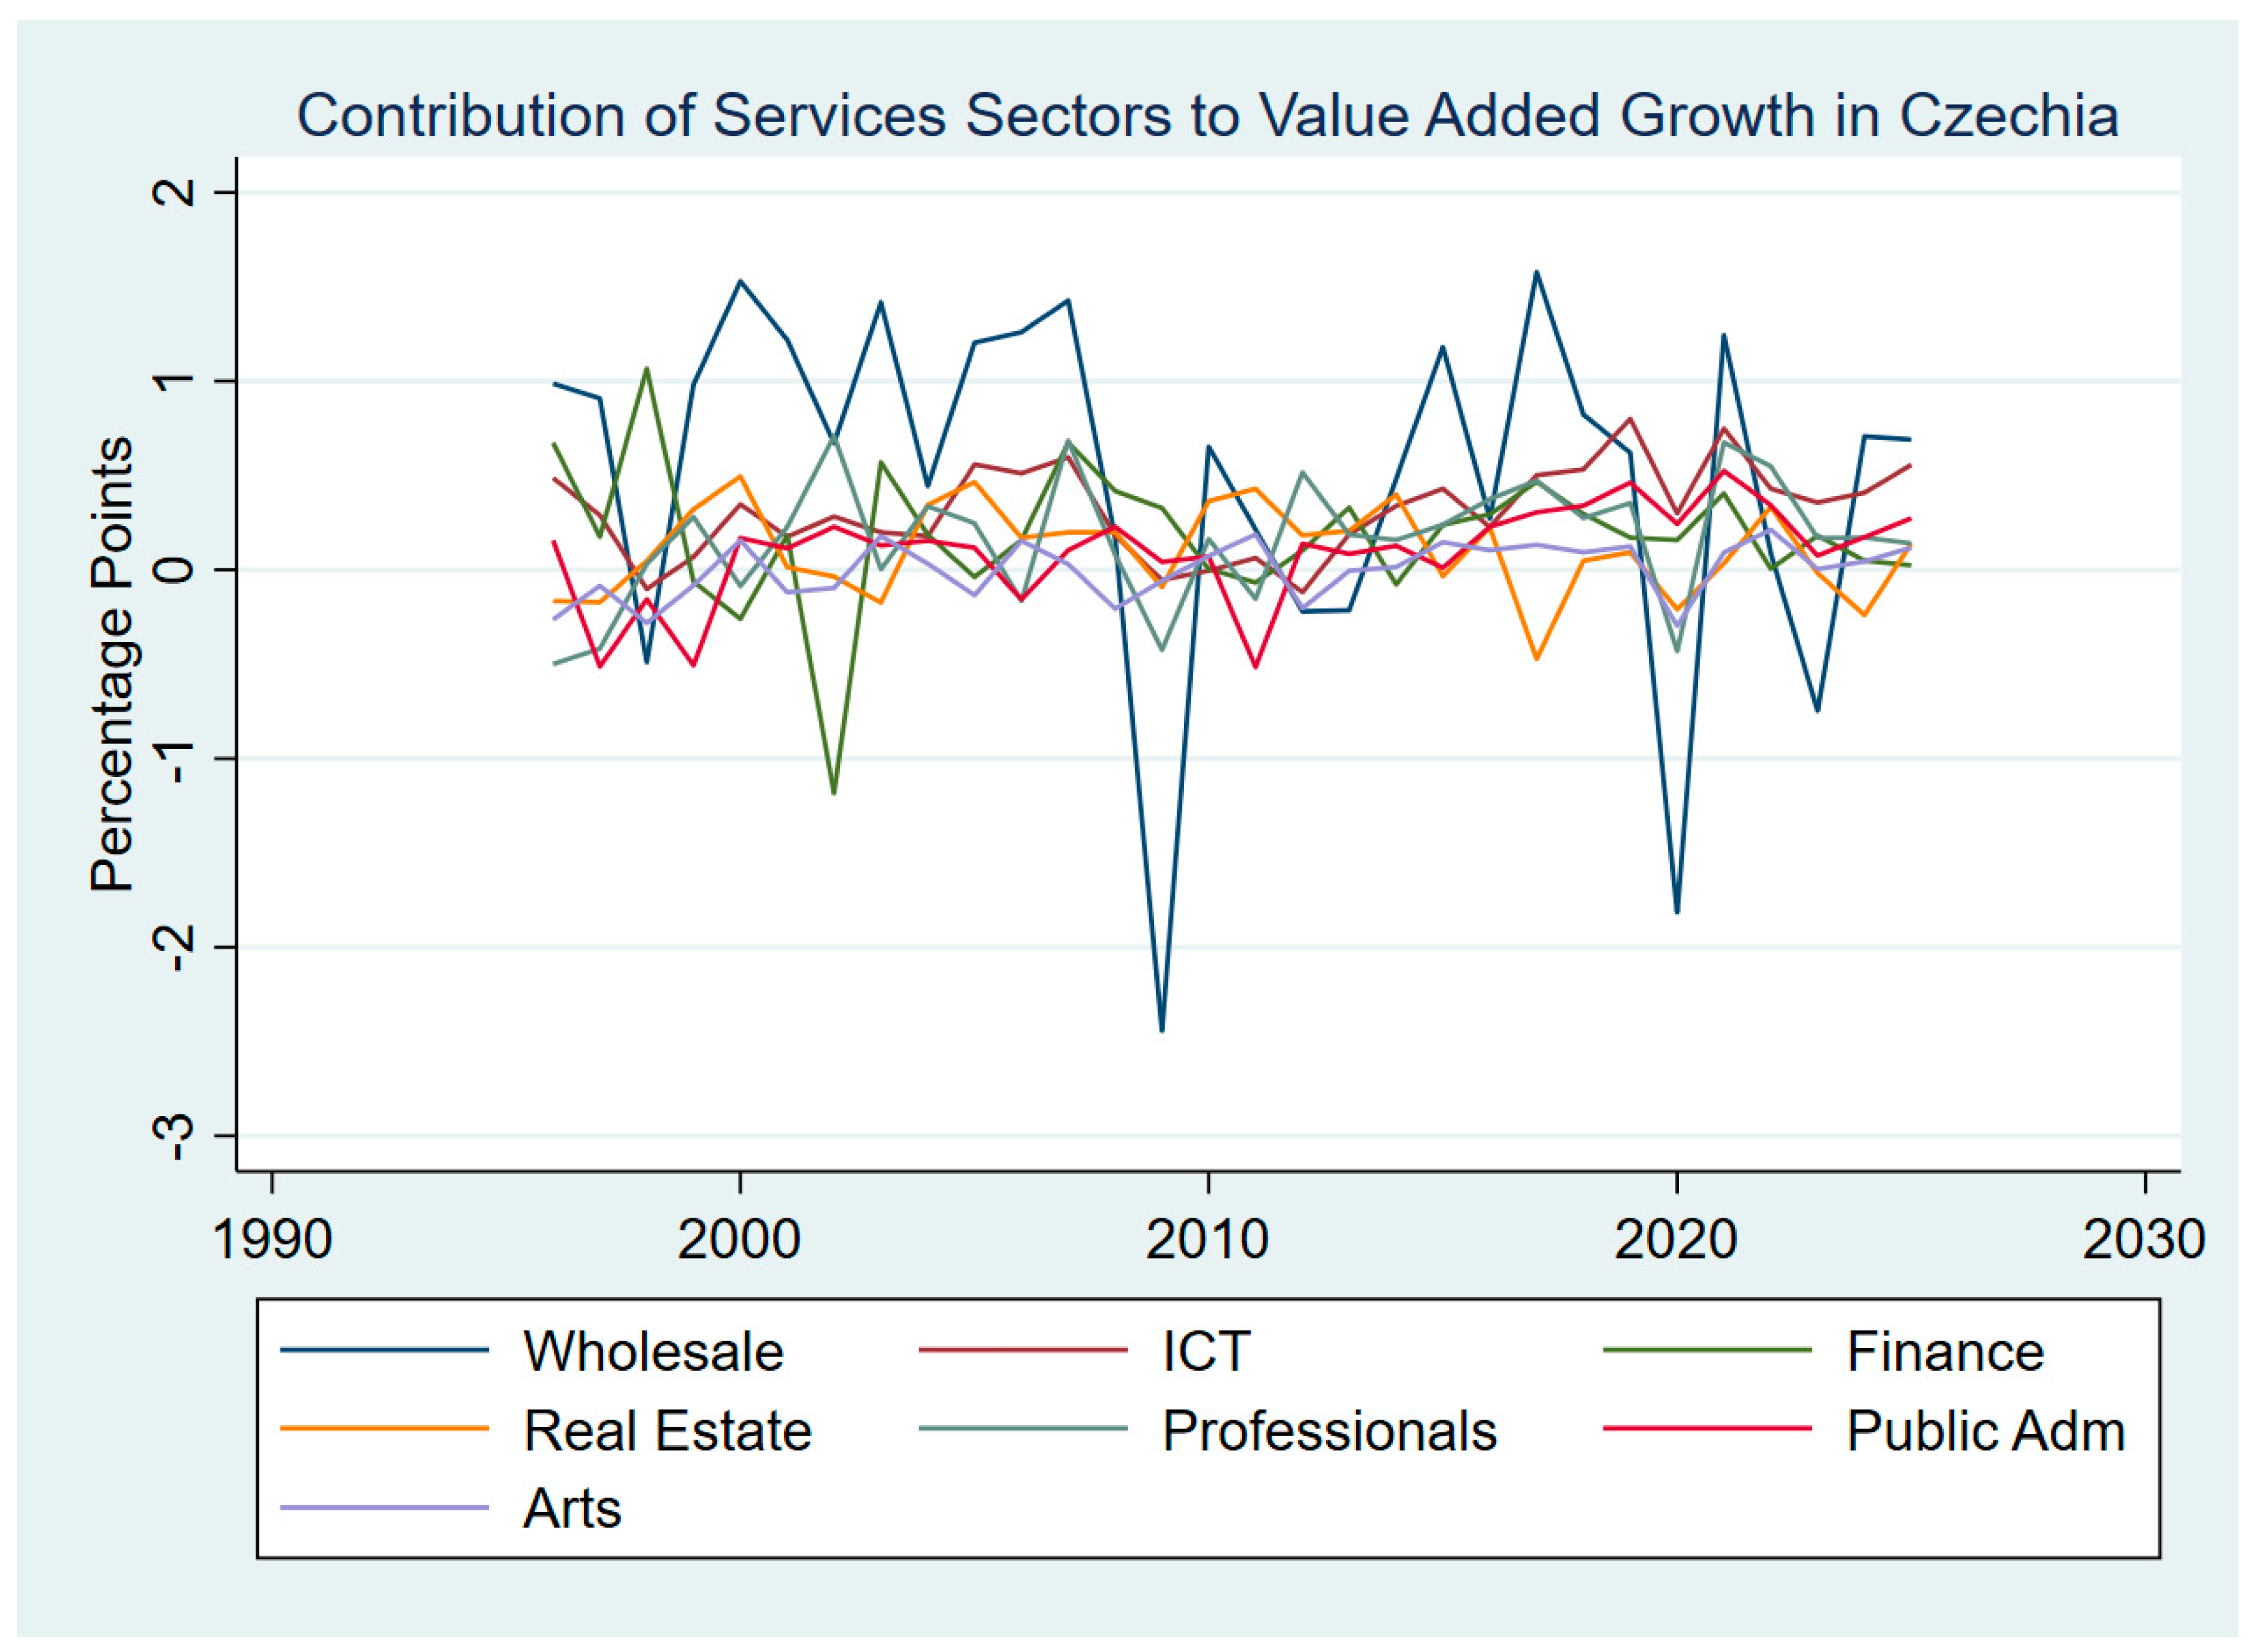
Figure 5 shows the detailed contribution of services sectors to value added growth in Hungary. Like Czechia, the wholesale and finance sectors contribute the most to value added. The results suggest a positive response from all sectors to EU integration. The contribution of most sectors has increased significantly post-crisis especially in wholesale, finance, real estate as well as information and communication technology.
3.4. Discussion
The results show an increase in output and income multipliers of most sectors of the countries. The findings also reveal increased backward and forward linkages amongst the sectors of the economies after the EU accession. Finally, the results indicate that value added growth is dominated by industry and services in Czechia and Hungary which is consistent with the assertion that EU integration dismantled non-tariff barriers and harmonized regulations, allowing for rapid technology transfers leading to improved output and income. Moreover, access to advanced production technologies and the need for highly specialized maintenance led to increased demand for workers which increased output and income multipliers. The growth in technology also meant faster and efficient production, hence higher demand for inputs from domestic high-value sectors particularly services, and manufacturing thereby also impacting positively on the output and income multipliers as well as backward and forward linkages. Furthermore, access to the large EU market facilitated trade leading to improved output, income, backward and forward linkages (see Brou and Ruta 2011, Campos et al. 2019; Arkhangelsky et al. 2021; Lejour et al. 2009; Campos et al. 2019; Hagemejer et al. 2021; Campos et al. 2022).
Focusing on specific sectors, the findings of this paper are consistent with that of Klimek (2024) who concluded that Central and Eastern European countries benefitted significantly from EU accession especially in manufacturing sectors, and Demiral (2016) who argued that cheaper foreign inputs impacted positively on output and forward linkages of domestic sectors while negatively affecting backward linkages. The results also align with the findings of Dicharry and Stiblarova (2023) who found that non-tradables, such as construction driven by EU Cohesion funds and utilities (Electricity, Water etc) maintained strong and broad backward as well as forward linkages. The findings of this paper are also consistent with Kordalska and Olczyk (2021) who found that EU integration strongly boosted forward linkages of most sectors especially the manufacturing sector, transportation, logistics, and wholesale services. This paper finds that following the European Union (EU) accession, intermediate and supply-chain linkages have shifted from traditional resource-based sectors toward manufacturing and services most notably financial and insurance services, information and communications as well as transportation/logistics which aligns with the findings of Cieśli (2021) and Nchor (2024). The contribution of agriculture, forestry and fishing to value added growth is low in Czechia and Hungary likely because the countries are highly advanced, service- and industry-dominated economies where high-value technology and services grow much faster than primary production.
4. Conclusion
This paper applies an Input-Output (IO) framework to assess the structural interdependence and multiplier effects across fifteen economic sectors in Czechia and Hungary. The empirical findings reveal that the mining sector exhibits relatively low backward and forward linkages, implying that investment in this area generates limited ripple effects on output, income and intersectoral linkages. In contrast, the manufacturing sector in both countries possesses the highest overall output and income multipliers, alongside robust forward and backward linkages. Furthermore, the analysis demonstrates strengthening intersectoral linkages driven by industrial sectors (construction and manufacturing) and key services, including finance and insurance, transportation, information and communication, as well as wholesale distribution. Specifically, the high backward linkages found in manufacturing and construction underscore their pivotal role as primary drivers of intermediate demand. Additionally, the paper highlights that value-added growth is heavily dominated by the industry and services sectors such as utilities, transport, ICT, and finance, marking a significant structural shift away from traditional agriculture. Among these, the utilities sector (encompassing energy, water, and waste management) displays critical forward linkages, serving as a vital provider of intermediate inputs for downstream economic activities. Ultimately, these findings suggest that targeted investments in sectors with high backward and forward linkages will not only boost direct production but also stimulate wider economic output and increase household earnings. Moreover, strategic funding directed toward utilities and services is poised to maximize job creation and value addition. Future research should explore the impact of AI on structural input coefficients and intersectoral linkages. Research should also be expanded to include environmental and sustainability analysis.
Competing Interests
I declare that there is no conflict of interest regarding this research paper.
Funding
No funding was received for this research paper.
References
- Ahmad, I.; Alvi, S. Exploring the backward and forward linkages of production network in a developing country. Humanit. Soc. Sci. Commun. 2024, 11(1), 296. [Google Scholar] [CrossRef]
- Arkhangelsky, D.; Athey, S.; Hirshberg, D.A.; Imbens, G. W.; Wager, S. Synthetic Difference-in-Differences. Am. Econ. Rev. 2021, 111(12), 4088–4118. [Google Scholar] [CrossRef]
- Beyer, R.; Li, C. Y.; Weber, S. Economic gains from the 2004 EU accession round. In Economics Letters; Elsevier, 2026; vol. 262(C). [Google Scholar] [CrossRef]
- Bhusal, L.B. Key sector identification of Nepal: an integrated approach with linkage and hypothetical extraction method. Econ. Struct. 2025, 14, 3. [Google Scholar] [CrossRef]
- Brondino, G.; Lucero, J.; Roitbarg, H. Productive specialization and integration in South America: A global input–output analysis. Struct. Change Econ. Dyn. 2023, 67, 89–97. [Google Scholar] [CrossRef]
- Brou, D.; Ruta, M. Economic Integration, Political Integration or Both? J. Eur. Econ. Assoc. 2011, Volume 9(Issue 6), 1143–1167. [Google Scholar] [CrossRef]
- Campos, N. F.; Coricelli, F.; Moretti, L. Institutional integration and economic growth in Europe. In Journal of Monetary Economics; Elsevier, 2019; vol. 103(C), pp. pages 88–104. [Google Scholar]
- Campos, N. F.; Coricelli, F.; Franceschi, E. Institutional integration and productivity growth: Evidence from the 1995 enlargement of the European Union. In European Economic Review; Elsevier, 2022; vol. 142(C). [Google Scholar]
- Cieślik, E. A. New Era Is Beginning in Central and Eastern Europe: Information and Communication Technology Services Exceed Manufacturing in the Global Production Chain. J. Knowl. Econ. 2021, 13, 2607–2639. [Google Scholar] [CrossRef]
- Dagys, K.; Heijman, W.; Dries, L.; Luvsandorj, N.; Agipar, B.; Ayush, D. Enhancing economic diversification in Mongolia: an input–output analysis. J. Asia Pac. Econ. 2026, 31(2), 628–653. [Google Scholar] [CrossRef]
- Demiral, M. Has EU Accession Caused Structural Change in New Entrants? Intersectoral Linkage Analyses on Bulgaria and Romania. Int. J. Econ. Financ. Issues 2016, 6(2), 671–681. Available online: https://www.econjournals.com/index.php/ijefi/article/view/1968.
- Di Berardino, C.; Doganieri, I.; D’Angelo, S.; Onesti, G. Intersectoral and intercountry linkages as drivers of employment growth in emerging economies: The case of Visegrád countries. Metroeconomica 2023, 74(1), 163–187. [Google Scholar] [CrossRef]
- Dicharry, B.; Stiblarova, L. Positive externalities of the EU cohesion policy: Toward more synchronised CEE countries? Int. Econ. Econ. Policy 2023, 20, 485–508. [Google Scholar] [CrossRef]
- Dietzenbacher, E.; Los, B.; Stehrer, R.; Timmer, M.; De Vries, G. The construction of world input–output tables in the WIOD project. Econ. Syst. Res. 2013, 25(1), 71–98. [Google Scholar] [CrossRef]
- Epede, M. B.; Wang, D. Global value chain linkages: An integrative review of the opportunities and challenges for SMEs in developing countries. Int. Bus. Rev. 2022, 31(5), 101993. [Google Scholar] [CrossRef]
- European Commission. 20 years together: Facts and figures about the benefits of the enlargement for the EU. 2026. Available online: https://commission.europa.eu/topics/enlargement/20-years-together/20-years-together-facts-and-figures-about-benefits-enlargement-eu_en.
- Eurostat. Supply and use tables for the European Union and the euro area. 2025. Available online: https://ec.europa.eu/eurostat/statistics-explained/index.php?title=Supply_and_use_tables_for_the_European_Union_and_the_euro_area.
- Eurostat. National supply, use and input-output tables. 2026. Available online: https://ec.europa.eu/eurostat/web/esa-supply-use-input-tables/methodology.
- Faridzad, A. Applying machine learning to input–output analysis: a new perspective on identifying key Australian industries. Econ. Struct. 2025, 14, 9. [Google Scholar] [CrossRef]
- Freytag, A.; Fricke, S. Sectoral linkages of financial services as channels of economic development-An input–output analysis of the Nigerian and Kenyan economies. Rev. Dev. Financ. 2017, 7(1), 36–44. [Google Scholar] [CrossRef]
- Gurgul, H.; Lach, L. Key sectors in the post-communist CEE economies: What does the transition data say? Communist Post.-Communist Stud. 2015, 48(1), 15–32. [Google Scholar] [CrossRef]
- Hagemejer, J.; et al. Economic impact of the EU Eastern enlargement on New Member States revisited: The role of economic institutions. Cent. Eur. Econ. J. 2021, vol. 8(no. 55), 126–143. [Google Scholar] [CrossRef]
- Hutniczak, B. Efficient updating of regional supply and use tables with the national-level statistics. Econ. Struct. 2022, 11, 16. [Google Scholar] [CrossRef]
- Ilhan B, Y. H. A comparative input-output analysis of the construction sector in Turkey and EU countries. Eng. Constr. Archit. Manag. 2011, Vol. 18(No. 3), 248–265. [Google Scholar] [CrossRef]
- International Monetary Fund. Economic Benefits from Deep Integration: 20 years after the 2004 EU Enlargement. 2025. Available online: https://www.imf.org/en/publications/wp/issues/2025/02/21/economic-benefits-from-deep-integration-20-years-after-the-2004-eu-enlargement-562168.
- Sixta, Jaroslav. The Recovery of the Input-Output Analysis in the Czech Republic; Statistika, 2019. [Google Scholar]
- Kandepu, H.; Bwalya, B. The Role of Agro-Dealers in Forward and Backward Linkages of the Smallholder Agriculture Sector in Central Zambia. Sage Open 2025, 15(4), 21582440251407822. [Google Scholar] [CrossRef]
- Kelly, S. Estimating economic loss from cascading infrastructure failure: a perspective on modelling interdependency. Infrastruct. Complex 2015, 2, 7. [Google Scholar] [CrossRef]
- Klimek, A. Economic upgrading of Central and Eastern European economies through global value chain participation and foreign direct investment. Balt. J. Econ. 2024, 24(2), 180–202. [Google Scholar] [CrossRef]
- Kordalska, A.; Olczyk, M. Linkages between services and manufacturing as a new channel for GVC development: Evidence from CEE countries. In Structural Change and Economic Dynamics; Elsevier, 2021; vol. 58(C), pp. pages 125–137. [Google Scholar]
- Lejour, A.M.; Solanic, V.; Tang, P.J.G. EU Accession and Income Growth: An Empirical Approach. Transit Stud. Rev. 2009, 16, 127–144. [Google Scholar] [CrossRef]
- Leontief, W.W. Quantitative Input and Output Relations in the Economic Systems of the United States. Rev. Econ. Stat. 1936, 18, 105–125. [Google Scholar] [CrossRef]
- Miller, R.E.; Blair, P.D. Input-Output Analysis: Foundations and Extensions, 3rd ed.; Cambridge University Press, 2022. [Google Scholar]
- Montalbano, P.; Nenci, S. Does global value chain participation and positioning in the agriculture and food sectors affect economic performance? A global assessment. Food Policy 2022, 108, 102235. [Google Scholar] [CrossRef]
- Nchor, D. Labour mobility as an adjustment mechanism to asymmetric shocks in Europe: evidence from the Czech Republic, Hungary, Poland and Slovakia. J. Labour Mark. Res. 2020, 54(1), 16. [Google Scholar] [CrossRef]
- Nchor, D. (2024). The Information and Communication Technology Sector in Czechia and Its Contribution to Innovation and Economic Growth, Modeling Economic Growth in Contemporary Czechia, Daniel Stavárek, Michal Tvrdoň.
- Nchor, D.; Konderla, T. Economic multipliers and sectoral linkages: Ghana and the new oil sector. Acta Univ. Agric. Et. Silvic. Mendel. Brun. 2016, 64(2), 635–642. [Google Scholar] [CrossRef]
- Nchor, D.; Kolman, P.; Střelec, L.; Darkwah, S. A. The new oil sector and the Dutch disease: The case of Ghana. Acta Univ. Agric. Et. Silvic. Mendel. Brun. 2015, 63(6), 2035–2041. [Google Scholar] [CrossRef]
- Nosková, M. An application of input-output analysis to social enterprises: a case of the Czech Republic. Online. Dostupné z. 2020. [CrossRef]
- OECD. SUT Use, Value added and its components by activity. 2026. Available online: https://data-explorer.oecd.org/vis?lc=en&df[ds]=DisseminateFinalDMZ&df[id]=DSD_NASU%40DF_USEVA_T1600&df[ag]=OECD.SDD.NAD&df[vs]=2.0&dq=A.CZE......V.&pd=2021,2021&to[TIME_PERIOD]=false.
- O’Mahony, M.; Timmer, M.P. Output, Input and Productivity Measures at the Industry Level: The EU KLEMS Database*. Econ. J. 2009, 119, F374–F403. [Google Scholar] [CrossRef]
- Rohman, I. K. The globalization and stagnation of the ICT sectors in European countries: An input-output analysis. Telecommun. Policy 2013, 37(4-5), 387–399. [Google Scholar] [CrossRef]
- Soklis, G. The Conversion of the Supply and Use Tables to Symmetric Input-Output Tables: A Critical Review. Bull. Political Econ. Bull. Political Econ. 2009, vol. 3(1), 51–70. [Google Scholar]
- Sturla, G.; Ciulla, L.; Rocchi, B. Natural and social scarcity in water Footprint: A multiregional input–output analysis for Italy. Ecol. Indic. 2023, 147, 109981. [Google Scholar] [CrossRef]
- Tausl, P. P.; Noskova, M. “An application of input-output analysis to social enterprises: a case of the Czech Republic”. J. Entrep. Emerg. Econ. 2020, Vol. 12(No. 4), 495–522. [Google Scholar] [CrossRef]
- Taušl, P. P.; Nosková, M. An application of input-output analysis to social enterprises: a case of the Czech Republic. J. Entrep. Emerg. Econ. 2020, roč. 12(č. 4), s. 495–522. [Google Scholar] [CrossRef]
- Walz, U. Does an enlargement of a common market stimulate growth and convergence? In Journal of International Economics; Elsevier, 1998; vol. 45, 2, pp. pages 297–321. Available online: https://stats.oecd.org/Index.aspx?DataSetCode=IOTS_2021.
- Yasmin, T.; El Refae, G. A.; Eletter, S. Sectoral productivity in Hungarian economy: an input-output linkages approach. J. East. Eur. Cent. Asian Res. (JEECAR) 2019, 6(2), 344–355. [Google Scholar] [CrossRef]
- Yasmin, T.; Refae, G.A.E.; Eletter, S. Capturing the Sectoral Performance in Swiss Economy: An Input-Output Structural Decomposition Analysis (SDA). In Cutting-Edge Business Technologies in the Big Data Era. SICB 2023. Studies in Big Data; Yaseen, S.G., Ed.; Springer: Cham, 2023; vol 136. [Google Scholar] [CrossRef]
Figure 1.
Sector Contribution to Value Added Growth in Czechia Source: Author’s own work using OECD data.
Figure 1.
Sector Contribution to Value Added Growth in Czechia Source: Author’s own work using OECD data.
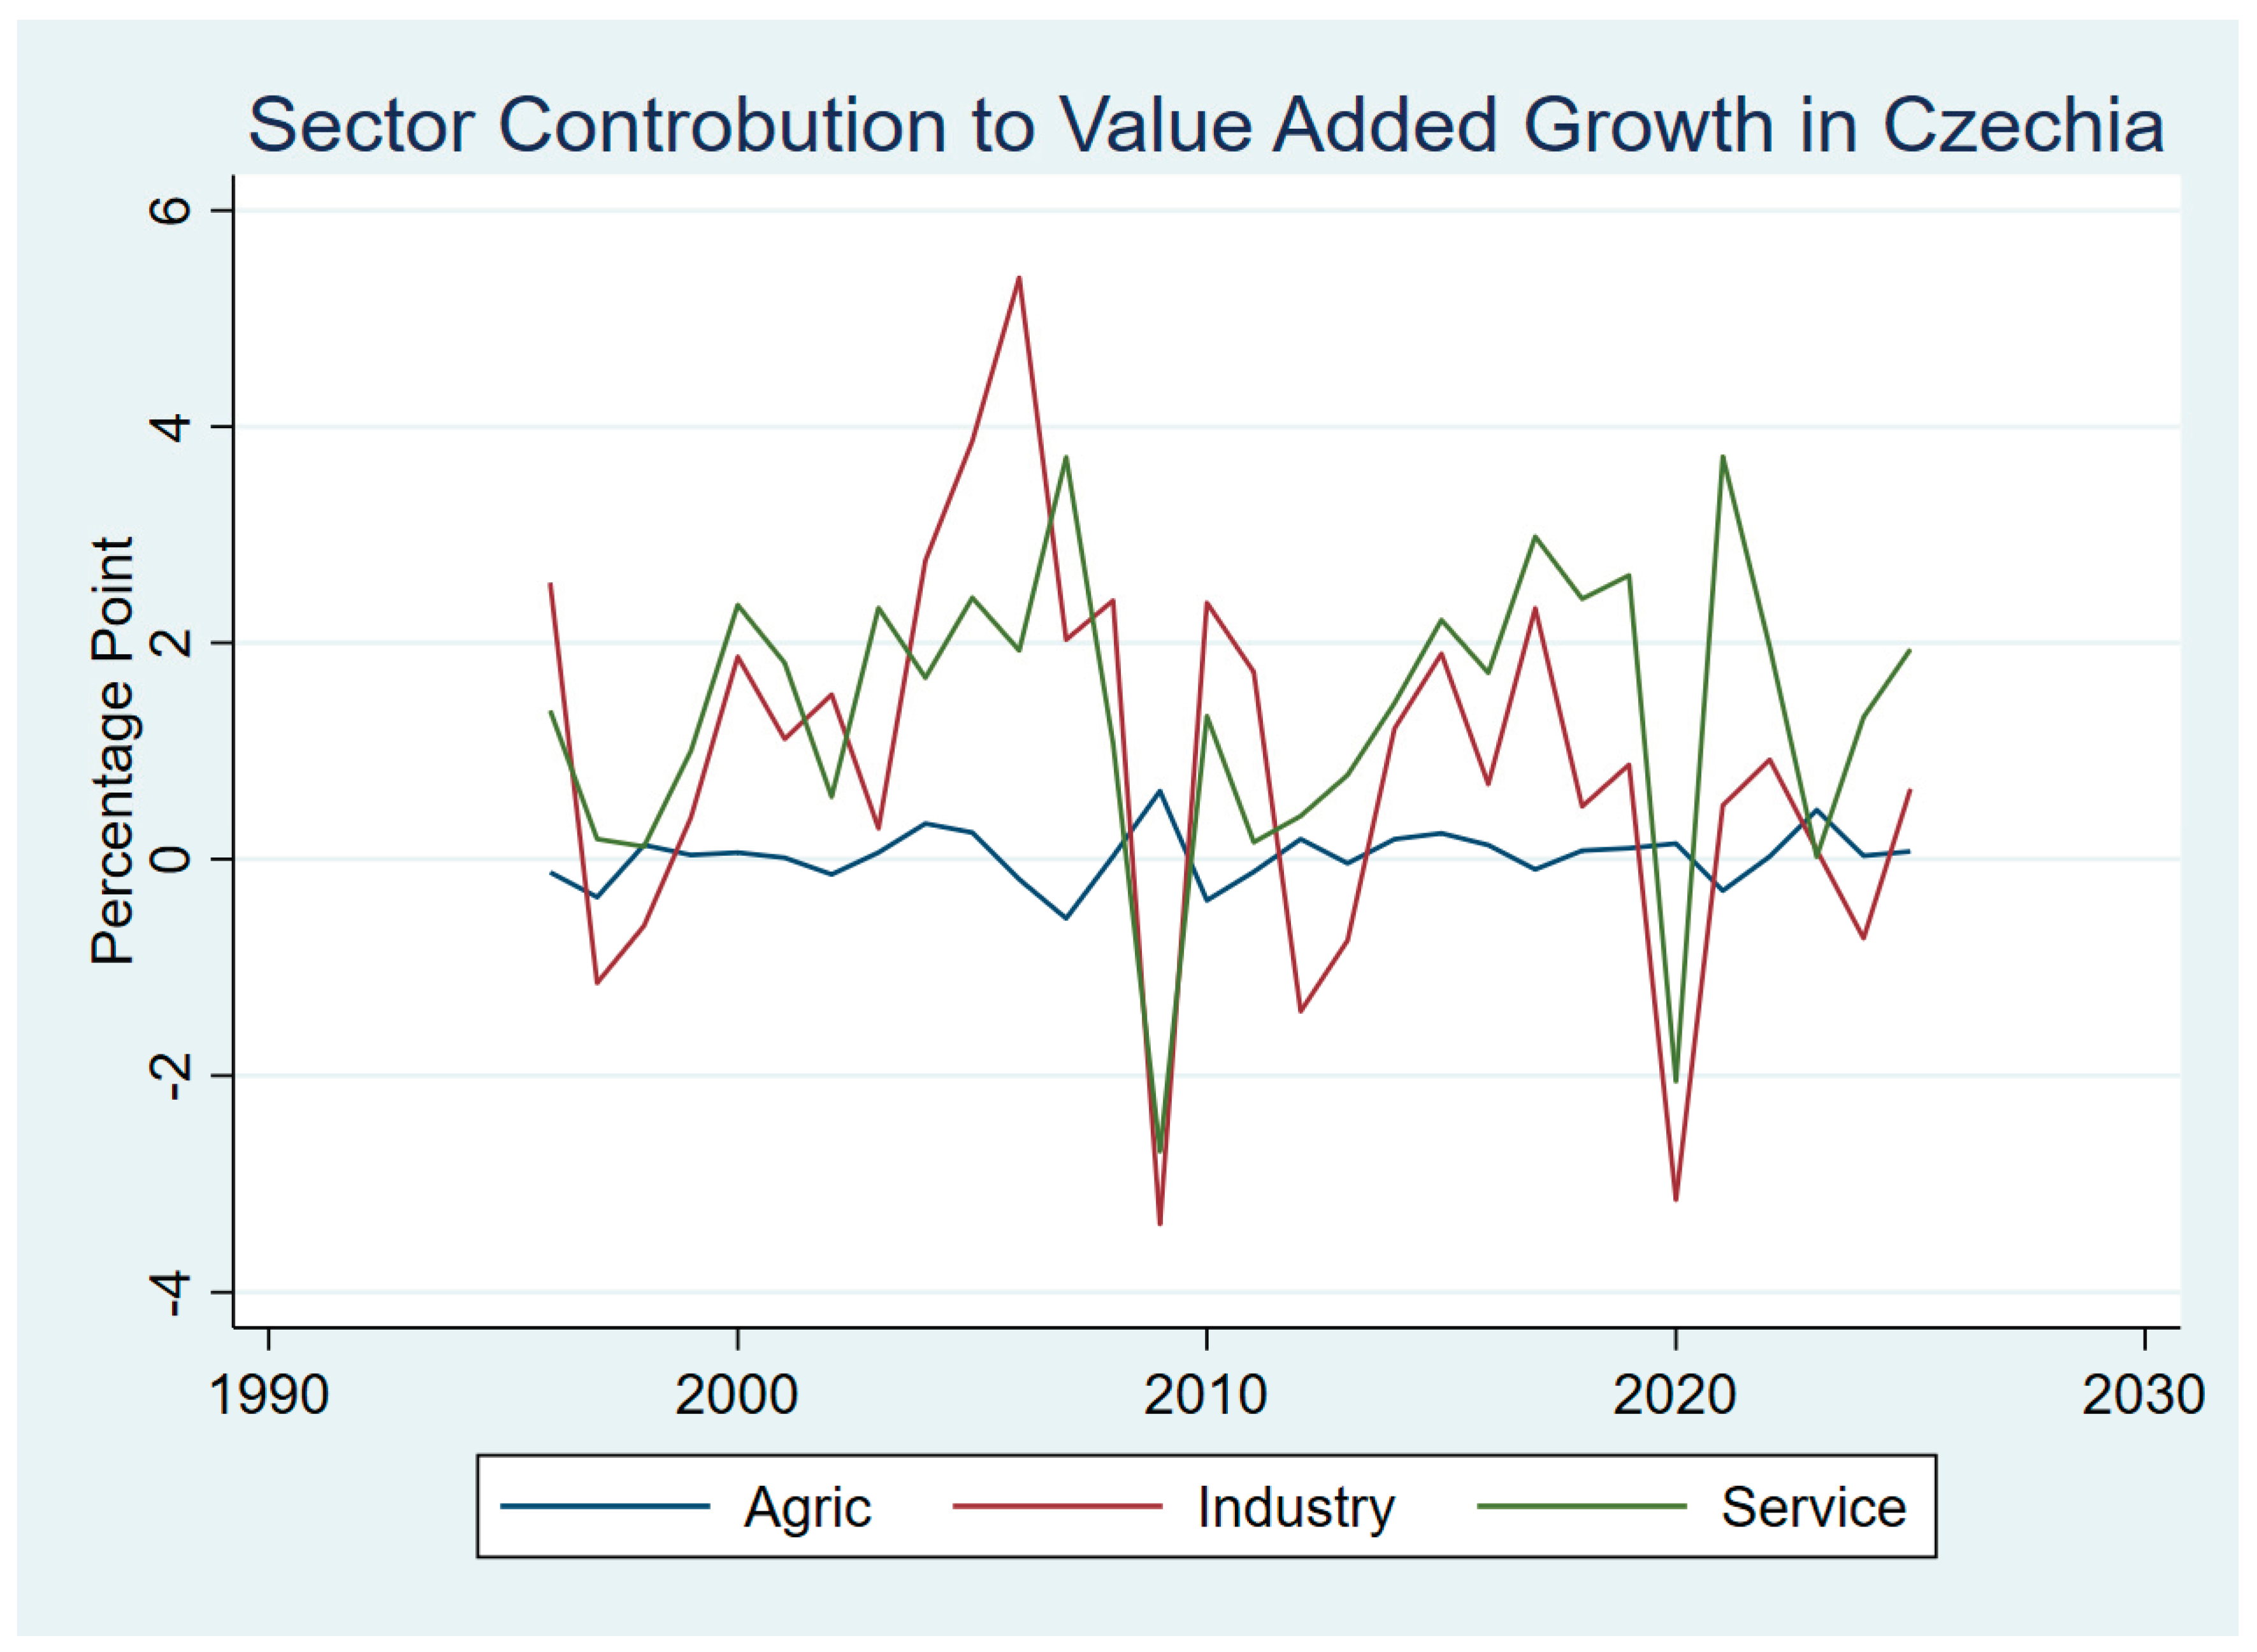
Figure 2.
Sector Contribution to Value Added Growth in Hungary Source: Author’s own work data.
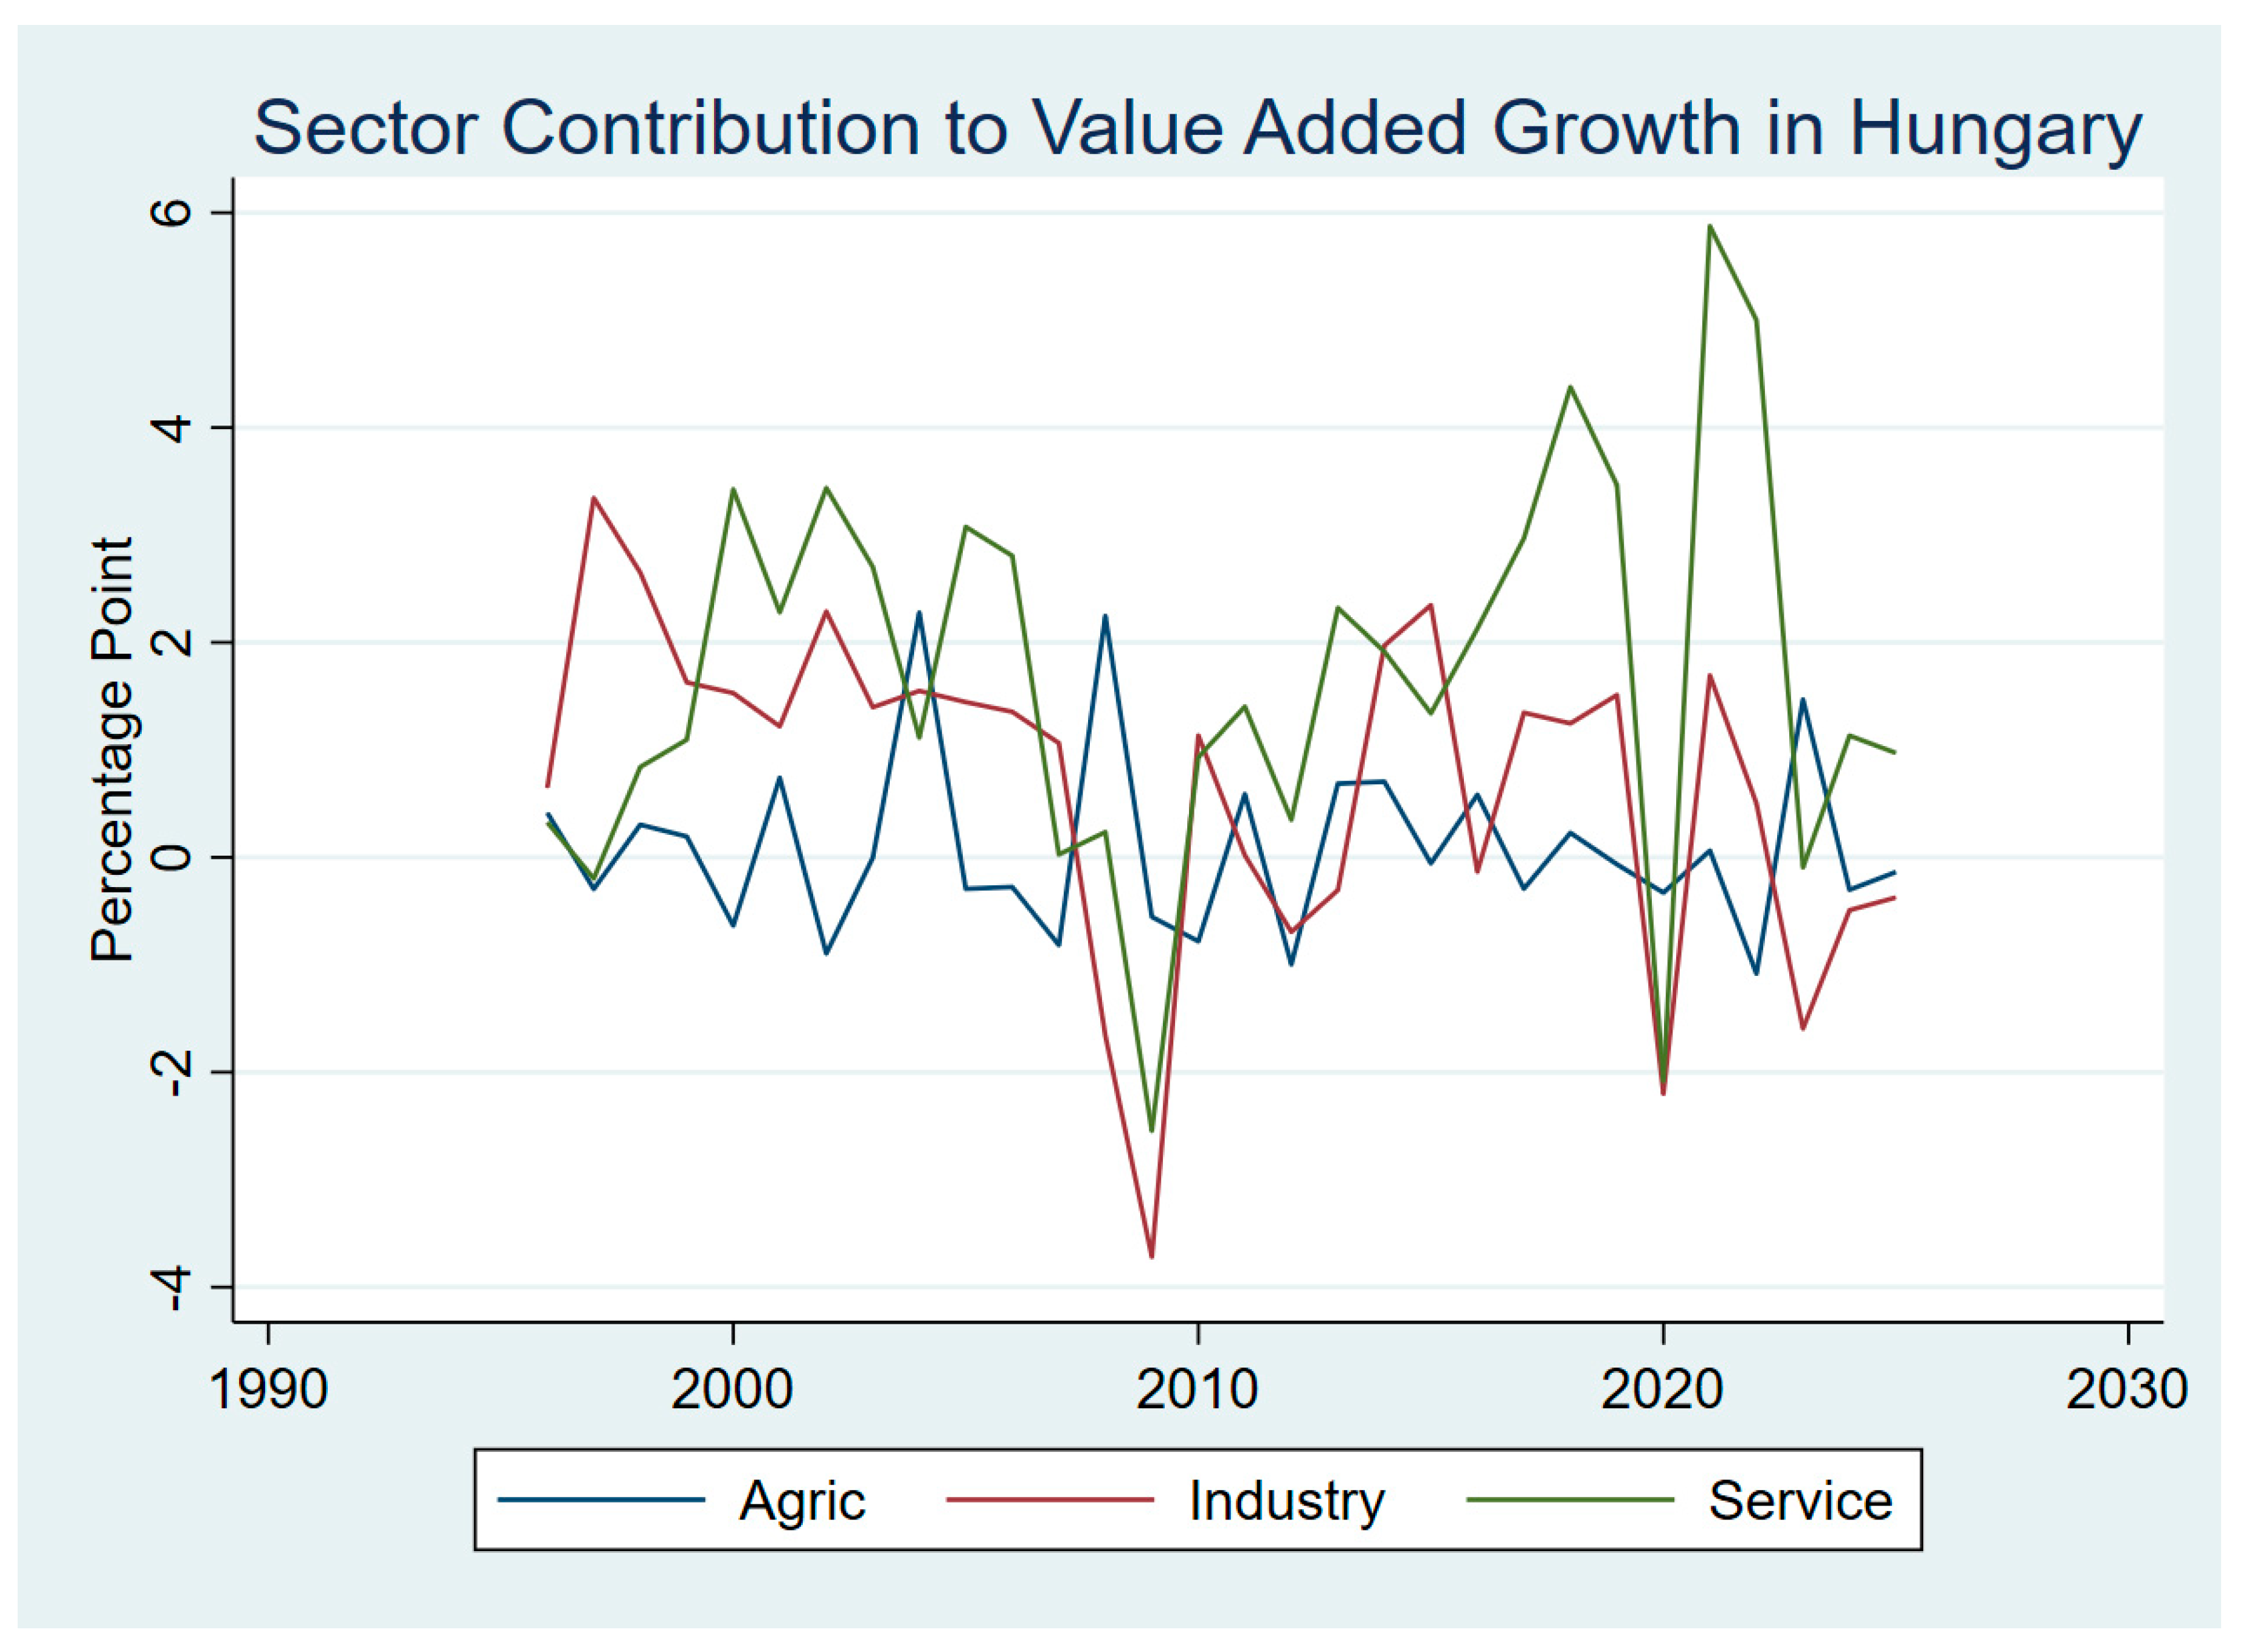
Figure 3.
Contribution of Industrial Sectors to Value Added Growth in Czechia and Hungary Source: Author’s own work data.
Figure 3.
Contribution of Industrial Sectors to Value Added Growth in Czechia and Hungary Source: Author’s own work data.
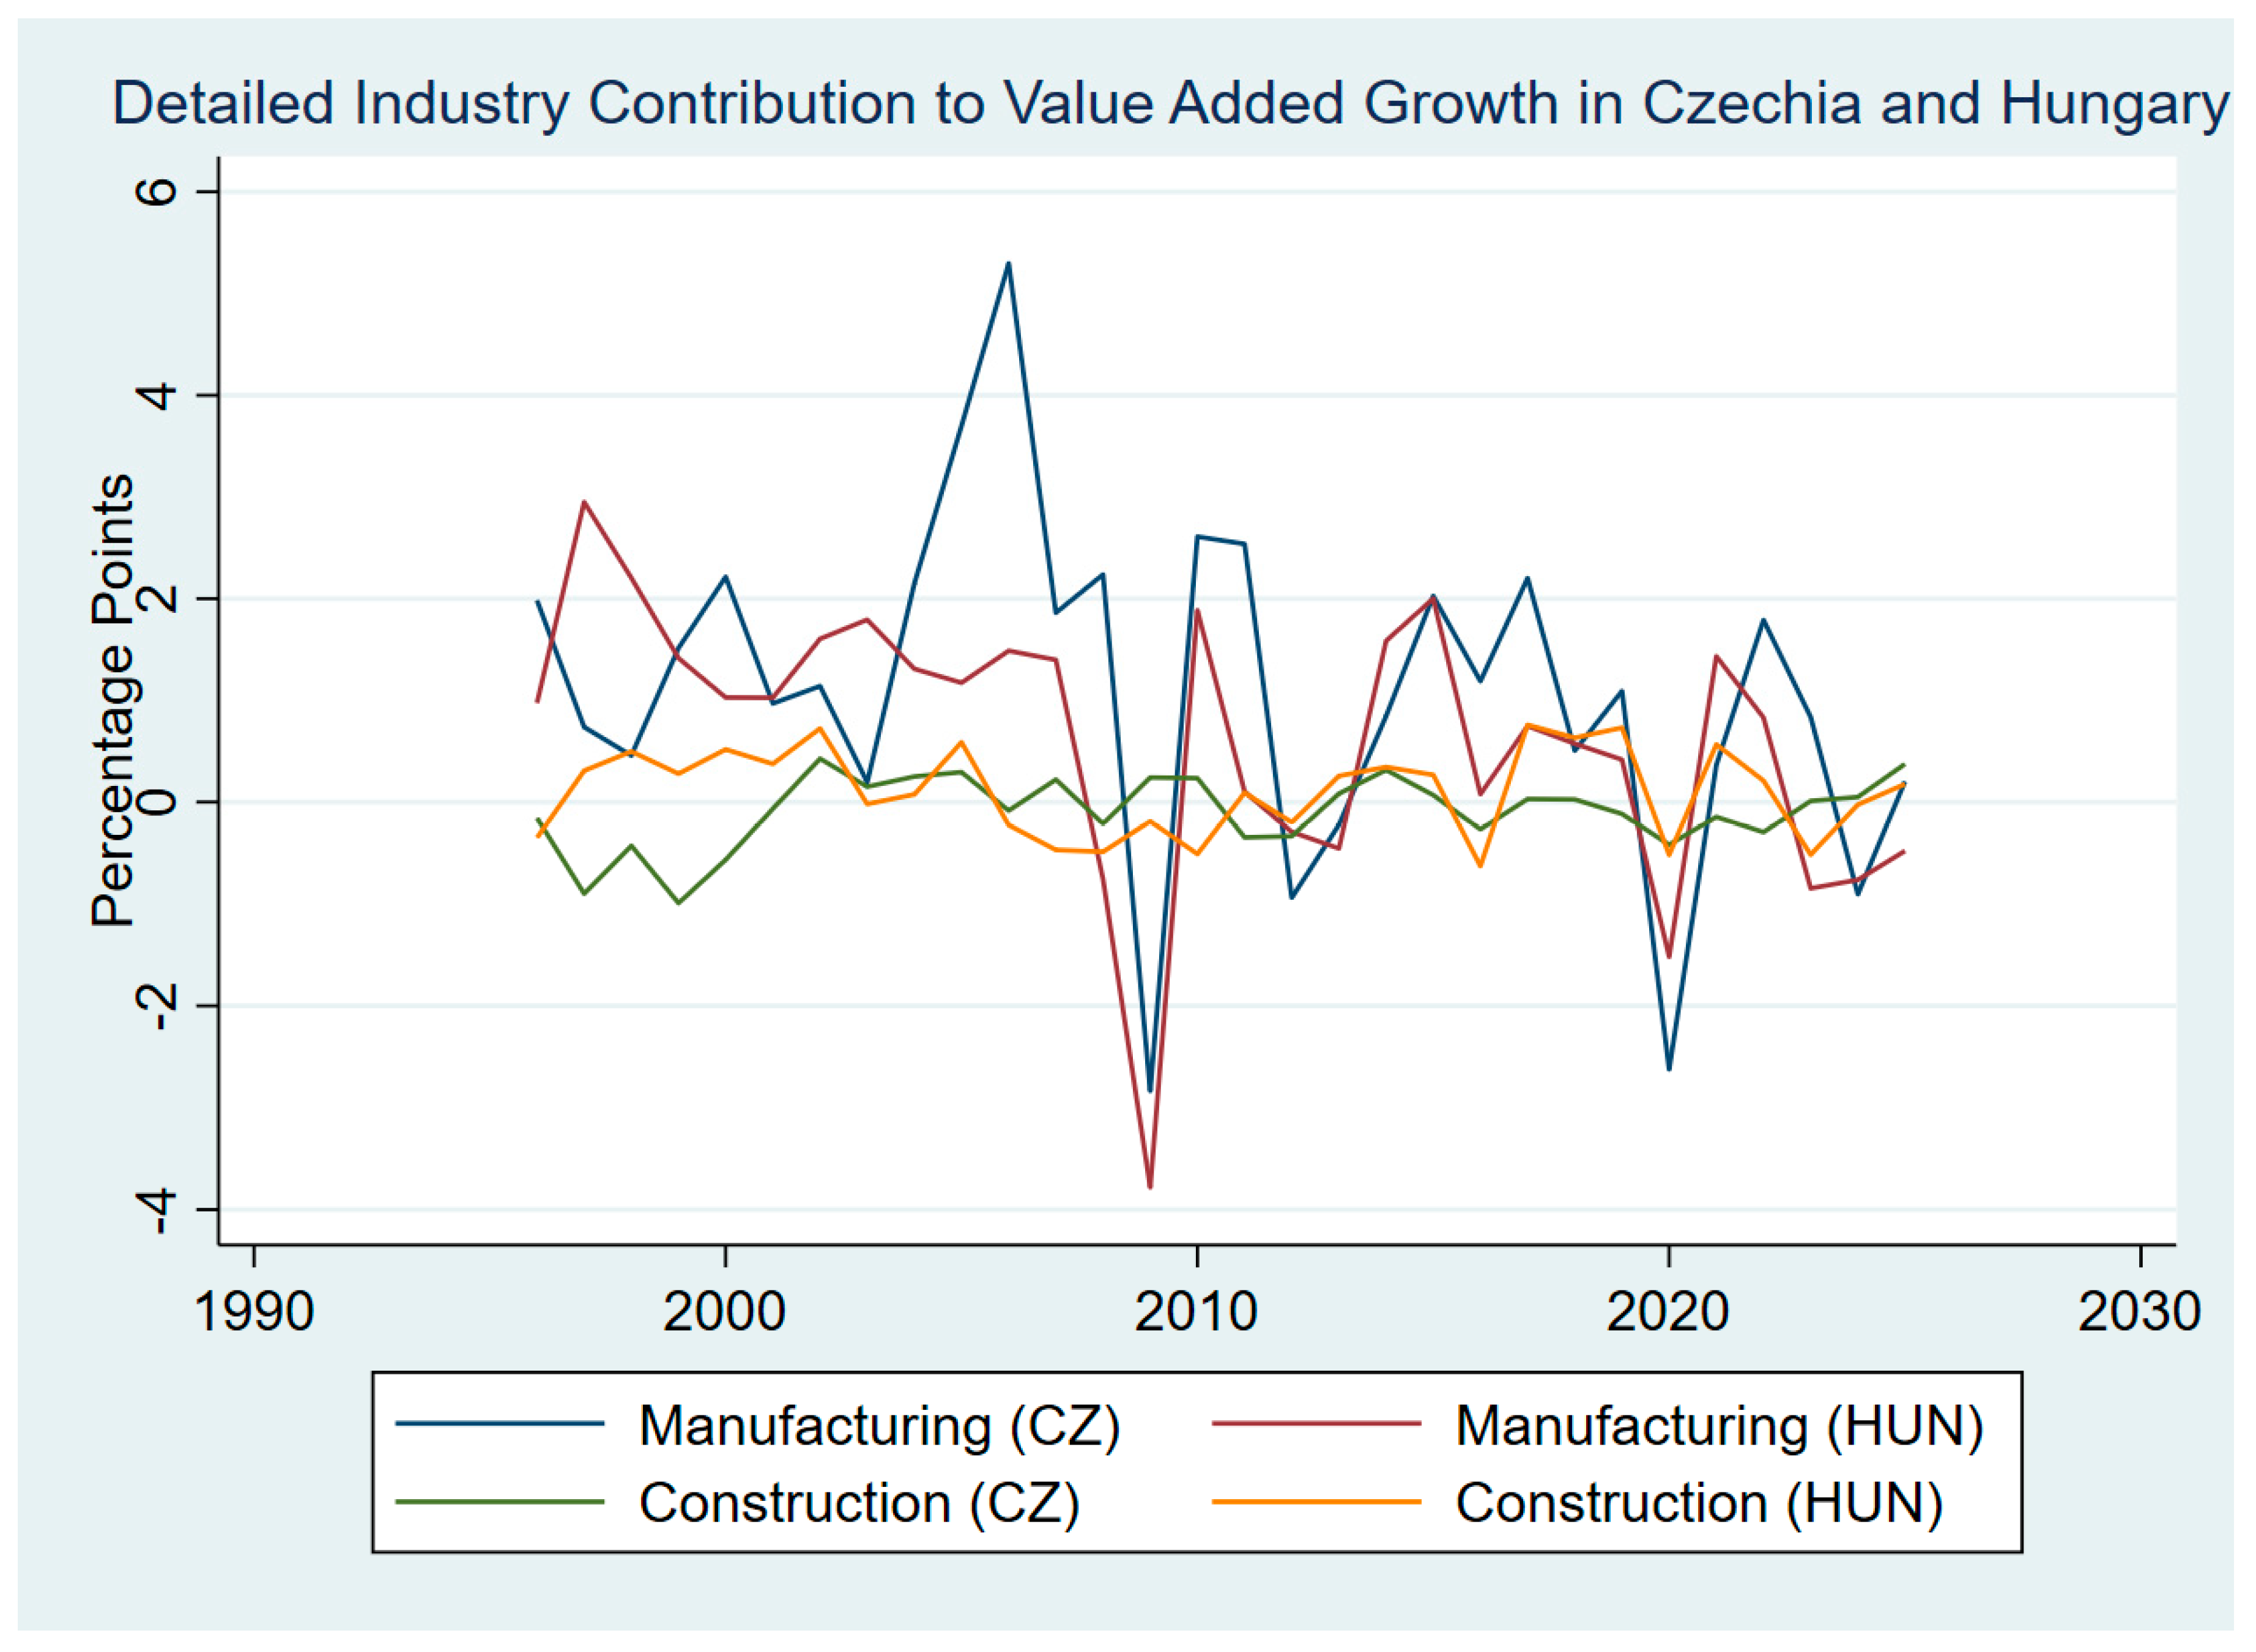
Figure 5.
Contribution of Services Sectors to Value Added Growth in Hungary Source: Author’s own work data.
Figure 5.
Contribution of Services Sectors to Value Added Growth in Hungary Source: Author’s own work data.
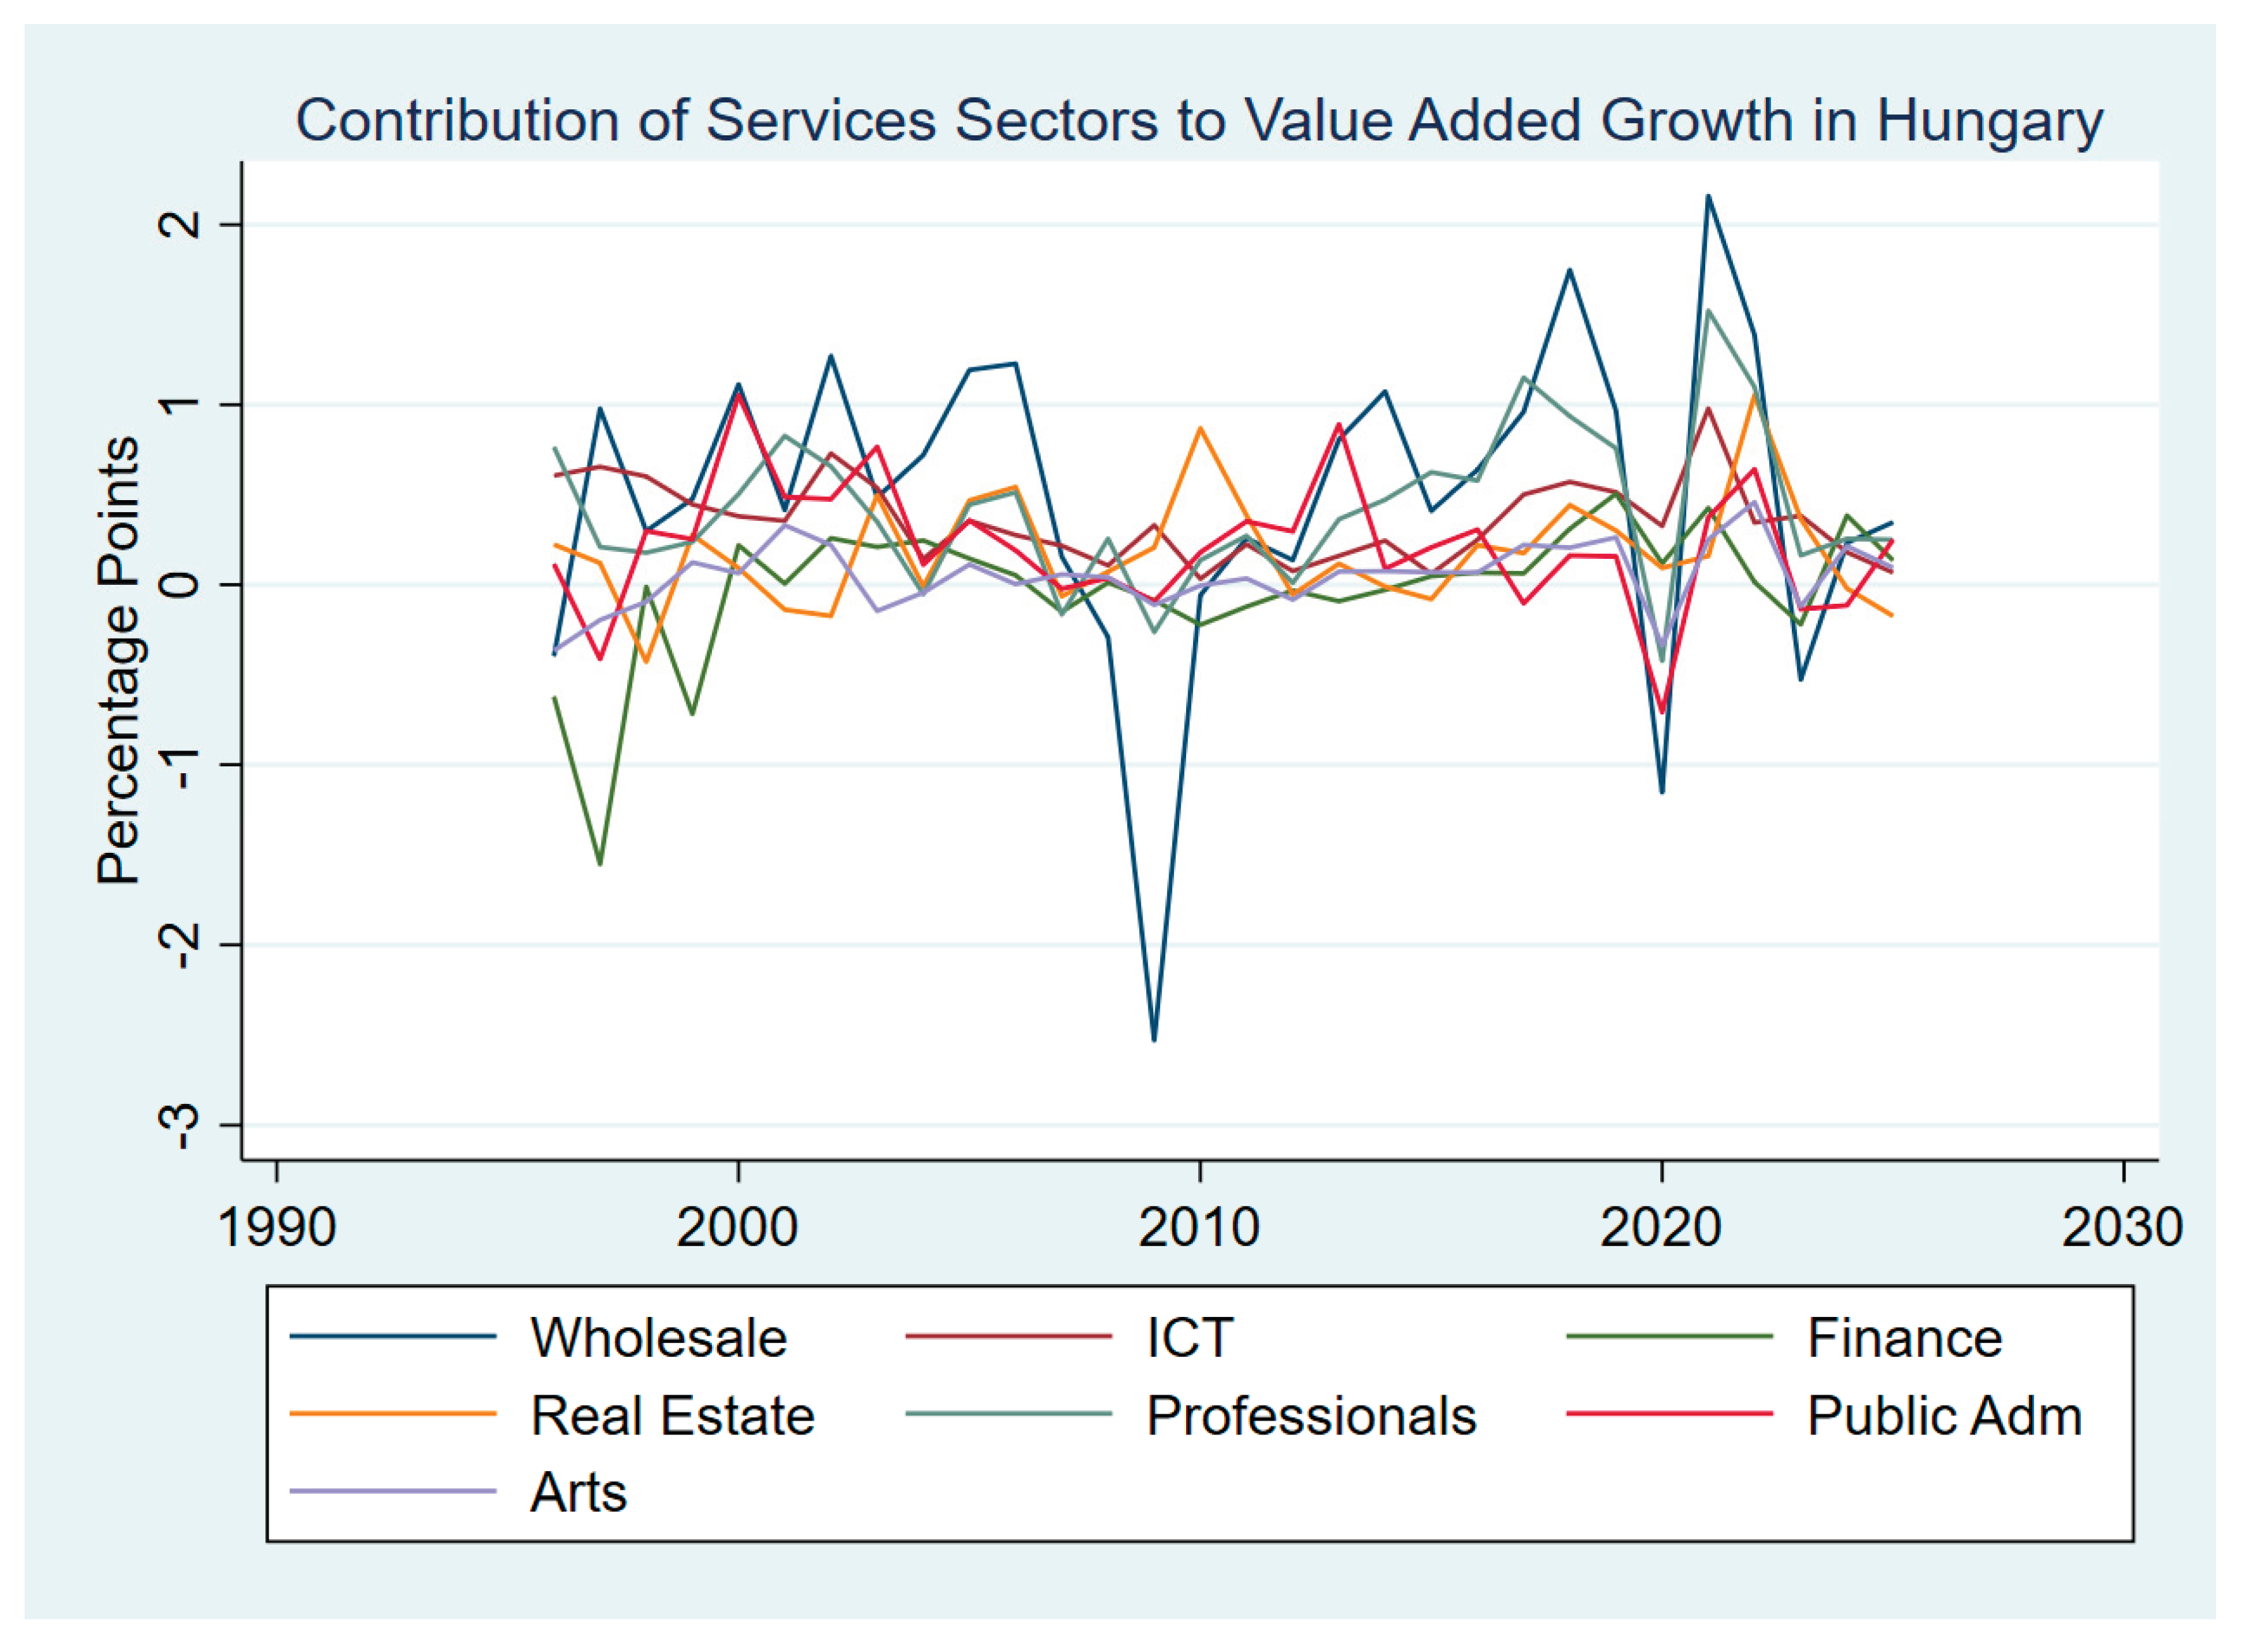

Table 1.
Sectoral Classification.
| Industry | Economic Activities |
| 1. Agriculture |
|
| |
| 2. Mining |
|
| |
| |
| 3. Manufacturing |
|
| |
| |
| |
| |
| |
| |
| |
| |
| |
| |
| |
| |
| |
| |
| |
| |
| 4. Electricity |
|
| 5. Water |
|
| 6. Construction |
|
| 7. Wholesale |
|
| 8. Transport |
|
| |
| |
| |
| |
| 9. Accommodation |
|
| 10. Information and communication |
|
| |
| |
| 11. Financial services |
|
| 12. Real estate |
|
| 13. Public administration |
|
| |
| |
| 14. Education |
|
| |
| |
| 15. Other services |
|
Source: Author’s work using OECD.
Table 2.
Output and income multipliers Pre-EU Accession.
| Czechia | Hungary | |||
| Industry | OM | IM | OM | IM |
| Agriculture, forestry and fishing | 1.31 | 1.32 | 1.37 | 1.31 |
| Mining and quarrying | 1.05 | 1.48 | 1.06 | 1.19 |
| Manufacturing | 1.37 | 1.88 | 1.59 | 1.26 |
| Electricity, gas, steam and air conditioning supply | 1.78 | 2.05 | 2.21 | 1.40 |
| Water supply; sewerage; waste management and remediation activities | 1.61 | 1.93 | 1.24 | 1.31 |
| Construction | 1.66 | 1.42 | 1.28 | 1.24 |
| Wholesale and retail trade; repair of motor vehicles and motorcycles | 1.99 | 1.34 | 1.31 | 2.03 |
| Transporting and Communication | 1.78 | 1.32 | 1.24 | 1.76 |
| Accommodation and food service activities | 1.93 | 1.48 | 1.36 | 1.40 |
| Information and communication | 1.83 | 1.50 | 1.84 | 1.51 |
| Financial and insurance activities | 1.88 | 1.42 | 2.15 | 1.84 |
| Real estate activities | 1.78 | 1.88 | 1.62 | 1.53 |
| Public administration and defense; compulsory social security | 1.03 | 1.92 | 1.08 | 1.06 |
| Education | 1.35 | 1.43 | 1.61 | 1.41 |
| Other services activities | 1.46 | 1.01 | 1.13 | 1.28 |
Source: Author’s own work.
Table 3.
Output and Income Multipliers Post-EU Accession.
| Czechia | Hungary | |||
| Industry | OM | IM | OM | IM |
| Agriculture, forestry and fishing | 2.92 | 1.77 | 2.34 | 2.24 |
| Mining and quarrying | 1.36 | 1.61 | 1.23 | 1.15 |
| Manufacturing | 2.97 | 2.13 | 2.97 | 2.96 |
| Electricity, gas, steam and air conditioning supply | 2.91 | 2.61 | 2.37 | 2.73 |
| Water supply; sewerage; waste management and remediation activities | 2.32 | 2.59 | 2.62 | 2.82 |
| Construction | 2.47 | 2.86 | 2.22 | 2.21 |
| Wholesale and retail trade; repair of motor vehicles and motorcycles | 2.84 | 2.76 | 2.59 | 2.02 |
| Transporting and Communication | 2.12 | 2.72 | 2.25 | 2.89 |
| Accommodation and food service activities | 1.95 | 1.61 | 1.43 | 1.25 |
| Information and communication | 2.51 | 2.69 | 2.06 | 2.42 |
| Financial and insurance activities | 2.68 | 2.68 | 2.85 | 2.09 |
| Real estate activities | 2.07 | 2.76 | 2.12 | 2.96 |
| Public administration and defense; compulsory social security | 1.88 | 1.26 | 1.66 | 1.85 |
| Education | 1.94 | 1.88 | 1.32 | 1.66 |
| Other services activities | 2.57 | 1.42 | 1.56 | 1.33 |
Source: Author’s own work.
Table 4.
Backward and forward linkages Pre- EU Accession.
| Czechia | Hungary | |||
| Industry | BL | FL | BL | FL |
| Agriculture, forestry and fishing | 1.06 | 1.76 | 1.12 | 1.18 |
| Mining and quarrying | 0.78 | 0.28 | 0.85 | 0.12 |
| Manufacturing | 1.94 | 2.05 | 1.42 | 2.14 |
| Electricity, gas, steam and air conditioning supply | 1.32 | 1.49 | 1.03 | 2.26 |
| Water supply; sewerage; waste management and remediation activities | 1.93 | 1.06 | 1.26 | 2.07 |
| Construction | 1.87 | 1.5 | 2.07 | 1.45 |
| Wholesale and retail trade; repair of motor vehicles and motorcycles | 1.75 | 1.38 | 2.07 | 1.65 |
| Transporting and Communication | 1.71 | 1.46 | 1.46 | 1.28 |
| Accommodation and food service activities | 1.34 | 1.8 | 1.61 | 1.93 |
| Information and communication | 1.97 | 2.09 | 1.35 | 2.16 |
| Financial and insurance activities | 1.23 | 1.35 | 1.48 | 1.54 |
| Real estate activities | 1.17 | 1.29 | 1.52 | 1.44 |
| Public administration and defense; compulsory social security | 1.16 | 1.15 | 1.27 | 1.19 |
| Education | 1.23 | 1.24 | 1.30 | 1.08 |
| Other services activities | 1.37 | 1.21 | 1.17 | 1.13 |
Source: Author’s own work.
Table 5.
Backward and forward linkages Post-EU Accession.
| Czechia | Hungary | |||
| Industry | BL | FL | BL | FL |
| Agriculture, forestry and fishing | 1.48 | 2.74 | 1.57 | 2.72 |
| Mining and quarrying | 0.85 | 0.54 | 0.67 | 0.14 |
| Manufacturing | 2.80 | 2.89 | 2.31 | 2.65 |
| Electricity, gas, steam and air conditioning supply | 2.12 | 2.31 | 2.24 | 2.02 |
| Water supply; sewerage; waste management and remediation activities | 2.72 | 2.03 | 2.25 | 2.61 |
| Construction | 2.14 | 2.13 | 2.77 | 2.16 |
| Wholesale and retail trade; repair of motor vehicles and motorcycles | 2.13 | 2.86 | 2.08 | 2.15 |
| Transporting and Communication | 2.52 | 2.03 | 2.47 | 2.69 |
| Accommodation and food service activities | 2.03 | 2.07 | 2.25 | 1.97 |
| Information and communication | 2.18 | 2.69 | 2.74 | 2.46 |
| Financial and insurance activities | 2.43 | 2.32 | 2.35 | 2.41 |
| Real estate activities | 2.61 | 2.19 | 2.19 | 2.58 |
| Public administration and defense; compulsory social security | 1.51 | 1.23 | 1.13 | 1.57 |
| Education | 1.61 | 2.68 | 2.55 | 2.43 |
| Other services activities | 1.97 | 2.05 | 1.78 | 2.51 |
Source: Author’s own work.
Disclaimer/Publisher’s Note: The statements, opinions and data contained in all publications are solely those of the individual author(s) and contributor(s) and not of MDPI and/or the editor(s). MDPI and/or the editor(s) disclaim responsibility for any injury to people or property resulting from any ideas, methods, instructions or products referred to in the content. |
© 2026 by the authors. Licensee MDPI, Basel, Switzerland. This article is an open access article distributed under the terms and conditions of the Creative Commons Attribution (CC BY) license (http://creativecommons.org/licenses/by/4.0/).
Copyright: This open access article is published under a Creative Commons CC BY 4.0 license, which permit the free download, distribution, and reuse, provided that the author and preprint are cited in any reuse.