Submitted:
11 March 2026
Posted:
12 March 2026
You are already at the latest version
Abstract
Background: Tumor microenvironments (TMEs) frequently exhibit extracellular acidity (pH ~6.5), a biophysical feature known to play a critical role in cellular behavior, tumor progression, immune suppression, and altered therapeutic response. While synthetic regulatory circuits capable of sensing acidity have been proposed, quantitative frameworks describing how microenvironmental pH dynamics interact with tumor–immune systems remain limited.
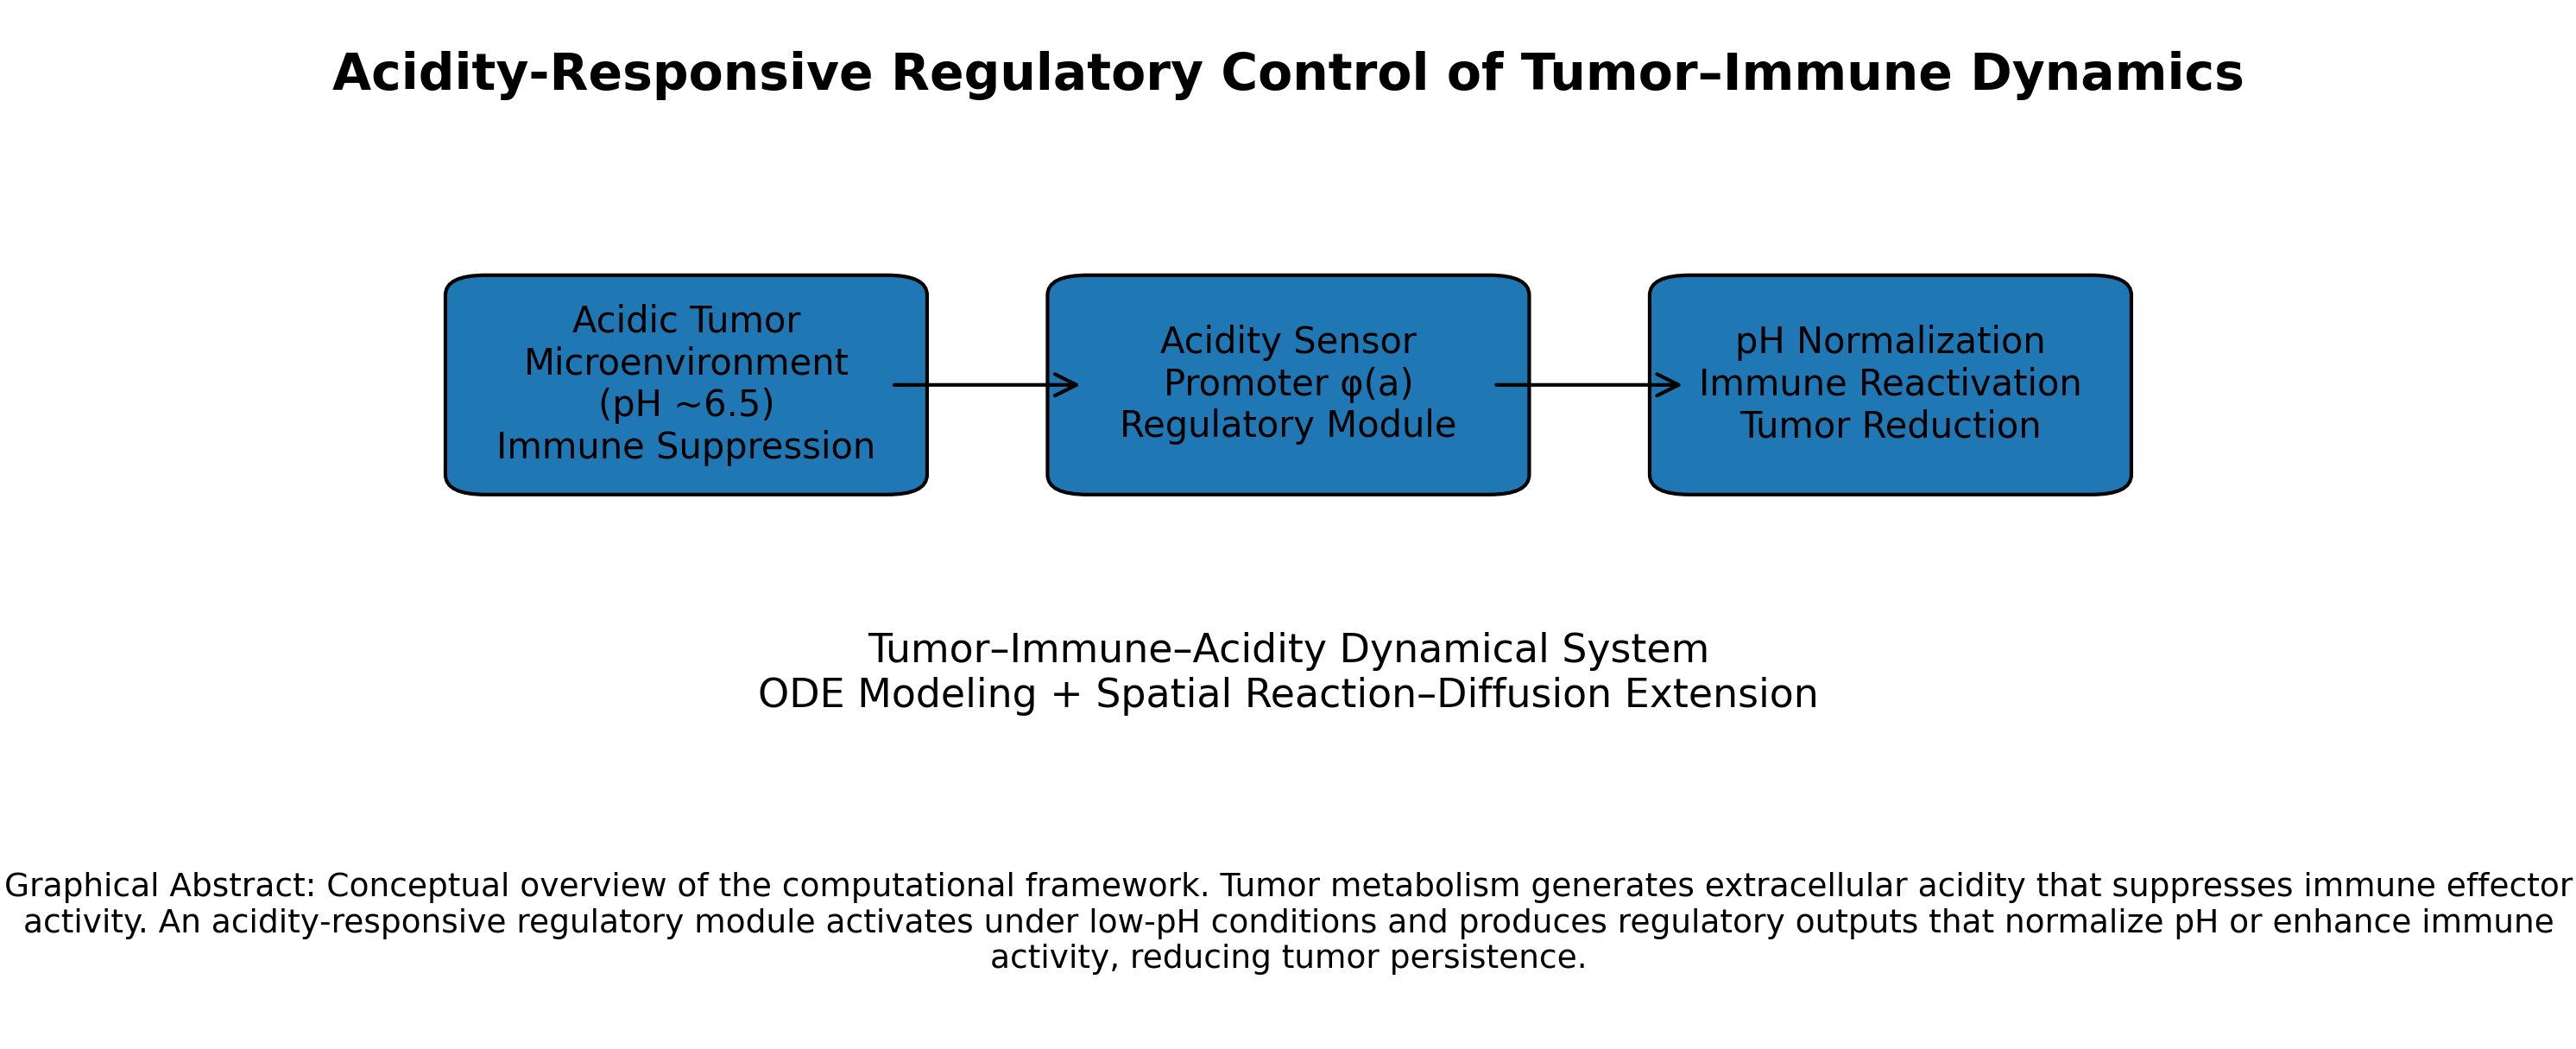
Methods: We developed a computational modeling framework describing acidity-mediated regulatory dynamics in coupled tumor–immune systems. The model integrates interacting processes including tumor population dynamics, effector T-cell activity under acid-dependent suppression, regulatory vector dynamics, pH-responsive promoter activation, buffering or alkalinization mechanisms, cytokine-mediated feedback, and proton concentration kinetics calibrated to physiological pH ranges (6.0–7.4). Alternative acidity-modulating strategies, including substrate-dependent and substrate-independent buffering mechanisms, were examined through parameter sweeps, sensitivity analysis, and spatial reaction–diffusion extensions. System behavior was analyzed using stability and regime characterization methods.
Results: The model exhibits distinct dynamical regimes in which acidity modulation reshapes tumor–immune interactions. Simulation of the acidity-responsive regulatory module demonstrated that promoter-driven therapeutic activation reduces tumor burden through two mechanistically distinct pathways. The alkalinization strategy elevated steady-state pH (ΔpH ≈ 0.2–0.6), partially restoring immune activity and reducing tumor persistence via microenvironmental feedback. In contrast, immune reactivation enhanced cytotoxic pressure directly, producing more rapid tumor suppression without substantially normalizing extracellular pH. In both architectures, therapeutic output increased under acidic conditions and diminished as pH approached physiologic levels, demonstrating dynamically coupled and self-limiting behavior. Sensitivity and scaling analyses further revealed hierarchical parameter control and architectural differences between substrate-dependent and substrate-independent buffering mechanisms.
Conclusions: This study provides a quantitative theoretical framework for understanding how microenvironmental acidity functions as a regulatory variable in tumor–immune dynamics. The results highlight generalizable principles governing acidity-mediated feedback, system stability, and scaling behavior, offering mechanistic insights relevant to microenvironment-responsive regulatory systems. These findings emphasize the importance of biophysical microenvironmental factors in shaping cellular system dynamics and provide a basis for future experimental investigation of acidity-responsive biological regulation.
Keywords:
tumor microenvironment
; acidity regulation
; synthetic gene circuits
; reaction–diffusion modeling
; dynamical systems biology
; pH-responsive promoters
; systems-level modeling
; microenvironmental feedback
1. Introduction
1.1. Microenvironmental Acidity as a Regulatory Variable in Tumor Systems
Solid tumors develop within microenvironments exhibiting physicochemical properties distinct from those of healthy tissues, among which extracellular acidity is one of the most extensively documented. Measurements across multiple tumor types consistently demonstrate reduced extracellular pH values (≈6.0–6.8) relative to normal physiological conditions (≈7.4), reflecting altered metabolic flux, proton transport, and vascular heterogeneity [1,2,3,4]. Tumor-associated acidosis is now recognized not merely as a metabolic byproduct but as a microenvironmental factor capable of modulating cellular behavior, influencing intercellular interactions, and shaping disease progression [3,5].
Extracellular acidity has been implicated in regulating diverse biological processes, including metabolic adaptation, invasion dynamics, and therapeutic response [5]. Importantly, acidic conditions exert pronounced immunomodulatory effects. Effector immune populations, particularly cytotoxic T lymphocytes, exhibit reduced activation, proliferation, and cytotoxic function under low pH or high lactate environments [6,7,8,9]. Acid-mediated suppression of immune activity provides tumors with a robust mechanism of immune evasion, reinforcing malignant persistence despite otherwise competent immune surveillance mechanisms.
These observations support the interpretation of extracellular acidity as a systems-level regulatory variable influencing the balance between tumor expansion and immune-mediated control.
1.2. Modeling Challenges in Microenvironment–Cellular Interactions
Despite growing recognition of acidity as a critical component of tumor biology, quantitative descriptions of its dynamical interaction with tumor–immune systems remain incomplete. Many mathematical models of tumor growth emphasize cellular kinetics or immune responses in isolation [10,11,12,13], while models of acidity dynamics frequently focus on metabolic or transport mechanisms independently of cellular regulation [1,2,3,4]. Such separation limits mechanistic insight into how physicochemical microenvironmental variables reshape coupled cellular dynamics.
The coupled nature of tumor ecosystems, immune regulation, and microenvironmental fields presents substantial analytical challenges. Environmental variables both influence and are modified by cellular populations, generating nonlinear feedback structures that are difficult to isolate experimentally. Computational modeling therefore provides a tractable framework for investigating regulatory interactions among environmental constraints, cellular dynamics, and emergent system behavior [14,15].
1.3. Acidity-Modulating Strategies and Scaling Constraints
Distinct acidity-modulating mechanisms may produce qualitatively different system-level consequences. Substrate-dependent buffering processes introduce constraints linked to metabolite availability, transport efficiency, and energetic allocation [16,17,18,19]. In contrast, substrate-independent mechanisms may exhibit comparatively scale-independent behavior, as their regulatory capacity is not directly limited by metabolic substrate depletion [20,21].
This distinction has important implications for tumor–microenvironment dynamics. Substrate-dependent buffering strategies couple acidity regulation to metabolic resource pools, potentially introducing nonlinear saturation effects or energetic trade-offs. Substrate-independent approaches, by comparison, may alter regulatory structure without imposing equivalent metabolic constraints.
Such scaling considerations are particularly relevant in systems governed by coupled reaction and diffusion processes, where nonlinear feedback between production, transport, and suppression can generate multiple stability regimes and transition thresholds [14,15]. Differences in regulatory architecture therefore reshape system-level behavior not merely by changing parameter magnitude, but by altering the underlying feedback topology.
1.4. Computational Modeling Framework
We developed a computational modeling framework integrating tumor population dynamics, effector immune activity under acidity-dependent suppression, regulatory feedback variables, proton concentration kinetics, metabolic constraints, and spatial transport processes. The model is formulated to capture generic regulatory interactions rather than reproduce full biological complexity. Parameter ranges were selected to remain consistent with reported physiological pH intervals (6.0–7.4) [1,2,3,4].
System behavior was examined using sensitivity analysis, stability characterization, scaling arguments, and reaction–diffusion extensions.
1.5. Study Objectives and Contributions
This study investigates how microenvironmental acidity functions as a regulatory variable shaping tumor–immune dynamics. Specifically, we:
- Characterize acidity-mediated regulatory regimes governing system stability and persistence behavior.
- Identify key parameters controlling system response under environmental modulation.
- Examine spatial regulatory structure using reaction–diffusion dynamics.
Rather than advancing a specific therapeutic platform, this work provides a quantitative theoretical framework for understanding acidity-mediated regulation in coupled tumor systems.
2. Materials and Methods
2.1. Conceptual Framework
Tumor–immune interactions are strongly influenced by microenvironmental acidity, which modulates immune activation, effector function, and cytokine signaling. Rather than modeling tumor growth and immune response in isolation, we formulated a mechanistic dynamical system in which tumor burden, immune activity, and extracellular acidity co-evolve through nonlinear feedback.
The model was designed to capture three biological principles:
- Tumor cells generate acidity through metabolic activity.
- Acidity suppresses immune activation and effector function.
- Restoration of pH balance may re-enable immune-mediated tumor control.
The system is not intended to represent a specific tumor type, but rather to provide a generalizable computational framework for acidity-responsive tumor–immune dynamics.
2.2. Core Tumor–Immune–Acidity ODE Model
We define three state variables:
- T(t): tumor burden
- E(t): effector immune activity
- a(t): dimensionless acidity proxy
The governing equations are:
where immune suppression by acidity is modeled as
Biological Interpretation
Tumor cells grow logistically with intrinsic growth rate
- and carrying capacity K.
- Immune cells eliminate tumor cells at rate k.
- Immune activation increases with tumor presence but is suppressed by acidity through g(a).
- Tumor burden generates acidity at rate p, while buffering and clearance occur at rate c.
- a50 and n determine the strength and steepness of acidity-mediated immune suppression.
This structure captures immune escape as an emergent consequence of acidity-driven suppression rather than an imposed parameter shift.
Baseline (illustrative, dimensionless; chosen to generate representative regimes)
| Symbol | Meaning | Baseline | Units | Notes |
| Tumor growth rate | 0.25 | 1/day | Logistic growth | |
| Carrying capacity | 1.0 | normalized | Sets tumor scale | |
| Immune kill coupling | 1.2 | 1/(day·E) | Mass-action | |
| Basal immune influx | 0.02 | E/day | Homeostatic input | |
| Tumor-driven immune activation | 0.7 | E/day | Scaled by and | |
| Half-sat for immune activation | 0.10 | T units | Saturating activation | |
| Immune decay | 0.10 | 1/day | Effector turnover | |
| Acidity production strength | 0.60 | a/day | Scaled by | |
| Half-sat for acidity production | 0.15 | T units | Saturating production | |
| Acidity clearance | 0.20 | 1/day | Buffering/clearance | |
| 50% suppression point | 1.5849 | a units | Corresponds to pH50 = 6.8 | |
| n | Hill coefficient | 4.0 | – | Suppression steepness |
| Initial pH (calibration) | 7.0 | pH | Starting condition | |
| Initial acidity proxy | 1.0 | a units | Defines scaling |
Note: is computed via when at . That makes pH thresholds easy to interpret for readers.
Parameter Selection and Biological Justification
Baseline parameter values were selected within biologically plausible ranges reported in the literature for tumor growth kinetics, immune–tumor interaction dynamics, and tumor microenvironment acidity. Logistic tumor growth and mass-action immune cytotoxicity terms follow established mathematical oncology frameworks describing tumor–immune interactions [1,2,3]. Acidity production reflects glycolytic tumor metabolism and proton export mechanisms characteristic of solid tumors [4,5,6]. The immune suppression midpoint parameter () was anchored to extracellular pH values commonly reported in the tumor microenvironment (approximately pH 6.5–7.0), where reduced pH has been shown to impair T-cell activation and effector function [7,8,9]. Because precise kinetic parameters vary across tumor types and experimental systems, the selected baseline values are intended to generate representative dynamical regimes rather than replicate a specific dataset. To ensure qualitative robustness, global sensitivity analysis was performed across wide parameter ranges.
2.3. Acidity-to-pH Calibration
To relate the acidity proxy to physiological pH, we define:
with scaling constant
Thus,
This calibration allows direct comparison of simulated trajectories with experimentally observed tumor microenvironment pH values.
2.4. Therapeutic Extension: Acidity-Responsive Regulatory Module
To explore microenvironment-targeted interventions, we extended the core system to include an engineered regulatory module activated under acidic conditions.
Additional variables:
- V(t): vector or engineered microbial population
- P(t): therapeutic product (e.g., buffer or cytokine)
Vector dynamics:
Therapeutic production:
with acidity-responsive activation:
Two coupling mechanisms were considered:
(A) Alkalinization Mechanism
(B) Immune Reactivation Mechanism
Baseline parameter values for the regulatory module were selected to generate representative dynamical regimes illustrating promoter activation, therapeutic production, and feedback coupling, rather than to replicate a specific experimental system. Parameter magnitudes were chosen to maintain biologically plausible timescales relative to tumor and immune kinetics. Values used in simulations shown in Figure 7 are summarized in Table 2.
2.5. Numerical Implementation
All simulations were performed using an adaptive Runge–Kutta method (Dormand–Prince RK45).
- Relative tolerance: 10−6
- Absolute tolerance: 10−9
- Simulation interval: t ∈ [0, Tfinal]
Parameter sweeps were performed across acidity production rate , immune suppression threshold , and therapeutic strength . Outcome classification was based on tumor burden at final time:
- Clearance: T < 0.05K
- Controlled equilibrium: 0.05K ≤ T < 0.5K
- Escape: T ≥ 0.5K
Equilibria were computed numerically and local stability assessed via eigenvalues of the Jacobian matrix.
2.6. Sensitivity Analysis
Local sensitivity coefficients were calculated using finite-difference perturbations of ±5% around baseline parameter values.
Global sensitivity was assessed using Latin hypercube sampling across biologically plausible parameter ranges. Partial rank correlation coefficients (PRCC) were computed to identify dominant drivers of tumor control.

Table 3.
Parameter ranges used for global sensitivity analysis (Latin hypercube sampling).
| Parameter | Description | Distribution | Lower Bound | Upper Bound | Biological Rationale |
|---|---|---|---|---|---|
| Tumor growth rate | Log-uniform | 0.10 | 0.60 | Range spanning slow to aggressive solid tumor kinetics [1,2,3] | |
| Immune cytotoxic coupling | Log-uniform | 0.40 | 3.00 | Variability in effector-mediated tumor killing [1,2,3] | |
| Basal immune influx | Log-uniform | 0.005 | 0.080 | Homeostatic immune recruitment variability | |
| Tumor-driven immune activation | Log-uniform | 0.10 | 1.80 | Antigenicity-dependent immune activation strength [2] | |
| Half-saturation constant (immune activation) | Log-uniform | 0.03 | 0.30 | Tumor burden required for immune activation | |
| Immune decay rate | Log-uniform | 0.05 | 0.50 | Effector turnover variability | |
| Acidity production strength | Log-uniform | 0.10 | 1.50 | Variation in glycolytic acid generation [4,5,6] | |
| Half-saturation (acidity production) | Log-uniform | 0.03 | 0.30 | Tumor size–dependent acid production | |
| Acidity clearance rate | Log-uniform | 0.05 | 0.60 | Microenvironmental buffering capacity [4,5,6] | |
| 50% immune suppression midpoint | Log-uniform | Corresponding to pH 7.1 | Corresponding to pH 6.5 | Tumor extracellular pH range [7,8,9] | |
| Hill coefficient (suppression steepness) | Uniform | 1.5 | 8.0 | Range of cooperative suppression behaviors |
Global Sensitivity Parameterization
Parameter ranges were selected to span biologically plausible variability reported for tumor growth kinetics, immune–tumor interaction strength, and tumor microenvironment acidity. Log-uniform sampling was used for strictly positive kinetic parameters to avoid bias toward large magnitudes and to ensure balanced exploration across orders of magnitude. The immune suppression midpoint () was varied to correspond to extracellular pH values between 7.1 and 6.5, encompassing the experimentally observed acidity range of solid tumors [7,8,9]. These ranges were intentionally broad to evaluate qualitative robustness rather than fine-tune quantitative predictions. Latin hypercube sampling (n = 300 simulations) was performed, and partial rank correlation coefficients (PRCC) were computed to quantify the relative influence of each parameter on tumor persistence, minimum pH, and tumor burden area under the curve.
3. Results
The results presented below combine numerical simulation and analytical characterization of the tumor–immune–acidity system. We first examine dynamical regimes emerging from the coupled ODE model, followed by parameter landscape analysis and global sensitivity characterization. Spatial and scaling extensions are then explored to investigate regulatory confinement and energetic constraints. Finally, the analytical stability structure of the system is derived to explain the numerical regime transitions observed in the simulations.
3.1. Baseline Tumor–Immune–Acidity Dynamics
Simulation of the core tumor–immune–acidity system revealed that extracellular acidity fundamentally reshapes tumor–immune interaction outcomes. Under baseline parameter values (Table 1), three representative dynamical regimes were observed depending on the relative balance between tumor growth, immune cytotoxicity, and acidity production (Figure 1).
In the tumor escape regime (Figure 1, left), tumor burden approached the carrying capacity, accompanied by progressive acidification of the microenvironment (Figure 1, center) and suppression of effector activity (Figure 1, right). As tumor mass increased, acidity production accelerated, reducing immune activation through the nonlinear suppression function . This feedback loop resulted in sustained immune dysfunction despite the presence of basal immune influx.
At intermediate parameter values, the system converged to a controlled equilibrium (Figure 1, left). In this regime, tumor growth, immune cytotoxicity, and acidity production reached a dynamic balance. Extracellular pH stabilized within a moderately acidic range (Figure 1, right), permitting partial immune activity sufficient to prevent uncontrolled expansion but insufficient for eradication.
When immune activation strength or cytotoxic coupling was increased relative to acidity production, the system transitioned toward tumor clearance (Figure 1, left). In this regime, acidity remained transient and immune-mediated elimination dominated system behavior. Restoration of microenvironmental pH toward near-physiologic values paralleled tumor suppression (Figure 1, right).
Collectively, these results demonstrate that immune escape can emerge as a dynamical consequence of acidity-driven suppression rather than intrinsic immune failure.
3.2. Continuous Modulation of Tumor Persistence by Acidity Production and Immune pH Sensitivity
Systematic variation of acidity production strength () and immune sensitivity to extracellular pH (parameterized by ) revealed continuous modulation of long-term tumor burden rather than abrupt regime switching. Across the explored parameter space, final tumor burden increased monotonically with increasing acidity production and with greater immune sensitivity to acidic conditions (lower ). The resulting parameter landscape reveals graded modulation of long-term tumor burden across the explored acidity–immune sensitivity plane (Figure 2).
Higher values of intensified acid generation by tumor cells, lowering extracellular pH and suppressing immune activation through the nonlinear function . Simultaneously, decreasing shifted the suppression curve such that immune inhibition occurred at milder levels of acidity. The combined effect of these two parameters amplified tumor persistence, even when baseline immune cytotoxic coupling remained unchanged.
Importantly, the relationship was smooth rather than binary. Final tumor burden exhibited a graded increase across the parameter plane, reflecting the continuous nature of acidity-mediated immune suppression. This behavior highlights that tumor control is not solely determined by intrinsic immune strength but is dynamically modulated by microenvironmental conditions.
Although tumor clearance predominated within the examined baseline regime, the gradient structure of the heatmap indicates sensitivity to coordinated parameter shifts. Even modest increases in acidity production or immune susceptibility to low pH produced measurable elevations in residual tumor burden. These findings support the interpretation that extracellular acidity functions as a tunable regulatory variable capable of reshaping tumor–immune equilibrium states.
From a translational perspective, the continuous structure of the parameter landscape suggests that therapeutic buffering or metabolic modulation may not require dramatic parameter shifts to produce clinically meaningful effects. Rather, incremental modulation of microenvironmental acidity could shift system dynamics toward deeper tumor suppression within existing immune control regimes.
3.3. Global Sensitivity Analysis Reveals Hierarchical and Endpoint-Specific Control of Tumor–Immune–Acidity Dynamics
To quantify the relative influence of individual parameters on long-term system behavior, global sensitivity analysis was performed using Latin hypercube sampling across the ranges specified in Table 3. Partial rank correlation coefficients (PRCC) were computed for three outcome metrics: final tumor burden (), minimum extracellular pH (), and tumor area under the curve (AUCT).
Sensitivity of Final Tumor Burden
For , PRCC analysis revealed a hierarchical structure dominated by proliferative and immune cytotoxic parameters (Figure 3). Tumor growth rate () demonstrated the strongest positive association with final tumor burden, confirming its primary role in promoting persistence. In contrast, immune cytotoxic coupling () exhibited the strongest negative correlation, indicating that enhanced immune killing robustly suppresses long-term tumor survival.
Basal immune influx () and immune activation strength () contributed moderate negative associations, supporting their stabilizing influence on tumor control. Parameters governing acidity production () showed positive but comparatively smaller PRCC magnitudes, consistent with their indirect contribution to tumor persistence through immune suppression. Acidity clearance () and the immune suppression midpoint () exerted measurable but secondary effects. Collectively, these results indicate that tumor persistence is primarily governed by the balance between proliferative kinetics and immune cytotoxic capacity, with acidity acting as a modulatory amplifier rather than a dominant independent driver.
While the parameter landscape in Figure 2 demonstrates how acidity production and immune pH sensitivity jointly modulate tumor persistence, it does not reveal which model parameters exert the strongest influence on system outcomes. To quantify the relative importance of individual processes within the coupled tumor–immune–acidity system, we next performed a global sensitivity analysis across biologically plausible parameter ranges (Figure 3).
Endpoint-Dependent Sensitivity Structure
Sensitivity structure differed when alternative outcome metrics were examined (Figure 4). For minimum extracellular pH (), parameters directly regulating acidity dynamics—including acidity production () and clearance (c)—displayed substantially larger PRCC magnitudes than observed for tumor burden metrics. This finding confirms that microenvironmental acidification is governed primarily by intrinsic metabolic and buffering processes.
In contrast, tumor area under the curve (AUCT) exhibited a sensitivity profile closely resembling that of , with tumor growth rate () and immune cytotoxic coupling () remaining dominant contributors. However, acidity production () exerted relatively greater influence on AUC than on final tumor burden, consistent with its cumulative impact over the simulation horizon.
These endpoint-specific differences demonstrate that tumor persistence and microenvironmental acidity, although mechanistically coupled, are regulated by partially distinct parameter hierarchies. Tumor burden metrics are principally controlled by proliferative–immune balance, whereas extracellular pH is governed more directly by metabolic acid production and clearance dynamics. This distributed control architecture underscores the importance of coordinated modulation across multiple regulatory axes in therapeutic strategies targeting tumor–immune–microenvironment interactions.
Because tumor persistence and microenvironmental acidity represent distinct biological outcomes, we next examined whether the relative importance of model parameters differed across alternative endpoints, including minimum extracellular pH and cumulative tumor burden (Figure 4).
3.4. Spatial Confinement of Acidity-Responsive Regulatory Activity
To examine whether acidity-responsive regulation exhibits spatial localization within heterogeneous tumor microenvironments, the ODE framework was extended to a one-dimensional reaction–diffusion formulation. Acidity dynamics were modeled as a diffusion–production–clearance process with regulatory feedback:
where represents acidity-responsive regulatory activity governed by a Hill-type activation function.
A spatially localized tumor distribution generated a corresponding acidity gradient, with lowest pH values confined to the tumor core. Under substrate-independent regulation, regulatory activity increased smoothly in regions of highest acidity, resulting in localized buffering within acidic zones (Figure 5). Regulatory activation decayed toward baseline in regions approaching physiological pH, demonstrating confinement of activity to metabolically perturbed regions.
Substrate-dependent regulation exhibited similar spatial localization but with attenuated magnitude due to progressive substrate depletion. As substrate availability declined, regulatory amplitude decreased across the domain, reducing buffering strength even in highly acidic regions.
These results demonstrate that acidity-responsive regulation does not act uniformly across space but is dynamically confined to regions of microenvironmental perturbation. Confinement emerges naturally from nonlinear activation coupling rather than from externally imposed spatial targeting mechanisms.
Although the analyses above describe temporal system dynamics, tumor microenvironments are spatially heterogeneous and characterized by localized metabolic gradients. To examine whether acidity-responsive regulation becomes spatially confined within such heterogeneous environments, we extended the model to a reaction–diffusion formulation (Figure 5).
3.5. Scaling Behavior of Substrate-Dependent and Substrate-Independent Buffering
To investigate scaling properties of regulatory cost and efficacy, simulations were performed across increasing maximal regulatory strength (). For each configuration, cumulative regulatory cost was quantified as the space–time integral , and efficacy was measured as improvement in minimum extracellular pH relative to the no-regulation baseline.
Substrate-independent regulation exhibited approximately proportional scaling between cumulative cost and pH improvement across the explored range (Figure 6). Increasing regulatory capacity produced progressively larger buffering effects without intrinsic attenuation.
In contrast, substrate-dependent regulation displayed nonlinear scaling characterized by diminishing returns. As regulatory strength increased, substrate depletion reduced effective activation amplitude, producing sublinear growth in buffering benefit relative to cost. Final substrate levels declined with increasing regulatory intensity, confirming resource-limited behavior.
These results provide quantitative evidence supporting the conceptual distinction between substrate-dependent and substrate-independent regulatory architectures. Whereas substrate-independent mechanisms exhibit effectively scale-invariant cost–effect relationships within the tested range, substrate-dependent strategies introduce nonlinear saturation arising from energetic or metabolite constraints.
Collectively, the spatial and scaling analyses extend the ODE findings by demonstrating that regulatory architecture shapes not only temporal tumor dynamics but also spatial confinement patterns and energetic scaling behavior.
Beyond spatial confinement, the architecture of acidity-responsive regulation may also influence the energetic scaling properties of buffering interventions. We therefore examined how regulatory cost and buffering efficacy change as maximal regulatory capacity increases (Figure 6).
3.6. Dynamics of the Acidity-Responsive Regulatory Module
To evaluate the behavior of the acidity-responsive regulatory extension introduced in Section 2.4, we simulated the full tumor–immune–acidity system augmented with vector population , promoter activation function , and therapeutic output . Three scenarios were examined: (i) no regulation (baseline), (ii) alkalinization module, and (iii) immune reactivation module. Parameter values for the regulatory module are provided in Table 2.
In the absence of regulation, tumor growth progressively increased extracellular acidity, leading to sustained immune suppression and establishment of a high-tumor equilibrium. This regime corresponds to effective immune control below the stability threshold identified analytically in Section 4.
Under the alkalinization module, promoter activation increased as extracellular acidity rose, leading to production of therapeutic output that reduced acidity via negative feedback on the acid balance equation. This buffering effect elevated steady-state pH, partially restored immune efficacy, and reduced tumor burden relative to baseline. The regulatory response remained dynamically coupled to acidity levels, with therapeutic output diminishing as pH approached near-physiologic values, demonstrating self-limiting behavior.
Under the immune reactivation module, therapeutic output directly enhanced immune effector activity without directly altering acidity dynamics. This intervention increased cytotoxic pressure on the tumor, resulting in reduced tumor burden despite persistent acid production. Compared to alkalinization, immune reactivation produced more rapid tumor suppression but did not substantially normalize extracellular pH.
Collectively, these simulations demonstrate that the regulatory module behaves as an acidity-responsive feedback controller. Activation occurs preferentially in metabolically perturbed states, and therapeutic output dynamically attenuates as the system approaches immune-controlled equilibria. Importantly, both regulatory architectures shift the effective immune control ratio toward the stable regime predicted by Proposition 1, but through distinct mechanistic pathways—either by restoring microenvironmental conditions or by amplifying immune cytotoxicity directly.
The spatial and scaling analyses above characterize the general properties of acidity-responsive regulatory mechanisms. To examine how such regulatory architectures influence full tumor–immune dynamics, we next simulated the extended system incorporating the engineered regulatory module described in Section 2.4 (Figure 7).
Figure 7.
Dynamics of an Acidity-Responsive Regulatory Module in Tumor–Immune–Microenvironment Coupling. Time-course dynamics of the tumor–immune–acidity system with and without the regulatory module. Upper Left — Tumor Burden (T). Temporal evolution of normalized tumor population under no regulation (gray), alkalinization module (blue), and immune reactivation module (red). In the absence of regulation, tumor burden progresses toward a high-tumor equilibrium. Both regulatory strategies reduce steady-state tumor levels, with immune reactivation producing more rapid cytotoxic suppression. Upper Right — Extracellular pH. Evolution of calibrated extracellular pH corresponding to acidity dynamics. Baseline simulations exhibit progressive acidification. The alkalinization module elevates steady-state pH through negative feedback on acidity production, whereas the immune reactivation module produces only modest pH recovery by reducing tumor-driven acid generation indirectly. Lower Left — Vector Population (V). Dynamics of the regulatory vector population. In regulated scenarios, vector expansion follows logistic growth and remains active under sustained acidic conditions. No vector activity is present in the baseline condition. Lower Right — Therapeutic Output (P). Production of regulatory output driven by acidity-dependent promoter activation ϕ(a). Therapeutic output increases in response to elevated acidity and diminishes as the system approaches regulated equilibria, demonstrating dynamically coupled and self-limiting behavior. Solid lines represent deterministic model trajectories for each scenario.

These numerical behaviors suggest that tumor persistence and immune escape arise from shifts in the effective immune control threshold induced by acidity-mediated suppression. To formalize this interpretation, we next analyze the equilibrium structure and stability properties of the core tumor–immune–acidity system.
4. Analytical Stability Analysis of the Core Tumor–Immune–Acidity System
To complement the numerical simulations presented in Section 3, we analyze the equilibrium structure and local stability of the core tumor–immune–acidity model introduced in Section 2.2. The state variables are tumor burden , effector immune activity , and extracellular acidity proxy . The governing system is
where acidity-mediated immune suppression is described by
All parameters retain the definitions provided in Section 2.2. In particular, denotes acidity production strength and denotes the half-saturation constant governing tumor-driven acid generation.
4.1. Equilibrium Points
Tumor-Free Equilibrium
Setting yields
Thus the tumor-free equilibrium is
Tumor-Present Equilibria
For , steady states satisfy
From the acidity equation,
From the immune equation,
Substituting into the tumor steady-state condition yields the implicit scalar equation
This expression demonstrates that acidity influences equilibrium structure only through the nonlinear suppression function .
4.2. Stability of the Tumor-Free Equilibrium
Linearizing the tumor equation around for small T,
Thus, the tumor-free equilibrium is locally asymptotically stable if
or equivalently,
Definition (Baseline Immune Control Ratio)
Define the dimensionless immune control ratio
Then:
- If Ξ > 1, the tumor-free equilibrium is stable.
- If Ξ < 1, tumor invasion occurs.
This threshold depends solely on intrinsic tumor growth and basal immune tone.
4.3. Acidity-Modulated Immune Reinforcement
Although the invasion threshold depends on basal immune activity , sustained tumor control depends on tumor-driven immune reinforcement. From the immune equation,
Because decreases monotonically with increasing acidity, larger reduces tumor-driven immune amplification.
Using the quasi-steady acidity expression,
the suppression factor becomes
Thus, increases in acidity production or decreases in clearance reduce immune reinforcement strength by lowering .
4.4. Effective Immune Gain and Control Boundary Shift
An effective immune gain can be defined as
This leads to an effective control ratio
Because is decreasing in , higher acidity lowers , shifting the system toward tumor persistence.
Importantly, acidity does not alter intrinsic tumor growth rate . Instead, it modifies immune gain through nonlinear feedback, reshaping the stability landscape without introducing new proliferative mechanisms.
4.5. Feedback Structure and Regime Transitions
The coupled feedback loop can be summarized as
For sufficiently strong acidity production , weak clearance , or steep suppression (large ), this loop can support high-tumor equilibria and, in some parameter regimes, multistability.
4.6. Local Stability Structure
Local stability of the interior equilibrium is governed by eigenvalues of the full Jacobian matrix:
Because acidity dynamics enter immune suppression but not directly tumor growth, the system exhibits hierarchical coupling:
Tumor ↔ Immune
Tumor → Acidity → Immune
This structure implies that metabolic regulation modifies immune feedback loops without directly altering proliferative kinetics.
Consequently:
- Stability transitions occur primarily through shifts in effective immune gain.
- Increasing acidity production p or reducing clearance lowers effective immune reinforcement.
- Large Hill coefficient increases nonlinear gain and may introduce bistability or oscillatory transients.
These analytical results align with the continuous regime transitions observed in numerical simulations (Section 3.1, Section 3.2 and Section 3.3).
4.7. Bifurcation Structure and Regime Transitions
The baseline immune control condition derived in Section 4.2,
defines the invasion threshold in the absence of sustained acidity. However, as shown in Section 4.4, tumor-driven immune reinforcement is multiplicatively suppressed by the nonlinear function . An effective immune control ratio incorporating this suppression can therefore be defined as
where denotes the steady-state acidity associated with tumor burden , and captures the degree of acidity-mediated suppression.
Because steady-state acidity satisfies
increasing acidity production strength or decreasing clearance elevates , reduces , and lowers . A stability transition occurs when
corresponding to an exchange of stability between the tumor-free equilibrium and a tumor-present equilibrium. At this threshold the dominant eigenvalue of the linearized tumor equation crosses zero, producing a transcritical bifurcation in which immune control is lost as effective immune gain falls below the proliferative threshold.
For sufficiently large Hill coefficient , the suppression function becomes sharply nonlinear. Combined with the saturating terms in tumor growth and acidity production , this nonlinear feedback can generate multiple interior equilibria. Under these conditions the system may exhibit bistability characterized by:
- a low-tumor, immune-controlled equilibrium, and
- a high-tumor, acid-suppressed equilibrium.
The resulting bifurcation structure depends jointly on proliferative parameters , immune gain parameters , and metabolic parameters . The smooth regime transitions observed numerically in Section 3 are consistent with trajectories crossing this multidimensional bifurcation surface in parameter space.
Importantly, extracellular acidity does not introduce a fundamentally new instability mechanism. Rather, it shifts the immune control boundary continuously by reducing effective immune gain through . In this sense, acidity acts as a modulatory amplifier of proliferative–immune imbalance, reshaping stability regions without altering the intrinsic logistic growth structure of the tumor equation.
4.8. Proposition. Immune Control Threshold Under Acidity-Mediated Suppression
Consider the tumor–immune–acidity system defined in Section 2.2 with immune suppression function
Define the baseline immune control ratio
which represents immune control in the absence of sustained acidity.
Then:
- 1.
- Tumor-Free Stability.
The tumor-free equilibrium is locally asymptotically stable if
- 2.
- Effective Immune Control Under Acidity.
In the presence of steady-state acidity , the effective immune control ratio becomes
Tumor invasion or persistence occurs when
corresponding to loss of stability of the tumor-free equilibrium.
- 3.
- Metabolic Modulation of Stability.
Increasing acidity production strength , decreasing clearance rate , or increasing suppression steepness increases steady-state acidity , reduces , lowers , and shifts the immune control threshold toward instability.
Interpretation
Extracellular acidity does not independently generate tumor growth; rather, it rescales immune control efficacy through the nonlinear suppression function . Tumor persistence emerges when metabolic acidification reduces the effective immune control ratio below unity, producing a stability transition consistent with transcritical bifurcation structure. In this framework, acidity acts as a modulatory amplifier of proliferative–immune imbalance rather than as an independent instability mechanism.
4.9. Bifurcation Interpretation
The stability exchange described in Proposition 1 corresponds to a transcritical bifurcation in which the tumor-free equilibrium loses stability as the effective immune control ratio falls below unity.
As increases:
- Steady-state acidity a* increases.
- Immune suppression strengthens.
- The effective control ratio Ξeff decreases.
- Stability shifts from tumor-free to tumor-present equilibrium.
For sufficiently steep suppression (large Hill coefficient ), the system may exhibit bistability, characterized by coexistence of low-tumor and high-tumor stable equilibria separated by an unstable branch.
The stability conditions derived above imply that progressive metabolic acidification continuously shifts the immune control boundary of the system. To illustrate this transition geometrically, we present a schematic bifurcation diagram showing equilibrium tumor burden as a function of acidity production strength (Figure 8).
The bifurcation structure illustrated in Figure 8 provides a unifying interpretation of the numerical results presented above. Rather than acting as an independent oncogenic driver, extracellular acidity reshapes the immune–tumor balance by continuously shifting the effective immune control threshold. As acidity production increases or buffering capacity declines, the system crosses a stability boundary separating immune-controlled and tumor-persistent regimes. This transition emerges from distributed nonlinear feedback among proliferative, immune, and metabolic processes, consistent with the graded modulation observed in Section 3.1, Section 3.2 and Section 3.3. Importantly, the diagram highlights that tumor escape need not arise solely from intrinsic immune failure; instead, metabolic acidification can rescale immune efficacy sufficiently to alter global system stability. This mechanistic perspective provides a conceptual foundation for interpreting acidity-targeted interventions within a broader regulatory control framework.
5. Discussion
This study develops a mechanistically structured dynamical framework integrating tumor proliferation, immune cytotoxicity, and extracellular acidity within a unified nonlinear regulatory system. By embedding continuous pH-dependent immune suppression directly into tumor–immune interaction kinetics, the model advances beyond descriptive accounts of tumor acidosis and instead formalizes acidity as a dynamically embedded control variable. The combined numerical and analytical results demonstrate that tumor persistence emerges not from isolated proliferative or immune defects, but from distributed nonlinear feedback coupling between metabolic, immune, and growth processes.
Importantly, the analytical threshold and bifurcation structure derived in Section 4 provide formal support for the graded transitions observed numerically. Rather than introducing a fundamentally new instability mechanism, extracellular acidity shifts the effective immune control boundary, modulating the stability landscape of the tumor–immune system.
5.1. Acidity as a Dynamic Regulator of Immune Efficacy
The tumor microenvironment is increasingly recognized as an active regulator of immune behavior. Experimental studies have demonstrated that extracellular acidosis impairs T-cell activation, cytokine secretion, metabolic fitness, and cytotoxicity [1,2,3,4], while lactate accumulation further reinforces immunosuppressive phenotypes [5,6,7]. Despite this, most mechanistic discussions treat acidity as a qualitative inhibitory factor rather than as a quantitatively embedded regulatory component.
In the present framework, acidity enters directly into immune activation kinetics through a nonlinear suppression function, allowing immune efficacy to vary continuously with microenvironmental pH. The resulting dynamics reveal that immune suppression is not binary but graded. As acidity production increases or immune pH sensitivity shifts, the effective immune control ratio decreases smoothly, reshaping equilibrium structure without imposing abrupt regime switching.
This continuous modulation contrasts with modeling approaches that represent immune dysfunction as a static reduction in cytotoxicity [8,9,10]. Instead, the present system demonstrates that metabolic feedback can dynamically rescale immune gain, generating immune escape as an emergent property of metabolic–immune coupling. This distinction is mechanistically important: it implies that immune failure in acidic tumors may be reversible through microenvironmental modulation rather than requiring intrinsic immune reconstitution.
5.2. Distributed and Endpoint-Dependent Control Architecture
Global sensitivity analysis revealed a hierarchical but distributed regulatory structure. Tumor burden metrics were dominated by proliferative and cytotoxic parameters, whereas extracellular pH dynamics were primarily governed by metabolic production and clearance rates. This endpoint-dependent hierarchy clarifies that tumor persistence and microenvironmental acidification, although mechanistically linked, are not governed by identical parameter dominance.
This finding has conceptual implications. If acidity were the primary driver of tumor persistence, metabolic parameters would dominate tumor burden sensitivity. Instead, the results indicate that acidity amplifies pre-existing proliferative–immune imbalance. In control-theoretic terms, metabolic acidosis acts as a gain-modulating component embedded within a larger regulatory network.
Such distributed control architecture aligns with experimental observations that buffering interventions enhance, but rarely replace, immunotherapeutic efficacy [6,13,14,15]. Microenvironmental modulation appears to shift system position within a multidimensional regulatory landscape rather than independently dictating tumor fate.
5.3. Stability Structure and Bifurcation Interpretation
The analytical characterization of the immune control threshold demonstrates that tumor invasion occurs when the effective immune control ratio falls below unity. Increasing acidity production or decreasing clearance shifts this ratio downward, producing a transcritical stability transition between tumor-free and tumor-present equilibria.
For sufficiently steep suppression dynamics, the system may exhibit bistability, allowing coexistence of low-tumor immune-controlled states and high-tumor acid-suppressed states. This structure provides a mechanistic explanation for heterogeneous clinical responses: tumors with similar intrinsic growth rates may occupy distinct stability basins depending on metabolic state and immune competence.
The bifurcation framework therefore reframes tumor acidosis not as a passive metabolic byproduct but as a stability-modifying parameter capable of altering the global attractor landscape of tumor–immune dynamics.
5.4. Translational Implications for Metabolic–Immune Combination Strategies
Microenvironment-targeted strategies—including buffering therapy, glycolytic inhibition, lactate transport blockade, and metabolic reprogramming—are being actively explored in oncology [5,6,7,13,14,15,16]. Clinical responses, however, have been variable.
The present results suggest that therapeutic benefit depends critically on baseline immune gain. Because acidity acts as a multiplicative modifier of immune efficacy, buffering interventions are most effective when immune cytotoxic capacity remains near the control threshold. In severely immune-compromised systems, metabolic correction alone may be insufficient to restore tumor control.
This supports rational combination strategies integrating metabolic modulation with immune checkpoint blockade, adoptive cell therapy, or cytokine-based interventions [14,15,16,17]. Rather than viewing metabolic and immune therapies as independent modalities, the present framework suggests they operate along coupled axes within a shared regulatory landscape.
Additionally, the spatial simulations indicate that acidity-responsive interventions naturally localize to metabolically perturbed regions. This confinement may help minimize systemic toxicity while maximizing intratumoral immune restoration.
5.5. Conceptual Contribution to Tumor Microenvironment Modeling
Beyond translational implications, this work contributes structurally to the modeling literature. Classical tumor–immune models emphasize predator–prey coupling and immune activation kinetics [8,9,10,11,12]. Models incorporating metabolic feedback often treat acidity as an auxiliary variable rather than a dynamically embedded regulator.
By integrating nonlinear acid production, clearance, immune suppression, sensitivity analysis, and bifurcation structure within a single framework, the present study establishes a control-structured perspective on tumor–immune–microenvironment coupling. The model demonstrates that metabolic variables can reshape system stability without directly modifying proliferative equations.
This conceptual shift—from acidity as an oncogenic driver to acidity as a regulatory gain-modulator—may provide a unifying lens for interpreting heterogeneous experimental findings across tumor types.
5.6. Limitations and Future Directions
The current model assumes spatial homogeneity in its core formulation and represents immune dynamics using a single effector compartment. Real tumor microenvironments exhibit spatial heterogeneity, vascular gradients, and diverse immune cell populations. Extending the framework to multi-compartment or agent-based representations could refine predictive resolution and capture immune exclusion phenomena [18,19,20].
Furthermore, metabolic competition between tumor and immune cells, regulatory T-cell dynamics, and cytokine network interactions remain to be incorporated. Incorporating these elements may reveal additional nonlinear behaviors, including oscillatory dynamics or multistability driven by metabolic–immune co-regulation.
Finally, experimental validation using organoid or in vivo systems measuring pH dynamics alongside immune activation would provide an important next step in translating theoretical predictions into biological insight.
6. Conclusions
This study develops a mechanistically integrated dynamical framework linking tumor proliferation, immune cytotoxicity, and extracellular acidity within a unified nonlinear system. By embedding continuous pH-dependent immune suppression directly into tumor–immune kinetics, tumor acidosis is formalized as a stability-modifying regulatory variable rather than a passive metabolic byproduct.
The analytical characterization of the immune control threshold (Proposition 1) establishes a quantitative condition governing tumor invasion versus immune control and demonstrates how metabolic acidification rescales effective immune gain. The associated bifurcation structure reveals that increasing acidity production or reducing buffering capacity can induce stability transitions between immune-controlled and tumor-persistent regimes and, under sufficiently nonlinear suppression, may generate bistability. These results provide formal theoretical support for the graded regime shifts observed in numerical simulations.
Global sensitivity analysis further demonstrates that tumor burden and microenvironmental pH are governed by partially distinct but coupled regulatory hierarchies, with acidity functioning primarily as a gain-modulating amplifier of proliferative–immune imbalance. Together, these findings advance the field by reframing extracellular acidity as a dynamically embedded control parameter within tumor–immune–microenvironment coupling.
Methodologically, this work integrates nonlinear metabolic feedback, immune suppression kinetics, analytical stability characterization, bifurcation analysis, and spatial–scaling behavior within a single tractable framework. Conceptually, it provides a systems-level foundation for interpreting metabolic–immune interactions and informs the rational design of combination strategies targeting both immune and microenvironmental axes.
By clarifying the stability landscape governing tumor–immune–acidity dynamics, this study contributes a structured theoretical perspective to microenvironment-informed cancer modeling and offers a mechanistic basis for future experimental and translational investigations.
Funding
No funding was received for conducting this study.
Clinical trial number
Not applicable.
Ethics approval, consent to participate, and consent to publish
Not applicable. This theoretical model paper does not involve human participants, animal experiments, or clinical data.
Data and Code Availability
All computational models, simulation code, and analysis scripts are publicly available at URL: https://github.com/erosarioaloma/tumor-acidity-regulatory-circuit-model.git. The data is archived at Zenodo: DOI: 10.5281/zenodo.18965665. available at URL: https://zenodo.org/records/18965665. The repository includes Python implementation of the ODE model, reaction-diffusion solvers, sensitivity analysis scripts, and statistical analysis code. Raw simulation data, parameter files, and figure generation scripts are also included in the Zenodo archive.
Acknowledgments
We would like to thank and acknowledge the computational support and resources provided by Barry University.
Conflicts of Interest
The authors declare that they have no conflicts of interest.
References
- Fischer, K.; Hoffmann, P.; Voelkl, S.; Meidenbauer, N.; Ammer, J.; Edinger, M.; Gottfried, E.; Schwarz, S.; Rothe, G.; Hoves, S.; et al. Inhibitory effect of tumor cell–derived lactic acid on human T cells. Cancer Res. 2007, 67, 8785–8792. [Google Scholar] [CrossRef] [PubMed]
- Calcinotto, A.; Filipazzi, P.; Grioni, M.; Iero, M.; De Milito, A.; Ricupito, A.; Cova, A.; Canese, R.; Jachetti, E.; Rossetti, M.; et al. Modulation of microenvironment acidity reverses anergy in human and murine tumor-infiltrating T lymphocytes. Cancer Cell 2012, 21, 423–436. [Google Scholar] [CrossRef] [PubMed]
- Pilon-Thomas, S.; Kodumudi, K.N.; El-Kenawi, A.E.; Russell, S.; Weber, A.M.; Luddy, K.; Damaghi, M.; Wojtkowiak, J.W.; Mulé, J.J.; Ibrahim-Hashim, A.; et al. Neutralization of tumor acidity improves antitumor responses to immunotherapy. J. Immunol. 2016, 197, 1381–1390. [Google Scholar] [CrossRef] [PubMed]
- Brand, A.; Singer, K.; Koehl, G.E.; Kolitzus, M.; Schoenhammer, G.; Thiel, A.; Matos, C.; Bruss, C.; Klobuch, S.; Peter, K.; et al. LDHA-associated lactic acid production blunts tumor immunosurveillance by T and NK cells. Cell Metab. 2016, 24, 657–671. [Google Scholar] [CrossRef] [PubMed]
- Estrella, V.; Chen, T.; Lloyd, M.; Wojtkowiak, J.; Cornnell, H.H.; Ibrahim-Hashim, A.; Bailey, K.; Balagurunathan, Y.; Rothberg, J.M.; Sloane, B.F.; et al. Acidity generated by the tumor microenvironment drives local invasion. Cancer Res. 2013, 73, 1524–1535. [Google Scholar] [CrossRef] [PubMed]
- Robey, I.F.; Baggett, B.K.; Kirkpatrick, N.D.; Roe, D.J.; Dosescu, J.; Sloane, B.F.; Hashim, A.I.; Morse, D.L.; Raghunand, N.; Gatenby, R.A.; et al. Bicarbonate increases tumor pH and inhibits spontaneous metastases. Cancer Res. 2009, 69, 2260–2268. [Google Scholar] [CrossRef] [PubMed]
- Corbet, C.; Feron, O. Tumour acidosis: From the passenger to the driver’s seat. Nat. Rev. Cancer 2017, 17, 577–593. [Google Scholar] [CrossRef] [PubMed]
- Kuznetsov, V.A.; Makalkin, I.A.; Taylor, M.A.; Perelson, A.S. Nonlinear dynamics of immunogenic tumors: Parameter estimation and global bifurcation analysis. Bull. Math. Biol. 1994, 56, 295–321. [Google Scholar] [CrossRef] [PubMed]
- Kirschner, D.; Panetta, J.C. Modeling immunotherapy of the tumor–immune interaction. J. Math. Biol. 1998, 37, 235–252. [Google Scholar] [CrossRef] [PubMed]
- de Pillis, L.G.; Radunskaya, A.E.; Wiseman, C.L. A validated mathematical model of cell-mediated immune response to tumor growth. Cancer Res. 2005, 65, 7950–7958. [Google Scholar] [CrossRef] [PubMed]
- Arciero, J.C.; Jackson, T.L.; Kirschner, D.E. A mathematical model of tumor–immune evasion and siRNA treatment. Discrete Contin. Dyn. Syst. B 2004, 4, 39–58. [Google Scholar] [CrossRef]
- Eftimie, R.; Bramson, J.L.; Earn, D.J.D. Interactions between the immune system and cancer: A brief review of non-spatial mathematical models. Bull. Math. Biol. 2011, 73, 2–32. [Google Scholar] [CrossRef] [PubMed]
- Ibrahim-Hashim, A.; Wojtkowiak, J.W.; de Lourdes Coelho Ribeiro, M.; Estrella, V.; Bailey, K.M.; Cornnell, H.H.; Gatenby, R.A.; Gillies, R.J. Free base lysine increases survival and reduces metastasis in prostate cancer model. Cancer Res. 2011, 71, 5856–5867. [Google Scholar]
- Leone, R.D.; Powell, J.D. Metabolism of immune cells in cancer. Nat. Rev. Cancer 2020, 20, 516–531. [Google Scholar] [CrossRef] [PubMed]
- Colegio, O.R.; Chu, N.Q.; Szabo, A.L.; Chu, T.; Rhebergen, A.M.; Jairam, V.; Cyrus, N.; Brokowski, C.E.; Eisenbarth, S.C.; Phillips, G.M.; et al. Functional polarization of tumour-associated macrophages by tumour-derived lactic acid. Nature 2014, 513, 559–563. [Google Scholar] [CrossRef] [PubMed]
- Hegde, P.S.; Chen, D.S. Top 10 challenges in cancer immunotherapy. Immunity 2020, 52, 17–35. [Google Scholar] [CrossRef] [PubMed]
- Sharma, P.; Allison, J.P. The future of immune checkpoint therapy. Science 2015, 348, 56–61. [Google Scholar] [CrossRef] [PubMed]
- Byrne, H.M. Dissecting cancer through mathematics: From the cell to the animal model. Nat. Rev. Cancer 2010, 10, 221–230. [Google Scholar] [CrossRef] [PubMed]
- Enderling, H.; Chaplain, M.A.J. Mathematical modeling of tumor growth and treatment. Curr. Pharm. Des. 2014, 20, 4934–4940. [Google Scholar] [CrossRef] [PubMed]
- Powathil, G.G.; Adamson, D.J.A.; Chaplain, M.A.J. Towards predicting the response of a solid tumour to chemotherapy and radiotherapy treatments: Clinical insights from a computational model. PLoS Comput. Biol. 2013, 9, e1003120. [Google Scholar] [CrossRef] [PubMed]
Figure 1.
Representative dynamical regimes of the core tumor–immune–acidity model. (Left) Tumor burden trajectories illustrating escape, controlled equilibrium, and clearance regimes. (Center) Effector immune dynamics corresponding to each regime. (Right) Extracellular pH evolution derived from the acidity proxy. Transitions between regimes arise from nonlinear feedback coupling between tumor growth, acidity production, and immune suppression.

Figure 2.
Final tumor burden across acidity production and immune pH sensitivity. Heatmap of tumor burden at t = tfinal as a function of acidity production strength (p) and immune suppression midpoint expressed in pH units (pH50), with all other parameters fixed to baseline values (Table 1). Tumor persistence increases smoothly with increasing acidity production and greater immune sensitivity to acidic conditions, demonstrating continuous modulation of tumor–immune equilibrium states.

Figure 3.
Global sensitivity analysis of final tumor burden. Partial rank correlation coefficients (PRCC) between model parameters and final tumor burden (Tfinal) computed from Latin hypercube sampling across parameter ranges in Table 3. Positive values indicate parameters associated with increased tumor persistence, whereas negative values indicate parameters associated with tumor suppression.

Figure 4.
Endpoint-dependent global sensitivity structure of tumor–immune–acidity dynamics. Partial rank correlation coefficients (PRCC) computed from Latin hypercube sampling across parameter ranges specified in Table 3. The left panel shows PRCC values for minimum extracellular pH (pHmin), and the right panel shows PRCC values for tumor area under the curve (AUCT). Positive values indicate parameters associated with increases in the corresponding endpoint, whereas negative values indicate parameters associated with decreases. Differences in PRCC magnitude across panels reflect endpoint-specific control hierarchies within the coupled tumor–immune–acidity system.

Figure 5.
Spatial Confinement of Acidity-Responsive Regulatory Activity. (Left) Spatial distribution of extracellular acidity and corresponding regulatory activation under substrate-independent regulation in the one-dimensional reaction–diffusion extension of the model. A localized tumor distribution generates an acidity gradient with lowest pH values confined to the tumor core. Regulatory activity increases smoothly in regions of high acidity and decays toward baseline in near-physiologic regions, demonstrating intrinsic spatial confinement driven by nonlinear activation. (Right) Spatial profiles under substrate-dependent regulation. Although regulatory activation remains localized to acidic regions, amplitude is attenuated relative to Left panel due to progressive substrate depletion. Reduced substrate availability limits buffering capacity even within highly acidic zones, illustrating resource-constrained regulatory behavior. Together, the panels demonstrate that acidity-responsive regulation localizes naturally to metabolically perturbed regions, while regulatory architecture determines amplitude and constraint structure.

Figure 6.
Scaling Behavior of Substrate-Dependent and Substrate-Independent Buffering Mechanisms. Analysis of cumulative regulatory cost and buffering efficacy as maximal regulatory strength increases. Substrate-independent regulation exhibits approximately proportional scaling between cumulative cost (space–time integral of regulatory activity) and improvement in minimum extracellular pH, indicating near scale-invariant behavior across the explored range. In contrast, substrate-dependent regulation demonstrates nonlinear scaling with diminishing returns, as substrate depletion attenuates effective activation amplitude at higher regulatory strengths. These results quantitatively distinguish architectural differences in regulatory design and highlight how metabolic constraints reshape cost–benefit relationships in acidity-responsive systems.

Figure 8.
Stability transition in tumor burden driven by acidity-mediated immune suppression. Schematic bifurcation diagram illustrating equilibrium tumor burden T* as a function of acidity production strength p. As acidity production increases, steady-state extracellular acidity rises, reducing effective immune control through nonlinear suppression. When the effective immune control ratio falls below unity, stability shifts from a tumor-free equilibrium (immune-controlled regime) to a tumor-present equilibrium (acid-mediated escape regime), consistent with a transcritical bifurcation structure. Solid lines denote stable equilibria, whereas dashed lines denote unstable equilibria. For sufficiently steep immune suppression, bistability may emerge, allowing coexistence of low- and high-tumor states.

Table 2.
Regulatory Module Parameters Used in Section 3.6 Simulations.
Table 2.
Regulatory Module Parameters Used in Section 3.6 Simulations.
| Symbol | Description | Baseline Value | Units | Notes |
|---|---|---|---|---|
| ρ_V | Vector growth rate | 0.30 | 1/day | Logistic expansion rate of regulatory vector |
| K_V | Vector carrying capacity | 1.0 | normalized | Scaled to tumor magnitude |
| δ_V | Vector decay rate | 0.05 | 1/day | Basal loss/clearance |
| β | Therapeutic production rate | 0.80 | P/day | Production proportional to promoter activation |
| θ | Promoter activation midpoint | 1.50 | acidity units | Corresponds to mildly acidic pH (~6.8) |
| q | Promoter Hill exponent | 4.0 | – | Cooperative acidity sensing |
| δ_P | Therapeutic decay rate | 0.20 | 1/day | Product clearance/degradation |
| η | Immune reactivation strength | 0.60 | E/P·day | Used in immune reactivation scenario |
| κ | Alkalinization strength | 0.50 | a/P·day | Used in buffering scenario |
| u_max | Maximum buffering capacity | 1.0 | normalized | Maximal regulatory strength in scaling analysis |
Disclaimer/Publisher’s Note: The statements, opinions and data contained in all publications are solely those of the individual author(s) and contributor(s) and not of MDPI and/or the editor(s). MDPI and/or the editor(s) disclaim responsibility for any injury to people or property resulting from any ideas, methods, instructions or products referred to in the content. |
© 2026 by the authors. Licensee MDPI, Basel, Switzerland. This article is an open access article distributed under the terms and conditions of the Creative Commons Attribution (CC BY) license (http://creativecommons.org/licenses/by/4.0/).
Copyright: This open access article is published under a Creative Commons CC BY 4.0 license, which permit the free download, distribution, and reuse, provided that the author and preprint are cited in any reuse.


