

Submitted:
23 February 2026
Posted:
28 February 2026
You are already at the latest version
Abstract
Drought has become a major threat among extreme weather events impacting ecosystems, the economy, food production, and livelihoods. Since the beginning of this century, it has significantly affected Nigeria's economy by reducing agricultural productivity and internally generated revenue. In Northern Nigeria, the shift from meteorological to agricultural drought has not been adequately monitored, particularly concerning future predictions using Artificial Intelligence (AI) and Remote Sensing (RS) methods. Therefore, this study employs AI and EO techniques to analyse and forecast the spatiotemporal dynamics of agricultural drought propagation in North-Central Nigeria from 2000 to 2024. The Vegetation Condition Index (VCI), the Temperature Condition Index (TCI), the Temperature Vegetation Drought Index (TVDI), and the Standardized Precipitation Evapotranspiration Index (SPEI) were used to evaluate vegetation health, temperature variation, and drought severity during the study period. For the machine learning component, Gradient Boosting Regressor was used to predict drought events over five years using cross-validation methods. This study confirms persistent drought events in 2011, 2015, and 2022, with the propagation of meteorological to agricultural drought in 2015, as indicated by VCI, TCI, and TVDI. The integration of AI and EO approaches for drought propagation assessment could enhance climate resilience efforts (SDGs 2, 13 & 15) and provide a framework for drought mitigation strategies in regions prone to drought recurrence, including the study area.
Keywords:
drought
; rainfall
; artificial intelligence
; remote sensing
; extreme weather events
; Nigeria
1. Introduction
Drought has emerged as a persistent natural hazard in recent decades, severely impacting global ecosystems, economies, and livelihoods [1,2,3,4]. Distinct from other acute extreme weather events, such as tropical cyclones, tornadoes, or floods, droughts are characterized by their varying timescales and thresholds, often resulting in significant, cumulative long-term consequences [5,6,7,8].
Drought is classified into four interconnected categories: meteorological, agricultural, hydrological, and socioeconomic drought [9]. This classification generally describes a sequential progression, where meteorological drought (a precipitation deficit) serves as the primary initiator. This typically leads to agricultural drought (soil moisture deficiency affecting crops and vegetation) and subsequently propagates into hydrological drought (prolonged deficits impacting surface water sources like rivers, lakes, and subsurface groundwater systems) [10]. However, this linear propagation is not universal; in high-precipitation regions, such as the tropics, a meteorological deficit may not immediately translate into significant agricultural or hydrological drought [11,12,13,14]. The final category, socioeconomic drought, is distinct as it quantifies the impact of water resource scarcity on human populations and societal supply-demand systems [15,16]. Moreover, the land-atmosphere interaction as a result of feedbacks between soil moisture and evapotranspiration has raised an urgent concern regarding the intensity of flash drought. As highlighted in recent studies [57,58,59,60], the frequency and rapid occurrence of extreme events like heatwaves makes this type of drought more severe by having substantial effects on soil water content and leaves no time for early warning approaches.
The severity of drought impacts has been significantly amplified by human-induced climate change in the 21st century [4,7,17,18,19]. Rising global temperatures intensify extreme weather events, contributing to decreased soil moisture availability and consequently imposing more severe stress on plants and vegetation. Against this global backdrop, certain tropical countries like Nigeria exhibit heightened vulnerability due to increasingly erratic rainfall patterns, which compound the effects of global warming and drought propagation [20,21]. The consequences are particularly pronounced in Nigeria's Northern region, where a large portion of the population relies on farming, thus increasing overall exposure to drought severity [22].
The intensification of drought events in Nigeria has been evident since the turn of the century, particularly across the Northern part of the country, as documented by the Nigeria National Drought Plan [23]. This geographical vulnerability is critical given that agriculture is the primary economic driver after crude oil, contributing heavily to economic development and Internally Generated Revenue (IGR). Nigeria is further challenged by two distinct precipitation regimes: low rainfall in the North and high rainfall in the South [22]. The low precipitation regimes in the North exacerbate crop growth failure, vegetation stress, livestock death, and threaten essential livelihood support. Moreover, the country's overall exposure to climate change is compounded by the intersection of socioeconomic, demographic, urban migration, infrastructure, and policy factors. In rainfed regions like Plateau State, the cessation of seasonal rainfall and prolonged drought spells can trigger severe social consequences, including conflicts between farmers and herders and the potential for residents to turn to unsustainable practices, such as illegal mining, for survival [17,22,24,25]. Advancements in RS and Artificial Intelligence (AI) have revolutionized drought monitoring within developed nations, yet their full potential remains largely unrealized in developing countries [26]. Furthermore, existing drought research has heavily favoured temperate climates, creating a critical knowledge deficit regarding the effective application of these advanced technologies within tropical agroecosystems, where the devastating impacts of drought can be even more severe. Specifically, a major gap persists in the future prediction of drought events in these vulnerable regions, which is essential for a systemic understanding of their characteristics, trends, and potential implications.
Existing studies in Nigeria highlight both the severity and the localized nature of the challenge, but often with methodological limitations. For instance, an early warning system developed by [27] utilized monthly NOAA-AVHRR and MODIS Normalized Difference Vegetation Index (NDVI) data, alongside correlation and regression analyses of observed rainfall, to assess spatiotemporal changes in vegetation from 1981 to 2012. Their findings confirmed a high drought risk, particularly in northeastern Nigeria. In a separate effort, Hassan (2024) [22] employed a mixed-method approach focused on statistical and survey data to assess livelihood vulnerability in Plateau State, determining that delayed rainfall onset significantly exposed farmers to drought severity. However, this work relied exclusively on static statistical and survey data, neglecting geospatial or AI-driven approaches for continuous trend analysis or future projection. Furthermore, research on Southwestern Nigeria, Aiyelokun et al. (2018) [26] used ground data from 1974–2013, applying an Artificial Neural Network (ANN) and the Standardized Precipitation Index (SPI) for future prediction. This study contrasted with northern findings by suggesting an increase in rainfall in the south based on three-month SPI analysis. Despite this predictive component, the focus remained primarily on meteorological drought, failing to account for its subsequent propagation into agricultural or hydrological types, or the broader impacts on livelihoods and environmental change.
To systematically address these critical research gaps, we leverage machine learning and geospatial approaches to assess and predict the propagation of meteorological drought into agricultural drought within North-Central Nigeria. We explore the spatio-temporal dynamics of drought between 2000 and 2024 by integrating MODIS satellite data with a Gradient Boosting Regressor (GBR) model. The GBR was specifically selected for its robustness in handling noisy data and its high-performance accuracy [28,29,30]. The geospatial analysis utilizes key drought indices derived from EO data, including the Vegetation Condition Index (VCI), Temperature Condition Index (TCI), Temperature Vegetation Drought Index (TVDI), and the Standardized Precipitation and Evapotranspiration Index (SPEI). By integrating these approaches (EO-derived indices and GBR), this study aims to: (i) compute and analyze the spatiotemporal variability of agricultural drought using MODIS-derived indices (2000–2024); (ii) examine the propagation of meteorological drought (using SPEI timescales) during the onset of the rainy season (May) into agricultural drought; (iii) develop an AI-remote sensing model to predict future drought patterns in the study area; and (iv) monitor the impact of drought to determine the region(s) most vulnerable to future severity.
2. Materials and Methods
2.1. Study Area
The study focuses on Plateau State (Figure 1), located in the highlands of Central Nigeria, and geographically delineated by the coordinates 9.1667–9.2182° N latitude and 9.5179–9.7500° E longitude. This region is renowned for its lush vegetation, diverse natural resources (such as tin, gold, and columbite [25]), and unique topography characterized by rugged highlands, rocky hills, and major hydrological features, including the tributaries of the River Benue. The state's climate is highly favorable for agriculture, maintaining a near-temperate environment with relatively cool temperatures ranging between 16–23°C [22,25], making farming the primary occupation for most of the population. Like other parts of Nigeria, the state experiences distinct wet and dry seasons, with the crucial rainy season typically commencing around April or May [31,32,33]. The vulnerability of Plateau State's agriculture to global climate system changes makes it an important case study for drought monitoring in Nigeria [22]. Despite the generally favorable conditions, recent reports from farmers and inhabitants indicate a heightened impact of water stress, primarily driven by delays in the onset of rainfall [22,34,35]. This variability directly translates into crop failures, livestock losses, and significant pressures on livelihoods. Given this critical situation, it is essential to monitor vegetation health and drought patterns in Plateau State using AI and remote sensing approaches to provide crucial, data-driven insights into the propagation and severity of agricultural drought over the years.
2.2. Datasets
The Earth Observation datasets were obtained directly from the National Aeronautics and Space Administration (NASA) portal via the Google Earth Engine platform. These datasets (Table 1) include MOD11A1 and MOD13Q1. The former provides Land Surface Temperature (LST) with an 8-day temporal resolution and a grid spacing of 1000m. Meanwhile, the latter offers the Normalized Difference Vegetation Index (NDVI) datasets with a spatial resolution of 250m and a temporal resolution of 16 days. These datasets will be used from 2000 to 2024 to process agricultural drought indices, including the Temperature Vegetation Drought Index (TVDI), Vegetation Condition Index (VCI), and Temperature Condition Index (TCI). These two datasets, although with different resolutions, were resampled using the nearest neighbour resampling approach in order to ensure consistency in datasets before the analysis. This approach is in line with the similar study by Zhang et al. (2019) [36] which focuses on Harmonizing multiple remote sensing datasets for crop growth monitoring in China.
2.3. Methods
2.3.1. Agricultural Drought Indices Computation
- Vegetation Condition Index (VCI)
Vegetation plays a critical role in ecosystem energy exchange and function, serving as a vital carbon sink that sequesters atmospheric carbon dioxide. Given that the Northern region of Nigeria, including Plateau State, exhibits high sensitivity to variations in precipitation, the Vegetation Condition Index (VCI) is an essential indicator of vegetation health. Low VCI values signify poor vegetation conditions and stress, typically due to inadequate rainfall and soil moisture deficits, whereas higher VCI values indicate robust, healthy growth.
VCI drought computation was performed using the GEE cloud platform, where the long-term maximum and minimum NDVI indices were calculated for the study period (2000–2024). The VCI was then computed using the standard formula below, as presented by [34,37,38,39,40]. The VCI values range from 0 to 100, with values between 0 and 35% indicating a drought event. Moreover, a value around 50% reflects sparse or low vegetation, while values greater than 50% reflect optimal or dense vegetation. The VCI values were reclassified as presented in Table 2.)
where Represent the index of the current month (May) for a given year, while NDVImax and NDVImin represent the historical minimum and maximum for the pixel over the study period.
- Temperature Condition Index (TCI)
This index is part of a new satellite-based drought monitoring system that replaces conventional methods. TCI is used alongside other agricultural drought indices like VCI, VHI, and NDVI for comprehensive drought analysis [40]. The formula below demonstrates how TCI can be derived from ground temperature.
where LSTmin and LSTmax are the absolute minimum and maximum Land Surface Temperature for a particular period in a year.
- Temperature Vegetation Dryness Index (TVDI)
The TVDI utilizes the triangle inverse relationship method, integrating Normalized Difference Vegetation Index (NDVI) and Land Surface Temperature (LST) datasets from MODIS satellites [41]. In this index, higher values approaching one (1) indicate dry surface conditions, signifying soil moisture deficit, while low values closer to zero (0) signify relatively moist soil. This principle is rooted in the understanding that when plants do not experience water stress, the evapotranspiration rate is maximized, which in turn decreases the plant temperature. Conversely, exposure to water scarcity reduces the rate of evapotranspiration, leading to an increase in plant temperature.
TVDI was computed using MODIS NDVI and LST for May and reprojected using a similar approach explained above in the data acquisition and preprocessing section [41]. TVDI values (Table 3) over the study period were estimated using the formula below:
where LSTj is the surface temperature at a given pixel, and LSTmin and LSTmax are the fitted wet and dry edge temperature values corresponding to the same NDVI values.
2.3.2. Standardized Precipitation Evapotranspiration Index (SPEI)
For robust drought monitoring, the Standardized Precipitation Evapotranspiration Index (SPEI) is widely employed due to its ability to capture the climatic water balance by integrating both precipitation and potential evapotranspiration data [42,43,44]. Unlike the Standardized Precipitation Index (SPI), which relies solely on precipitation information, the SPEI adjusts for temperature anomalies by factoring in evapotranspiration, thus providing a more comprehensive assessment of drought conditions across various timescales (1, 3, 6, 9, and 12 months [45,46,47]). The use of multiple timescales is critical, as it allows for the differentiation between short-term meteorological deficits and long-term hydrological impacts.
For this study, SPEI datasets spanning 2000–2024 were sourced from the Food and Agriculture Organization (FAO) via the Google Earth Engine (GEE) cloud platform. Within the GEE environment, the raw datasets were pre-processed: the data were rescaled using the 'mean' function at a scale of 55,000 and subsequently clipped to the defined region of interest (Plateau State, Nigeria) using spatial filtering capabilities. Drought classification was then performed on GEE using conditional statements to delineate periods of ‘No drought’ from varying levels of ‘Drought severity.’ This classification approach was applied consistently across the 1-, 3-, 6-, and 12-month timescales. The resulting SPEI trends were finally analyzed using time-series plots to accurately identify temporal patterns and changes in drought severity throughout the study period.
2.3.3. Development of the Machine Learning Model for Drought Assessment
The selection of spectral indices utilized in this model was derived from foundational drought research and calculated using formulas detailed in the previous section. Among the machine learning (ML) ensemble models widely applied in drought modeling, such as Random Forest (RF), XGBoost, and Artificial Neural Networks (ANN), the Gradient Boosting Regressor (GBR) was selected for this study. GBR is particularly adept at capturing complex, non-linear relationships in spatiotemporal drought patterns and demonstrates robust predictive performance [45]. Its capacity to handle the relationships between remote sensing indices and drought variables, thereby improving overall model generalization, is well-established in the literature [45,48,49]. A critical advantage of GBR that informed its selection was its ability to display a balanced performance across both training and testing datasets, thereby mitigating the risk of model overfitting.
The model was engineered to assess the propagation of meteorological drought into agricultural drought. The input features were four variables derived from remote sensing data: the Vegetation Condition Index (VCI), the Temperature Condition Index (TCI), the Temperature Vegetation Drought Index (TVDI), and Year. These raster images were imported into the Google Colab environment. The target variable chosen for prediction was SPEI-3, which effectively captures meteorological drought conditions over a short, three-month timescale. The remote-sensing drought analysis spanned 2000 to 2024.
Furthermore, the initial data cleaning was performed by dropping all missing values using the dropna() function in Python, which resulted in a cleaned feature dataset comprising approximately 12,000 rows and 5 columns. Subsequently, the feature datasets were divided into training and testing sets using a standard 60% train and 40% test ratio (Figure 2). All data processing and modeling were executed in the Google Colab environment. Model performance and accuracy were evaluated using the Coefficient of Determination (R2). Among the candidate models, the GBR achieved the most balanced performance with a test R2 of 0.823 and a training R2 of 0.834.
3. Results and Discussion
3.1. Meteorological Drought Assessment Through SPEI Analysis
Figure 3 shows the temporal analysis across four different SPEI timescales (2000 – 2024), which was done to evaluate the temporal evolution of drought conditions. The results reveal the distinction between the short-term moisture deficits and long-term drought persistence in Plateau State. The Short-term timescales SPEI-1 and SPEI-3 (Figure 3a and b) analysis highlights a frequent occurrence of mild drought events between 2016 and 2022. Moreover, at the beginning of the study period (2000), the SPEI-1 timescale highlighted a severe drought event with more SPEI negative values, which persisted until the beginning of 2012 and intensified again toward the end of 2015. Our results align with recent climatological research by Akinwale et al. (2022) [50], which systematically projects the impact of climate change and drought attributes in Nigeria using different SPEI timescales.
On the other hand, the long-term timescales, SPEI-6 and SPEI-12 (figure 3c and d), show a more nuanced shift in the SPEI values with more negative values, which indicates an increase in severe drought events in the study area. Our results are substantiated by the analysis by Adeyeri et al (2025) [51], which shows pronounced alterations in some West African basins due to enhanced intensity and extended drought events over the years. Their study also claimed that some African basins will likely experience significant changes with more pronounced increases in reduced water yields, aridity, and variability in hydrological features. Additionally, the results also support the study by Akinwale et al. (2025) [52], which further elucidated the impacts of anthropogenic activities on hydro-climatological variations, which have resulted in severe drought events and prolonged drought duration across different regions of West Africa.
3.2. Agricultural Drought Assessment Based on Remote Sensing Indices
These agricultural drought indices were specifically calculated for May across the study period (2000–2024). May was selected because it consistently marks the onset of the growing season in the study area [22]. This approach enables the detection of drought stress impacts on vegetation before crops enter their peak growth stages, providing an early assessment of agricultural vulnerability.
3.2.1. Vegetation Health Assessment in Plateau State: A VCI-Based Analysis
The VCI analysis reveals a significant pattern of drastic reduction in vegetation health across Plateau State over the past decade. These discernible trends, as illustrated by the VCI maps (Figure 4), can be attributed directly to environmental stressors and changing weather patterns [53].
Specifically, in 2005, 2010, 2013, 2020, 2021, and 2024, the southern and western parts of the state experienced a substantial reduction in vegetation vigor. This indicates that inadequate precipitation and subsequent soil moisture deficits led to unstable growing patterns in these typically more resilient areas. Furthermore, in 2011, 2012, 2017, 2018, 2019, and 2021, the northern parts of the state encompassed major metropolitan areas like Jos North and Jos South, Bangu, and Massa, which also faced similar patterns of vegetation stress (Supplementary Figure S1). These widespread impacts further emphasize the regional sensitivity of vegetation to shifts in the climate system [50].
The year 2015, which tends to be the outlier among the annual observations, indicated that more than 90% of the region experienced severe extreme vegetation stress. This finding aligns precisely with the previous SPEI analysis (Figure 3), which showed meteorological SPEI values falling below -1.0 for both short and long-term timescales in the same year. This strong spatial and temporal correlation confirms the propagation of meteorological drought into agricultural drought in 2015. Moreover, these findings align with similar studies conducted in other countries. For instance, Niyonsenga et al. [53] found that in Rwanda, there was significant stress on vegetation in 2015 compared to the previous years. Similarly, a study by Anjana et al. (2020) [40] shows that VCI maps in their study highlighted unfavourable development situations. To this end, it can be considered that VCI analysis remains crucial for any analysis on drought monitoring, specifically in non-homogeneous areas.
3.2.2. Temperature Condition Index (TCI) and Drought Severity Analysis
The Temperature Condition Index (TCI) is a pivotal metric used for monitoring the propagation of agricultural drought, as it effectively assesses the spatiotemporal manifestation of thermal stress on crop and vegetation health. Low TCI values reflect significant thermal stress on vegetation, often leading to reduced transpiration and growth, while high TCI values indicate more favourable thermal conditions [40,53].
Figure 5 shows the annual TCI maps from 2000 – 2024, providing insights into the agricultural drought dynamics by highlighting spatial and temporal changes in temperature patterns and their impact on vegetation. The analysis from our work shows that the years 2010, 2011, 2013, 2020, 2021, and 2023 showed significant thermal stress, particularly in the southern part of Plateau State, where TCI values consistently fell below the critical threshold of 40% (Supplementary Figure S2). This result aligned strongly with the study by Niyosenga et al. [53], which highlights some similarities in Northern Rwanda in 2010 and 2013 with a notable thermal stress and unfavourable temperature conditions affecting the vegetation in the region.
Similar patterns were captured by the TCI analysis in the northern and the central part of Plateau State in 2016 and 2022. During these years, TCI values were below the previous observation, falling below 30% (Supplementary Figure S2), highlighting more unfavourable and severe temperature conditions for vegetation and inhabitants of these regions. As highlighted in their research, the vegetation stress captured by TCI analysis aligns with broader known periods of water stress in Nigeria [54]. During the El-Nino year in Brazil, Gomez et al. [55] study shows that stressed vegetation was more observed in the semi-arid part of the country as a result of rise in surface temperatures. The most intense and widespread thermal stress was observed in 2015 (Figure 5), where the majority of the region recorded TCI values below 20%. Nonetheless, this finding corroborates and strengthens the conclusions drawn from the VCI and SPEI analyses, further demonstrating the perfect synchronicity of these indices in characterizing and enhancing the early detection of agricultural drought conditions in Plateau State.
3.2.3. Soil Moisture Dynamics in Plateau State: A TVDI-Based Approach
The preceding VCI and TCI analyses have clearly established the impact of water scarcity, driven by rising temperatures and altered precipitation regimes, on vegetation growth and crop health in the study area. Building on this evidence, this section presents the Temperature Vegetation Dryness Index (TVDI) analysis to specifically monitor soil moisture conditions.
The TVDI maps (Figure 6) illustrate the spatiotemporal distribution of soil moisture changes across the study area from 2000 to 2024. The analysis shows that periods of moderate to severe soil moisture deficit were frequently observed, particularly in the southern part of Plateau State. Specifically, in the years 2003, 2006, 2010, 2011, 2014, 2015, 2020, 2021, and 2024 (Supplementary Figure S3), a pronounced reduction in soil moisture was evident in the southern province. This reduction ultimately contributes to a decrease in the evapotranspiration rate and a corresponding increase in plant temperature, confirming the physical mechanism of agricultural drought propagation. Similarly, the northeastern part of the study area experienced diminished soil moisture in 2018, 2019, and 2022.
Notably, some areas in the northern part of the study area appears to have generally maintained moderately wet soil moisture indices from the beginning of the study period (2000) to 2014. Overall, the TVDI results suggest that the persistently high dryness observed in the southern region may be linked to intensified land use and agricultural practices, given that the majority of farmers in the state are concentrated in this area [9,19,20], potentially exacerbating the effects of meteorological changes on soil moisture availability.
3.3. Machine Learning Assessment and Future Drought Prediction
This section presents the performance and results of the Gradient Boosting Regressor (GBR) model developed to predict drought severity in Plateau State, Nigeria. The objective of this approach was to forecast future meteorological drought conditions, specifically the Standardized Precipitation Evapotranspiration Index (SPEI) at the three-month timescale (SPEI-3), in areas lacking contemporaneous ground data by leveraging satellite-based indices. The satellite-based indices that were used to train the model include: the Vegetation Condition Index (VCI), which measures vegetation health relative to the historical norms, the Temperature Condition Index (TCI), which highlights the vegetation thermal stress, and the Temperature Vegetation Drought Index (TVDI), which combines vegetation health and surface temperature information to monitor the deficit in soil moisture. The inclusion of these three biophysical and thermal indices is justified by previous research, which indicates that combining TCI and VCI significantly enhances the accuracy of drought predictions compared to traditional, single-index approaches [19,20].
Among the three ensemble algorithms tested for this study - Gradient Boosting Regressor, Random Forest, and XGBoost - the Gradient Boosting Regressor was selected based on its superior generalizability [45]. While all models achieved high accuracy, the GBR exhibited the best balance between training and testing performance, mitigating the risk of overfitting. While it is commonly believed that random forest models are less accurate in prediction than gradient-boosted trees, our investigation does not confirm this assertion [48]. This outcome may be attributed to the tuning parameters of gradient-boosted trees [56]. Nonetheless, realizing optimal parameters that result in a minimized out-of-bag error is vital in model selection and parameter adjustment. Notably, in the random forest algorithm, the subset size of predictor variables plays a crucial role in controlling the final depth of the trees [56]. Consequently, the fine-tuned hyperparameters identify the model exhibiting the highest testing accuracy. Generally, parameter tuning in statistical learning models involves a grid search, an exhaustive exploration within a defined subspace of hyperparameter values specified by the user. While machine learning algorithms are promising for downscaling from low to high resolution, they also have drawbacks. These include challenges associated with data availability and quality, difficulties in generalizing unseen data or different spatiotemporal contexts, substantial computational requirements that can hinder scalability, and assumptions that may introduce biases based on the training data.
As shown in Figure 7, the GBR achieved a R2 of 0.8339 on the training dataset and 0.8231 on the testing dataset. In contrast, the Random Forest model showed clear signs of overfitting, with a high training R2 of 0.9716 but a lower testing R2 of 0.8212. Similarly, XGBoost showed a higher training R2 0.9131 compared to its testing performance (0.8347). The tight convergence of the training and testing R2 values for the GBR, as highlighted in the methodology section, indicates a well-balanced model that generalizes effectively to new, unseen data [21].
Furthermore, the predictive capability of the selected GBR model is visually demonstrated in Figure 8, which plots the actual SPEI-3 values against the model's predicted values over the study period (2020–2024). The close alignment of the predicted SPEI values (dashed red line) with the actual SPEI values (solid black line) for the 2000–2024 period confirms the model's high accuracy and successful capture of instances of previous drought events within the test data. The plot also clearly reveals a recurring, sinusoidal pattern of moderate to severe meteorological drought, characterized by a deep fall in SPEI values during every quarter of the year. Also, the extension of the drought prediction into 2025 (dashed purple line), which represents the future forecast, indicates the continuation of moderate to severe drought events in the study area. This drought projection serves as a valuable early warning for ongoing water stress in Plateau State.
4. Conclusions and Future Research Directions
4.1. Conclusion
This study examined the spatiotemporal propagation of meteorological drought into agricultural drought in Plateau State, Nigeria, over the 2000–2024 period. By integrating the Standardized Precipitation Evapotranspiration Index (SPEI) across various timescales with a suite of satellite-based remote sensing indices (VCI, TCI, and TVDI), we established a robust framework for drought assessment and early warning. Furthermore, the study integrated the Gradient Boosting Regressor (GBR) machine learning model with the remote sensing data, marking one of the first attempts to evaluate drought propagation dynamics in the study area (Plateau State) using advanced Remote Sensing (RS) and machine learning approaches.
4.2. Key Findings and Contributions
The multi-index analysis confirmed the persistence of mild to severe drought events during the study period, with critical years identified as 2010, 2011, 2013, 2015, 2020, 2021, 2023, and 2024. Notably, 2015 emerged as the period with the most devastating drought impacts, demonstrated consistently across all SPEI, VCI, TCI, and TVDI analyses. The TVDI results specifically highlighted pronounced soil moisture deficits in the southern part of the state, suggesting that this region is experiencing the longest and most severe drought events.
These findings collectively established the impacts of persistent drought and provided a critical, counter-narrative to the general assumption of the "Sahelian Phenomenon," demonstrating that severe drought prevalence is not confined solely to the northernmost regions of Nigeria. The primary driver was identified as late and unreliable rainfall, which contributes to high moisture and vegetation stress during the onset of the growing season.
The machine learning component, utilizing the GBR, successfully captured the linear relationship between the remote sensing indices and SPEI and indicated a sinusoidal pattern of drought recurrence. The model's forecast for 2024 highlighted the continuation of moderate to severe drought events, underscoring the necessity of proactive, data-driven interventions.
This study has not only contributed significantly to the understanding of agricultural drought patterns and their propagation in the North-Central region but also emphasizes the indispensable role of emerging digital tools (AI and EO) in 21st-century climate resilience planning. The results directly support the United Nations Sustainable Development Goals (SDGs), specifically advancing SDG 2 (Zero Hunger) by enabling local stakeholders and policymakers to implement targeted sustainable agriculture and awareness programs, and SDG 13 (Climate Action) by providing a framework for urgent drought assessment in a vulnerable tropical region.
4.3. Future Research Directions
Future studies should incorporate larger-scale field surveys to validate the image analysis from Earth Observation data and integrate the perspectives of local inhabitants, providing a comprehensive, mixed-methods validation of the modelled drought impacts. Also, to offer a more holistic representation of agricultural drought, future work should consider integrating the VCI and TCI indices into the Vegetation Health Index (VHI). Analyzing VHI can provide a unified measure of the correlation between vegetation greenness and thermal stress.
Furthermore, the current model utilized May composites and a ten-year ML training window (2015–2024). Future research should aim to expand the temporal scale by integrating multiple months within a year and including more training years to enhance model robustness and prediction accuracy. Further investigation into the link between intensified land use/cover change (as suggested by the TVDI results in the southern part of Plateau State) and drought severity would provide crucial context for regional resource management and policy.
Supplementary Materials
The following supporting information can be downloaded at the website of this paper posted on Preprints.org, Figure S1: Annual Vegetation Condition Index (VCI) maps for Plateau State (2000–2023); Figure S2: Annual Temperature Condition Index (TCI) maps for Plateau State (2000–2023); Figure S3: Annual Temperature Vegetation Dryness Index (TVDI) maps for Plateau State (2000–2023).
Author Contributions
Conceptualization, Sodiq A. Ajadi; methodology, Sodiq A. Ajadi. Oluwafemi E. Adeyeri. and Hammed Akano.; software, Sodiq A. Ajadi; validation, Sodiq A. Ajadi; formal analysis, Sodiq A. Ajadi; investigation, Sodiq A. Ajadi; resources, Sodiq A. Ajadi; data curation, Sodiq A. Ajadi. and Hammed Akano.; writing original draft preparation, Sodiq A. Ajadi; writing – review and editing, Sodiq A. Ajadi. Oluwafemi E. Adeyeri. Saralees Nadarajah. and Hammed Akano.; visualization, Sodiq A. Ajadi. And Hammed Akano.; supervision, Saralees Nadarajah. and Oluwafemi E. Adeyeri.; project administration, Sodiq A. Ajadi. and Saralees Nadarajah.; funding acquisition, Sodiq A. Ajadi. All authors have read and agreed to the published version of the manuscript.
Funding
This research received no external funding.
Data Availability Statement
The datasets used for this research are available upon reasonable request from the authors.
Acknowledgments
The authors wish to express sincere appreciation to David Schultz at the University of Manchester for his insightful comments, suggestions, and continued support during the development and review of this work.
Conflicts of Interest
The authors declare no conflict of interest.
References
- Adeyeri, O.E.; et al. Climate change is intensifying rainfall erosivity and soil erosion in West Africa. Sci Total Environ 2024. 955, 177174. [Google Scholar] [CrossRef]
- Adeyeri, O.E.; et al. Global vegetation, moisture, thermal and climate interactions intensify compound extreme events. Sci Total Environ 2024. 912, 169261. [Google Scholar] [CrossRef]
- AghaKouchak, A.; et al. Anthropogenic Drought: Definition, Challenges, and Opportunities. Reviews of Geophysics 2021, 59(2). [Google Scholar] [CrossRef]
- Arnone, E.; et al. Droughts Prediction: a Methodology Based on Climate Seasonal Forecasts. Water Resources Management 2020, 34(14), 4313–4328. [Google Scholar] [CrossRef]
- Adeyeri, O.E.; et al. Global Heatwaves Dynamics Under Climate Change Scenarios: Multidimensional Drivers and Cascading Impacts. Earth's Future 2025, 13(6). [Google Scholar] [CrossRef]
- Alahacoon, N.; Edirisinghe, M.; Ranagalage, M. Satellite-based meteorological and agricultural drought monitoring for agricultural sustainability in Sri Lanka. Sustainability 2021, 13(6), 3427. [Google Scholar] [CrossRef]
- Apurv, T.; Sivapalan, M.; Cai, X. Understanding the Role of Climate Characteristics in Drought Propagation. Water Resources Research 2017, 53(11), 9304–9329. [Google Scholar] [CrossRef]
- Cruz-Baltuano, A.; et al. Assessment of Observed and Projected Extreme Droughts in Perú-Case Study: Candarave, Tacna. Atmosphere 2025, 16(1), 18. [Google Scholar] [CrossRef]
- Carrão, H.; et al. An Optimized System for the Classification of Meteorological Drought Intensity with Applications in Drought Frequency Analysis. Journal of Applied Meteorology and Climatology 2014, 53(8), 1943–1960. [Google Scholar] [CrossRef]
- Van Loon, A.F.; et al. Hydrological drought explained. WIREs Water 2015, 2(4), 359–392. [Google Scholar] [CrossRef]
- Wang, F.; et al. Dynamic variation of meteorological drought and its relationships with agricultural drought across China. Agricultural Water Management 2022, 261. [Google Scholar] [CrossRef]
- Zeng, J.; et al. Improving the drought monitoring capability of VHI at the global scale via ensemble indices for various vegetation types from 2001 to 2018. Weather and Climate Extremes 2022, 35. [Google Scholar] [CrossRef]
- Zhang, Z.; et al. Spatial–Temporal Patterns and Propagation Dynamics of Ecological Drought in the North China Plain. Water (Basel) 2022, 14(10), 1542. [Google Scholar] [CrossRef]
- Zhu, Y.; et al. A global perspective on the probability of propagation of drought: From meteorological to soil moisture. Journal of Hydrology 2021, 603. [Google Scholar] [CrossRef]
- Cai, C.; et al. The Main Impact Factors for the Propagation from Meteorological Drought to Socio-Economic Drought from the Perspective of a Small Area, Based on a Practical Survey. Water 2024, 16(10). [Google Scholar] [CrossRef]
- Kulkarni, S.; et al. Global assessment of socio-economic drought events at the subnational scale: a comparative analysis of combined versus single drought indicators. Hydrology and Earth System Sciences 2025, 29(18), 4341–4370. [Google Scholar] [CrossRef]
- Ogbo, Ann. N.E.L.a.W.U., Risk Management and Challenges of Climate Change in Nigeria. Journal of Human Ecology 2013. [Google Scholar] [CrossRef]
- Dai, A. Drought under global warming: a review. WIREs Climate Change 2011, 2(1), 45–65. [Google Scholar] [CrossRef]
- Ndehedehe, C.E.; et al. Global assessment of drought characteristics in the Anthropocene. Resources, Environment and Sustainability 2023, 12. [Google Scholar] [CrossRef]
- Adaawen, S. Understanding Climate Change and Drought Perceptions, Impact and Responses in the Rural Savannah, West Africa. Atmosphere 2021, 12(5), 594. [Google Scholar] [CrossRef]
- Henchiri, M.; et al. Spatio-temporal patterns of drought and impact on vegetation in north and west africa based on multi-satellite data. Remote sensing (Basel, Switzerland) 2020, 12(23), 1–26. [Google Scholar] [CrossRef]
- Hassan, B.A. Assessing livelihood vulnerability and adaptation to climate variability and change among farming households in Plateau State, north-central Nigeria, in GEOGRAPHY AND ENVIRONMENTAL STUDIES; University of the Witwatersrand: South Africa, 2024. [Google Scholar]
- (UNCCD), U.N.C.t.C.D., Nigeria: National Drought Plan, UNCCD, Editor; Bonn, Germany, 2018.
- Nwankwo, C.F.; et al. Spatial dimension of climate change vulnerability and urbanization relationship in Nigeria. International Journal of Urban Sciences 2021, 26(4), 582–603. [Google Scholar] [CrossRef]
- Owolabi, A. Assessment of Terrain and Land Use/Land Cover Changes of Mine Sites using Geospatial Techniques in Plateau State, Nigeria. Journal of Mining and Environment (JME) 2020. [Google Scholar]
- Aiyelokun, O.O.; Ogunsanwo, G.; Fabiyi, O. An Artificial Intelligence Based Drought Predictions in Part of the Tropics. Journal of Urban and Environmental Engineering 2018, 165–173. [Google Scholar] [CrossRef]
- Adedeji, O.; et al. Early warning systems development for agricultural drought assessment in Nigeria. Environ Monit Assess 2020, 192(12), p. 798. [Google Scholar] [CrossRef]
- Ali, Z.; et al. Forecasting Drought Using Multilayer Perceptron Artificial Neural Network Model. In Advances in Meteorology; 2017; Volume 2017, pp. 1–9. [Google Scholar] [CrossRef]
- Roodposhti, M.S.; Safarrad, T.; Shahabi, H. Drought sensitivity mapping using two one-class support vector machine algorithms. Atmospheric Research 2017, 193, 73–82. [Google Scholar] [CrossRef]
- Zhang, Y.; et al. Construction of an Integrated Drought Monitoring Model Based on Deep Learning Algorithms. Remote Sensing 2023, 15(3). [Google Scholar] [CrossRef]
- Dibi-Anoh, P.A.; et al. Hydrometeorological Extreme Events in West Africa: Droughts. Surveys in Geophysics 2022, 44(1), 173–195. [Google Scholar] [CrossRef]
- Gizaw, M.S.; Gan, T.Y. Impact of climate change and El Niño episodes on droughts in sub-Saharan Africa. Climate Dynamics 2016, 49(1-2), 665–682. [Google Scholar] [CrossRef]
- Salami, A.A.; et al. Spatial distribution of rainfall in Nigeria. Arabian Journal of Geosciences 2025, 18(1). [Google Scholar] [CrossRef]
- Hirschi, M.; et al. Potential of long-term satellite observations and reanalysis products for characterising soil drying: trends and drought events. Hydrology and earth system sciences 2025, 29(2), 397–425. [Google Scholar] [CrossRef]
- Ibrahim, E.S.; et al. Predicting Potato Diseases in Smallholder Agricultural Areas of Nigeria Using Machine Learning and Remote Sensing-Based Climate Data. PhytoFrontiers™ 2024, 4(2), 89–105. [Google Scholar] [CrossRef]
- Zhang, M.; et al. Harmonizing Multi-Source Remote Sensing Images for Summer Corn Growth Monitoring. Remote Sensing 2019, 11(11). [Google Scholar] [CrossRef]
- Bokusheva, R. Satellite-based vegetation health indices as a criteria for insuring against drought-related yield losses. Agricultural and Forest Meteorology 2016, 220, 200–206. [Google Scholar] [CrossRef]
- Bouras, E.H. Linkages between rainfed cereal production and agricultural drought through remote sensing indices and a land data assimilation system: A case study in Morocco. Remote sensing (Basel, Switzerland) 2020, 12(24), 1–35. [Google Scholar] [CrossRef]
- Ezzahra, F.F.; Ahmed, A.; Abdellah, A. Variance-Based Fusion of VCI and TCI for Efficient Classification of Agriculture Drought Using Landsat Data in the High Atlas (Morocco, North Africa). Nature environment and pollution technology 2023, 22(3), 1421–1429. [Google Scholar] [CrossRef]
- Kukunuri, A.N.J.; Murugan, D.; Singh, D. Variance based fusion of VCI and TCI for efficient classification of agriculture drought using MODIS data. Geocarto International 2020, 37(10), 2871–2892. [Google Scholar] [CrossRef]
- Gu, Z.; et al. Characteristics and driving forces of spatial and temporal changes of drought in Yuanjiang dry–hot valley area of China based on TVDI. Frontiers in Environmental Science 2025, 13. [Google Scholar] [CrossRef]
- Labudová, L.; Labuda, M.; Takáč, J. Comparison of SPI and SPEI applicability for drought impact assessment on crop production in the Danubian Lowland and the East Slovakian Lowland. Theoretical and Applied Climatology 2016, 128(1-2), 491–506. [Google Scholar] [CrossRef]
- Liu, C.; et al. Spatiotemporal drought analysis by the standardized precipitation index (SPI) and standardized precipitation evapotranspiration index (SPEI) in Sichuan Province, China. Sci Rep 2021, 11(1), p. 1280. [Google Scholar] [CrossRef]
- Ndehedehe, C.E. The water resources of tropical West Africa: problems, progress, and prospects. Acta Geophysica 2019, 67(2), 621–649. [Google Scholar] [CrossRef]
- Danandeh Mehr, A.; Fathollahzadeh Attar, N. A gradient boosting tree approach for SPEI classification and prediction in Turkey. Hydrological Sciences Journal 2021, 66(11), 1653–1663. [Google Scholar] [CrossRef]
- Lotfirad, M.; Esmaeili-Gisavandani, H.; Adib, A. Drought monitoring and prediction using SPI, SPEI, and random forest model in various climates of Iran. Journal of Water and Climate Change 2022, 13(2), 383–406. [Google Scholar] [CrossRef]
- Mokhtar, A.; et al. Estimation of SPEI Meteorological Drought Using Machine Learning Algorithms. IEEE Access 2021, 65503–65523. [Google Scholar] [CrossRef]
- Adeyeri, O.E.; et al. Land surface dynamics and meteorological forcings modulate land surface temperature characteristics. Sustainable Cities and Society 2024, 101. [Google Scholar] [CrossRef]
- Nadarajah, S.; et al. An Extreme Value Analysis of Drought in Africa. Environmental Modeling & Assessment 2024, 30(2), 265–288. [Google Scholar] [CrossRef]
- Ogunrinde, A.T.; et al. Impact of Climate Change and Drought Attributes in Nigeria. Atmosphere 2022, 13(11). [Google Scholar] [CrossRef]
- Adeyeri, O.E.; et al. Hydrology and Climate Change in Africa: Contemporary Challenges, and Future Resilience Pathways. Water 2025, 17(15). [Google Scholar] [CrossRef]
- Ogunrinde, A.T.; et al. Spatiotemporal analysis of drought patterns and trends across Africa: a multi-scale SPEI approach (1960–2018). International Journal of Digital Earth 2025. 18, 1. [Google Scholar] [CrossRef]
- Niyonsenga, S.; et al. Spatiotemporal Analysis of Drought Characteristics and Their Impact on Vegetation and Crop Production in Rwanda. Remote sensing (Basel, Switzerland) 2024, 16(8), 1455. [Google Scholar] [CrossRef]
- Ekundayo, O.Y.; et al. Spatiotemporal drought assessment using vegetation health index and standardized precipitation index over Sudano-Sahelian region of Nigeria. African Geographical Review 2020, 40(4), 412–424. [Google Scholar] [CrossRef]
- Gomes, A.R.d.S.; et al. Estudo da Relação entre a Variabilidade dos índices de Vegetação e Temperatura da Região Nordeste do Brasil. Revista Brasileira de Meteorologia 2019, 34(3), 359–368. [Google Scholar] [CrossRef]
- Schonlau, M.; Zou, R.Y. The random forest algorithm for statistical learning. The Stata Journal: Promoting communications on statistics and Stata 2020, 20(1), 3–29. [Google Scholar] [CrossRef]
- Black, E.; et al. Global Change in Agricultural Flash Drought over the 21st Century. Advances in Atmospheric Sciences 2024, 41(2), 209–220. [Google Scholar] [CrossRef]
- Christian, J. I.; Basara, J. B.; Hunt, E. D.; Otkin, J. A.; Furtado, J. C.; Mishra, V.; Xiao, X.; Randall, R. M. Global distribution, trends, and drivers of flash drought occurrence. Nature Communications 2021, 12(1), 6330. [Google Scholar] [CrossRef]
- Harris, B. L.; Taylor, C. M.; Dorigo, W.; Zotta, R.-M.; Ghent, D.; Noguera, I. Global observations of land-atmosphere interactions during flash drought. Hydrology and Earth System Sciences 2025, 29(23), 6917–6933. [Google Scholar] [CrossRef]
- Shi, R.; Liu, Y.; Zhu, Y.; Ren, L.; Liu, Y.; Zhang, X.; Zhang, L. Impact of flash droughts on global crop yields considering crop phenology and irrigation conditions. Agricultural and Forest Meteorology 2025, 373, 110763. [Google Scholar] [CrossRef]
Figure 1.
Map of the study area showing the topography of Plateau State, Nigeria.
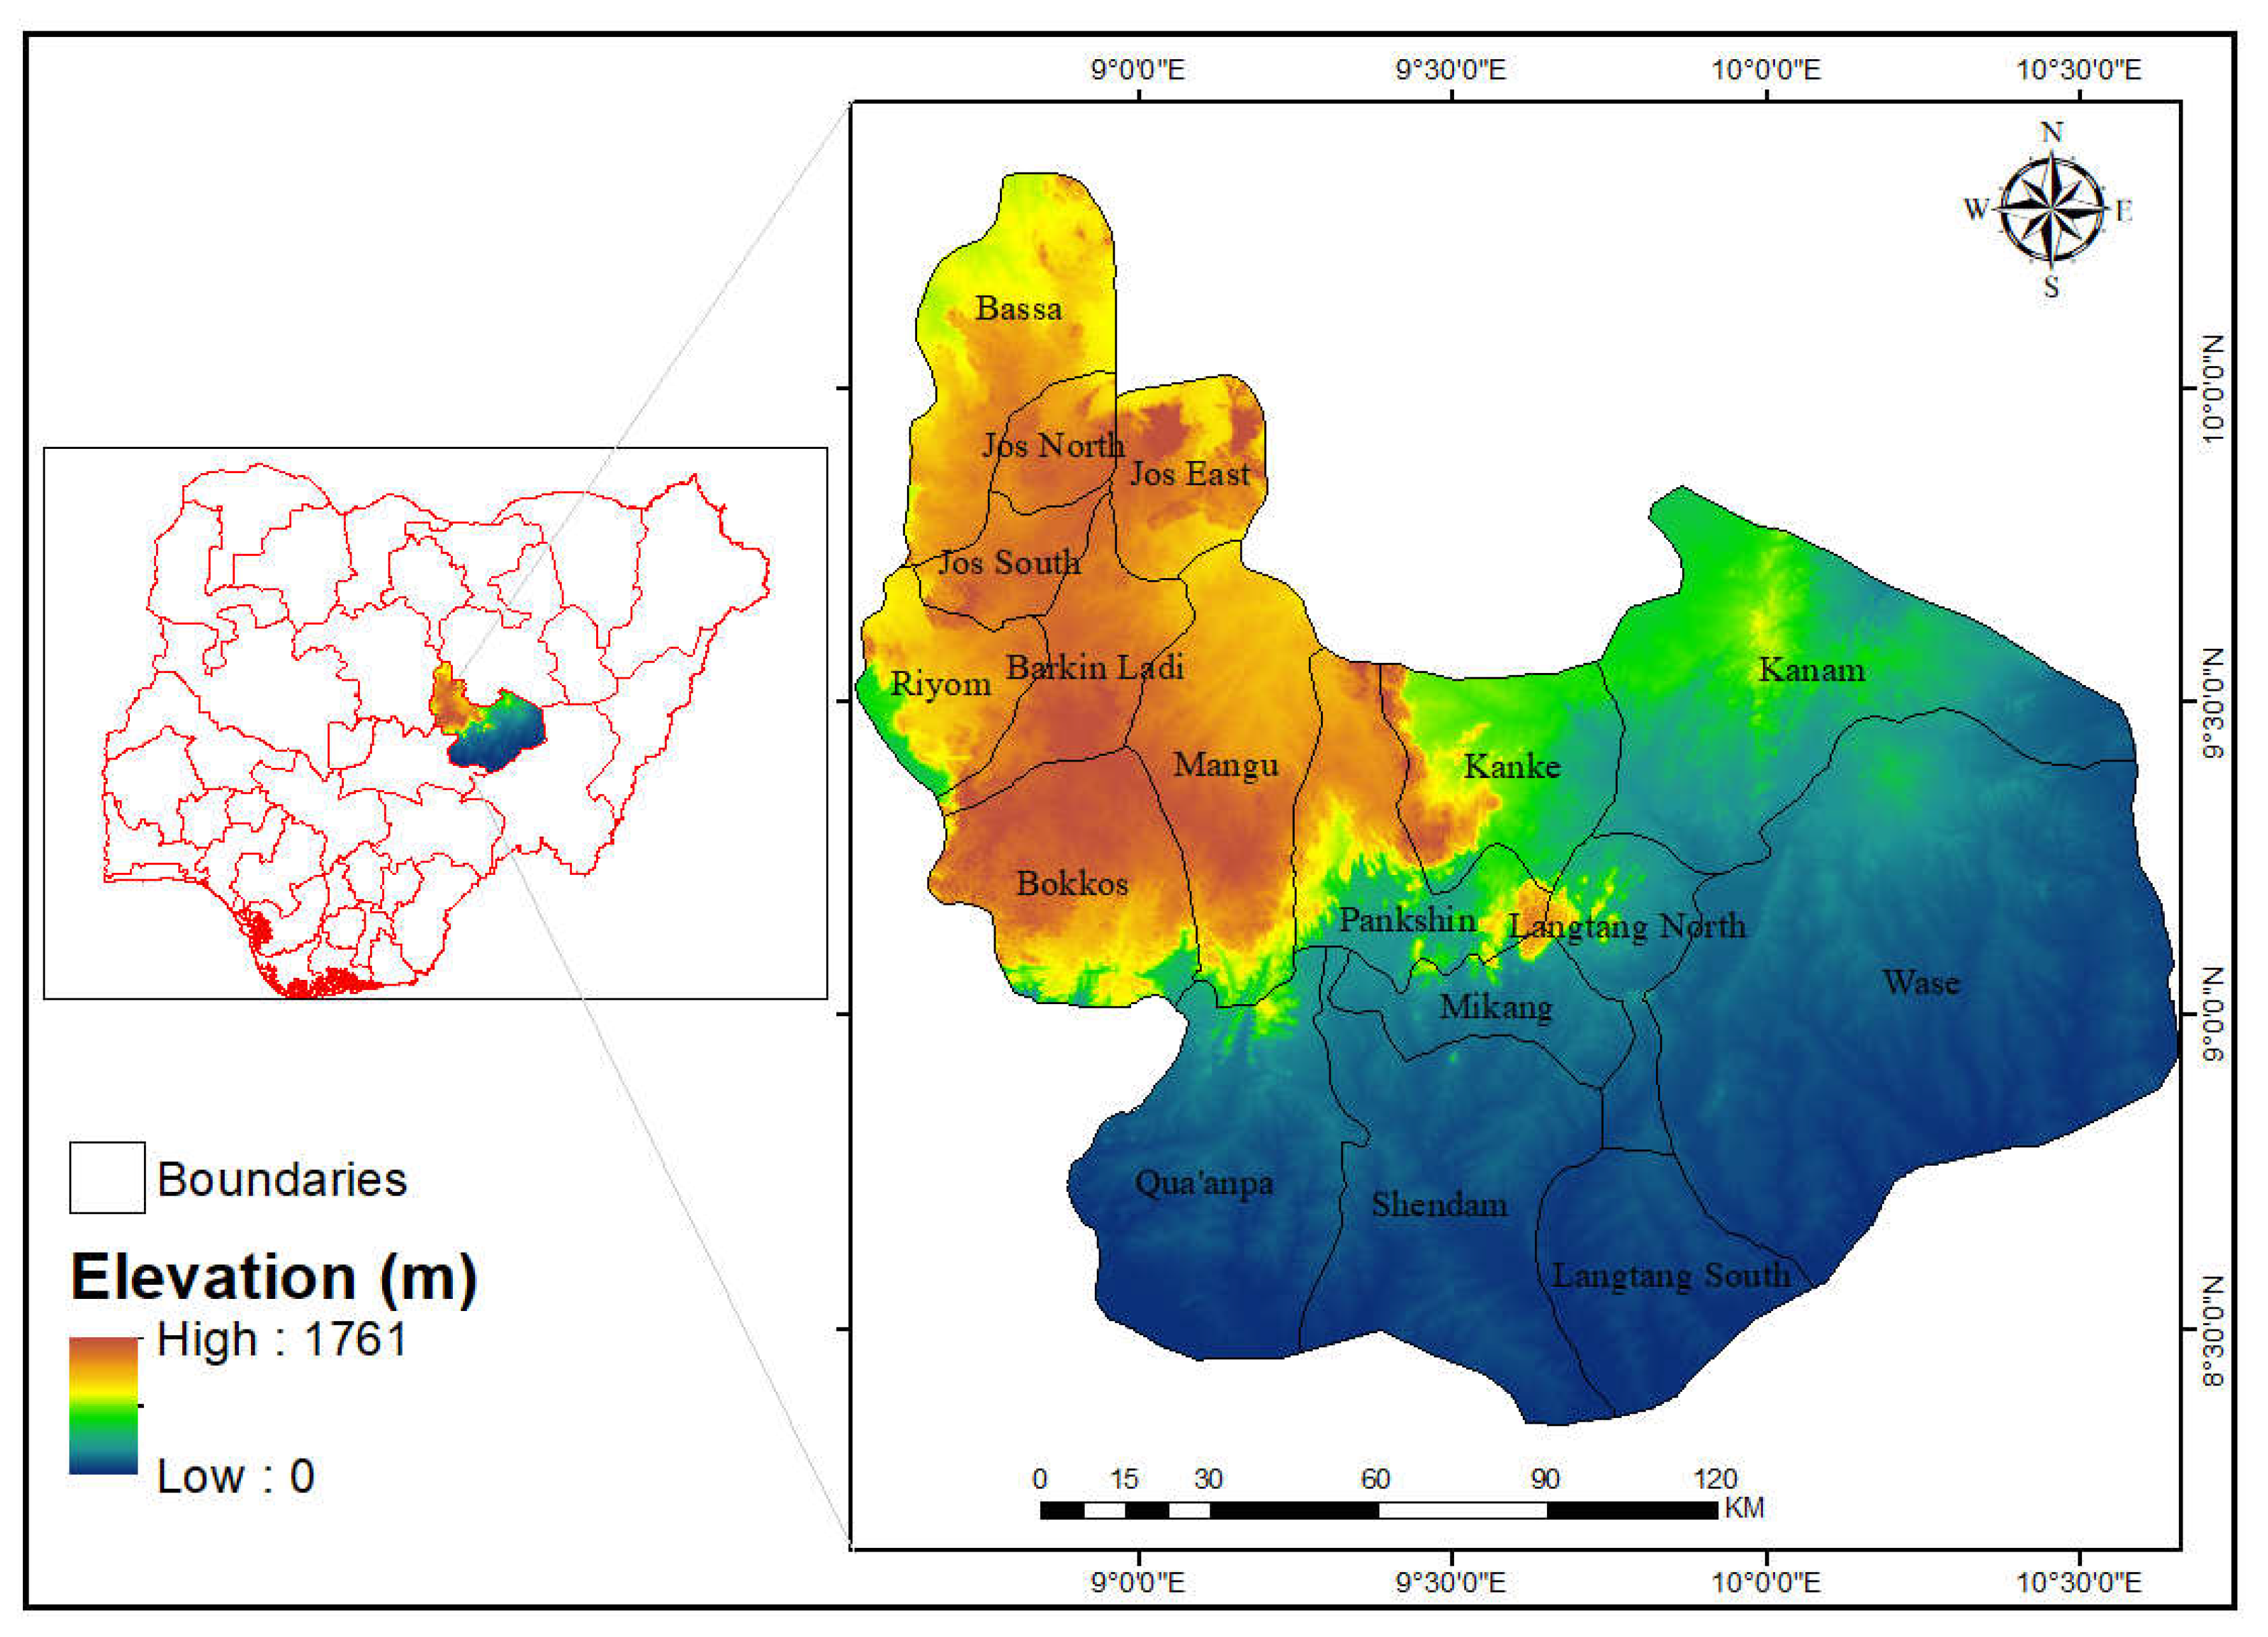
Figure 2.
0: Methodology Flow chart of the study.
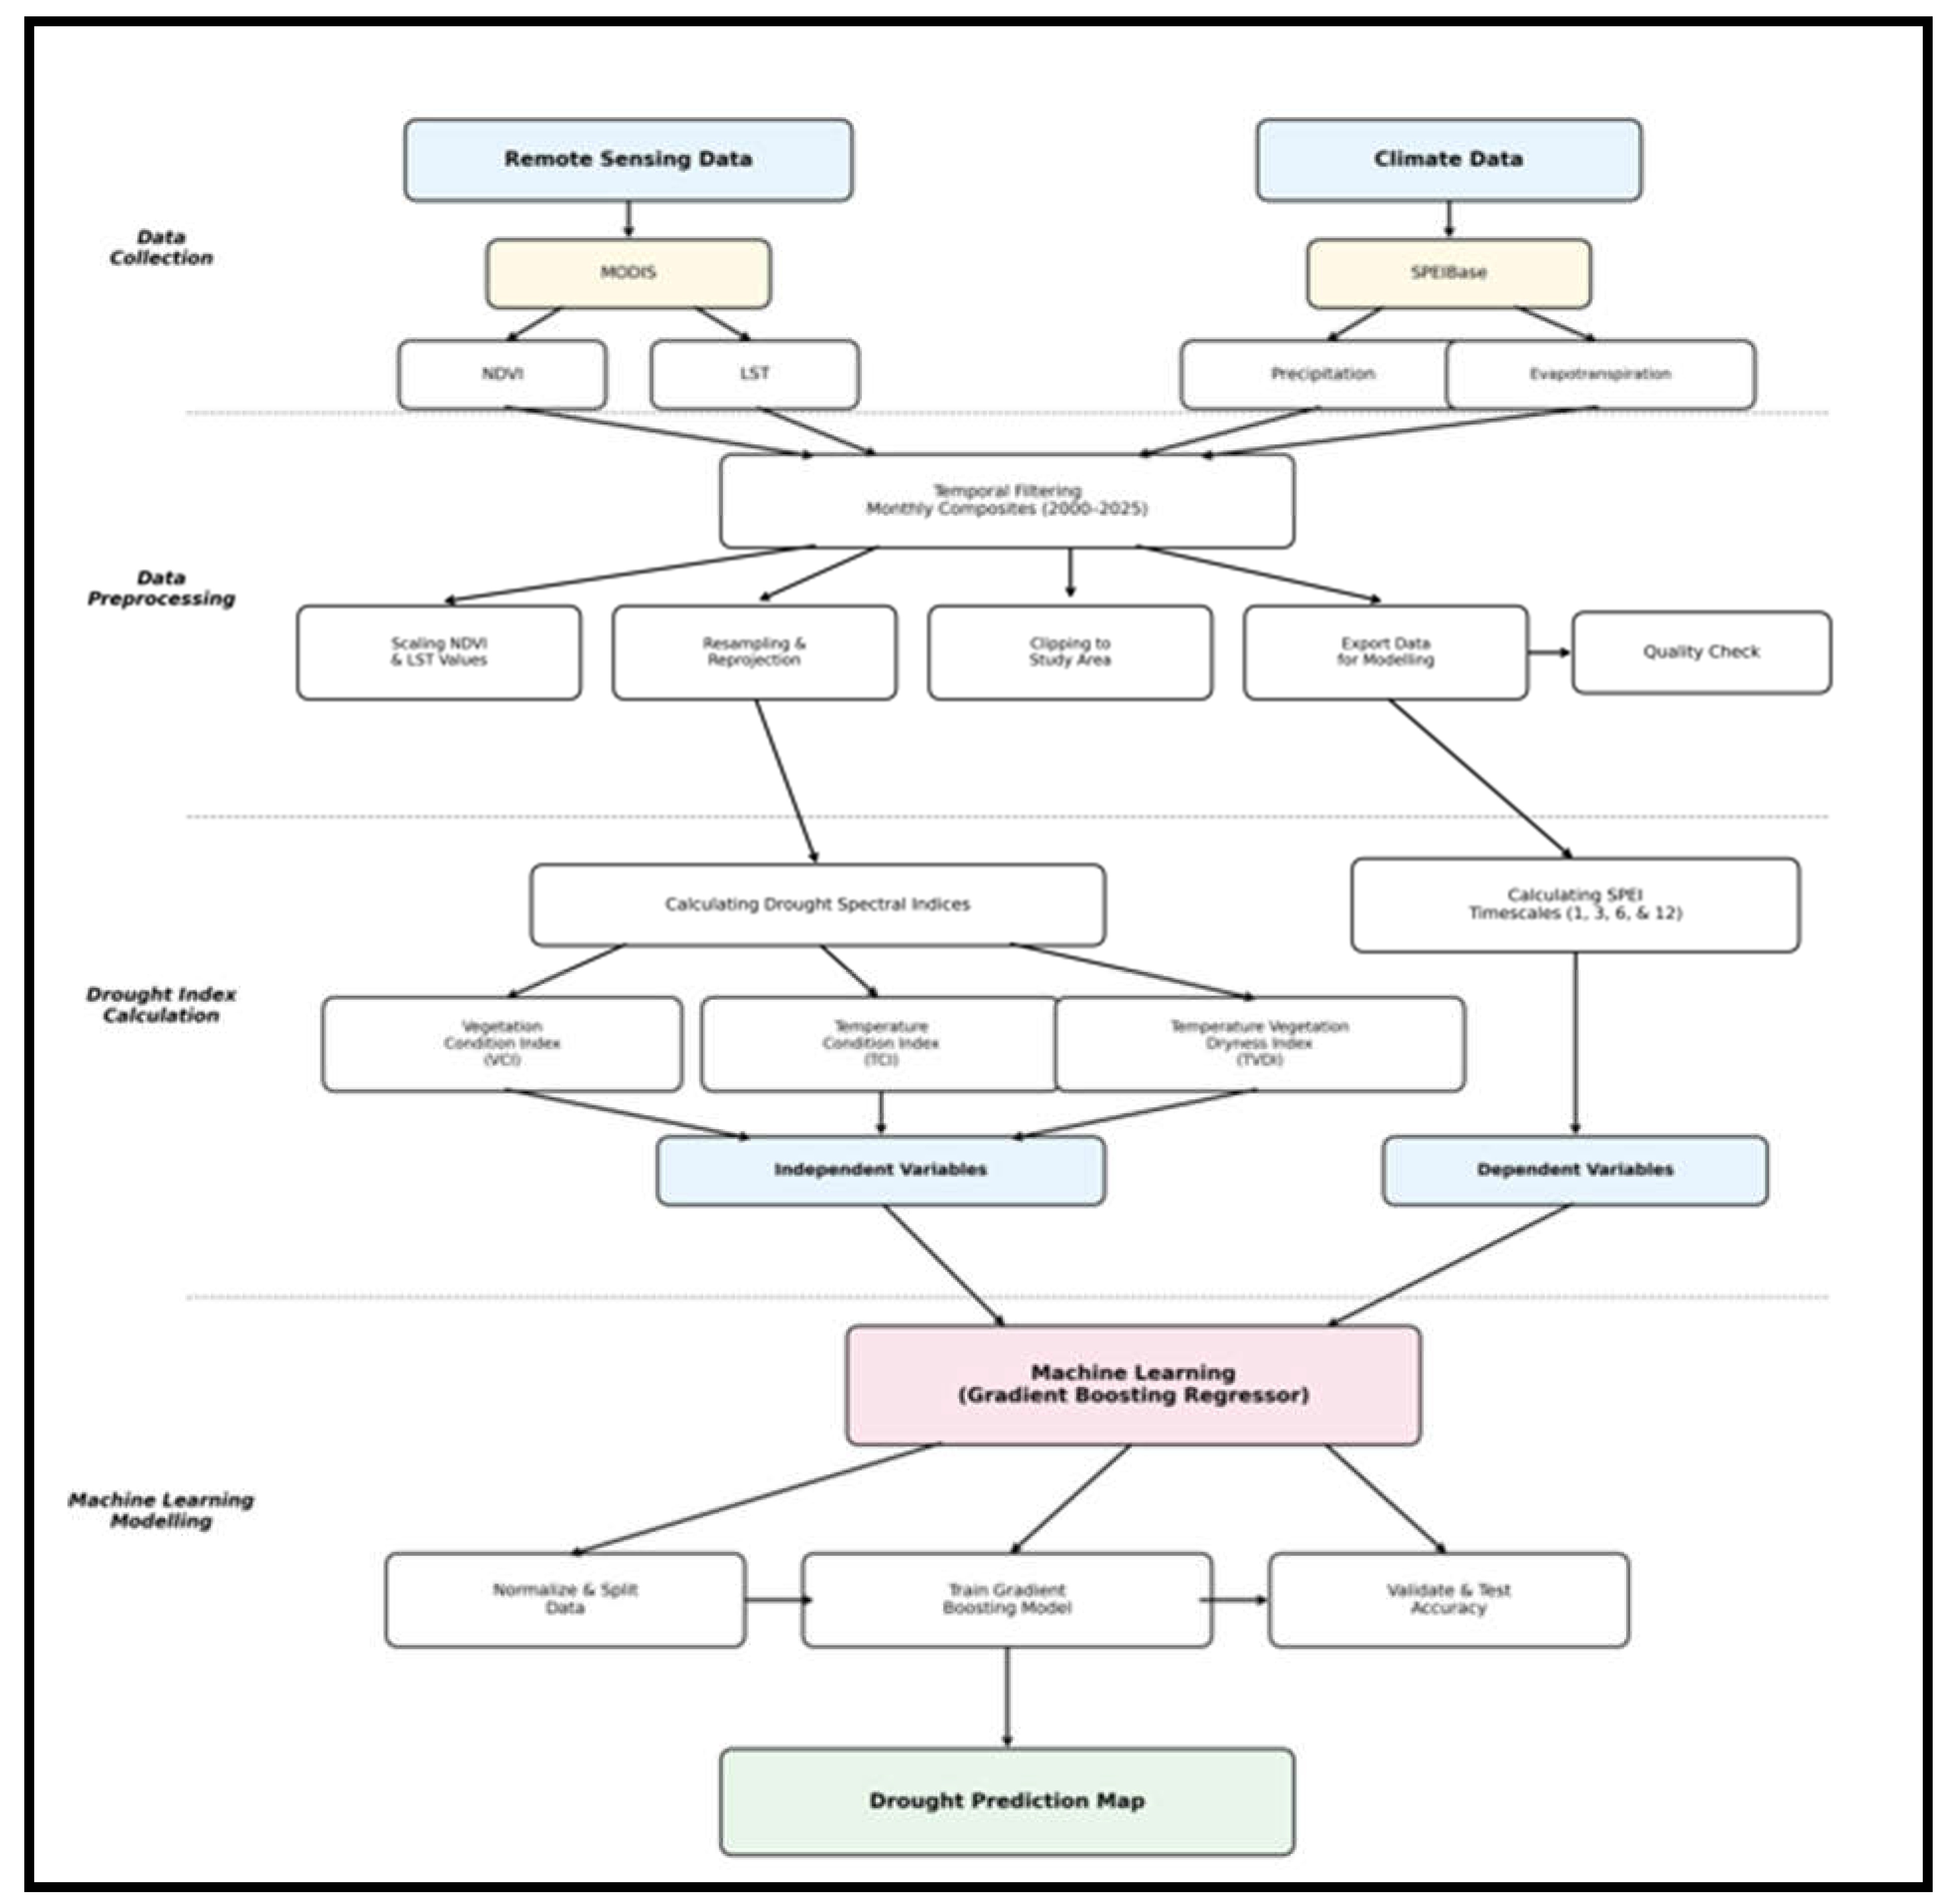
Figure 3.
Temporal variation in SPEI timescale from 2000 to 2024. Box (A): SPEI_01 timescale, Box (B): SPEI_03 timescale, Box (C): SPEI_06 timescale, and Box (D): SPEI_12 timescale. Note: All timescales (SPEI 1,3,6, & 12) were derived from SPEIbase and processed using Google Earth Engine.
Figure 3.
Temporal variation in SPEI timescale from 2000 to 2024. Box (A): SPEI_01 timescale, Box (B): SPEI_03 timescale, Box (C): SPEI_06 timescale, and Box (D): SPEI_12 timescale. Note: All timescales (SPEI 1,3,6, & 12) were derived from SPEIbase and processed using Google Earth Engine.
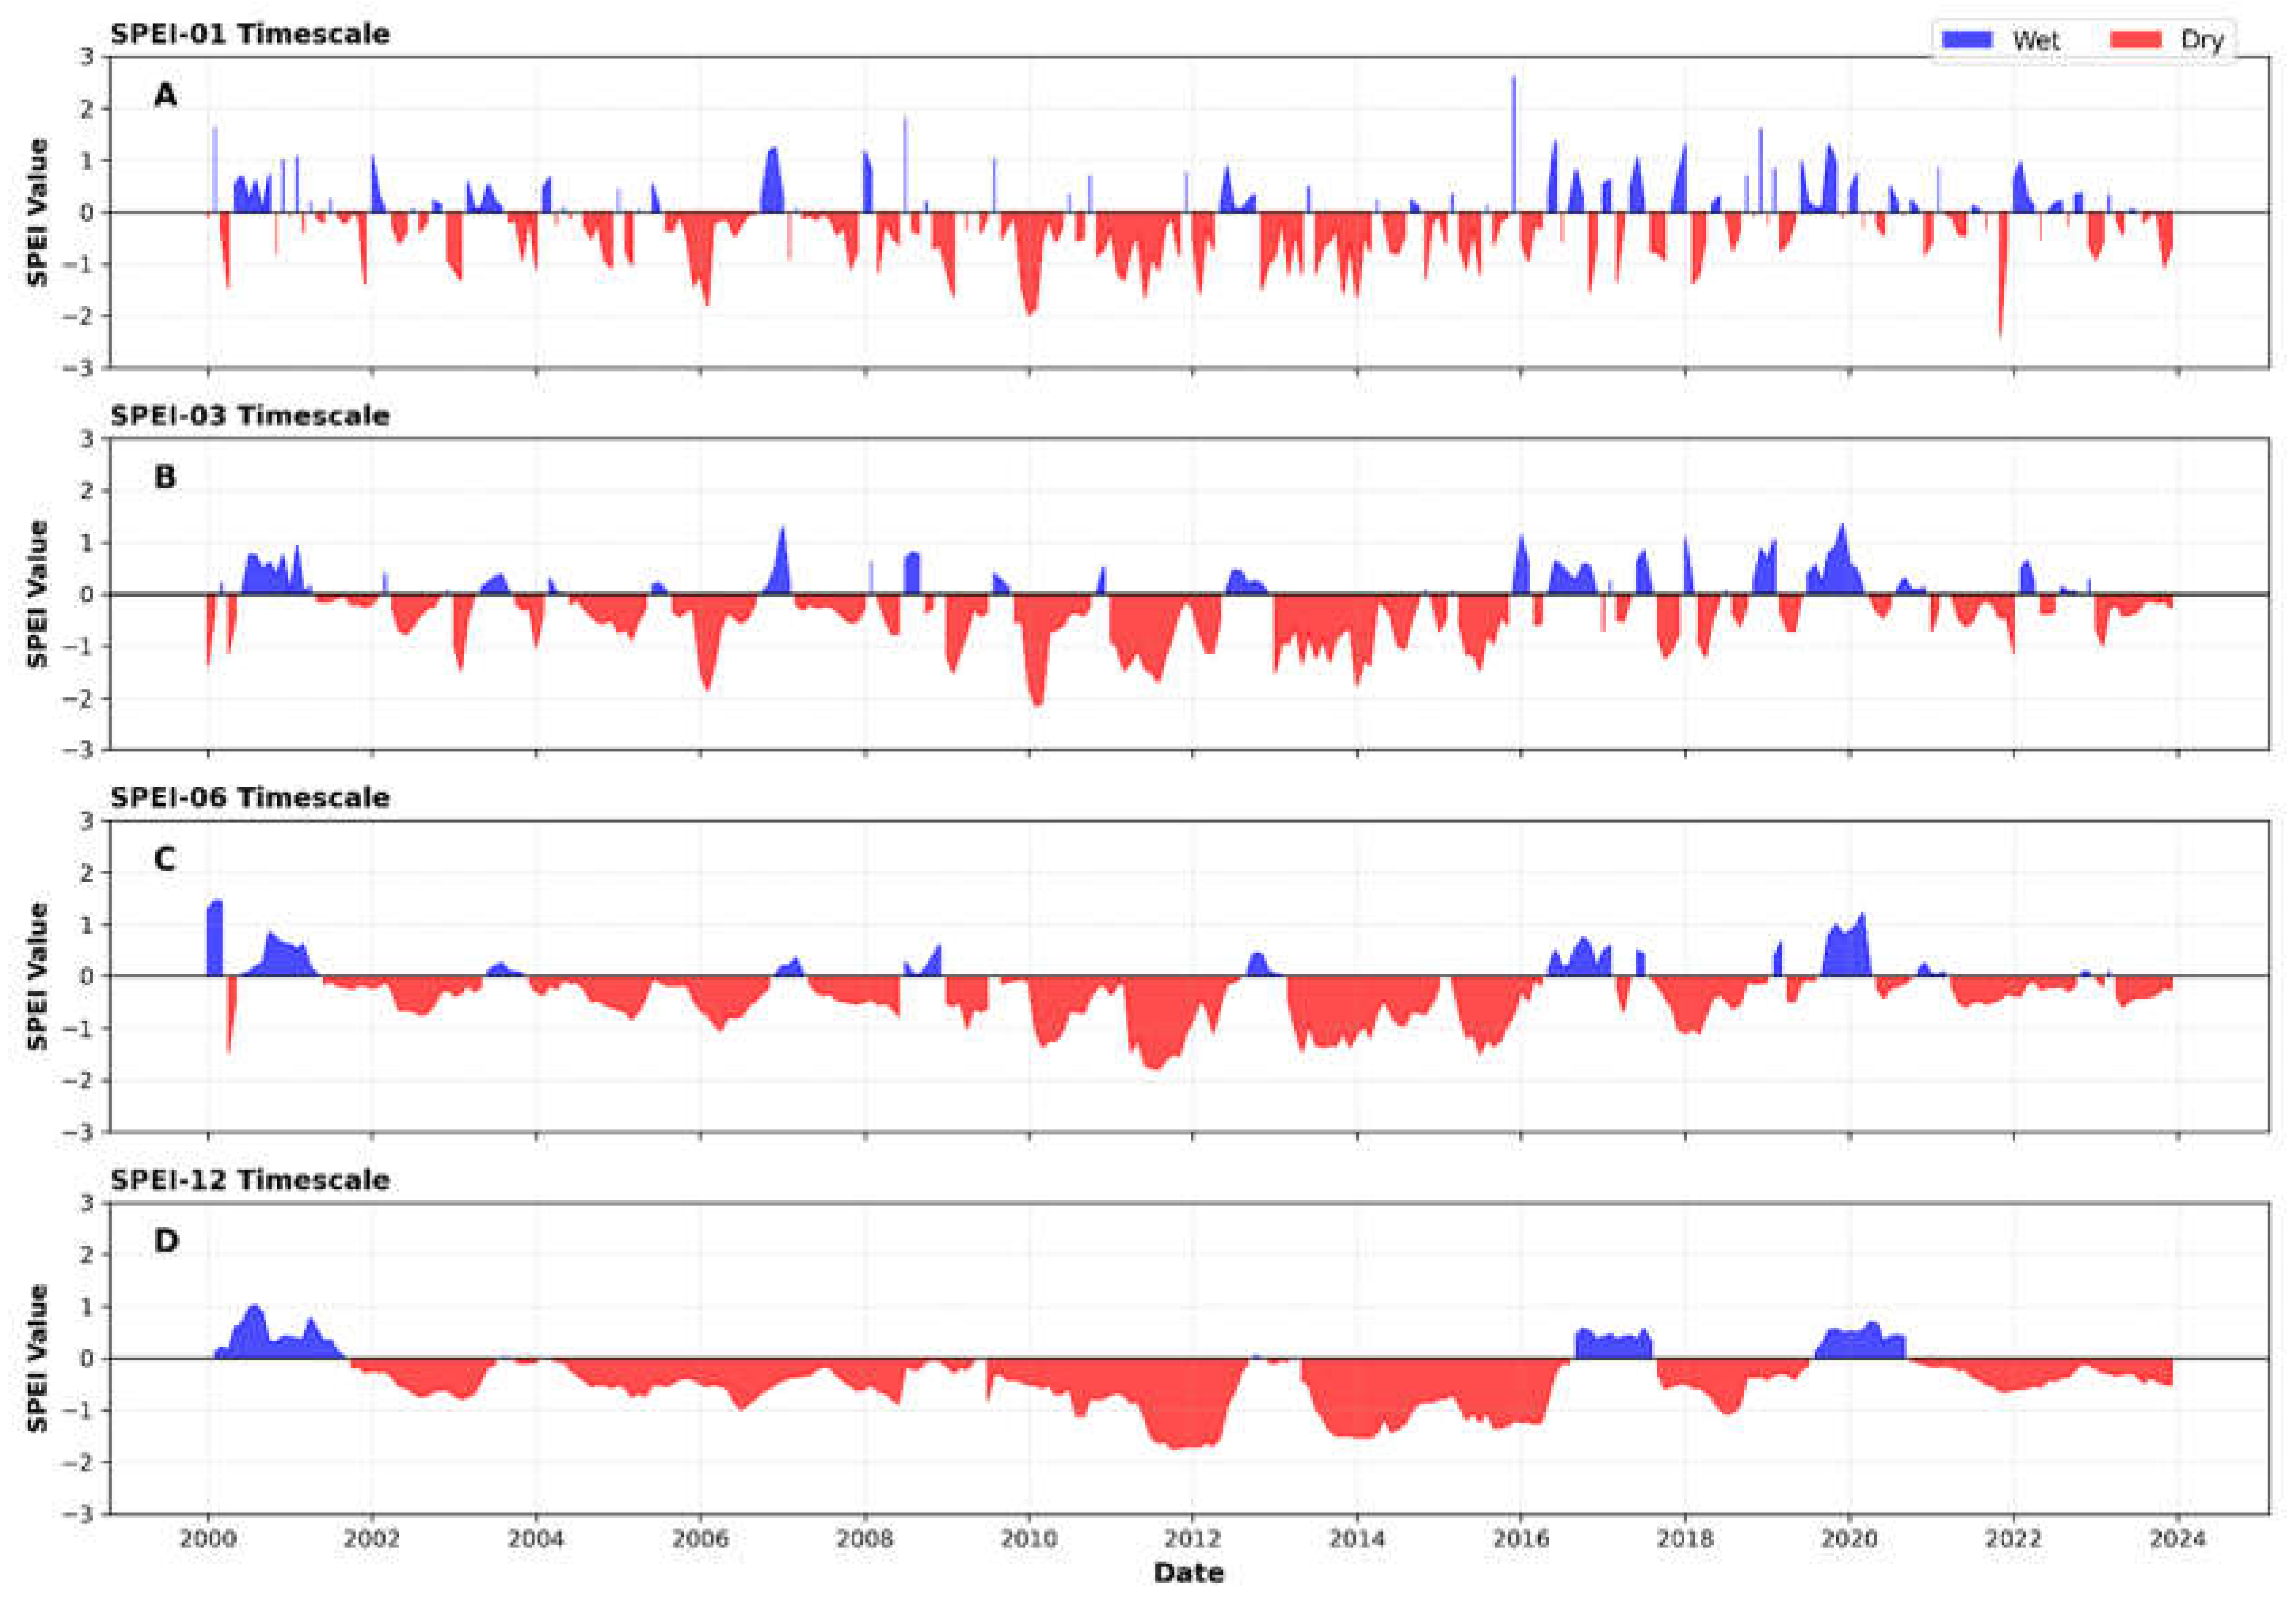
Figure 4.
Spatio-temporal variation in the Vegetation Condition Index.
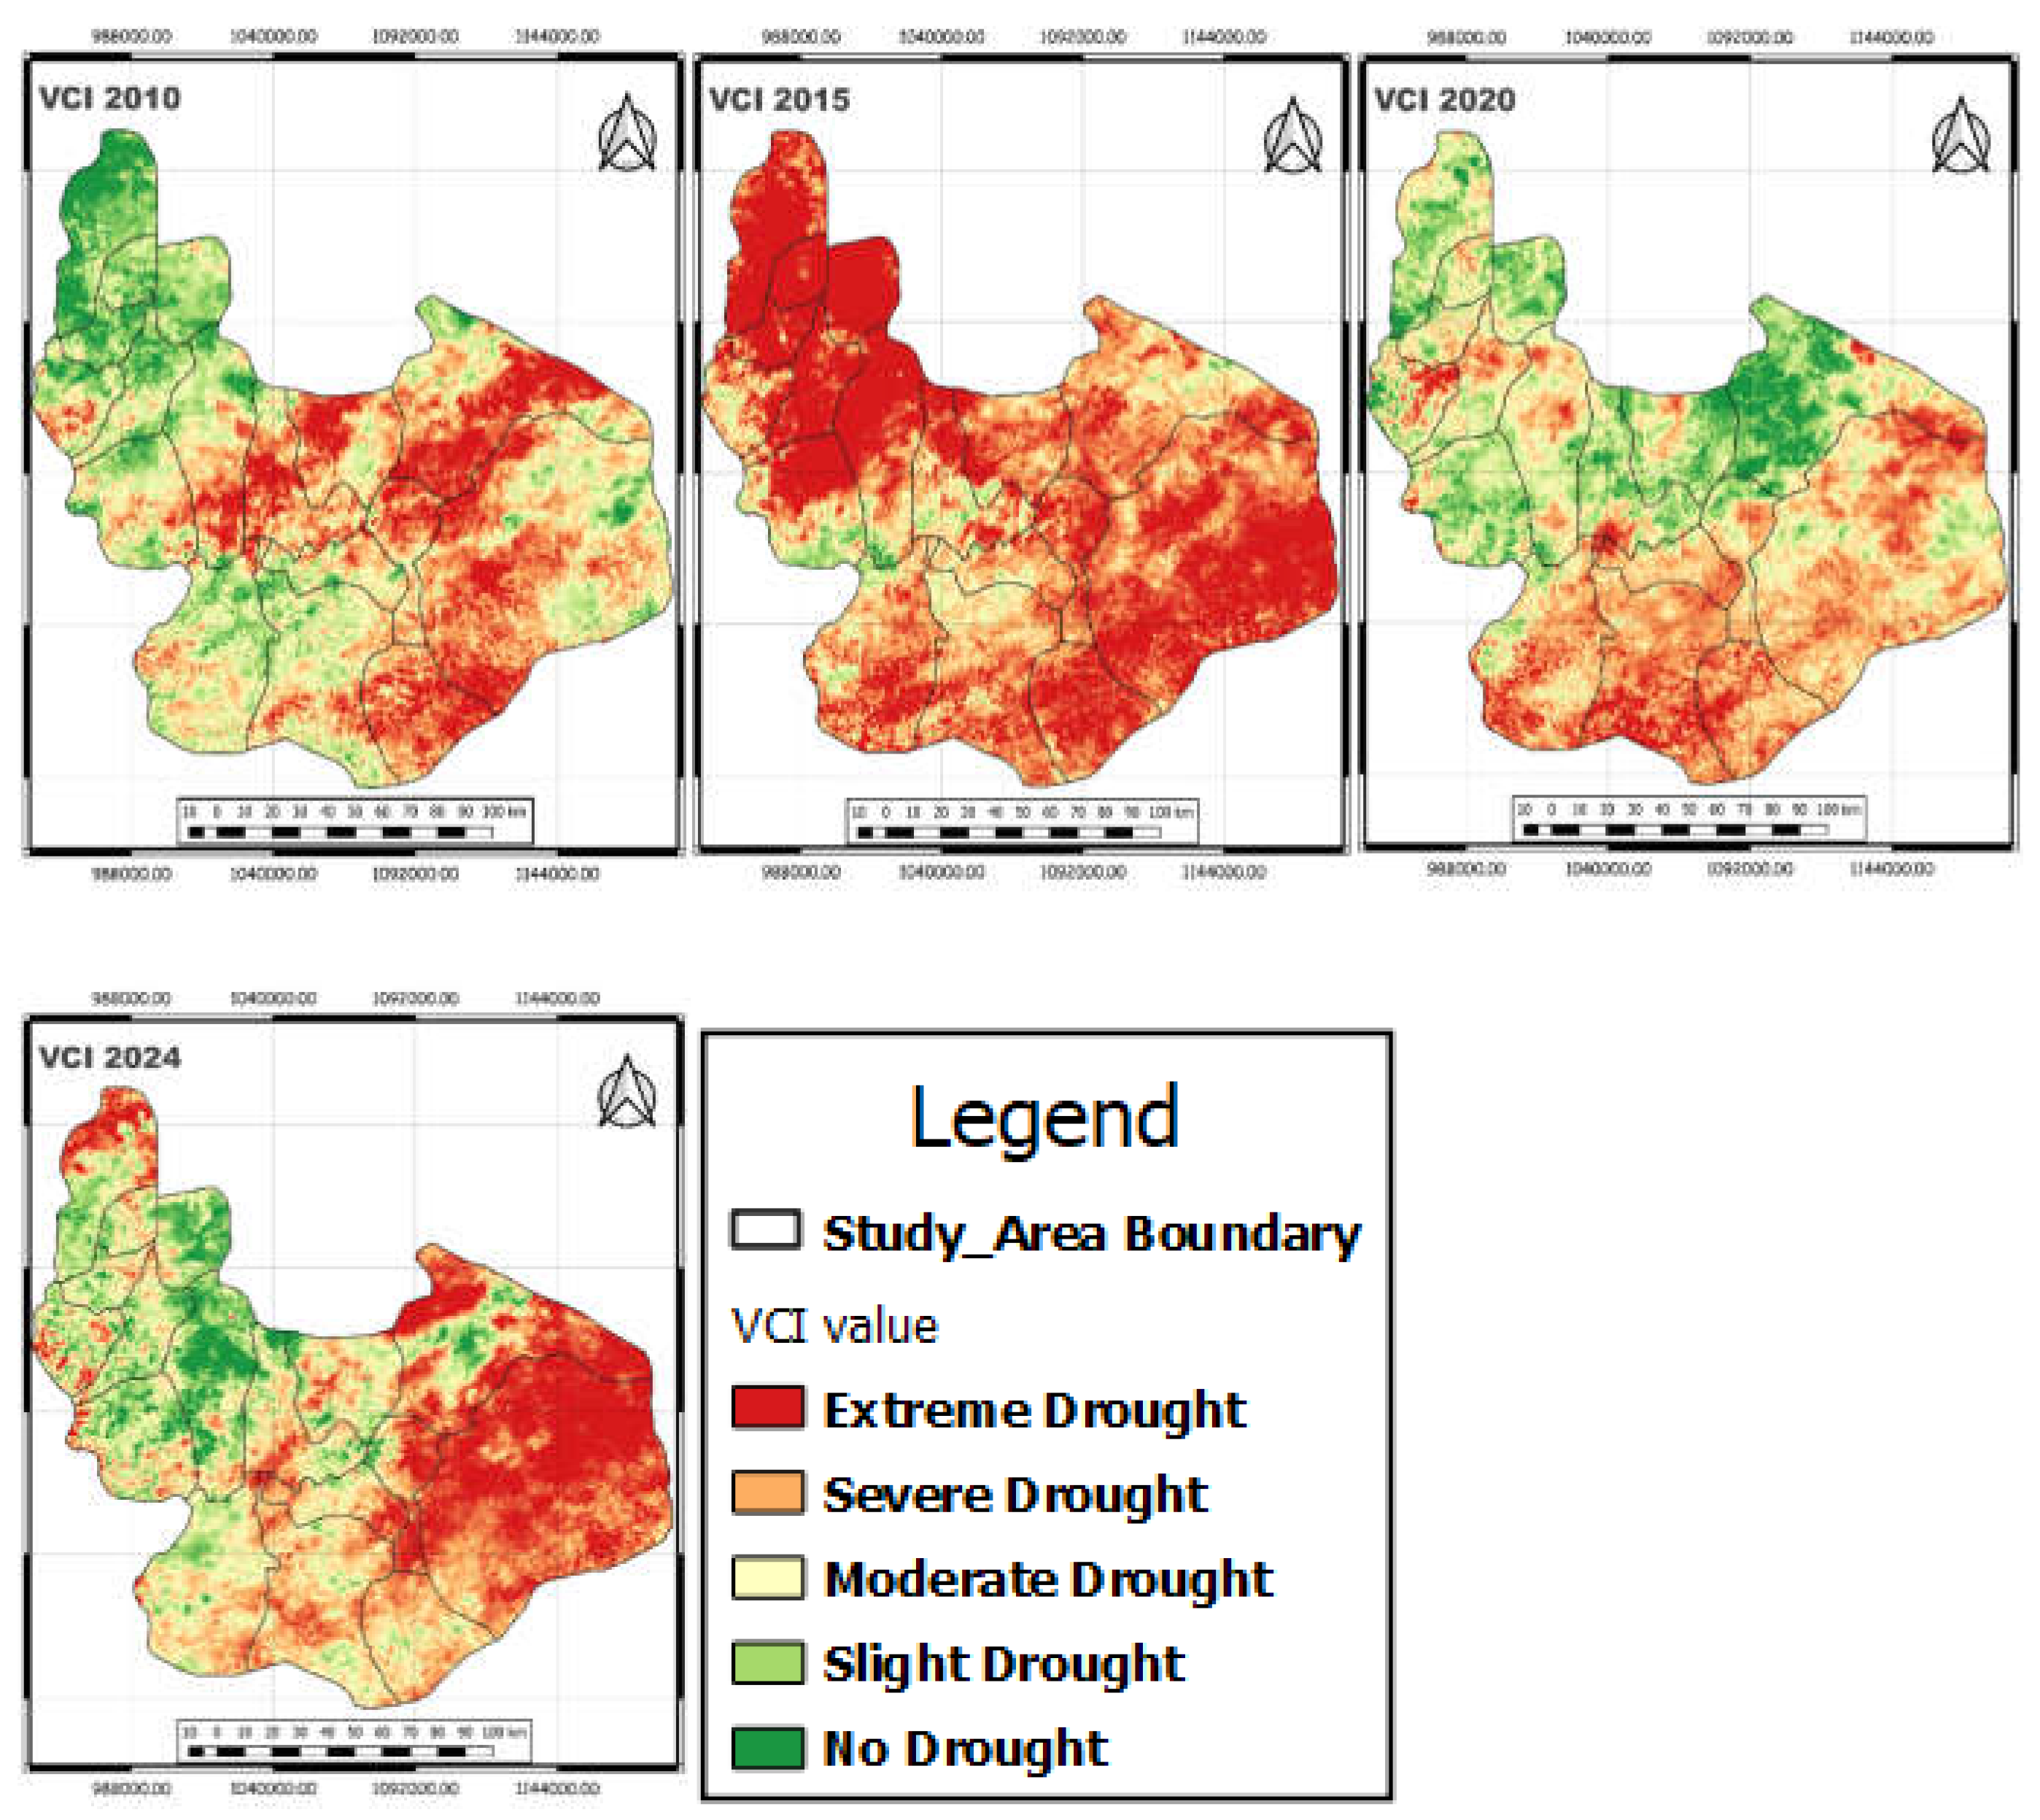
Figure 5.
Figure 5. Spatio-temporal variation in the Temperature Condition Index.
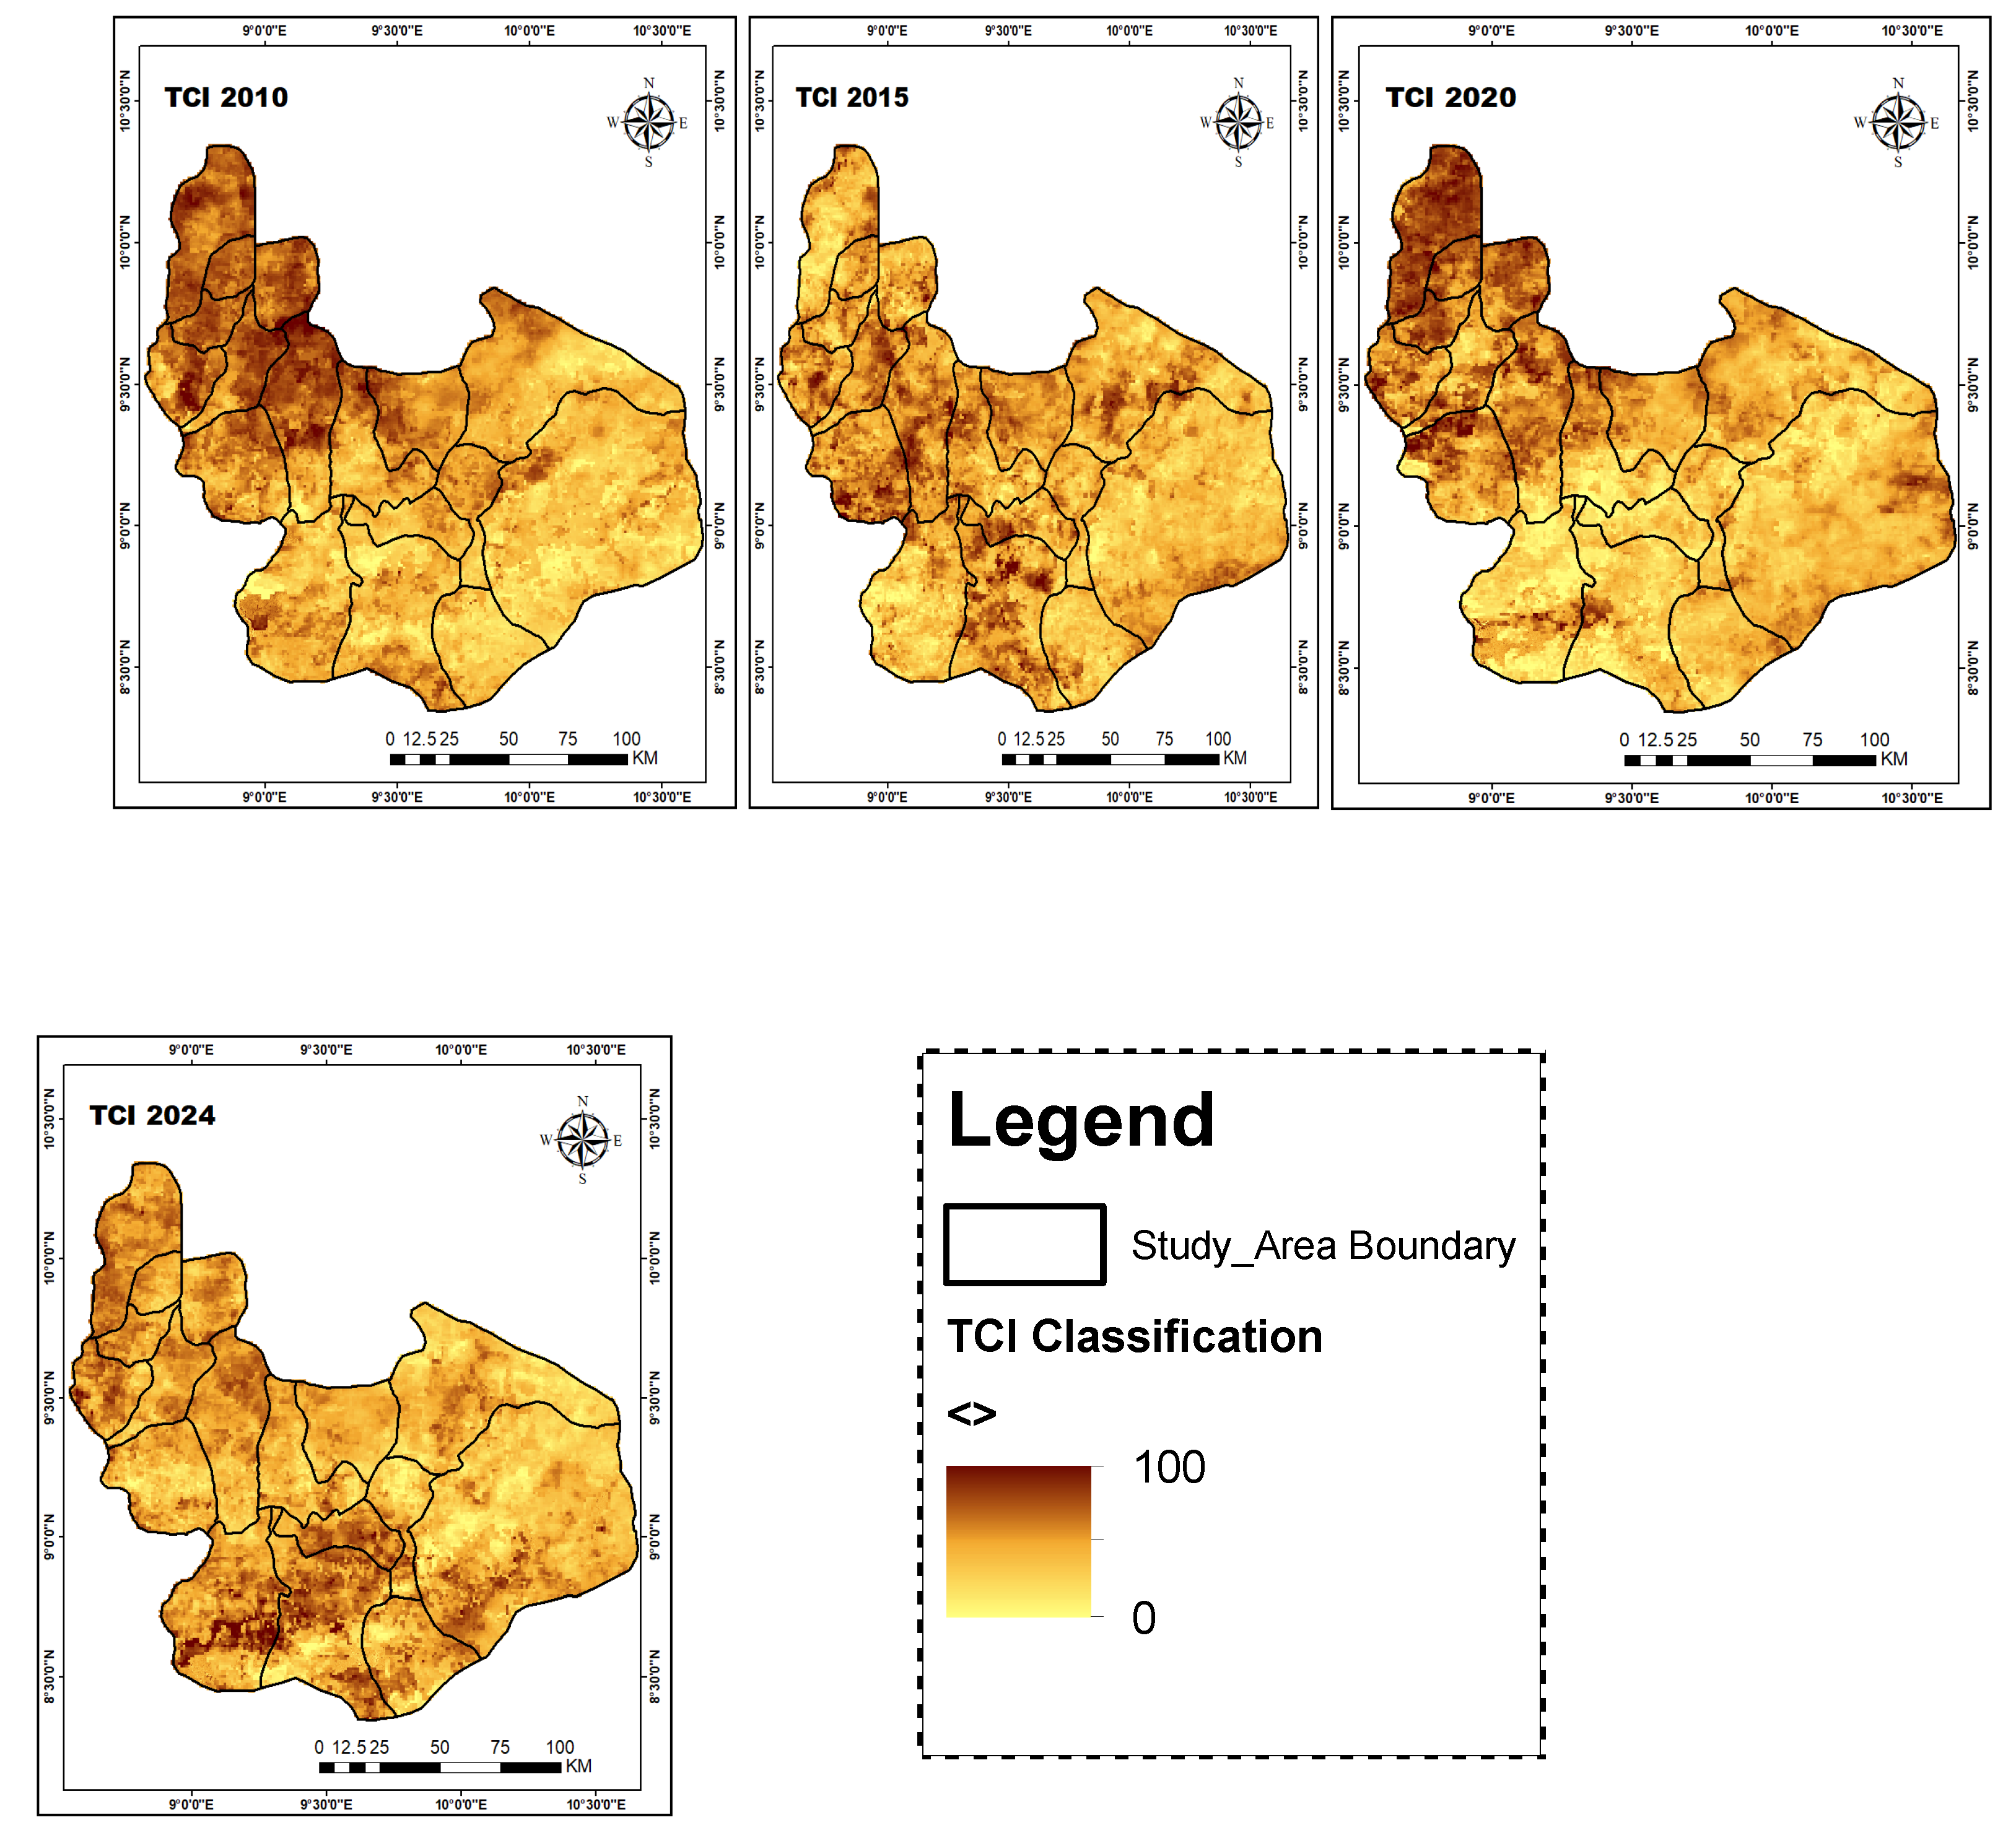
Figure 6.
Spatio-temporal variation in Temperature Vegetation Drought Index.
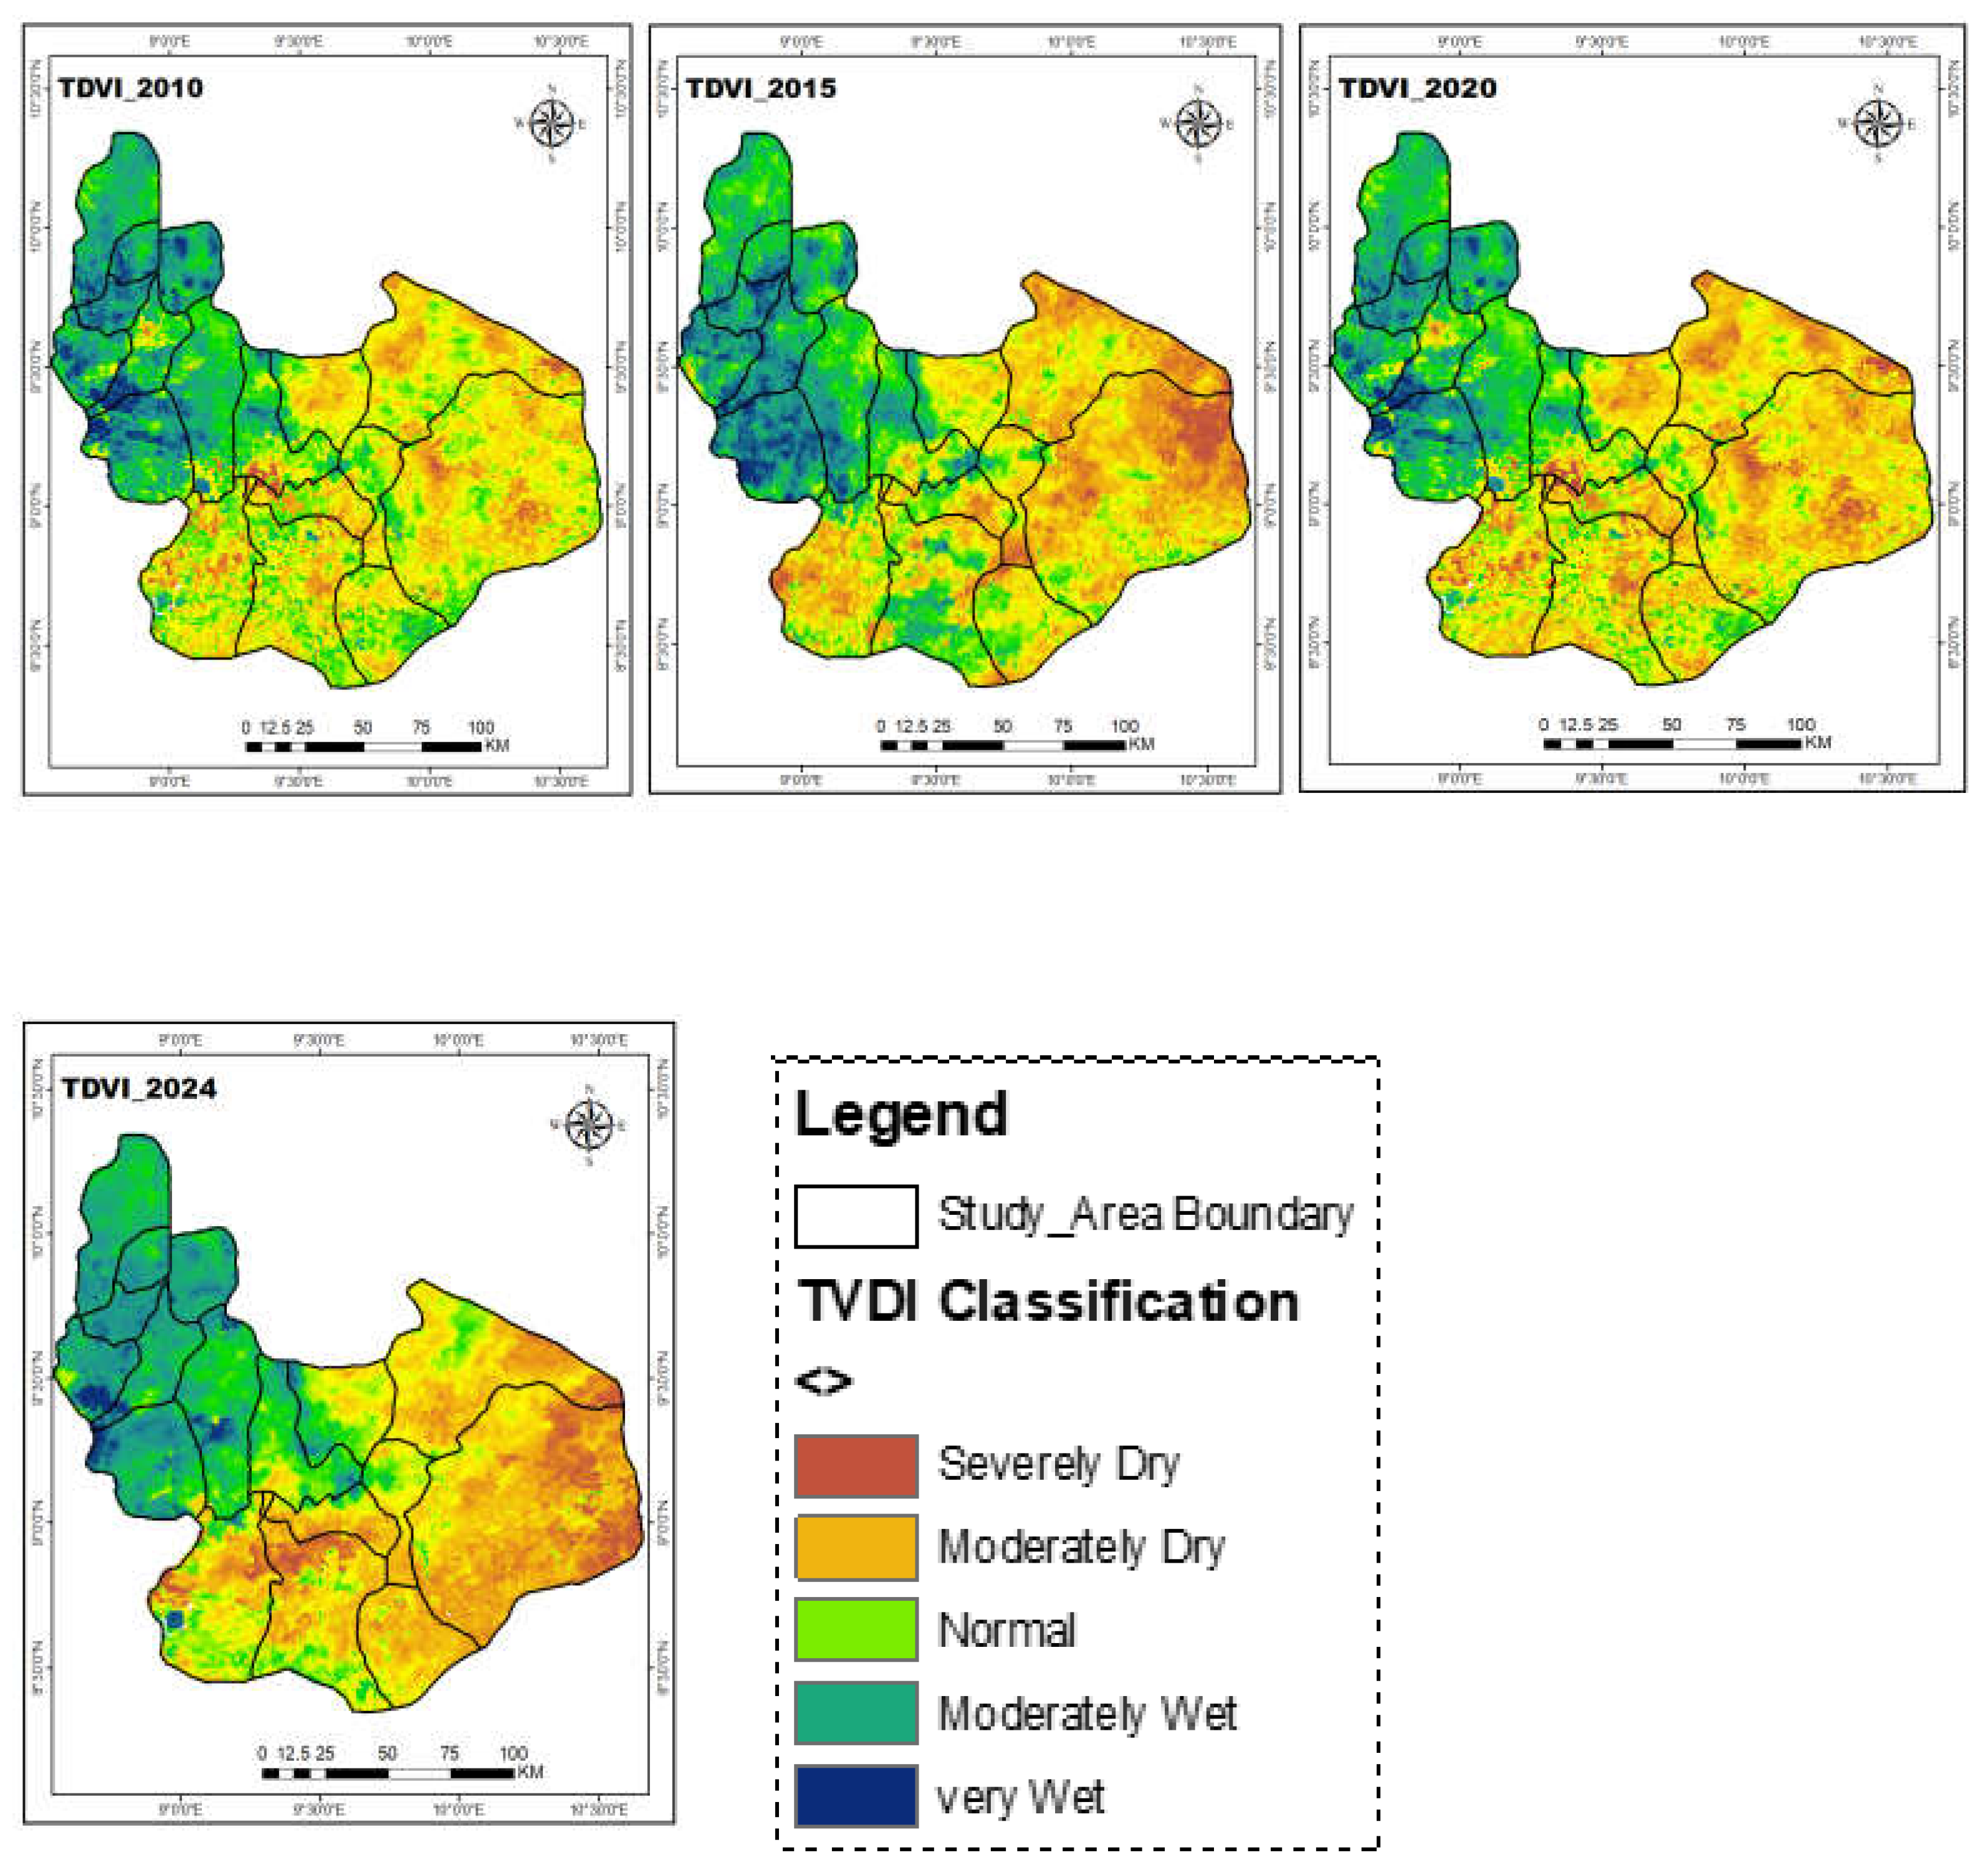
Figure 7.
R² scores of machine learning models during training and testing phases.
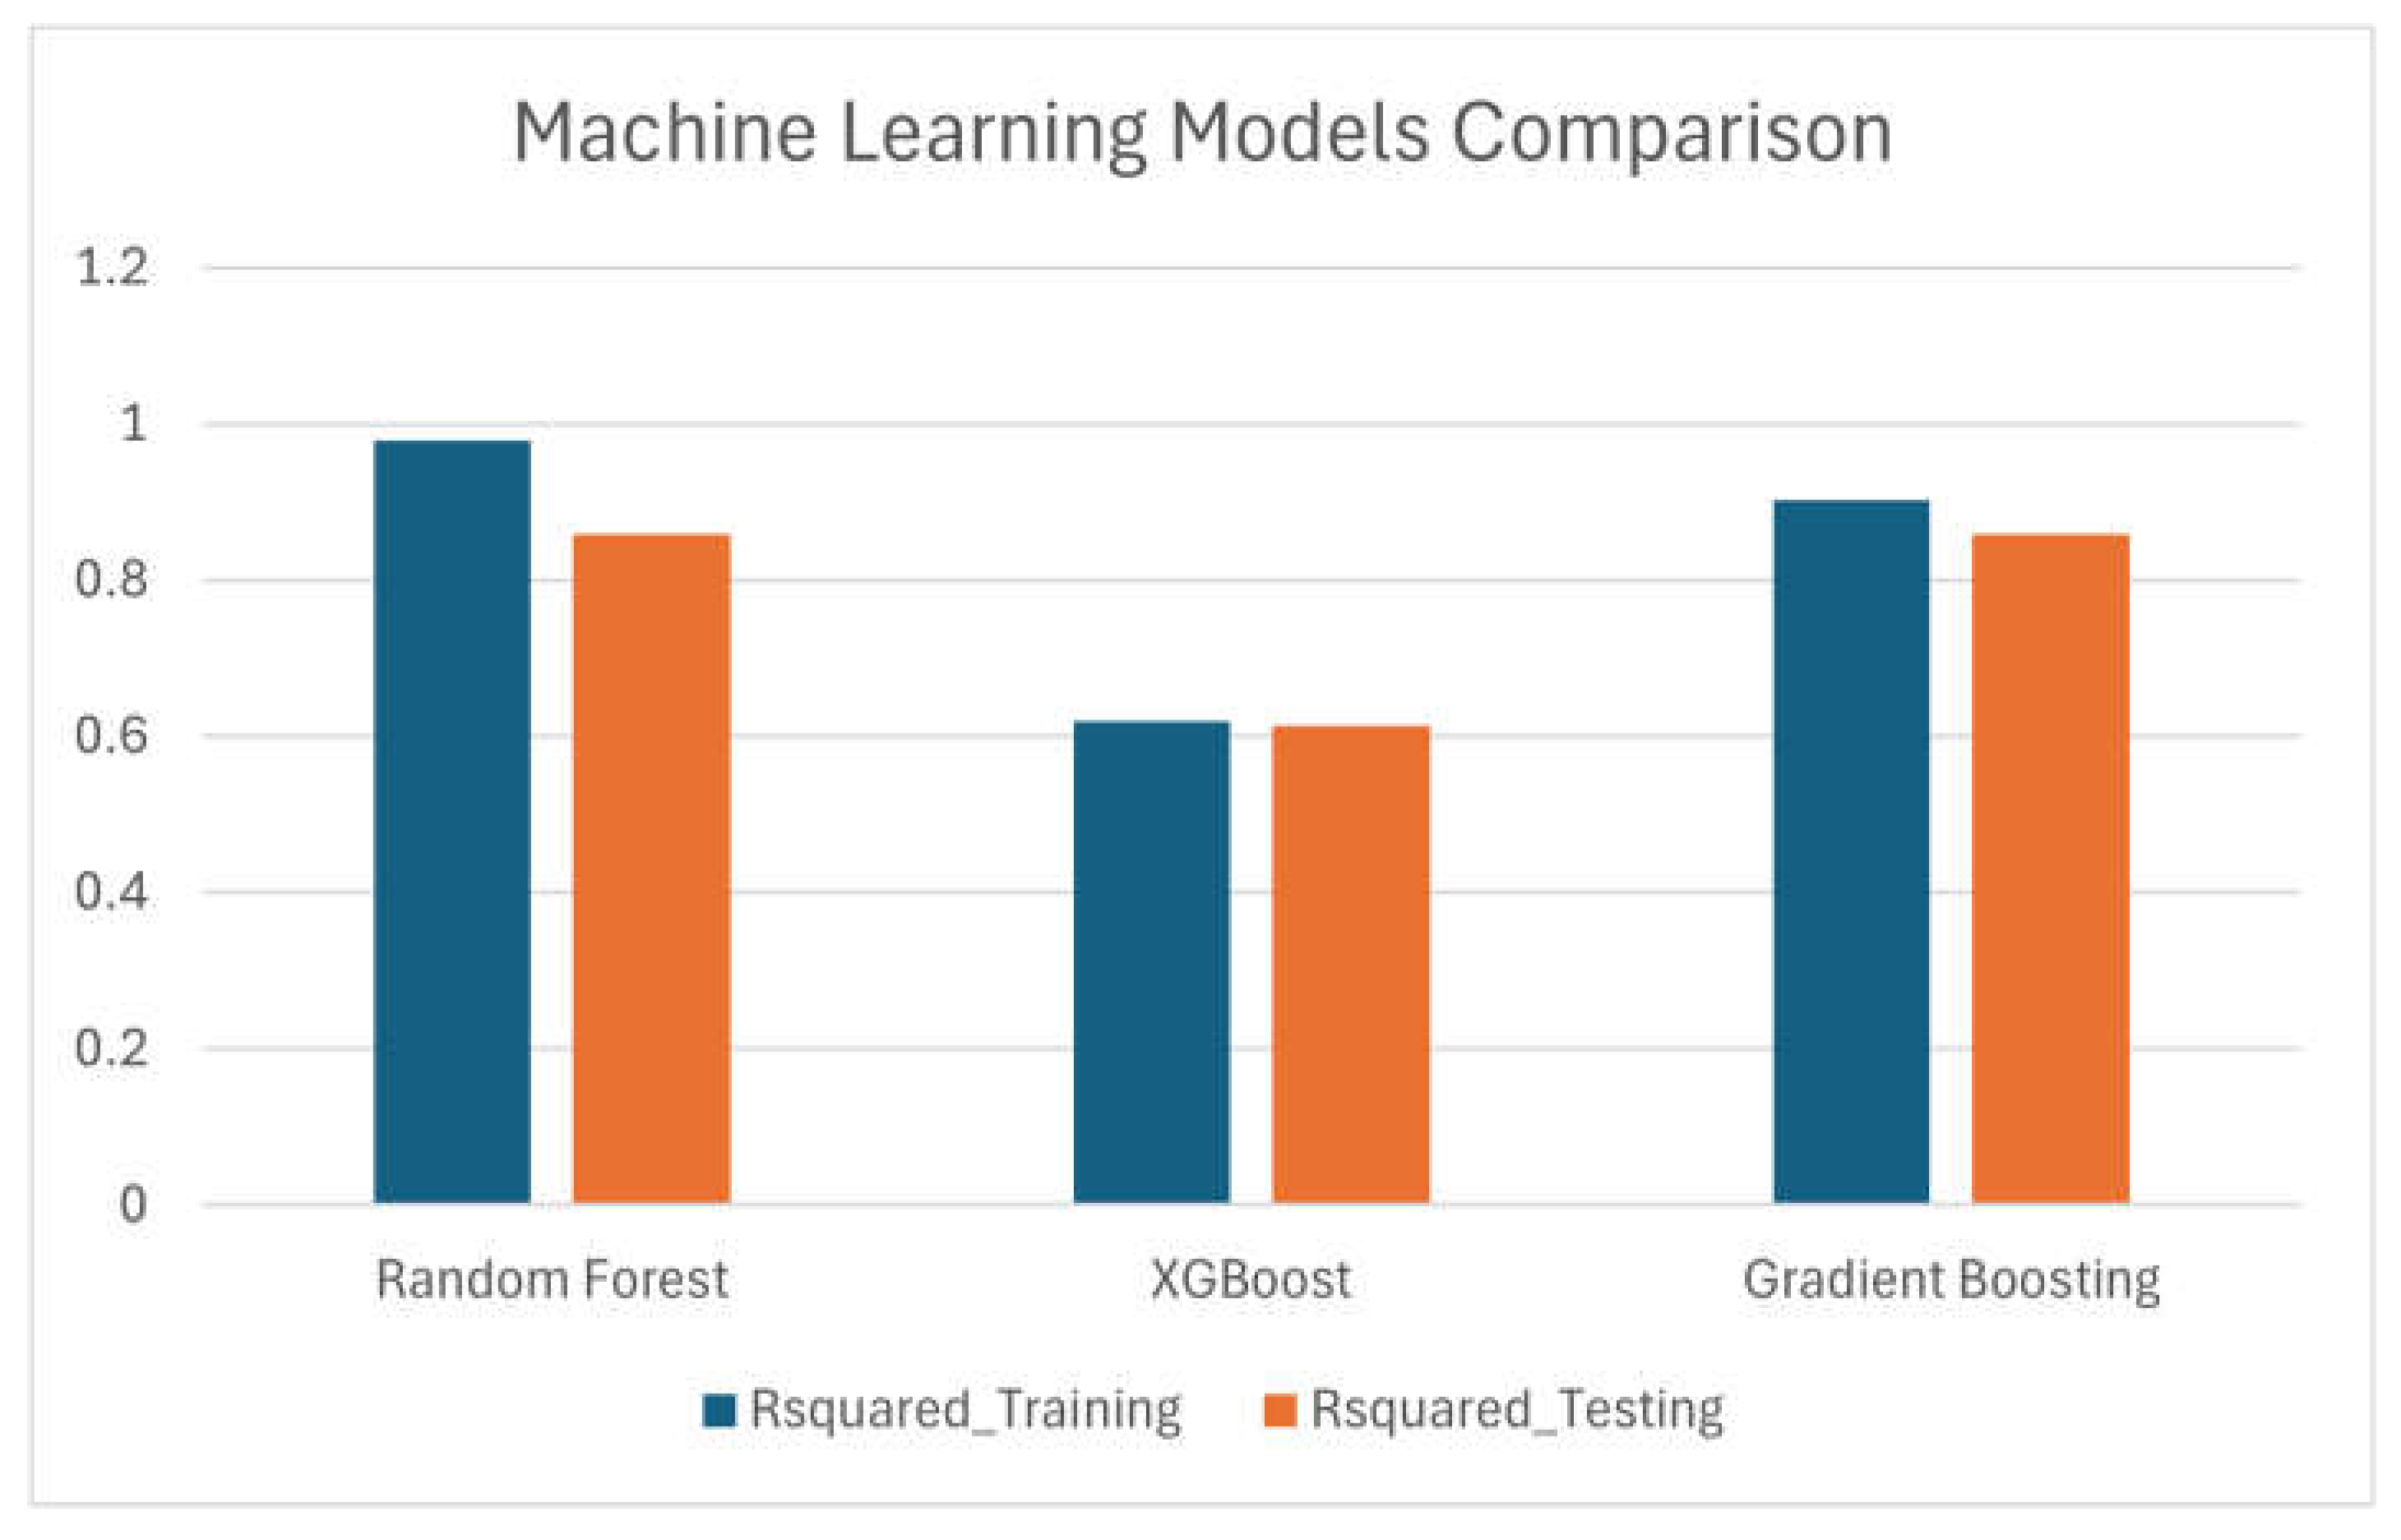
Figure 8.
SPEI Drought Prediction plot based on XGBoost Machine Learning model.
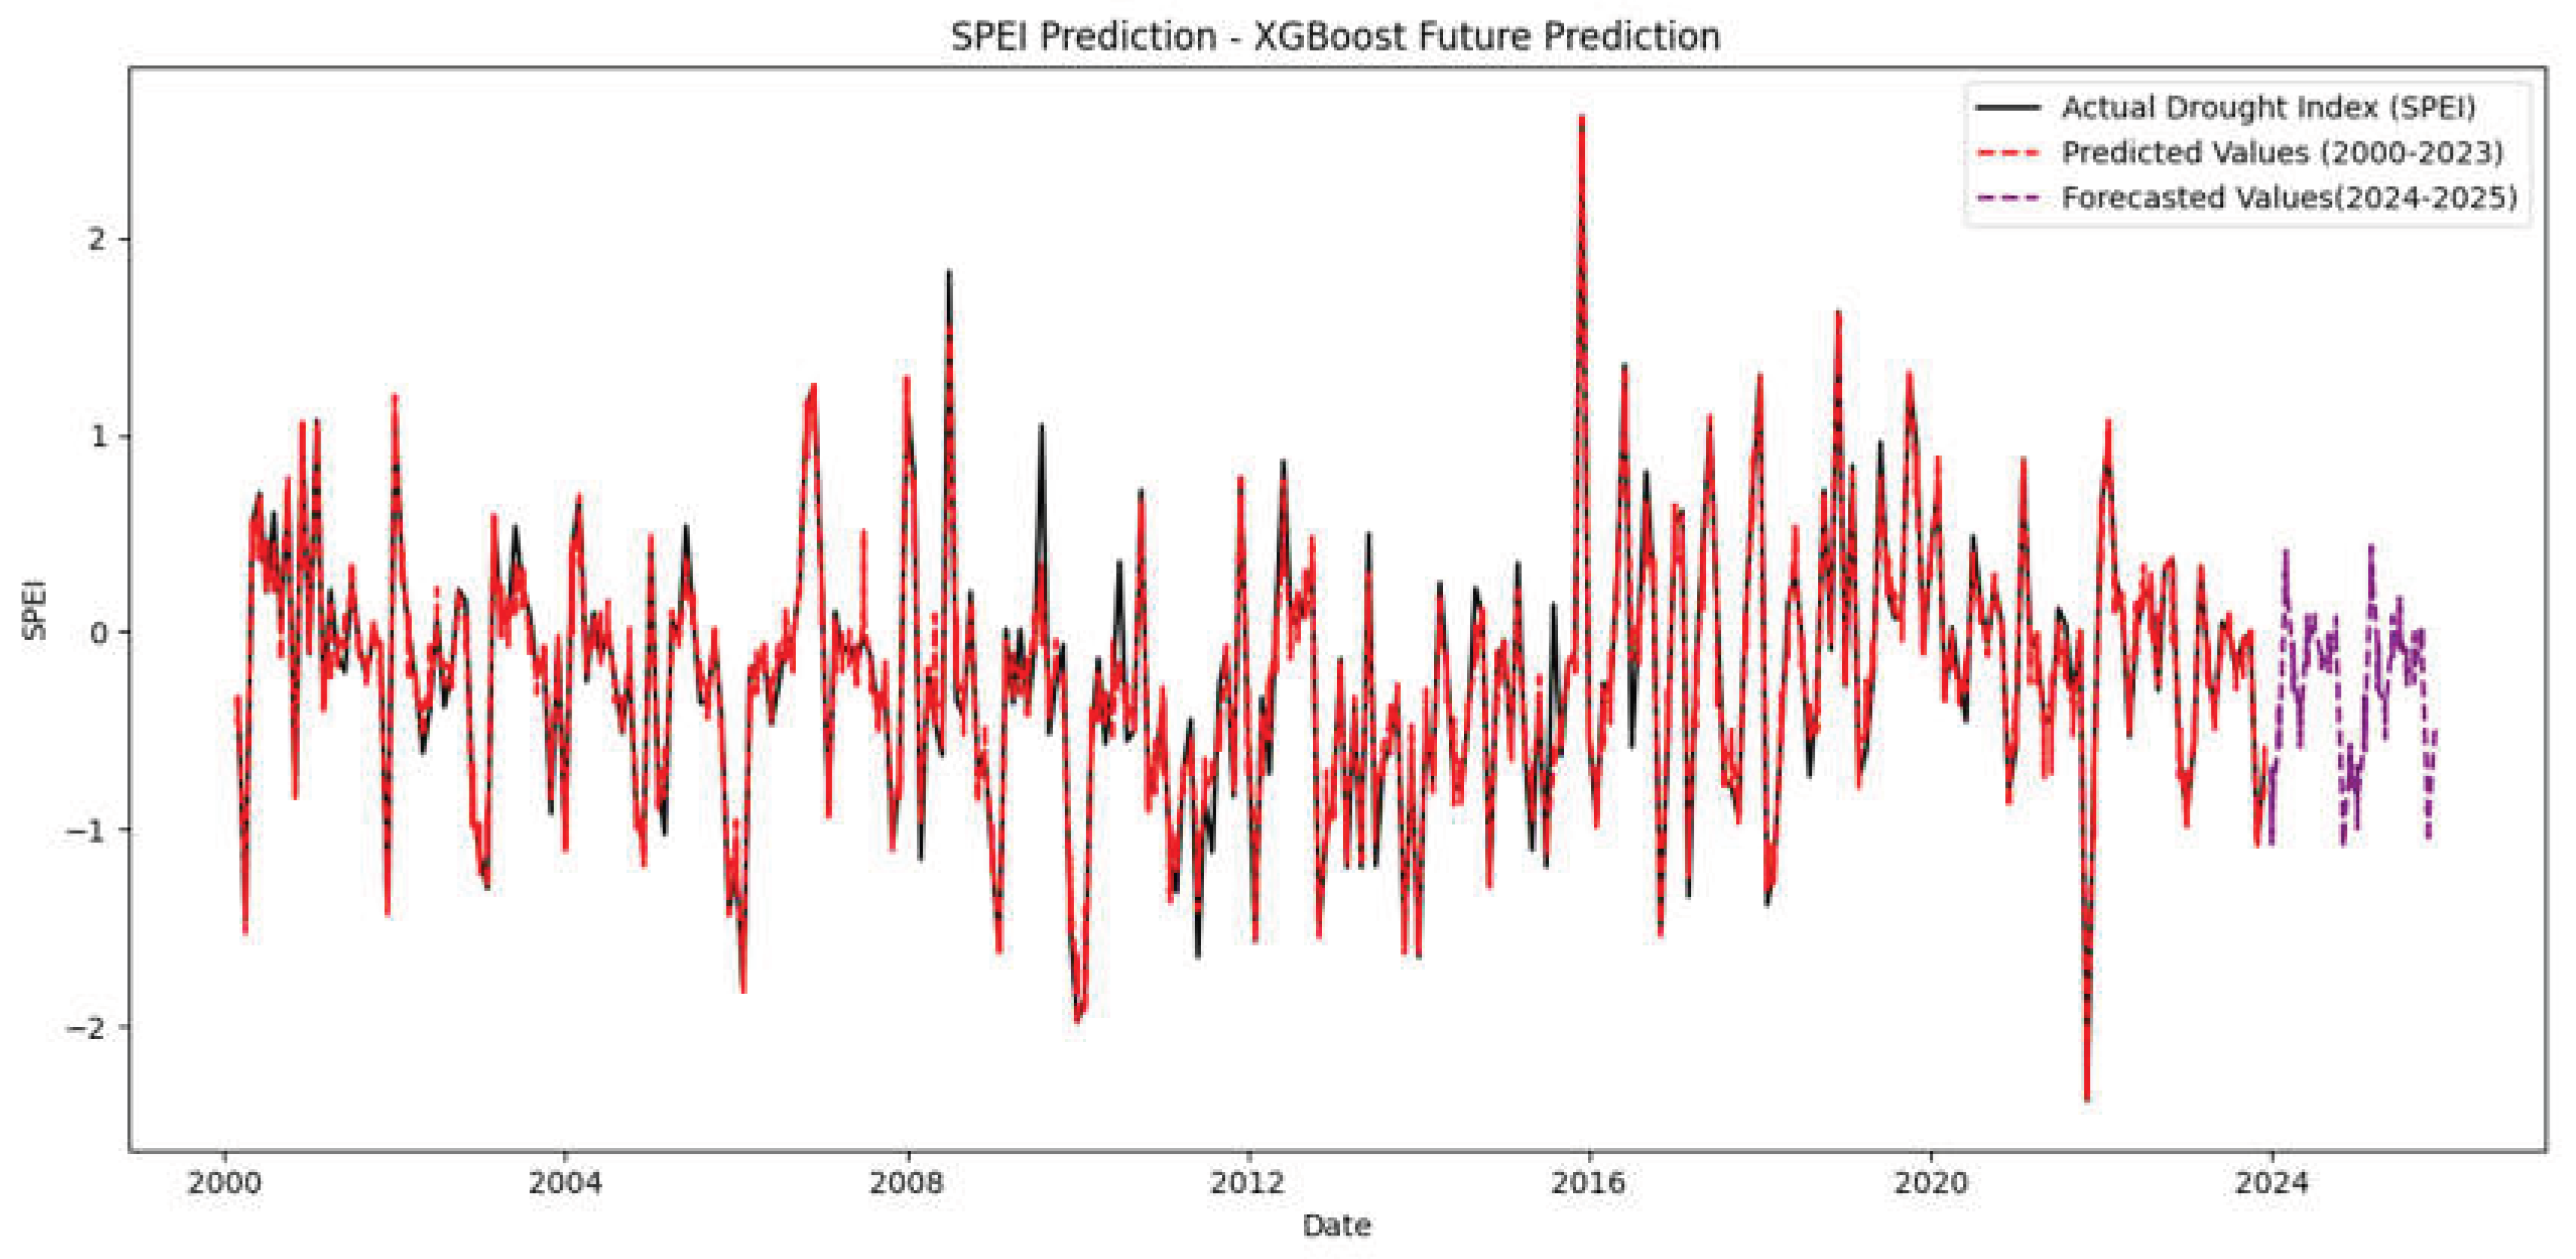

Table 1.
The spatial and temporal resolution of the remote sensing datasets and the indices used.
| Name of Products | Grid Spacing | Temporal Resolution | Index |
| MOD11A1 | 1000m | 8 days | TVDI and TCI |
| MOD13Q1 | 250m | 16 days | NDVI and VCI |
| SPEIbase | 0.5 ◦ | 1 to 48 months | SPEI (1, 3, 6, and 12) |
Note: Data obtained from NASA and SPEIbase using Google Earth Engine Platform.
Table 2.
Drought Classification in terms of Vegetation Condition Index values.
| VCI | Level |
|---|---|
| ≥70 | Normal |
| 50 ≤ VCI <70 | Mild Drought |
| 30 < VCI < 50 | Moderate Drought |
| ≤30 | Severe Drought |
Table 3.
TDVI Classification (source – Putri, 2019).
| Values | Classes |
| 0 – 0.2 | Wet |
| 0.2 – 0.4 | Rather Wet |
| 0.4 – 0.6 | Normal |
| 0.6 – 0.8 | Rather Dry |
| 0.8 – 1.0 | Dry |
Disclaimer/Publisher’s Note: The statements, opinions and data contained in all publications are solely those of the individual author(s) and contributor(s) and not of MDPI and/or the editor(s). MDPI and/or the editor(s) disclaim responsibility for any injury to people or property resulting from any ideas, methods, instructions or products referred to in the content. |
© 2026 by the authors. Licensee MDPI, Basel, Switzerland. This article is an open access article distributed under the terms and conditions of the Creative Commons Attribution (CC BY) license (http://creativecommons.org/licenses/by/4.0/).
Copyright: This open access article is published under a Creative Commons CC BY 4.0 license, which permit the free download, distribution, and reuse, provided that the author and preprint are cited in any reuse.