
Submitted:
26 February 2026
Posted:
27 February 2026
You are already at the latest version
Abstract
This study addresses modeling requirements in real business scenarios where data distributions are complex and continuously evolving. It investigates a unified modeling problem under the coexistence of class imbalance and distribution shift. To tackle practical challenges such as scarce high-risk event samples, majority class dominance in learning, and decision bias amplified by environmental change, a collaborative modeling framework is developed. The framework introduces class structure awareness and distribution stability constraints within a shared representation space. This design enables the model to preserve discriminative capability while reducing dependence on a single training distribution. Structural bias caused by imbalance is alleviated through explicit modeling of class proportion differences. Interference from environmental change is suppressed through distribution consistency constraints during representation learning. As a result, model stability and consistency across different data conditions are improved. To examine controllability and robustness, the study conducts a systematic analysis of key hyperparameters, data quality degradation, and environmental perturbations on risk ranking performance. Special attention is given to sensitivity patterns induced by feature noise injection and varying missing value ratios. The results indicate that when class imbalance and distribution shift interact, collaborative modeling effectively mitigates performance degradation. The model maintains a stable risk recognition capability in complex business data. This provides a practically adaptive modeling approach for data-driven decision-making in high-risk scenarios.
Keywords:
data imbalance
; distribution skew
; risk ranking
; robust modeling
I. Introduction
In real business environments, data-driven models have become a central technical foundation for risk identification, predictive analysis, and intelligent decision-making. This reality differs markedly from idealized research settings that assume stable data distributions and balanced classes. In practice, business data are often highly imbalanced and continuously evolving. On the one hand, critical risks, abnormal behaviors, or high-value events occur infrequently, leading to severe class imbalance. On the other hand, changes in business rules, user behavior, external conditions, and system strategies constantly reshape the data generation process. As a result, substantial distribution discrepancies emerge between historical data and future observations. These two challenges coexist over long periods and interact with each other. They directly undermine model generalization and decision reliability, and thus form a major barrier to real-world deployment of data-intelligent systems [1].
Class imbalance in practical applications exhibits strong structural and long-term characteristics. Low-frequency events usually carry higher business value or risk significance, such as violations, system failures, or abnormal transactions. Their scarcity causes learning algorithms to be dominated by majority classes during training, which leads to biased decision boundaries. In operational systems, such bias may result in missed detection of high-risk events, delayed warnings, and distorted resource allocation. Simple remedies such as resampling or cost-sensitive learning often only alleviate surface-level imbalance. They fail to address bigger differences across classes in semantic structure, behavioral patterns, and temporal dynamics. These limitations become more evident in complex business processes and multi-source data settings, where the effectiveness and stability of traditional solutions are substantially constrained [2].
Alongside class imbalance, data distribution shift is a pervasive and persistent phenomenon in real business systems. Such systems are inherently dynamic. User populations, operational strategies, regulatory requirements, and external shocks continuously drive distributional change over time. These changes are not limited to marginal distributions. They frequently involve shifts in conditional relationships, feature dependency structures, and even target semantics. Models that rely heavily on historical statistical regularities tend to suffer sharp performance degradation once distributions change. In extreme cases, systematic misjudgments may occur. More importantly, distribution shift often amplifies the adverse effects of class imbalance. Rare but critical samples become even harder to identify in new environments, which further weakens the credibility of deployed models [3].
In real-world scenarios, class imbalance and distribution shift do not act as isolated challenges. They jointly influence the learning process in a coupled manner. Distributional changes may cause global displacement of decision boundaries for minority classes, rendering existing balancing strategies ineffective. Conversely, extreme imbalance reduces a model’s sensitivity to environmental changes and delays the detection of emerging business patterns. As a consequence, solutions that address only a single issue in isolation are unlikely to sustain stable and consistent performance over long-term operation. Developing a unified modeling approach that captures both structural bias induced by imbalance and environmental uncertainty caused by distribution evolution has therefore become a critical requirement for practical intelligent systems.
Against this background, collaborative modeling of class imbalance and distribution shift in real business settings carries significant theoretical and practical importance. From a methodological perspective, systematically characterizing their intrinsic relationship helps break away from static assumptions and promotes models with adaptive capabilities. From an application perspective, building modeling mechanisms with long-term stability and controllable risk is essential for reliable system operation, effective risk warning, and robust decision support. Through unified modeling and coordinated constraints on imbalance structure and distribution evolution, intelligent systems can achieve greater robustness, interpretability, and sustainability. This foundation is crucial for supporting high-value decision-making in complex real-world business environments [4].
II. Related Work
Existing studies on class imbalance in real business settings have explored the problem from multiple perspectives, including the sample level, the algorithm level, and the decision level. Sample-level approaches mainly rely on resampling strategies to mitigate skewed class ratios [5]. These strategies include oversampling minority classes or undersampling majority classes to construct a more balanced training set. However, such methods often overlook the intrinsic dependency structure among samples in business data. They may introduce redundant information or distort the original distribution characteristics. Algorithm-level methods adjust the loss function or incorporate class-specific weights. This design increases the importance of minority classes during optimization and aims to reduce decision bias. Although these approaches can improve minority class recognition to some extent, their effectiveness is highly sensitive to weight configuration. Their adaptability across different business scenarios is limited. They also struggle with complex class semantics or dynamically evolving categories.
Research on data distribution shift has mainly focused on distributionally robust modeling, domain adaptation, and online updating strategies. The core objective of these methods is to reduce model dependence on the training distribution and maintain stable performance under environmental changes. Some studies explicitly constrain feature representations to remain consistent across different distributions, to learn representations that are insensitive to environmental variation [6]. Other approaches introduce dynamic updating or adaptive mechanisms, which allow model parameters to be gradually adjusted as new data arrive. In real business systems, however, distribution changes often exhibit both gradual and abrupt patterns. The dimensions of change are also complex and diverse. Relying solely on distribution alignment or parameter updating tends to create a trade-off between stability and responsiveness. This makes it difficult to achieve both long-term reliability and short-term sensitivity.
In recent years, several studies have begun to examine the interaction between class imbalance and distribution shift. Nonetheless, most existing solutions still adopt a separative treatment. A common practice is to first construct a relatively balanced training set using imbalance handling techniques, and then apply distributionally robust or adaptive strategies to cope with environmental change. This sequential framework is simple in design, but it implicitly assumes that the two problems can be addressed independently. It neglects the fact that imbalance structures themselves may evolve together with distributional changes. In practical business scenarios, class proportions, feature characteristics, and decision boundaries often change simultaneously. As a result, single-stage or static strategies are difficult to sustain over time. Moreover, such methods usually lack a holistic characterization of long-term operation. They provide limited insight into the structural causes of performance fluctuations [7].
Overall, existing research offers an important foundation for understanding class imbalance and distribution shift. Yet, clear limitations remain in real business contexts. On the one hand, most methods focus on modeling a single issue and lack systematic analysis of their joint effects. On the other hand, many studies rely on idealized assumptions and pay insufficient attention to non-stationarity, structural heterogeneity, and risk sensitivity in complex business environments. These limitations often lead to performance degradation or unstable decisions after deployment. It is therefore necessary to revisit the relationship between class imbalance and distribution shift from a more unified perspective. Exploring collaborative modeling strategies that capture both class structure and environmental change is essential for building robust and sustainable intelligent systems in real business scenarios.
III. Proposed Framework
A. Overall Framework
To address both data imbalance and distribution bias in real-world business scenarios, this paper constructs a unified collaborative modeling framework. The overall idea is to simultaneously characterize class structure bias and environmental distribution changes during the same learning process, enabling the model to maintain stable discriminative ability across different business stages. Let the original input samples be:
where represents the feature vector and represents the class label. The model first uses a shared representation mapping function:
The original input is mapped to a latent representation space to uniformly carry category and distribution information. Based on this, joint constraints for class imbalance and distribution shift are introduced, so that the representation learning process no longer relies solely on empirical distributions but explicitly considers the instability of the business environment, thus providing a more robust representation foundation for subsequent discrimination and decision-making. This article presents the overall model architecture diagram, as shown in Figure 1.
B. Imbalance-Aware Representation Modeling
To address the class imbalance problem, this paper introduces a class-aware weighting mechanism in the representation space to weaken the dominant role of the majority class in model learning. First, the empirical proportion of samples in class c is defined as:
where is the indicator function. Based on the class proportions, class weights are constructed as follows:
This is used to adjust the degree of influence of different categories in the optimization process. Then, the weighted classification loss is defined:
where is the discriminant function and is the basic loss function. This design allows the model to pay more attention to the structural features of minority class samples during the learning process, mitigating decision bias caused by class distribution imbalance.
C. Distribution-Shift-Aware Regularization
To address the issue of data distribution shifts caused by changes in the business environment, this paper introduces distribution stability constraints into the latent representation space. Specifically, the data is divided into several sub-distributions according to time or environment, and the mean of the representation under the k-th distribution is defined as:
By minimizing the deviation between the centers of different distributions, the constrained model learns a stable representation that is insensitive to environmental changes, which can be formalized as:
This regularization term encourages the model to maintain a consistent representation structure across different business stages, thereby reducing the impact of distribution drift on the discriminant function and providing stability assurance for long-term deployment.
D. Joint Optimization Objective
Within a unified framework, this paper integrates the imbalance-aware loss with the distribution offset constraint to form an overall optimization objective function:
Here, is a tradeoff coefficient used to balance the influence between class structure modeling and distribution stability constraints. Through this joint objective, the model can simultaneously consider two factors during training: class imbalance and changes in environmental distribution, enabling the latent representation to maintain discriminativeness while possessing stronger environmental robustness. This collaborative modeling mechanism provides a unified and scalable methodological foundation for continuous learning and robust decision-making in real-world business scenarios.
IV. Experimental Analysis
A. Dataset
This study adopts the open-source Credit Card Fraud Detection dataset based on European cardholders in 2013 as a unified benchmark. The dataset provides anonymized credit card transaction records collected over a continuous time window. It reflects real transaction behaviors and closely matches practical risk control scenarios characterized by a large volume of normal transactions and a very small number of high-risk events. Transactions are organized at the individual record level, and the task is formulated as a binary classification for fraud and non-fraud. The dataset is reproducible, widely used in the research community, and suitable for comparative evaluation. These properties make it appropriate for examining modeling challenges caused by class imbalance and distributional change under a unified setting.
From a structural perspective, the dataset contains 284,807 transaction records, including 492 fraudulent cases. The class distribution is extremely imbalanced, with fraud accounting for approximately 0.17 percent of all samples. Feature dimensions include anonymized variables V1 through V28, which are numerical features obtained via transformation, as well as two interpretable fields, namely Time as relative temporal offset and Amount as transaction value. The label field is denoted as Class. This feature design, which combines limited interpretability with strong anonymization, is consistent with real business data. It enables models to learn complex nonlinear risk patterns while avoiding reliance on rule-based attributes. As a result, the evaluation focuses more directly on robustness and generalization of the modeling approach.
To align with the theme of collaborative modeling of class imbalance and distribution shift, a deployment-oriented data splitting strategy is adopted. Transactions are partitioned in temporal order according to the Time attribute. Training is conducted on historical data, and testing is performed on future data to simulate distribution shift induced by evolving business environments. The original class proportions are preserved without artificial balancing, so that the extreme imbalance inherent in risk identification is maintained. Under this setting, models must address decision bias caused by minority class scarcity and cope with evolving feature distributions and conditional relationships over time. This design provides a realistic evaluation context for the proposed collaborative modeling approach in real business scenarios.
B. Experimental Results
This article first presents the results of the comparative experiments, as shown in Table 1.
A holistic comparison shows that all methods exhibit a broadly consistent upward trend in Acc, Precision, Recall, and AUC. This pattern indicates that performance improvement in real world risk control tasks requires joint consideration of overall classification accuracy and the recognition quality of minority risk events. Under extreme class imbalance, focusing solely on Acc can be misleading, as it is easily dominated by the majority class. Precision, Recall, and AUC, therefore, deserve closer attention. The gradual improvement of baseline methods from NNEnsLeG to FraudGNN RL suggests that ensemble strategies, structural modeling, and reinforcement-based optimization can partially alleviate imbalance-induced bias. However, their gains remain constrained by the assumption that training and testing distributions are consistent.
Ours achieves the best results across all four metrics. The advantage is not limited to Acc. It is more evident in the simultaneous increase of Precision and Recall, which better matches the core requirements of real business scenarios for high-risk sample identification. Compared with FraudGNN RL, Precision improves from 0.854 to 0.881, and Recall increases from 0.802 to 0.836. This indicates that the model does not trade recall for overly conservative predictions. It also does not inflate positive predictions to boost recall. Instead, it improves both false positives and false negatives under a more stable decision boundary. Such concurrent improvement usually implies richer minority class representations and reduced majority class bias. This leads to more controllable risk recognition under imbalanced data.
The improvement in AUC further supports the value of collaborative modeling under distribution shift. Ours reaches an AUC of 0.947, which exceeds the strongest baseline at 0.928. This result shows that the model maintains stronger ranking ability and discrimination across different threshold choices. This property is critical for dynamic threshold adjustment, cost-sensitive decisions, and layered risk control strategies in practice. In real scenarios, distributions may drift over time or change with policy adjustments. Models that rely heavily on local statistics from the training period often suffer unstable rankings and confidence collapse near decision thresholds. A higher AUC usually indicates more stable risk separation under distribution perturbations.
Overall, the results in Table 1 reflect both the collaborative challenges and the corresponding benefits emphasized in this study. Improving imbalance with a single strategy or relying on static decision optimization alone leaves limited room for progress under the joint constraints of distribution change and minority scarcity. Methods that jointly reduce class bias and enhance robustness to distribution evolution within a unified framework are more likely to achieve consistent gains across metrics. The simultaneous superiority of Ours in Acc, Precision, Recall, and AUC demonstrates closer alignment with real deployment requirements in terms of overall performance, minority event capture, and threshold usability. It provides a more robust modeling foundation for risk control, alert stratification, and continuous updating in dynamic business environments.
The impact of the learning rate on the experimental results is further presented, and the results are shown in Table 2.
An overall examination of the learning rate sensitivity results indicates a stable performance trend across different learning rates. As the learning rate decreases from 5e-4 to 1e-4, all evaluation metrics show consistent improvement. This observation suggests that in fraud detection, which is characterized by high noise and extreme sparsity, smaller optimization steps enable the model to capture complex transaction relationships and latent fraud patterns more effectively. Reduced step sizes also help prevent excessive gradient fluctuations during early training, leading to more discriminative structured representations.
The advantage of lower learning rates is more pronounced when comparing Precision and Recall. When the learning rate is reduced from 3e-4 to 1e-4, Precision increases from 0.871 to 0.881, while Recall improves from 0.821 to 0.836. This indicates that under more stable optimization conditions, the model can better distinguish genuine fraudulent behavior from normal transactions. As a result, both coverage and accuracy of anomaly detection are enhanced. In fraud detection tasks, recall is closely tied to risk coverage. The observed trend, therefore, carries clear practical significance.
Changes in AUC reflect improvements in overall ranking quality. As the learning rate is gradually reduced, AUC increases steadily from 0.915 to 0.947. This pattern shows that the model achieves stronger discrimination across different fraud patterns, relational structures, and temporal windows. Higher AUC implies not only improved pointwise prediction performance, but also more reliable ranking for practical applications such as risk stratification and audit resource allocation.
Taken together, the results indicate that smaller learning rates are more suitable for the proposed model architecture. The model jointly captures multidimensional financial signals, cross-entity relationships, and potential behavioral shifts. This setting imposes strict requirements on optimization stability. When the learning rate is too large, gradient updates tend to amplify noise or cause overfitting to local patterns, which degrades overall performance. As the learning rate decreases, the model converges more smoothly to a better solution. All metrics reach their optimal levels, which confirms the critical role of optimization configuration in fraud detection tasks.
Batch size is a key control variable in the training process, affecting the variance of gradient estimation, the smoothness of the optimization trajectory, and the effective step size for parameter updates. Since real-world business data often exhibits class imbalance and distribution skew, changes in batch size can further alter the exposure frequency of minority class samples in each iteration and the stability of representation learning. To characterize the impact of this hyperparameter on model behavior, we recorded the variation trends of the same algorithm across different evaluation metrics under various batch size settings. The experimental results are shown in Figure 2.
An inspection of the overall trends shows that model behavior under different batch size settings is not consistent across the four evaluation metrics. This observation indicates that batch size affects not only optimization stability, but also the statistical properties of gradient estimation. These changes influence representation learning from different perspectives under conditions of class imbalance and distribution shift. In real business data, minority class samples are scarce. Batch size directly determines the probability that minority samples are included in each update. This factor shapes how risk patterns are learned, and its impact varies across evaluation metrics.
In the Accuracy and Precision curves, the metrics remain relatively stable as the batch size increases from small values. A noticeable decline appears at the largest batch size. This pattern suggests that excessively large batches reduce gradient noise and improve update stability. At the same time, they weaken sensitivity to local structures and minority class details. Decision boundaries then become more dominated by the majority class statistics. This effect is particularly evident in highly imbalanced business scenarios. Models may retain high overall accuracy while gradually losing fine-grained discrimination of high-risk samples.
The Recall curve follows a different pattern. It reaches a higher level at moderate batch sizes and decreases under both very small and very large settings. This trend reflects a trade-off between minority sample exposure frequency and gradient stability. Very small batch sizes introduce strong stochastic fluctuations, which hinder the formation of stable risk discrimination structures. Very large batch sizes dilute the influence of minority samples during updates, which reduces coverage of high-risk events. This result aligns closely with the emphasis of this study on the amplified effect of an imbalanced structure on model behavior.
Changes in the AUC curve further illustrate the influence of batch size on ranking ability and overall robustness. AUC peaks at moderate batch sizes, indicating more stable risk separation across different threshold choices. Under extreme settings, the decline in AUC implies that the model is more prone to ranking instability when distributions are perturbed or thresholds are adjusted. Taken together, the experiment shows that batch size is not merely an optimization parameter. It is also a key factor that shapes risk perception under class imbalance and distribution shift. This finding highlights the necessity of systematic analysis of stable hyperparameter ranges for real-world deployment.
The intensity of the noise injection is used to simulate measurement errors, recording jitter, and alignment errors of heterogeneous systems in real-world business data acquisition and processing, thereby verifying the model's robustness to input perturbations. Under conditions of both data imbalance and distribution skew, noise further alters the separability of minority classes and the feature distribution, easily amplifying the model's dependence on the training distribution. To characterize the stability of the algorithm under different perturbation intensities, we set noise intensities at different levels and tracked the sensitivity trend of AUC to changes in perturbation. The experimental results are shown in Figure 3.
The overall trend shows that as the intensity of feature noise injection increases, AUC exhibits a continuous decline. This pattern indicates that input perturbations have a substantial impact on risk ranking capability. In business scenarios where class imbalance and distribution shift coexist, noise not only alters feature values at the individual sample level but also disturbs the relative structure between minority and majority classes in the representation space. This structural disruption weakens the model’s ability to distinguish critical risk samples. The observation demonstrates that even when training strategies remain unchanged, input level uncertainty alone can induce systematic changes in model behavior.
Within the low noise regime, the reduction in AUC is relatively limited. This suggests that the model can preserve a stable risk ranking structure under mild feature perturbations. Such behavior is consistent with the objective of stable representation constraints in the collaborative modeling framework. By reducing excessive reliance on local noise patterns, the model maintains overall discrimination when feature distributions fluctuate slightly. As noise intensity increases further, this stability is gradually undermined. The model becomes more biased toward dominant statistical patterns in the training distribution. Sensitivity to fine-grained risk differences is therefore reduced.
In the medium to high noise regime, the decline in AUC becomes more pronounced. This trend reflects a cumulative effect between feature noise and class imbalance. Minority class samples are limited in number, and their discriminative signals are more easily obscured after noise injection. As a result, the model struggles to preserve the original risk stratification during ranking. This finding highlights that in real business environments, decision rules learned from static training data can rapidly degrade when input quality deteriorates or data collection becomes unstable. Such degradation directly affects overall risk control performance.
Taken together, the experiment validates the joint constraints imposed by imbalance structure and distributional uncertainty on model robustness from the perspective of environmental perturbation. Increasing feature noise intensity introduces additional randomness and amplifies the limitations caused by reliance on the training distribution. Risk ranking capability, therefore, degrades as the environment worsens. This sensitivity analysis further indicates that in real-world deployment, building representation learning mechanisms that can buffer input perturbations is critical for maintaining long-term model stability in complex environments.
The missing value ratio is used to simulate the unavoidable information gaps in real business data during collection, transmission, field alignment, and cleaning, thereby testing the robustness of the model under incomplete information conditions. When class imbalance and distribution shift coexist, the missing value mechanism is often non-random, further altering the distribution of effective features and weakening the separability of minority class risk signals. To characterize the sensitivity of our algorithm to data quality degradation, we set different missing value ratios and tracked the trend of AUC with the degree of missing values. The experimental results are shown in Figure 4.
As the proportion of missing values increases, AUC follows a monotonic downward trajectory. This trend indicates that data completeness continuously affects risk ranking capability. The introduction of missing values alters the structure of the effective feature space. Some samples lose critical information at the representation level. This loss weakens the model’s ability to capture fine-grained differences. Under severe class imbalance, such information degradation is more likely to amplify its impact on minority class risk signals. These signals become further diluted within the overall distribution. At the same time, within the low missing rate range, the decline in AUC is relatively moderate. This suggests that the model can maintain a comparatively stable ranking structure under mild information loss. This behavior aligns with the stable representation objective emphasized by the collaborative modeling framework. Shared representations and constraint mechanisms help suppress sharp performance fluctuations when input quality varies slightly. However, the continuous decrease in AUC also indicates that the effect of missing information is cumulative rather than negligible random noise.
As the missing rate continues to increase, the decline in AUC becomes more pronounced. This pattern reflects the limited capacity of the model to adapt to high levels of information loss. At this stage, feature missingness not only affects individual sample discrimination but also alters overall feature distributions and conditional dependencies. During ranking, the model relies more heavily on remaining common patterns. In imbalanced data settings, this reliance tends to converge toward majority class structures. As a result, discrimination of high-risk samples is reduced, and risk coverage is weakened. Overall, the experiment reveals the cumulative constraints imposed by imbalance structure and distributional uncertainty on model stability from the perspective of data quality degradation. Increasing missingness reduces usable information density and amplifies dependence on training distribution statistics. Risk ranking capability, therefore, degrades as data completeness declines. These findings further highlight the importance of sensitivity analysis on missing mechanisms and data quality variation for long-term reliable deployment in real business systems.
V. Conclusion
This study addresses the pervasive challenges of class imbalance and distribution shift in real business settings and presents a systematic collaborative modeling perspective. The approach emphasizes joint characterization of class structural bias and environmental uncertainty within a unified framework. By integrating imbalance-aware mechanisms with distribution stability constraints into a single representation learning process, the model moves beyond reliance on static empirical distributions. It maintains a relatively stable risk ranking and discrimination across varying data conditions. The analysis indicates that this collaborative perspective mitigates the masking of minority class signals and reduces the amplification of decision bias under environmental change. It offers a more adaptive technical pathway for intelligent modeling in complex business environments.
From an application perspective, the findings are directly relevant to high-risk decision scenarios such as financial risk control, audit monitoring, anomaly detection, and compliance management. In these settings, critical risk events are typically rare, while data distributions evolve continuously with business strategies, user behavior, and external conditions. Models built on static assumptions struggle to remain stable over long-term operation. By explicitly modeling the interaction between imbalance structure and distributional change, the proposed collaborative framework preserves robust risk awareness under data quality fluctuations, environmental perturbations, and policy adjustments. It provides a more reliable foundation for decision support, helps reduce missed detections, and improves overall system robustness.
Looking ahead, the collaborative modeling paradigm offers substantial room for extension. One direction is to integrate online learning and continual updating mechanisms, enabling dynamic adaptation to distribution evolution and business change during long-term deployment. Another direction is to incorporate more refined environmental characterization and uncertainty modeling to improve responsiveness to abrupt changes and extreme scenarios. Extending the framework to more complex tasks such as multi-source heterogeneous data integration, cross-system collaborative analysis, and causal decision support may further broaden its practical impact. These efforts can help establish a methodological foundation for building trustworthy, robust, and sustainable data-intelligent systems.
References
- Gu X, Guo Y, Li Z, et al. Tackling long-tailed category distribution under domain shifts[C]//European Conference on Computer Vision. Cham: Springer Nature Switzerland, 2022: 727-743. [CrossRef]
- Wei J, Narasimhan H, Amid E, et al. Distributionally robust post-hoc classifiers under prior shifts[J]. arXiv preprint arXiv:2309.08825, 2023. [CrossRef]
- Imani E, Zhang G, Li R, et al. Label alignment regularization for distribution shift[J]. Journal of Machine Learning Research, 2024, 25(247): 1-32.
- Ye C, Tsuchida R, Petersson L, et al. Label shift estimation for class-imbalance problem: A bayesian approach[C]//Proceedings of the IEEE/CVF winter conference on applications of computer vision. 2024: 1073-1082.
- Su H, Luo W, Liu D, et al. Sharpness-aware model-agnostic long-tailed domain generalization[C]//Proceedings of the AAAI Conference on Artificial Intelligence. 2024, 38(13): 15091-15099. [CrossRef]
- Chen W, Yang K, Yu Z, et al. A survey on imbalanced learning: latest research, applications and future directions[J]. Artificial Intelligence Review, 2024, 57(6): 137. [CrossRef]
- Sutter T, Krause A, Kuhn D. Robust generalization despite distribution shift via minimum discriminating information[J]. Advances in Neural Information Processing Systems, 2021, 34: 29754-29767.
- Z. Xu, K. Cao, Y. Zheng, M. Chang, X. Liang and J. Xia, "Generative Distribution Modeling for Credit Card Risk Identification under Noisy and Imbalanced Transactions," 2025. [CrossRef]
- Duan M, Zheng T, Gao Y, et al. Dga-gnn: Dynamic grouping aggregation gnn for fraud detection[C]//Proceedings of the AAAI conference on artificial intelligence. 2024, 38(10): 11820-11828. [CrossRef]
- J. Li, Q. Gan, R. Wu, C. Chen, R. Fang and J. Lai, "Causal Representation Learning for Robust and Interpretable Audit Risk Identification in Financial Systems," 2025. [CrossRef]
- J. Lai, C. Chen, J. Li and Q. Gan, "Explainable Intelligent Audit Risk Assessment with Causal Graph Modeling and Causally Constrained Representation Learning," 2025. [CrossRef]
- Mosa D T, Sorour S E, Abohany A A, et al. CCFD: Efficient credit card fraud detection using meta-heuristic techniques and machine learning algorithms[J]. Mathematics, 2024, 12(14): 2250. [CrossRef]
- Cui Y, Han X, Chen J, et al. FraudGNN-RL: a graph neural network with reinforcement learning for adaptive financial fraud detection[J]. IEEE Open Journal of the Computer Society, 2025. [CrossRef]
Figure 1.
Overall model architecture diagram.
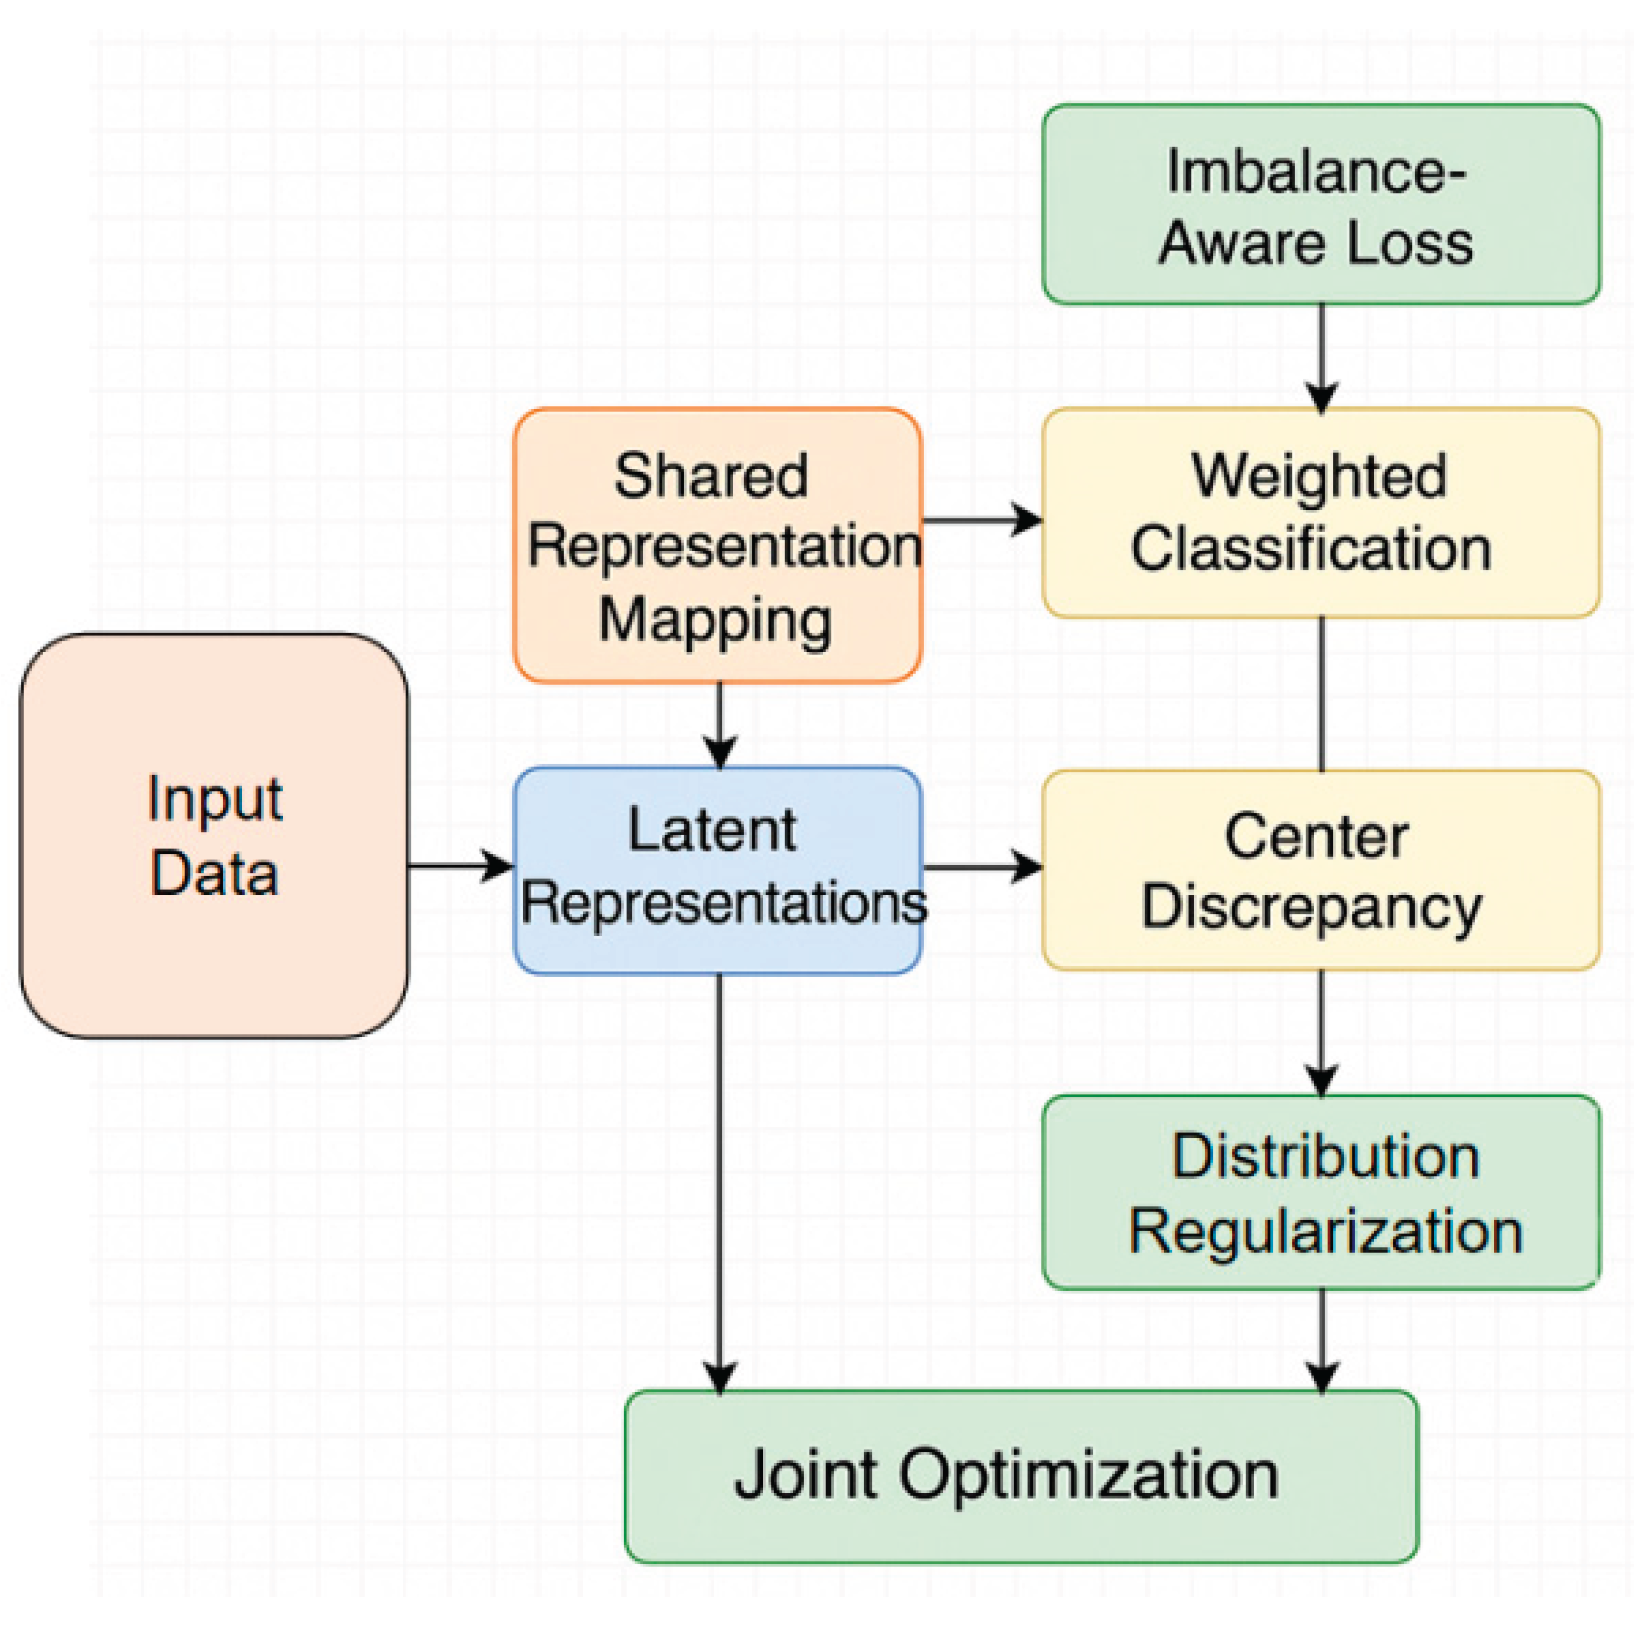
Figure 2.
The impact of batch size on experimental results.
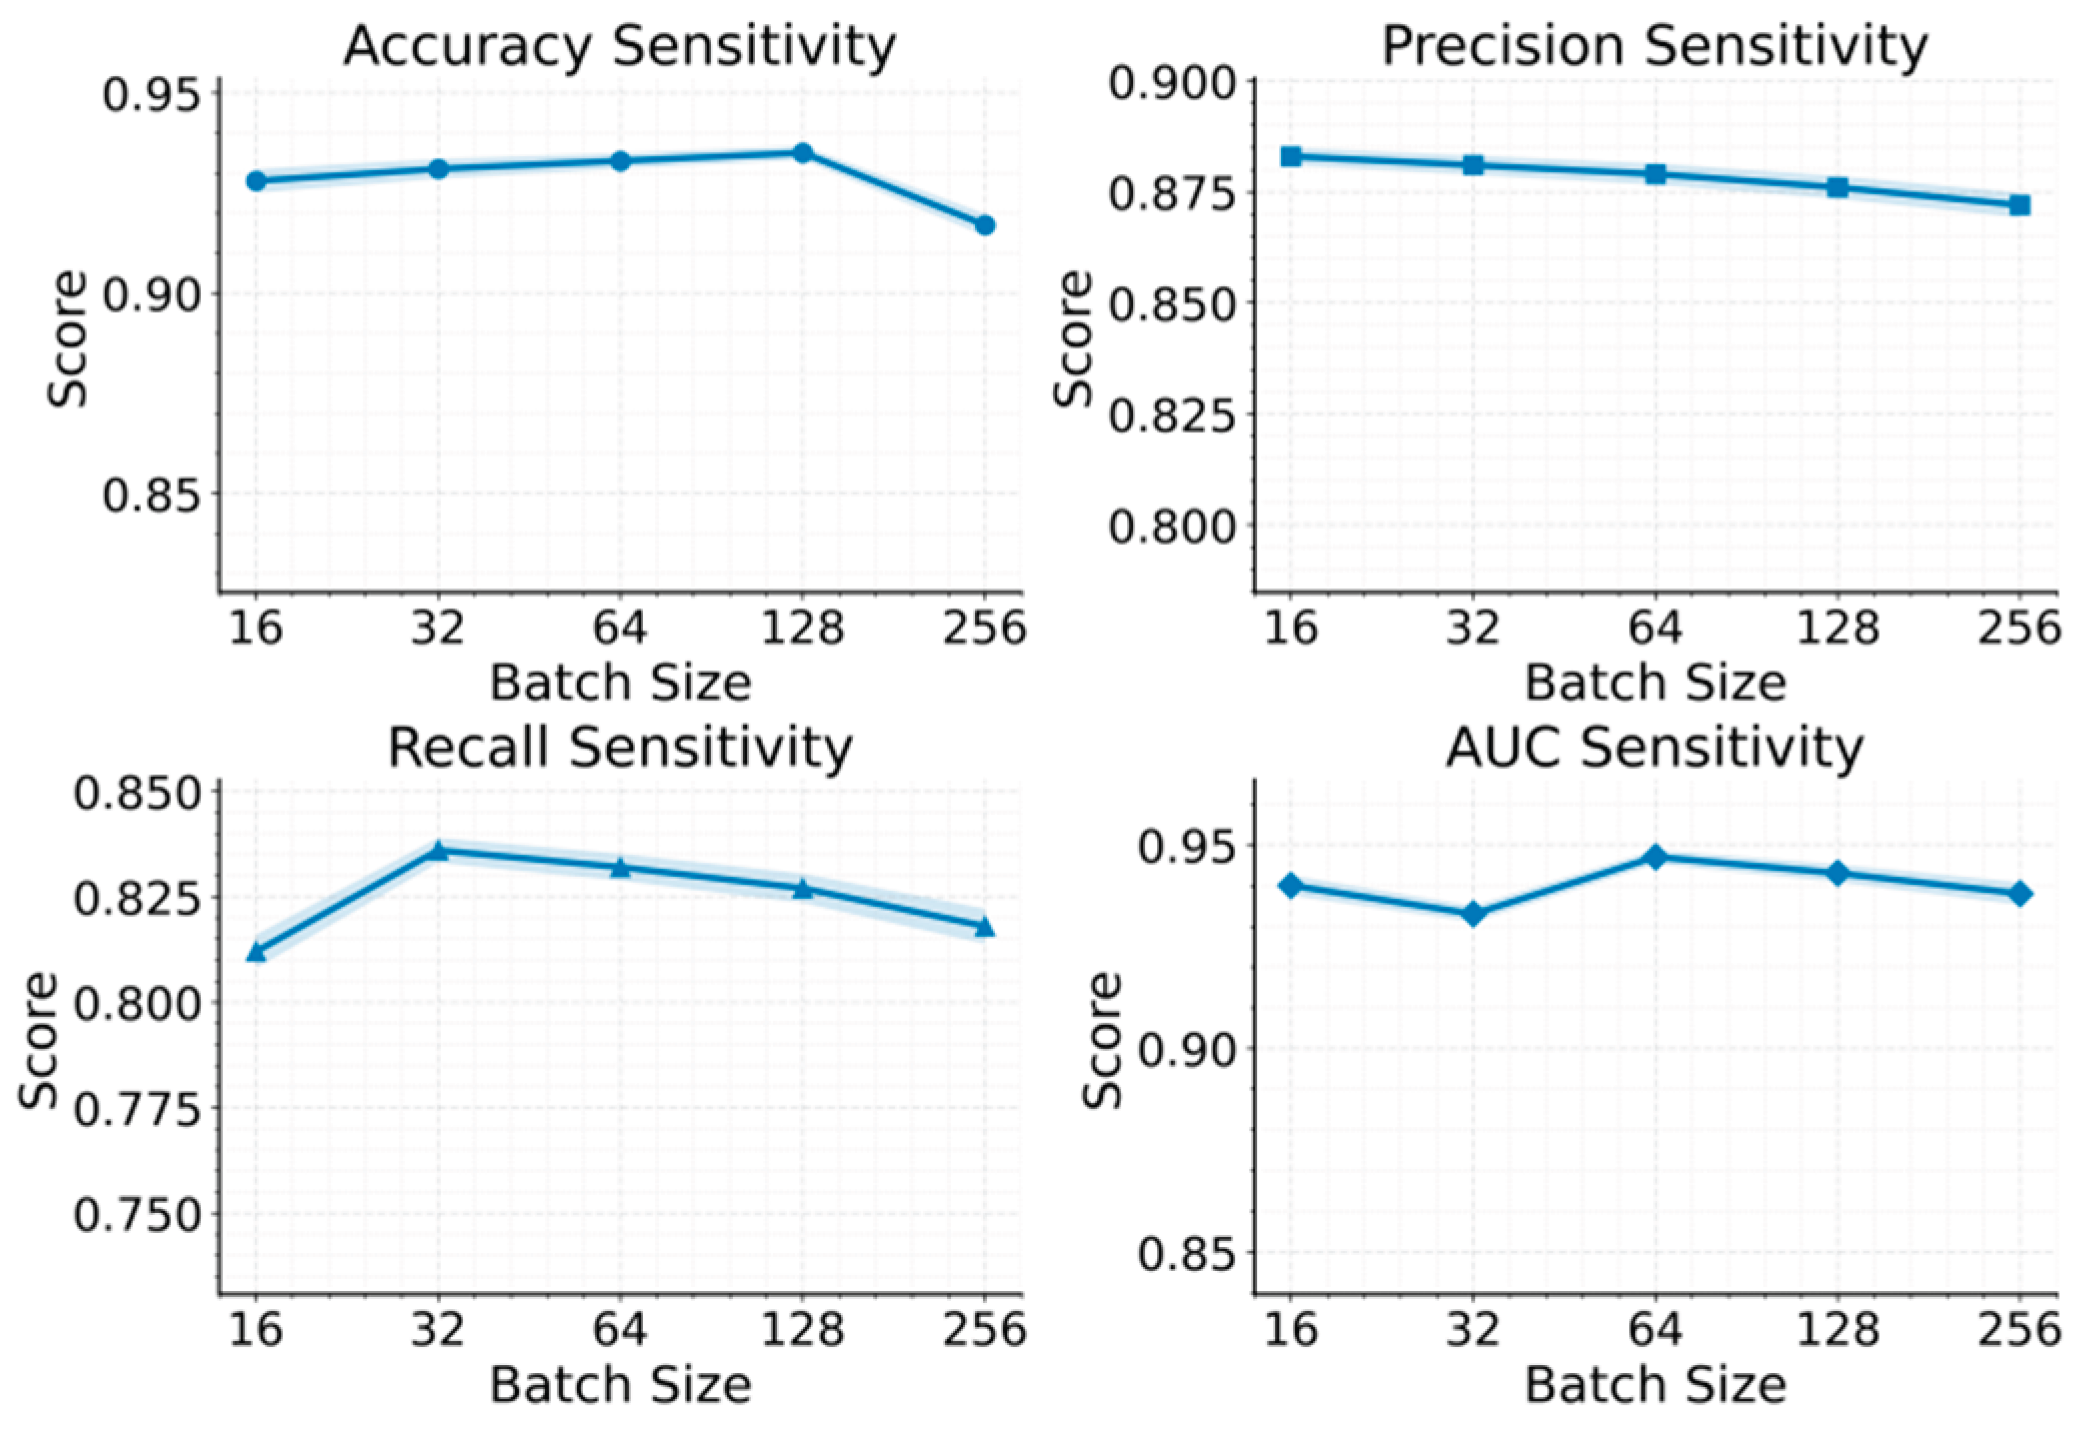
Figure 3.
Experiment on the sensitivity of characteristic noise injection intensity to AUC.
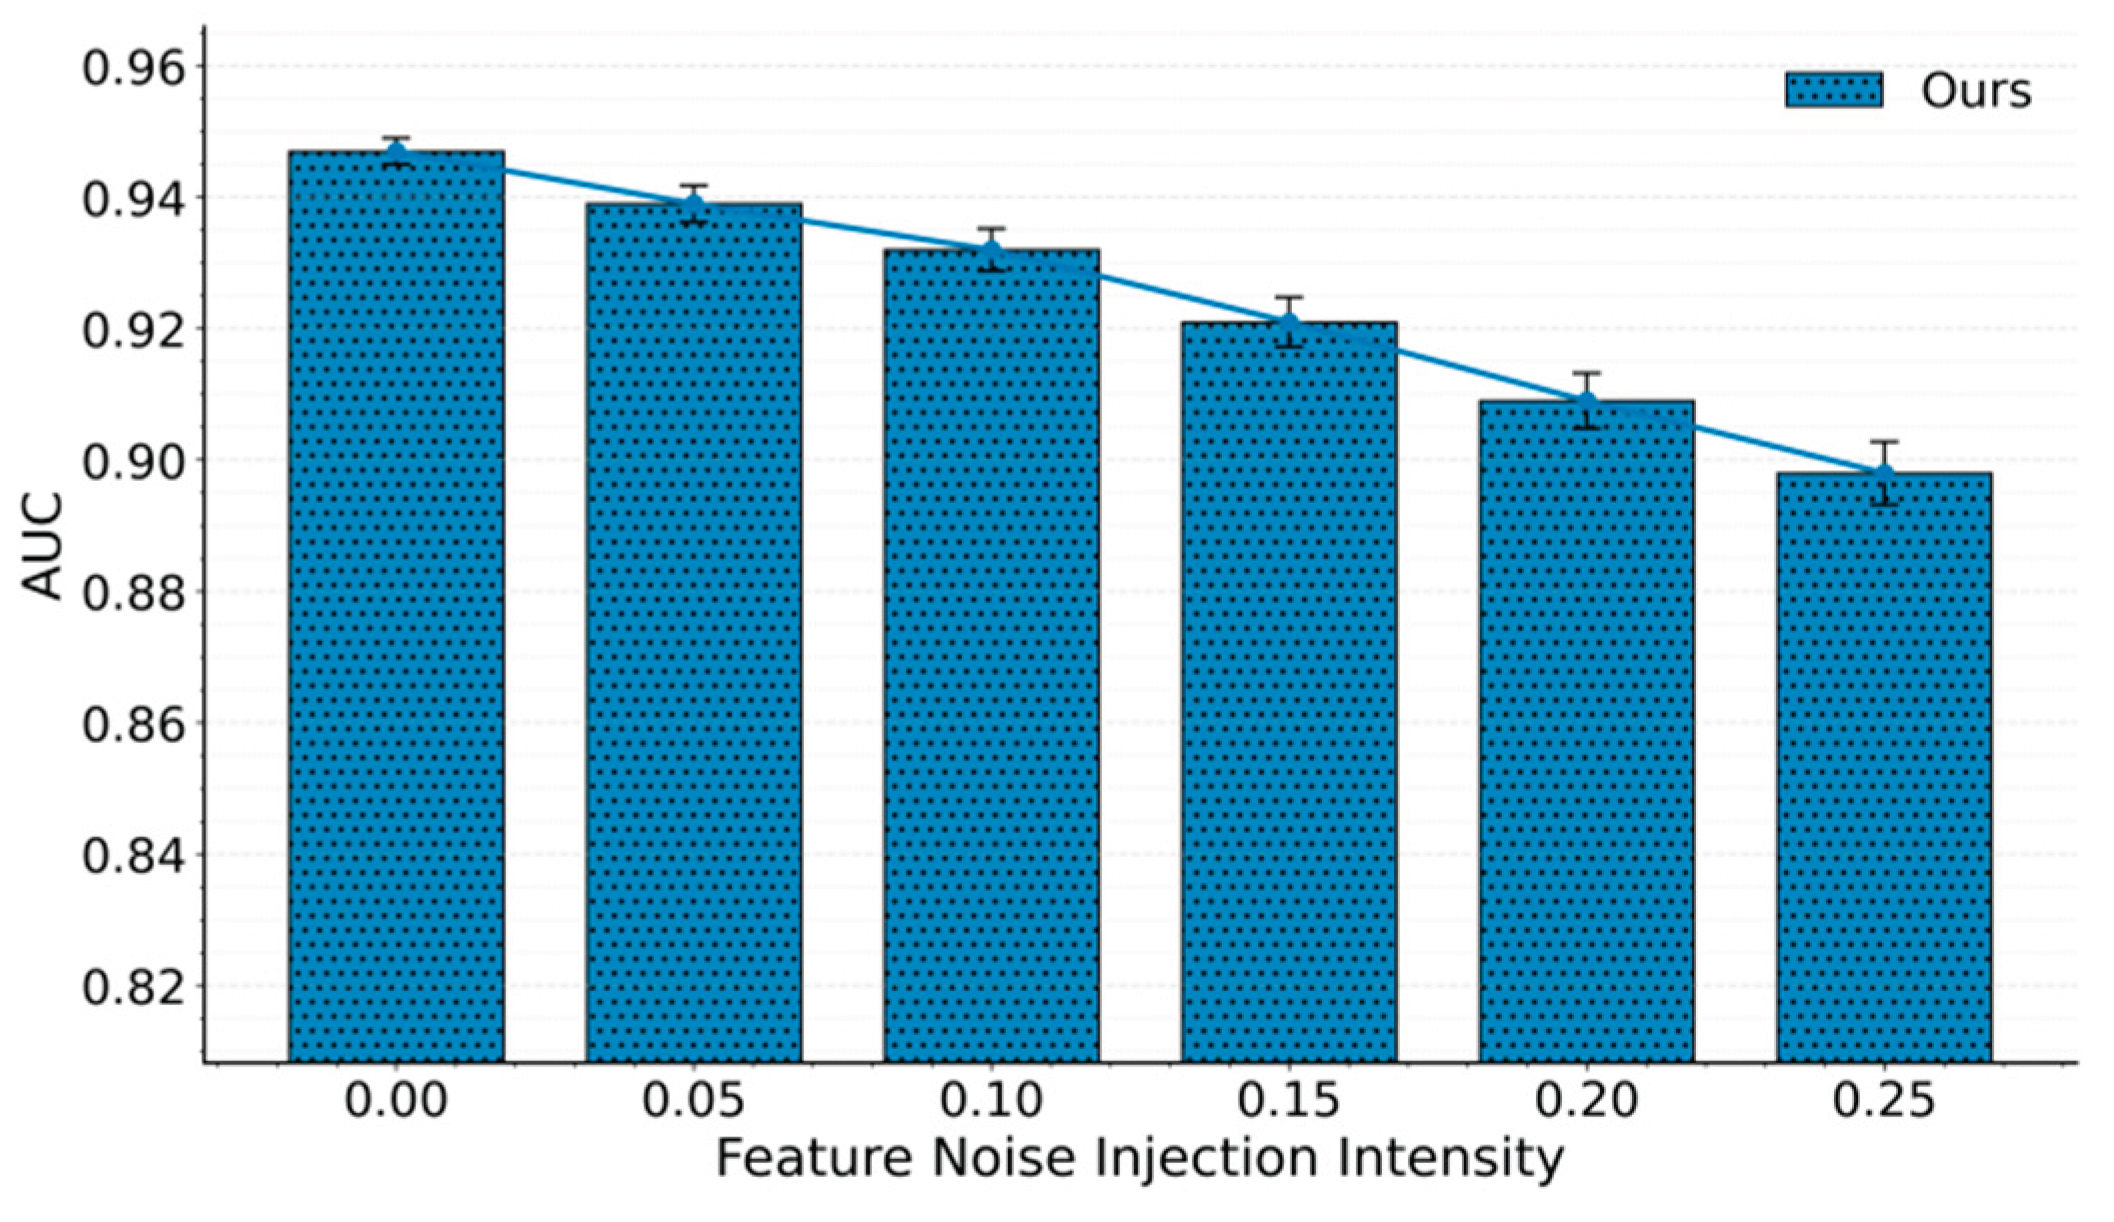
Figure 4.
Sensitivity experiment of the missing value ratio to AUC.
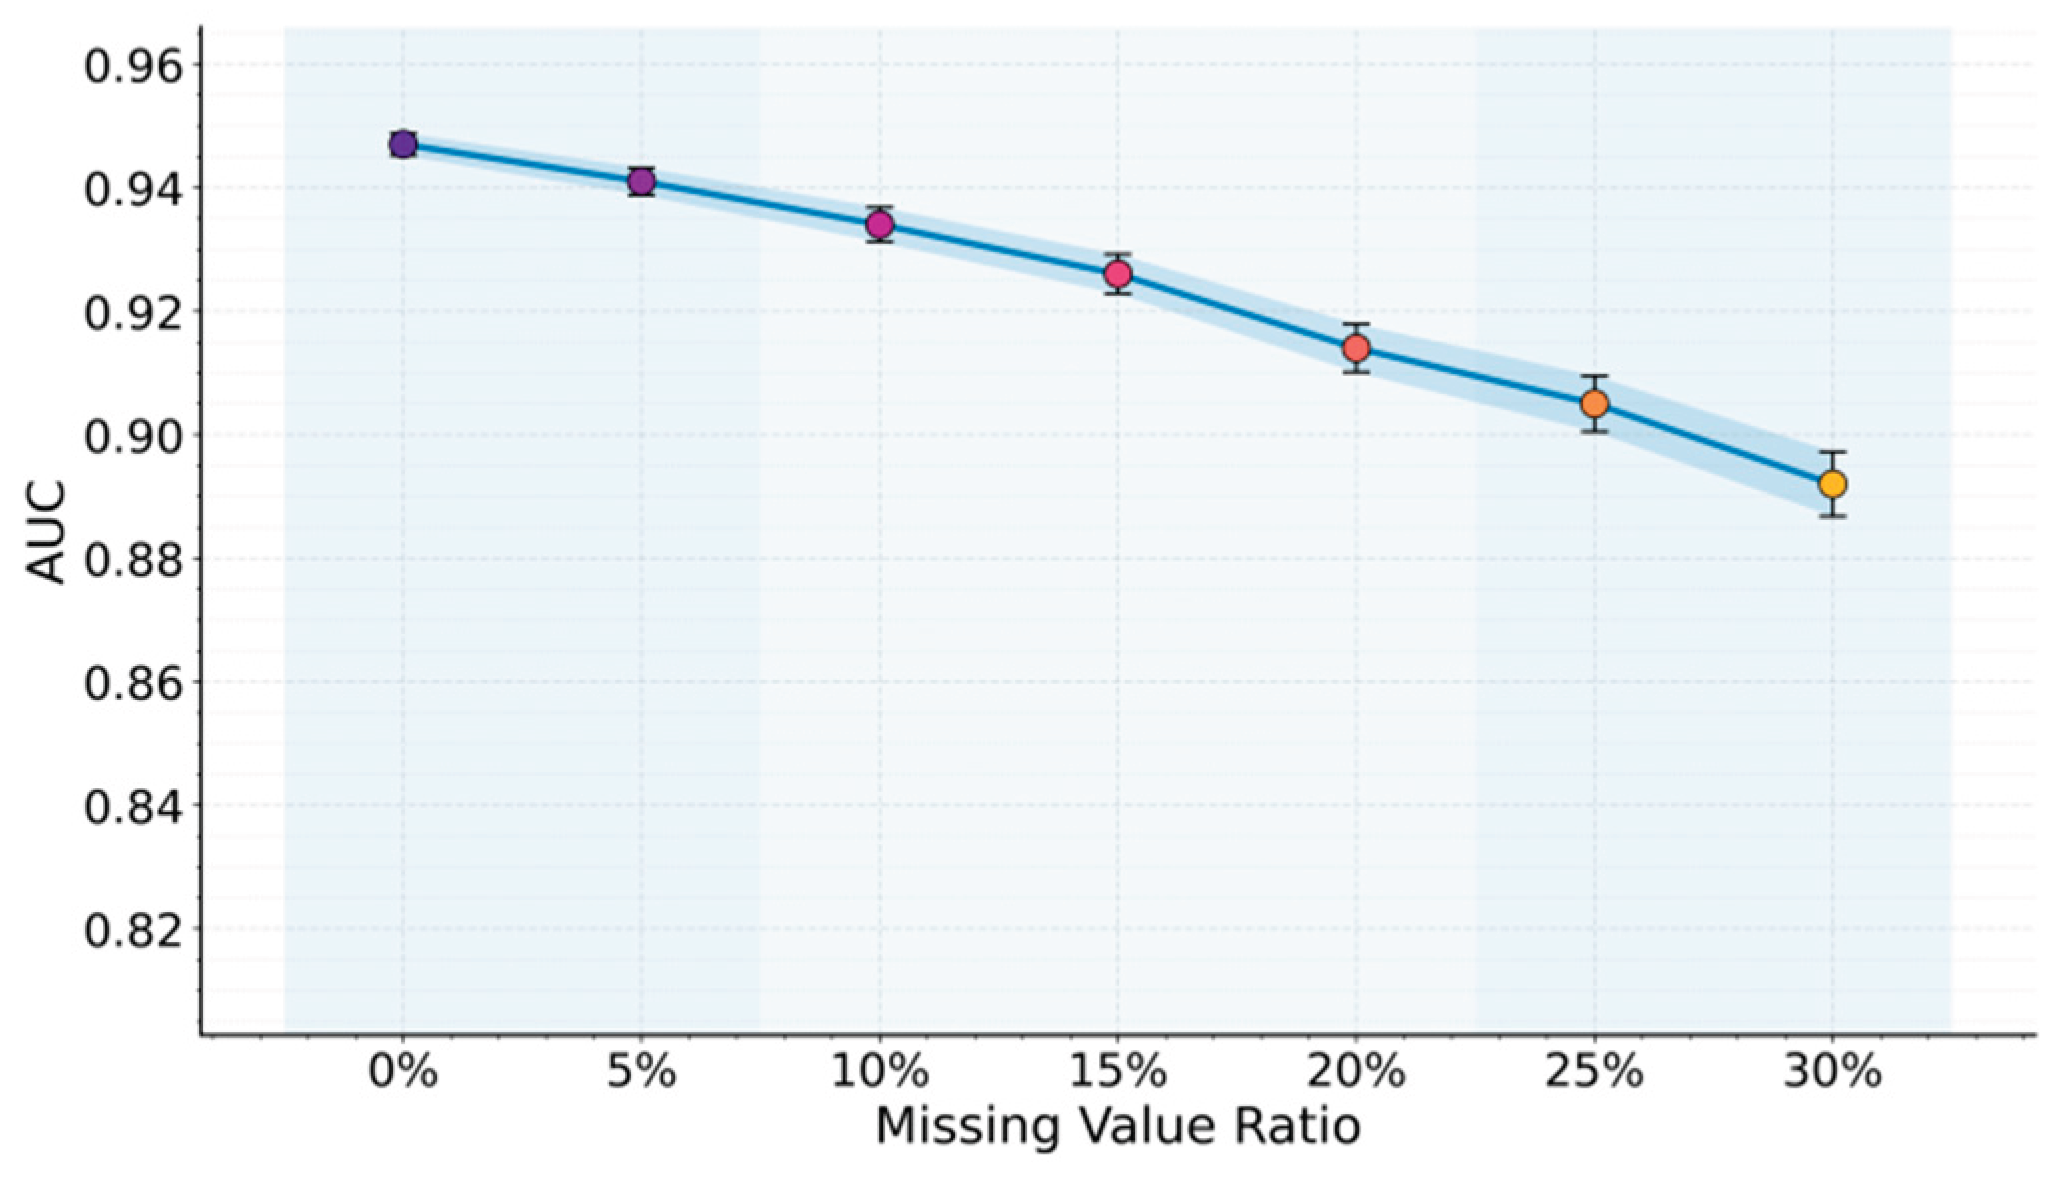

Table 1.
Comparative experimental results.
| Method | Acc | Precision | Recall | AUC |
|---|---|---|---|---|
| NNEnsLeG [8] | 0.842 | 0.783 | 0.716 | 0.865 |
| Dga-gnn [9] | 0.857 | 0.795 | 0.734 | 0.879 |
| AI Advances [10] | 0.868 | 0.804 | 0.748 | 0.887 |
| PSO-XGBoost [11] | 0.884 | 0.821 | 0.765 | 0.902 |
| CCFD [12] | 0.897 | 0.836 | 0.781 | 0.914 |
| FraudGNN-RL [13] | 0.912 | 0.854 | 0.802 | 0.928 |
| Ours | 0.935 | 0.881 | 0.836 | 0.947 |
Table 2.
Learning rate on experimental results.
| Learning Rate | Acc | Precision | Recall | AUC |
|---|---|---|---|---|
| 0.0005 | 0.904 | 0.842 | 0.781 | 0.915 |
| 0.0004 | 0.917 | 0.856 | 0.798 | 0.927 |
| 0.0003 | 0.926 | 0.871 | 0.821 | 0.939 |
| 0.0002 | 0.932 | 0.877 | 0.828 | 0.944 |
| 0.0001 | 0.935 | 0.881 | 0.836 | 0.947 |
Disclaimer/Publisher’s Note: The statements, opinions and data contained in all publications are solely those of the individual author(s) and contributor(s) and not of MDPI and/or the editor(s). MDPI and/or the editor(s) disclaim responsibility for any injury to people or property resulting from any ideas, methods, instructions or products referred to in the content. |
© 2026 by the authors. Licensee MDPI, Basel, Switzerland. This article is an open access article distributed under the terms and conditions of the Creative Commons Attribution (CC BY) license (http://creativecommons.org/licenses/by/4.0/).
Copyright: This open access article is published under a Creative Commons CC BY 4.0 license, which permit the free download, distribution, and reuse, provided that the author and preprint are cited in any reuse.