

Submitted:
10 November 2025
Posted:
11 November 2025
You are already at the latest version
Abstract
Food insecurity occurs due to the impact of climate change and intense global conditions. Thus, understanding the crop farming plans and monitoring crop yields have become major tasks for decision makers. Previous work has applied remote sensing techniques and empirical methods to predict the yields and analyse the relationships between spectral indices and historical crop yield data. However, a limitation of these studies is that they do not extract the values of spectral indices by crop types, which can cause inaccurate results when investigating the correlations between the yield and the spectral indices.
This research develops a yield prediction framework with historical crop maps by unsupervised classification with zero ground truth using Sentinel-2 imagery to retrieve the values of spectral indices of winter barley. The extracted spectral indices, the meteorological and historical yield data in North Norfolk, UK are implemented in 1D Convolutional Neural Network (CNN), Long Short-Term Memory (LSTM) and CNN-LSTM for winter barley yield predictions. LSTM with Soil-Adjusted Vegetation Index (SAVI) has outstanding performance overall and the best result approaches a Mean Square Error (MSE) of 0.21 kg/hectare and a Mean Absolute Error (MAE) of 13.63 kg/hectare. SAVI is the best predictor due to the strong positive correlation with the yield of winter barley. The developed framework with unsupervised crop classification and LSTM-SAVI can be applied on multiple crop types and in different regions using opensource datasets, the historical yields, the spectral indices and the meteorological data. Correlations between these datasets indicate that higher maximum and minimum SAVI and temperature and sun hours at the germination and seedling growth stages increase the yields of winter barley but excess rainfall with higher NDMI at the tillering stage and sun hours at the stem elongation, flowering and grain filling stages lead to a decline in the yields of winter barley.
Keywords:
crop yield
; agriculture
; barley
; remote sensing
; meteorology
; deep learning
1. Introduction
Climate change and intense geopolitical conditions have made ensuring the food security more challenging. Food crop production and distribution are important to maintain food security and sustainability. Consistent annual yields of food crops are essential for stable production and distribution. Historical yield data since the green revolution (1966 to 2010) show that yields have flattened since the 1990s. This is particularly true in the high-yield farming systems for rice in East Asia (China, Republic of Korea and Japan), wheat in Northwest Europe (United Kingdom, France, Germany, The Netherlands, Denmark) and India, and maize in South Europe (Italy and France) [1]. The yield stagnation has been caused by specific policies and management systems such as the reduction of fertilizer in western Europe [2]and water scarcity for irrigation and soil-quality depletion in South Asia [3], and the critical weather conditions such as the heat stress on cereal crops in France [4]. The increased temperature has reduced the crop duration and decreased the length of the grain-filling phase causing the yield decline in Denmark [5,6]. Alston et al., (2009) [7] suggest more cost-effective investments and agriculture studies to support a return to higher yields, especially in the developing countries. To maintain long-term food security and prevent the drops in crop yields, comprehensive crop land management is necessary. Accurate crop maps and crop yield forecasts are important tools for decision makers to project present and future crop land management and crop requirements. This research therefore proposes a framework of accurate crop classification and yield predictions using open-source data without the need for ground truth, which can be more widely used in multiple scenarios. The historical yields of crops can be analysed with the values of spectral indices extracted from the specific crop types on the accurate crop maps generated from this framework.
Crop yield monitoring and forecasting rely on meteorological data and crop production statistics with integrated mathematical analysis [8]. Yield forecasting models such as Geospatial and Remote-sensing-based Agro-Meteorological (GRAMI) [9,10] and Simple Algorithm For Yield estimates (SAFY) [11] have been developed with meteorological data, measured crop parameters from fields and remote sensing images, they have been applied to multiple crop types in several research studies [12,13,14,15]. These two models are applied with fixed input parameters for crop growth and yield estimation and are strongly dependent on remote sensing data. Thus, the inaccuracy of Lear Area Index (LAI) estimation from Vegetation Indexes (VIs) with remote sensing images by empirical modelling approach has led to the imprecise crop yield predictions [16,17]. To overcome the limitations of the input parameters using empirical modelling approach and LAI values, crop yield forecasting models were constructed with Machine Learning (ML) and Deep Learning (DL) methods.
ML methods such as Random Forest (RF) [18,19], XGBoost [20] and SVM (Support Vector Machine) [21] and DL methods such as ANN (Artificial Neural Network) [22], CNN (Convolution Neural Network) [20,23], Recurrent Neural Network (RNN) [24] and LSTM [25,26,27] are widely used in crop yield forecasting. Comparing the results of crop yield predictions from ML and DL in previous research studies, DL methods were believed to be more promising due to the automatic feature extraction and superior performance and suggested for the future research in crop yield prediction [28]. ANN (a feed forward network) was applied with yield data, average elevation of the region and evapotranspiration indicators calculated with the spectral bands of remote sensing images to predict the yield of spring barley and winter wheat in Czech Republic [22]. The predicted yields in this research study were typically 0.5–1.0 t/ha higher than observed yields, demonstrating that the accuracy of yield predictions can be improved. Yield predictions with CNN, RNN and LSTM were more accurate in other research studies. The review of crop yield prediction with DL methods indicated that CNN outperformed ANN. RNN based LSTM has been considered the most capable DL model with best accuracy due to the advantage of feedback loops in processing [29]. A CNN-RNN yield prediction framework was proposed with the soil properties, weather conditions and management practices, which achieved a Root Mean Square Error (RMSE) 9% and 8% on the corn and soybean yield prediction. It demonstrated that weather conditions were the most important factor in this model [30]. A phenology-based LSTM model was developed with the meteorological indices, daily growing degree days (GDD), killing degree days (KDD), and precipitation and wide dynamic range vegetation index (WDRVI). This LSTM model achieved highly accurate performance with a RMSE of 1.47 Mg/ha [31]. The yield of soybeans in Brazil was predicted using LSTM with meteorological data and satellite images, including land surface temperature, precipitation, NDVI and EVI. The LSTM model was tested against multiple sets of data with different Day of the Year (DOY) (counting from the beginning of the year) and it showed the lowest MAE at 0.24 Mg/ha with the data until DOY64 [32]. CNN, LSTM, and CNN-LSTM were utilised in soybean yield predictions with U.S. Department of Agriculture (USDA) yield data, MODIS Surface Reflectance, MODIS Land Surface Temperature, precipitation and vapor pressure. CNN-LSTM outperformed the other two models and was highly efficient working on the Google Earth Engine (GEE) [33]. These research studies demonstrated the capability of DL models with crop data statistics, soil properties, remote sensing and meteorological data. However, the relationships between the yields of the crops and the remote sensing and meteorological data were not analysed. Furthermore, directly applying spectral indices of the selected study area from remote sensing data to predict the yield of a specific crop type can cause inaccuracy. Since the values of spectral indices were extracted at a regional scale area consisting of multiple types of plants, these values cannot represent the specific crop type for its yield prediction.
This research aims to develop a widely used rigorous framework for crop yield prediction focusing on winter barley and analyse the relationships between the spectral indices, meteorological data and the yield of winter barley, with five main objectives:
- (1)
- The developed framework is constructed with elements from online opensource datasets to broaden the usage under various conditions in multiple regions.
- (2)
- Crop types on fields are classified and crop maps in the North Norfolk area from 2018 to 2023 were provided. With the crop maps, the values of spectral indices can be extracted from pixels by crop types.
- (3)
- The extracted spectral indices of winter barley are applied in the DL models with meteorological and winter barley yield data from 2018 to 2023 to construct the models for winter barley yield prediction.
- (4)
- This work tests three DL models with three different sets of input parameters to find the best model using statistical analysis.
- (5)
- The correlations between the spectral indices, meteorological data and the yield of winter barley are calculated to understand the impact of the input factors in this framework with seasonal analysis throughout the winter barley crop phenology.
2. Materials and Methods
This research develops a comprehensive yield prediction framework to improve the accuracy of the yield predictions with EO data. Crop maps are produced with EO data by a ML model. The values of spectral indices of winter barley are extracted from crop maps and applied in three DL models with meteorological data in North Norfolk to predict the yield of winter barley.
2.1. Yield Prediction Framework
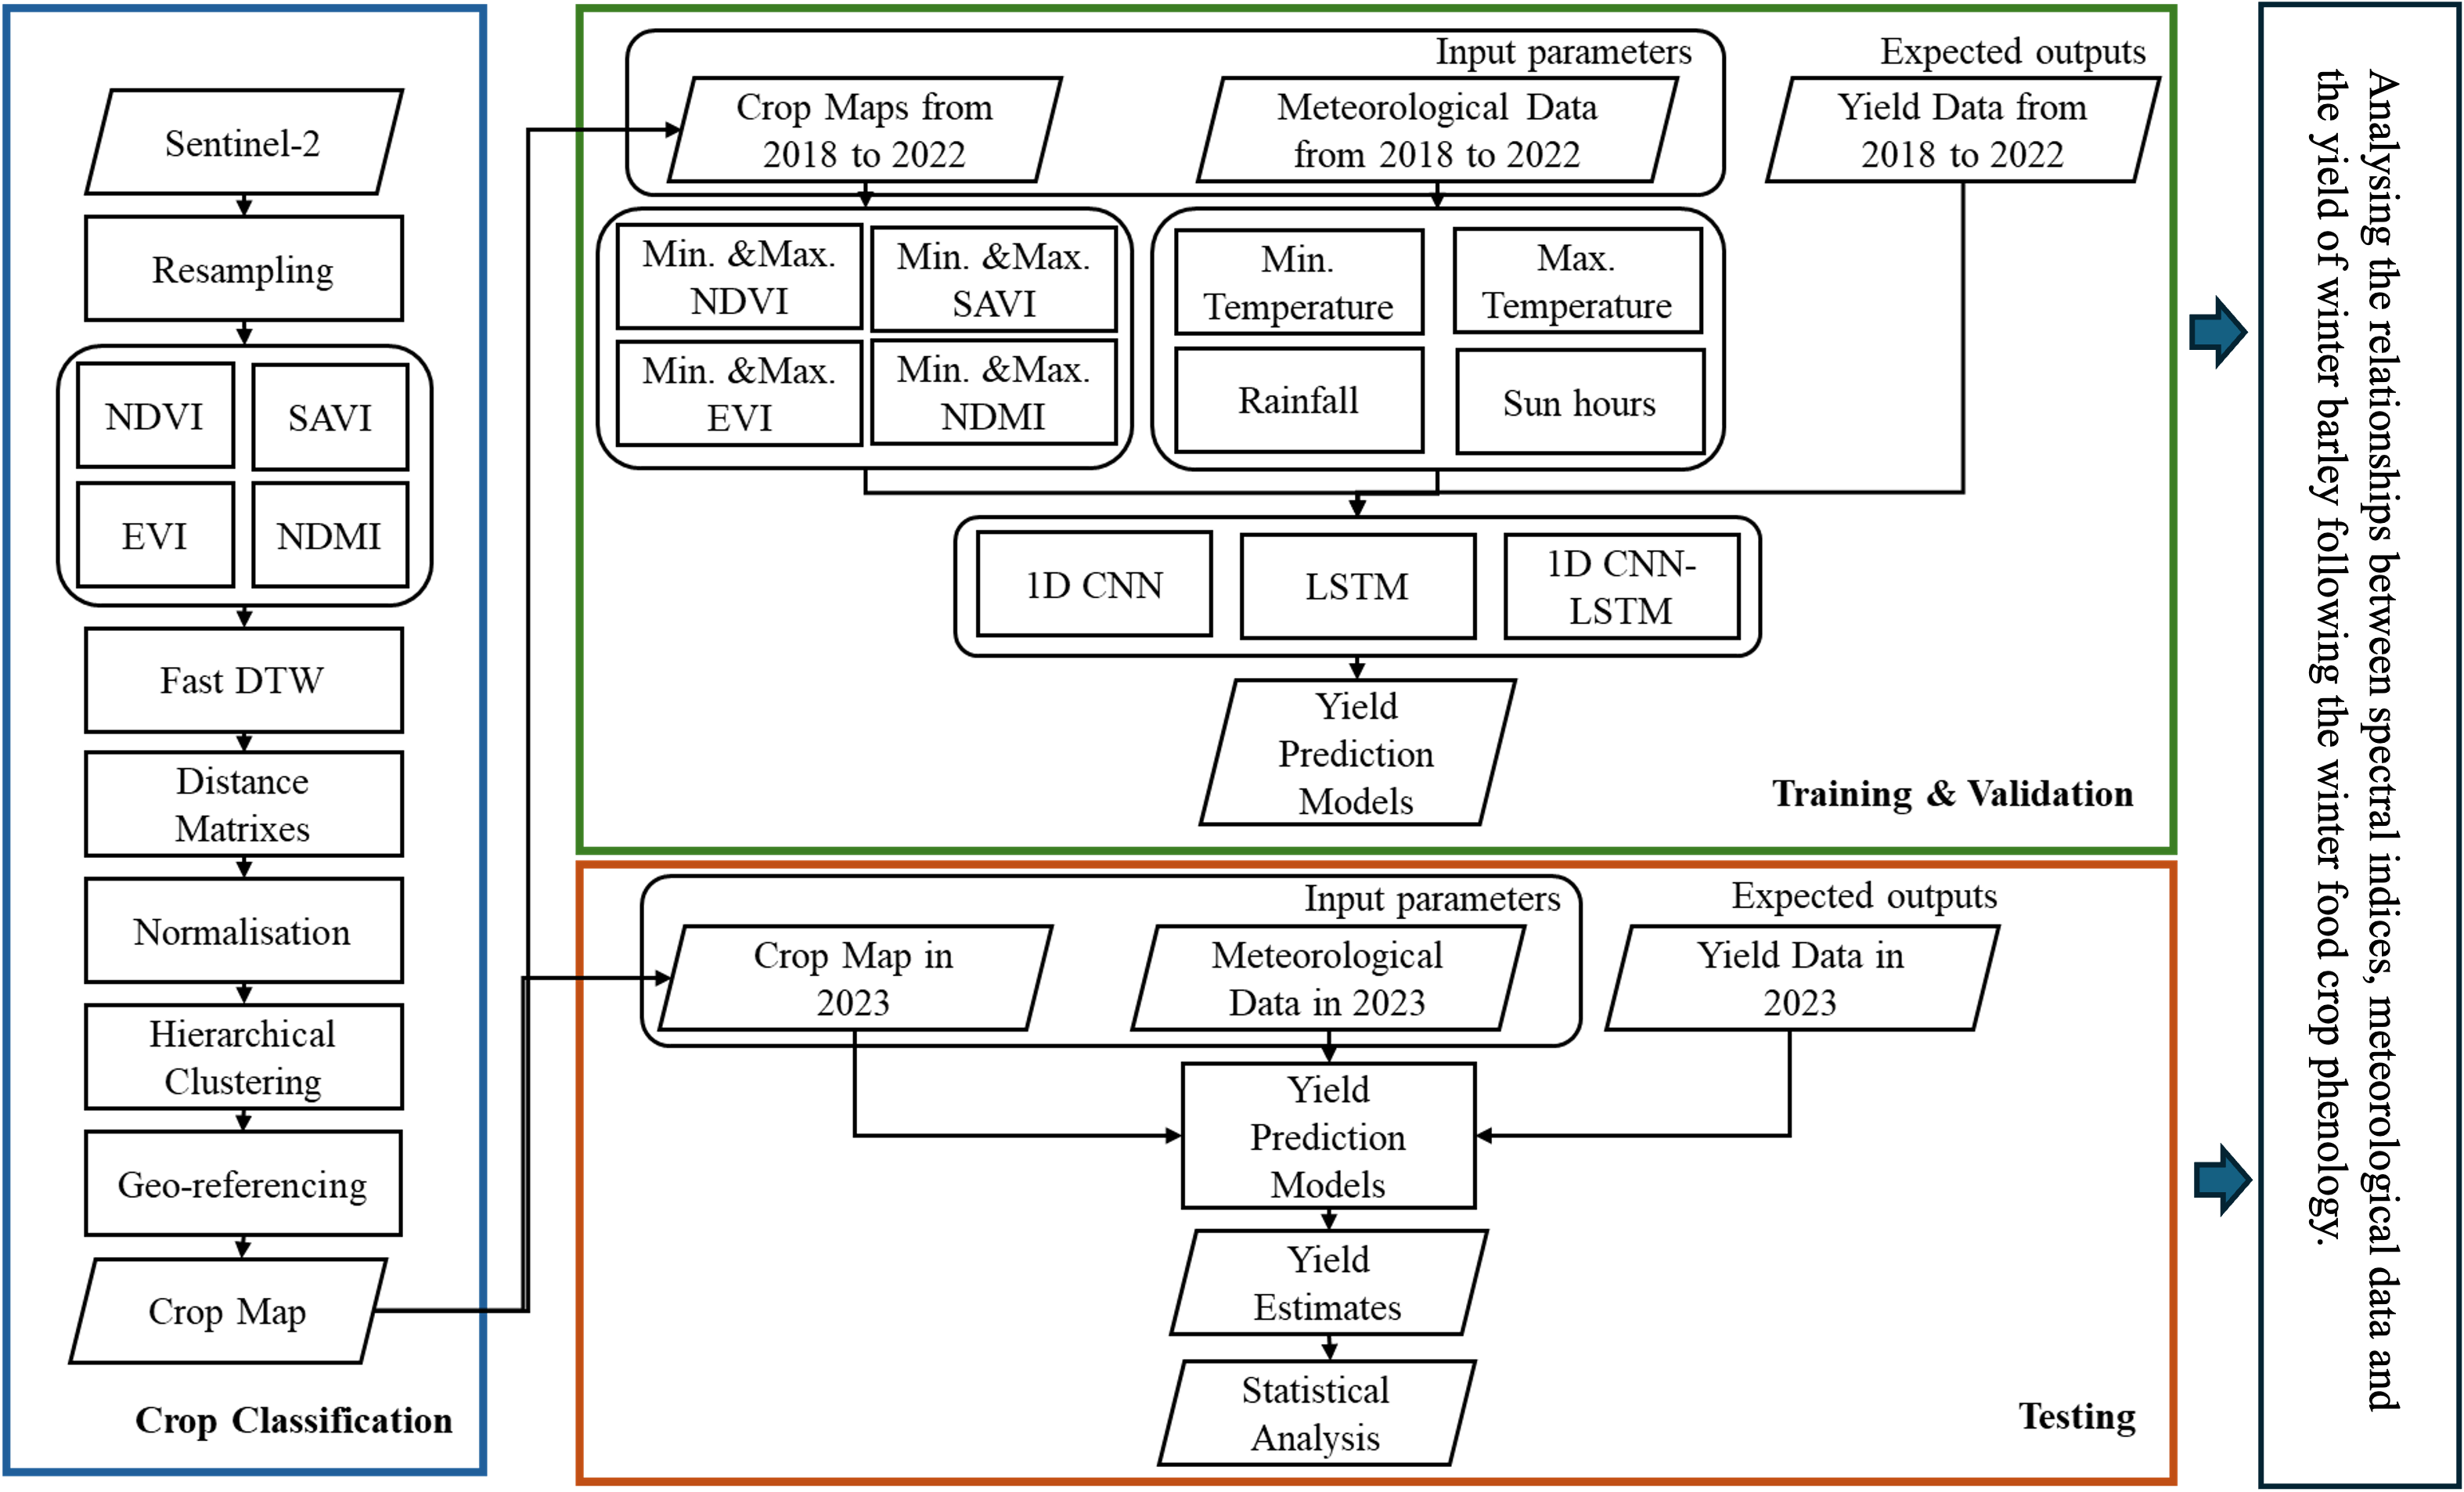
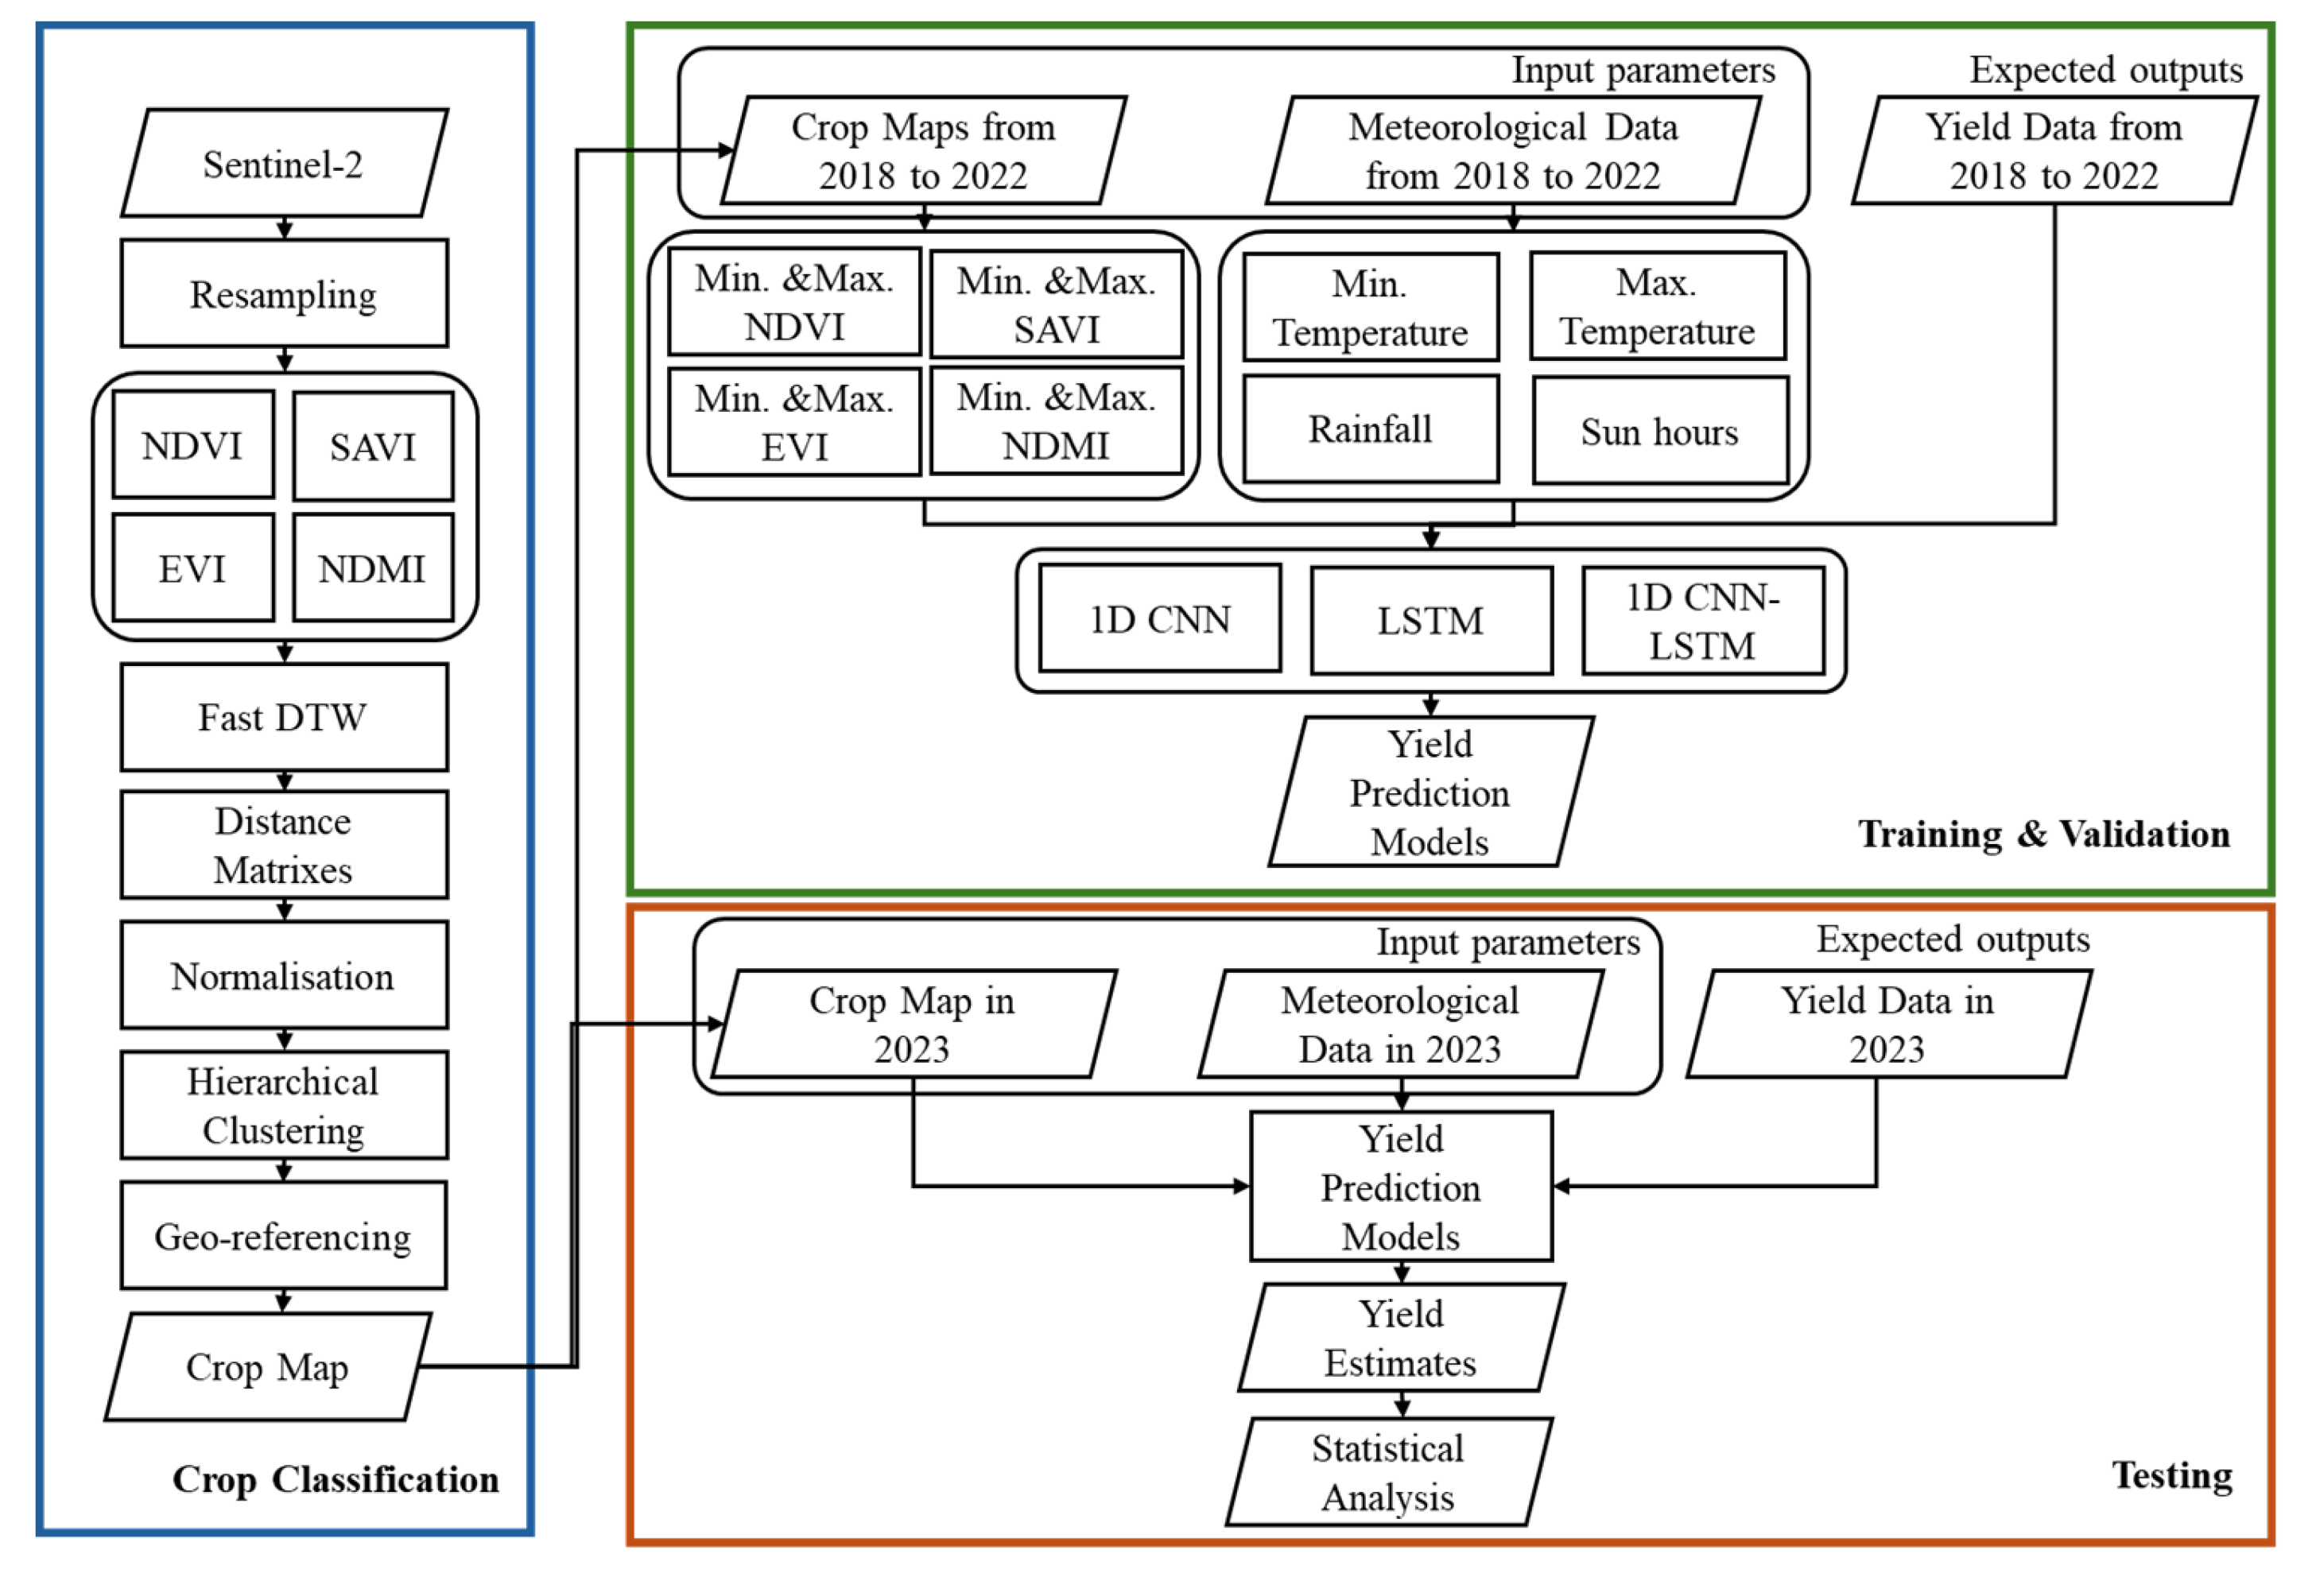
This framework comprises three main stages: crop classification; training and validation; and testing (Figure. 1). The Crop classification uses Sentinel-2 images from November 2017 to June 2023, resampled to 60 m per pixel and processed into spectral indices NDVI, SAVI, EVI and NDMI (Table. 1) these are calculated from pixels and the distance matrixes are generated with Fast DTW by the proximities between the pixels. Pixels are clustered with the normalised distance matrixes and hierarchical clustering. The pixels are georeferenced with their clusters and the final integration result, a crop map, is produced. In training and validation, there are two main input datasets with one expected output. The values of spectral indices, minimum and maximum NDVI, SAVI, EVI and NDMI are extracted from the pixels of winter barley on the crop maps from 2018 to 2022. In addition, minimum and maximum temperatures, rainfall and sun hours in the months between November and June from 2018 to 2022 are collected as input parameters. The expected outputs are the historical yield data of winter barley from 2018 to 2022. The datasets and expected outputs are trained and validated in 300 epochs with three DL models, CNN, LSTM and CNN-LSTM to generate three yield prediction models. The crop map and meteorological data in 2023 are used in the testing of the yield prediction models. The MSE and MAE of yield estimates and the yield of winter barley in 2023 are calculated for the model evaluation.
Figure 1.
The framework of food crop yield predictions.

2.2. Crop Classification
To classify the crop phenology, Sentinel-2A atmospheric corrected images from November 2017 to June 2023 were collected through Copernicus [38]. The images are resampled to the most suitable pixel size, 60 m, for the fields in the North Norfolk area [39]. The values of spectral indices, NDVI, SAVI, EVI and NDMI, of each pixel are calculated with the resampled spectral bands, Near InfraRed (NIR), Red, Green, Blue and Short-wavelength InfraRed (SWIR), from Sentinel-2A images. Crop maps from 2018 to 2023 are produced with the spectral indices of satellite images by FastDTW-HC [40], combining Fast Dynamic Time Warping (DTW) and Hierarchical Clustering (HC). Four distance matrixes of NDVI, SAVI, EVI and NDMI are generated with proximities among values of pixels by Fast DTW. By normalising and combining the four distance matrixes, pixels are clustered into classes by HC. The clustered pixels are georeferenced to the UTM/WGS84 to produce the final crop maps from 2018 to 2023.
2.2.1. FastDTW-HC
FastDTW-HC [40] is an unsupervised ML model improving the calculation of similarities between pixels with FastDTW and clustering pixels with the generated similarities by HC. FastDTW-HC is suitable for time series data, which can calculate similarities between pixels with the values at multiple time points (Figure 2), this is different from traditional Euclidean methods which calculate similarities between pixels at the single time point. Agglomerative HC in Figure 3 is then applied to form the dendrogram with the generated similarities among pixels by the bottom-up approach to classify the pixels into specific clusters.
To ensure the capability of this proposed unsupervised classification, Li et al., (2025a) [39] tested the models in years 2020 and 2023 with FastDTW-HC and statistical analysis, scoring accuracies of 77% and 77% for winter barley, 77% and 77% for wheat, 97% and 77% for winter rapeseed and 84% and 95% for spring barley. The F1 scores of winter barley and winter rapeseed in 2020 and 2023 are 0.71 and 0.88, 0.69 and 0.6, respectively, which mean the unsupervised classification performed well in recognising crops especially winter barley and winter rapeseed.
2.3. Yield Prediction Models
From 2018 to 2023, the values of spectral indices are extracted from crop maps produced by FastDTW-HC and applied in the yield prediction models combining the meteorological data. Including minimum and maximum temperature, rainfall and sun hours, the historic meteorological data of North Norfolk, UK from 2018 to 2023 is accessed from the Met Office at the Lowestoft Monckton Avenue weather station, locating in 01°43′37.20”E, 52°28′58.80”N [41]. Following the crop phenology, from November to June, the minimum and the maximum of NDVI, SAVI, EVI and NDMI and the minimum and maximum temperature, rainfall and sun hours each year are selected as the input variables of yield prediction models, 1D CNN, LSTM, 1DCNN-LSTM. The input variables are divided into two sections, 2018 to 2022 for training and validation and 2023 for testing. The expected outputs are the yields of winter barley from 2018 to 2023 collected from the survey of regional yields for England at Department for Environment, Food and Rural Affairs (DEFRA) [42]. The accuracy of yield estimates in 2023 in the testing stage is measured by MSE and MAE.
2.3.1.1. D CNN
Unlike the 2D CNN applied on images and videos, 1D CNN is designed for 1D array data such as time series, and sequential and text datasets as shown in Figure 4. At the repeated convolutional filters and max pooling layers, 1D CNN can learn to extract the features of the datasets which are utilised in the classification performed by Multi-Layer Perceptron (MLP), fully connected dense layers. The outputs of the feature extraction are flattened to 1D to feed in the 1D dense layers for prediction. The two main stages, feature extraction and prediction, are fused to one step which reduces the computational processing time and complexity [43,44].
2.3.2. LSTM
LSTM is an advanced type of RNN, which solved the vanishing gradient and exploding gradient problems, which can cause model instability and inaccuracy, while running long term time sequential data in the traditional RNN [45]. The architecture of LSTM shown in Figure 5 contains three gates, the forget gate, the input gate and the output gate. The forget gate determines the retained and discarded information of the memory cells from the previous step with equation (1). The input gate controls the updated information to be added in the memory cells with equations (2) to (4). The output gate controls the generated information of the output memory cells from the old memory cells of the previous steps and the updated information in equations (5) and (6) [46,47].
We define the elements of the LSTM in terms of:
Where , , and represent the trained weights and , , and are the bias in forget gate, input gate and output gate; is the parameter from the previous hidden layer and is the new input parameter; and are the activation functions; and are parameters generated in the input gate; denotes the element-wise multiplication and is the parameter from the hidden layer passing to the next cell.
2.3.31. D CNN-LSTM
The architecture of 1D CNN-LSTM starts from 1D CNN layer which learn to extract the general features in the convolutional filters and max pooling layers. The outputs of the 1D CNN layer are flattened and fed into the LSTM layer which extracts the temporal features in the datasets with the three gates, (the forget gate, the input gate and the output gate). The generated outputs from LSTM layer are fed into the dense layer for prediction to produce the final outputs [48,49].
3. Results
The results are presented as the crop maps from 2018 to 2023 in North Norfolk. The accuracies of three constructed crop yield prediction models with different sets of input parameters are evaluated with MSE and MAE. The correlations between the input parameters, the values of spectral indices, the meteorological data, and the yields of winter barley are analysed.
3.1. Crop Maps from 2018 to 2023
The crop maps from 2018 to 2023 are produced in this research with Sentinel-2A images and FastDTW-HC as shown in Figure 6. The study area in North Norfolk is located at 52°46′59.9”N, 0°43′07.1”E to 52°53′56.7”N, 1°17′11.1”E. It is divided into 24 tiles, 6 km to 6 km for each tile, and with a 25% overlapped between each tile to improve the accuracy of classification at the edges of tiles. The winter barley is shown in orange, winter wheat in blue, winter rapeseed in pink and spring barley in purple. As can be seen from the crop maps of 2018 to 2023 (Figure 6), the farms practice crop rotations, with winter barley being the dominant crop in 2019, 2021 and 2023 whilst winter wheat dominates in 2018, 2020 and 2022. The generated crop maps from 2018 to 2023 were utilised to extract the values of spectral indices of winter barley between 2018 and 2023.
3.2. Yield Monitoring and Estimation Evaluation
The values of spectral indices extracted from the crop maps and the meteorological data from 2018 to 2023 are the input parameters of the yield prediction models, which are formed with CNN, LSTM and CNN-LSTM. The data, the values of spectral indices and the meteorological datasets, from 2018 to 2022 are trained in the DL models, CNN, LSTM, CNN-LSTM. The data in 2023 is used to produce the yield estimate in the testing of the DL models. The yield predictions are generated and statistically analysed with the MSE and the MAE. In Table 2, the CNN model shows the poorest results in every combination of input variables. The LSTM model which is suitable for time series predictions performs much better than the CNN model and approaches the best results with lowest MSE and MAE. By combining these two models to CNN-LSTM, though it extracts the general features from CNN and temporal features from LSTM, the accuracy is slightly lower than the results from LSTM. Showing the LSTM performs the best, this contracts some previous work such as Sun et al., 2019[33]. The predictions with SAVI only using CNN, LSTM and CNN-LSTM demonstrate the best results due to the high correlation between the values of SAVI and the yield of winter barley.
In Table 3 and 4, the values of spectral indices of winter barley are analysed with the yield of winter barley in North Norfolk throughout 2018 to 2023. It shows positive correlation between the yield of winter barley and the average SAVI of each year, and a negative correlation between the yield of winter barley and the average NDVI, EVI and NDMI of each year. When analysing the relationships between the yield and the maximum and minimum spectral indices in the year, it is shown that there are strong positive correlations in the maximum and minimum SAVI, a strong negative correlation in maximum NDVI, strong negative correlation in both maximum EVI and NDMI. Since the maximum and minimum of spectral indices are the input parameters of yield prediction models, only the results using SAVI generate accurate yield predictions in all three types of DL models, CNN, LSTM and CNN-LSTM.
Table 4.
The minimum and maximum of the spectral indices from 2018 to 2023 and the correlation with the yield of winter barley.
Table 4.
The minimum and maximum of the spectral indices from 2018 to 2023 and the correlation with the yield of winter barley.
| NDVI | SAVI | EVI | NDMI | |||||
| Min | Max | Min | Max | Min | Max | Min | Max | |
| 2018 | 0.295 | 0.499 | 0.443 | 0.732 | 0.048 | 0.161 | 0.104 | 0.271 |
| 2019 | 0.242 | 0.493 | 0.359 | 0.696 | 0.001 | 0.186 | 0.074 | 0.254 |
| 2020 | 0.339 | 0.723 | 0.192 | 0.518 | 0.066 | 0.258 | 0.117 | 0.322 |
| 2021 | 0.301 | 0.679 | 0.150 | 0.559 | 0.048 | 0.219 | 0.060 | 0.336 |
| 2022 | 0.307 | 0.473 | 0.459 | 0.671 | 0.038 | 0.195 | 0.079 | 0.232 |
| 2023 | 0.339 | 0.494 | 0.507 | 0.722 | 0.056 | 0.151 | 0.111 | 0.282 |
| Correlation with yield | -0.451 | -0.91 | 0.808 | 0.871 | -0.651 | -0.807 | -0.077 | -0.778 |
3.3. Correlation Analysis Between the Yield and Meteorological Datasets
In addition to the values of spectral indices being examined, the meteorological datasets have also been analysed against the yield of winter barley in Table 5 and 6. The average annual minimum temperature and the yield of winter barley show the positive correlation and the average annual rainfall shows negative correlation with the yield of winter barley in Figure 7A. To understand the relationship between the seasonal meteorological datasets and the yield of winter barley, the analysis is separated into the three growth seasons of winter barley, divided with the Growth Stages (GS), (Season 1: November and December the germination and seedling growth stages (GS00-20), Season 2: January, February and March the tillering stage (GS20-29), Season 3: April, May and June, the stem elongation, flowering and grain filling stage (GS30-89)) [50].
The result shows that the meteorological datasets in November and December have strong positive correlation with the yield of the winter barley, as shown in Figure 7B and Table 6. November and December is the germination and the seedling growth stages of winter barley, the average of minimum and maximum temperatures and sun hours in November and December are all positively correlated with the yield of winter barley. This demonstrates the yields throughout the years are strongly influenced by the minimum temperature, maximum temperature and sun hours in November and December.
The tillering stage in January, February and March, shows a negative correlation between average rainfall and the yield of winter barley in Figure 7C and Table 6. This corresponds to the high negative correlation between average and maximum NDMI and the yield of winter barley throughout the years. The years with higher rainfall rate in January, February and March can cause lower yield of winter barley in the year. The values happening in January, February and March of other meteorological factors does not appear to have a significant relationship with the yield of winter barley.
In April, May and June, the stem elongation, flowering and grain filling stage, the average sun hours in April, May and June show a strong negative correlation with the yield of winter barley throughout the years, as shown in Figure 7D and Table 6. This may cause lower yields of winter barley if the average sun hours are higher than expected. Higher than expected sun hours do not boost the photosynthesis, but restrain the crop growth since the DNA of plants may be damaged due to the high daily exposure of harsh ultraviolet radiation [51].
4. Discussion
This research extracts the values of four spectral indices, NDVI, SAVI, EVI and NDMI of winter barley directly from the historical crop maps in North Norfolk, UK. The analysis of the relationships between the spectral indices and the yields of winter barley are provided. NDVI has been widely used to predict the cereal grain yields in research studies. MODIS-NDVI effectively predicted crop yields across Canadian Prairie and the relationships between NDVI and the grain yield of several crops were studied [52]. The results showed higher correlation between NDVI and crop yields during the flowering and grain filling stages [52,53,54]. In the study of Czech Republic and Slovakia, the strongest positive relationships between NDVI and cereal-yield were again recorded during the flowering and grain seasons; however, in regions of Germany, a strong negative correlation were observed [55]. The inconsistent relationships of the NDVI and the yield could be as a result of the following reasons: (1) The spectral indices, including NDVI, of multiple crop types are different and will influence the results. (2) MODIS-NDVI used in previous research studies was calculated under a cropland mask, which classifies the crop lands but combines all crops types together [56]. In this case, accurate historical crop maps provided in this study are necessary and important while analysing the correlation between the values of spectral indices and the yield of crops. This research indicates that the average, minimum and maximum NDVI of the year show negative correlations with the historical yields of winter barley. Of the three yield DL prediction models, 1D CNN and 1DCNN-LSTM, NDVI shows the weakest results, and is not a good predictor. Vannoppen et al., (2022) [57] reached the same conclusion when investigating potato crops in northern Belgium. This study found that the best predictor variable was SAVI, which demonstrates accurate results in the predictions for all three DL models. Minimum and maximum SAVI, occurs in the germination and seedling growth and tillering separately, and the average SAVI of the year show strong correlations with the yield of winter barley. It is thus recommended that future research focus more on using SAVI for crop yield monitoring and predictions.
The other spectral indices, EVI and NDMI, in this research were applied to reach the best result in crop classifications with FastDTW-HC yield prediction of winter barley. Unlike the result of crop classifications, the parameter combination of NDVI, SAVI, EVI and NDMI does not provide the best result in yield prediction with DL models due to the lower correlation between the yield of winter barley and EVI and NDMI. Compared to average and maximum NDVI of the year, average and maximum EVI of the year has lower negative correlation with the yield of winter barley. However, the minimum EVI of the year shows higher negative correlation than the minimum NDVI. In previous research studies, NDVI and EVI contributed equally to crop yield prediction models [58,59] whilst Raza et al. (2025) [60] indicated both NDVI and EVI do not perform well when predicting the crop yield with the ML models, which corresponds to the yield prediction of winter barley resulted in this study. Unlike NDVI and EVI, NDMI is not a commonly used parameter of crop yield prediction. NDMI is most commonly used in soil moisture monitoring and estimations in agricultural research [61,62]. In this study, NDMI, shows a negative correlation with the yield (especially in the maximum NDMI of the year), which may correspond to the water content of the soil and thus demonstrates the link with reducing yields during high rainfalls at the tillering stage. The year with highest average rainfall during the tillering stage (January, February and March) produces lower yields of winter barley. The excessive water absorption through the rainfall maybe harmful to crop health, including waterlogging or root diseases [63]. Besides rainfall, our analysis demonstrates the temperature and sun hours have a major impact during the germination and seedling growth stages (November and December) on the yield of winter barley compared to other periods. Minimum and maximum temperature and sun hours show relatively high correlation with the yield of winter barley during the germination and the seedling growth stages. A similar situation was found in by Juhász et al. [64], which shared identical phenology of winter barley with Li et al., (2025b) [40]. In general, according to the analysis of weather conditions and spectral indices to the yield of winter barley in this research study, the period of germination and seedling growth, and tillering are the two key growth seasons influencing the yield of winter barley. These findings can be beneficial when considering detailed monitoring and predictions of seasonal crop yields.
5. Conclusions
Soil properties, crop growth information, crop yield, meteorological and remote sensing datasets were utilised to predict crop yields with DL methods. This research applies the most commonly used ones, with temperature, rainfall and spectral indices as input parameters, which were freely available as online products. With accessible opensource data, the same DL frameworks can be more easily implemented on different regions, especially those in remote and unreachable areas. A DL framework for the prediction of the yield of winter barley has been developed in this study, producing a series of accurate retrospective crop maps. The main outcomes are:
- (1)
- The accurate historical crop maps are generated with zero ground truth by FastDTW-HC which does not require further local surveying. This unsupervised classification method can be used to investigate large regions (land areas) after being tested in a small region.
- (2)
-
The values of spectral indices of winter barley are extracted from the historical crop maps by pixels of the winter barley, which are considered more accurate. This resolves the inaccuracy of previous research studies which directly applied regional average values of spectral indices for studies on winter barley. The relationships between spectral indices and the yield of winter barley are studied with more accurate data, which points out that:
- SAVI is the best predictor of the DL yield prediction due to the strong correlation with the yield of winter barley throughout 2018 to 2023.
- The analysis of spectral indices indicates that the commonly used NDVI and EVI in yield predictions are not the best parameters due to the relatively low correlation.
- The maximum NDMI shows strong negative correlation with the yield of winter barley which corresponds to the yield decline during the high rainfalls at the tillering stage of the year.
- (3)
- LSTM outperforms CNN and CNN-LSTM in this research with its capability of extracting the temporal features. The LSTM demonstrates the best results using SAVI in this research with MSE 0.21 kg/hectare and MAE 13.63kg/hectare. Minimum and maximum SAVI, occurs in the germination, seedling growth, and tillering separately, and the average SAVI of the year, is an important factors that influences the yield of winter barley.
- (4)
-
This analysis indicates that certain weather conditions during specific times of year can have a significant impact on yield, in particular it was found that:
- Temperature and sun hours have significant impacts during the germination and seedling growth stages (November and December), with higher temperatures and sun hours improving germination and seedling growth and eventual yield of winter barley.
- High rainfall during the tillering stage (January, February and March) and high sun hours during the stem elongation, flowering and grain filling stages (April, May and June) produce lower yields of winter barley.
By applying the framework of this research, food security decision makers can manage the arable food crop farming plans, storage and delivery. The crop rotation throughout the years can maintain the biodiversity and the soil health. The yield monitoring and predictions of food crops can assist farmers to ensure the annual productions, profits and stabilise the regional food plan within a community. Decision makers can foresee the annual yields of multiple crops in each region before the harvest time to adjust the annual food importation and exportation. The analysis of spectral indices and seasonal meteorology can provide insight to support policies of seasonal, annual and long-term agricultural plan, including water, soil and land management. Stockholders can take these crop statistics into account to predict the profitable targets in the stock market.
6. Future Work
This developed framework is suggested to be used in multiple crop types in different regions with meteorological data and historical yield data. Due to the limitation of the historical yield data, it is worth categorizing the food crops with similar characteristics into sections to predict the yields of the food crops by sections. For instance, winter and spring barley and winter and spring wheat share almost identical phenology and characteristics. These types of crops can cluster into the same section as cereal crop while predicting the yield and the production to maintain the food sustainability and the nutrition needs. However, more detailed crop yield data is encouraged to be collected to comprehensively analyse the influence of spectral indices and meteorological data on specific crop types in multiple regions. More input parameters can be tested in yield prediction models to determine the critical factors for predicting the specific crop yield.
Author Contributions
Conceptualization, H.-Y.L.; methodology, H.-Y.L..; software, H.-Y.L..; validation, H.-Y.L.; formal analysis, H.-Y.L.; investigation, H.-Y.L.; resources, H.-Y.L.; data curation, H.-Y.L.; writing—original draft preparation, H.-Y.L.; writing—review and editing, H.-Y.L.; visualization, H.-Y.L.; supervision, J.A.L., P.J.M. and R.C.G.; project administration, J.A.L. and P.J.M. All authors have read and agreed to the published version of the manuscript.
Funding
Not Applicable.
Data Availability Statement
The multispectral image products were downloaded from Sentinel-2—Missions—Sentinel Online—Sentinel Online. (n.d.), Sentinel Online, https://sentinel.esa.int/web/sentinel/missions/sentinel-2 (accessed on 10 Oct 2024). The meteorological data was downloaded from Met Office, MIDAS: UK Hourly Weather Observation Data. NCAS British Atmospheric Data Centre, https://catalogue.ceda.ac.uk/uuid/916ac4bbc46f7685ae9a5e10451bae7c (accessed on 28th Feb 2025). The historical yield data was downloaded from Cereal and oilseed production in the United Kingdom 2023, Department of Environment, Food and Rural Affairs (DEFRA), UK, 2025, https://www.gov.uk/government/statistics/cereal-and-oilseed-rape-production#full-publication-update-history (accessed on 10th July 2024).
Conflicts of Interest
The authors declare no conflicts of interest.
References
- Grassini, P.; Eskridge, K.; Cassman, K. Distinguishing between yield advances and yield plateaus in historical crop production trends. Nat Commun 2013, 4, 2918. [Google Scholar] [CrossRef]
- Lin, M.; Huybers, P. Reckoning wheat yield trends. Environ. Res. Lett. 2012, 7, 024016. [Google Scholar] [CrossRef]
- Ray, D. K.; Ramankutty, N.; Mueller, N. D.; West, P. C.; Foley, J. A. Recent patterns of crop yield growth and stagnation. Nature Communications 2012, 3, 1293. [Google Scholar] [CrossRef] [PubMed]
- Brisson, N.; Gate, P.; Gouache, D.; Charmet, G. ; Oury, F-X. ; Huard, F. Why are wheat yields stagnating in Europe? A comprehensive data analysis for France. Field Crops Research 2010, 119, 201–212. [Google Scholar] [CrossRef]
- Kristensen, K.; Schelde, K.; Olesen, J. E,. Winter wheat yield response to climate variability in Denmark. The Journal of Agricultural Science. 2011, 149, 33–47. [Google Scholar] [CrossRef]
- Børgesen, C. D.; Olesen, J. E. A probabilistic assessment of climate change impacts on yield and nitrogen leaching from winter wheat in Denmark. Nat. Hazards Earth Syst. Sci. 2011, 11, 2541–2553. [Google Scholar] [CrossRef]
- Alston, J. M. , Beddow, J. M., Pardey, P. G. Agricultural Research, Productivity, and Food Prices in the Long Run. Science 2009, 325, 1209–1210. [Google Scholar] [CrossRef]
- Mandal, D.; Rao, Y. S. SASYA: An integrated framework for crop biophysical parameter retrieval and within-season crop yield prediction with SAR remote sensing data. Remote Sensing Applications: Society and Environment 2020, 20, 100366. [Google Scholar] [CrossRef]
- Maas, S. J. Parameterized Model of Gramineous Crop Growth: I. Leaf Area and Dry Mass Simulation. Agron. J. 1993, 85, 348–353. [Google Scholar] [CrossRef]
- Maas, S. J. Parameterized Model of Gramineous Crop Growth: II. Within-Season Simulation Calibration. Agron. J. 1993, 85, 354–358. [Google Scholar] [CrossRef]
- Duchemin, B.; Maisongrande, P.; Boulet, G.; Benhadj, I. A simple algorithm for yield estimates: Evaluation for semi-arid irrigated winter wheat monitored with green leaf area index. Environmental Modelling & Software 2008, 23, 876–892. [Google Scholar] [CrossRef]
- Yeom, J.-M.; Ko, J.; Kim, H.-O. Application of GOCI-derived vegetation index profiles to estimation of paddy rice yield using the GRAMI rice model. Computers and Electronics in Agriculture 2015, 118, 2015, 1–8. [Google Scholar] [CrossRef]
- Kim, H.; Ko, J.; Jeong, S.; Yeom, J.; Ban, J.-O.; Kim, H.-Y. Simulation and mapping of rice growth and yield based on remote sensing. Journal of Applied Remote Sensing 2015, 9, 096067. [Google Scholar] [CrossRef]
- Battude, M.; Bitar, A.A.; Morin, D.; Cros, J.; Huc, M.; Sicre, C.M. , et al. Estimating maize biomass and yield over large areas using high spatial and temporal resolution Sentinel-2 like remote sensing data. Remote Sensing of Environment 2016, 184, 668–681. [Google Scholar] [CrossRef]
- Ameline, M.; Fieuzal, R.; Betbeder, J.; Berthoumieu, J.-F.; Baup, F. Estimation of Corn Yield by Assimilating SAR and Optical Time Series Into a Simplified Agro-Meteorological Model: From Diagnostic to Forecast. IEEE Journal of Selected Topics in Applied Earth Observations and Remote Sensing 2018, 11, 4747–4760. [Google Scholar] [CrossRef]
- Kim, M.; Ko, J.; Jeong, S.; Yeom, J.; Kim, H. Monitoring canopy growth and grain yield of paddy rice in South Korea by using the GRAMI model and high spatial resolution imagery. GIScience & Remote Sensing 2017, 54, 534–551. [Google Scholar] [CrossRef]
- Ma, C.; Liu, M.; Ding, F.; Li, C.; Cui, Y.; Chen, W. , et al. Wheat growth monitoring and yield estimation based on remote sensing data assimilation into the SAFY crop growth model. Sci Rep 2022, 12, 5473. [Google Scholar] [CrossRef]
- Ed-Daoudi, R.; Alaoui, A.; Ettaki, B.; Zerouaoui, J. Improving Crop Yield Predictions in Morocco Using Machine Learning Algorithms. Journal of Ecological Engineering 2023, 24, 392–400. [Google Scholar] [CrossRef]
- Gumma, M.K.; Thenkabail, P.S.; Panjala, P.; Teluguntla, P.; Yamano, T.; Mohammed, I. Multiple agricultural cropland products of South Asia developed using Landsat-8 30 m and MODIS 250 m data using machine learning on the Google Earth Engine (GEE) cloud and spectral matching techniques (SMTs) in support of food and water security. GIScience & Remote Sensing 2022, 59, 1048–1077. [Google Scholar] [CrossRef]
- Srivastava, A.K.; Safaei, N.; Khaki, S.; Lopez, G.; Zeng, W.; Ewert, F. Winter wheat yield prediction using convolutional neural networks from environmental and phenological data. Sci Rep 2022, 12, 3215. [Google Scholar] [CrossRef]
- Shammi, S.A.; Meng, Q. Modeling crop yield using NDVI-derived VGM metrics across different climatic regions in the USA. Int J Biometeorol 2023, 67, 1051–1062. [Google Scholar] [CrossRef]
- Jurečka, F.; Fischer, M.; Hlavinka, P.; Balek, J.; Semerádová, D.; Bláhová, M. , et al. ,, Potential of water balance and remote sensing-based evapotranspiration models to predict yields of spring barley and winter wheat in the Czech Republic. Agricultural Water Management 2021, 256, 107064. [Google Scholar] [CrossRef]
- Yalcin, H., 2019. An approximation for a relative crop yield estimate from field images using deep learning. In 2019 8th International Conference on Agro-Geoinformatics, Agro-Geoinformatics 2019 Article 8820693 (2019 8th International Conference on Agro-Geoinformatics, Agro-Geoinformatics 2019). Institute of Electrical and Electronics Engineers Inc. [CrossRef]
- Elavarasan, D.; Vincent, P. M. D. Crop Yield Prediction Using Deep Reinforcement Learning Model for Sustainable Agrarian Applications. IEEE Access 2020, 8, 86886–86901. [Google Scholar] [CrossRef]
- Kiran Kumar, V.; Ramesh, K.V.; Rakesh, V. Optimizing LSTM and Bi-LSTM models for crop yield prediction and comparison of their performance with traditional machine learning techniques. Appl Intell 2023, 53, 28291–28309. [Google Scholar] [CrossRef]
- Tian, H.; Wang, P.; Tansey, K.; Zhang, J.; Zhang, S.; Li, H. An LSTM neural network for improving wheat yield estimates by integrating remote sensing data and meteorological data in the Guanzhong Plain, PR China. Agricultural and Forest Meteorology 2021, 310, 108629. [Google Scholar] [CrossRef]
- Bhimavarapu, U.; Battineni, G.; Chintalapudi, N. Improved Optimization Algorithm in LSTM to Predict Crop Yield. Computers 2023, 12, 10. [Google Scholar] [CrossRef]
- Klompenburg, T.V.; Kassahun, A.; Catal, C. Crop yield prediction using machine learning: A systematic literature review. Computers and Electronics in Agriculture 2020, 177, 105709. [Google Scholar] [CrossRef]
- Dharani, M.K.; Thamilselvan, R.; Natesan, P.; Kalaivaani, P.C.D.; Santhoshkumar, S. Review on Crop Prediction Using Deep Learning Techniques. J. Phys.: Conf. Ser. 2021, 1767, 012026. [Google Scholar] [CrossRef]
- Khaki, S.; Wang, L.; Archontoulis, S. V. , 2020. A CNN-RNN Framework for Crop Yield Prediction. Frontiers in Plant Science 10. [CrossRef]
- Jiang, H.; Hu, H.; Zhong, R.; Xu, J.; Xu, J.; Huang, J. , et al. A deep learning approach to conflating heterogeneous geospatial data for corn yield estimation: A case study of the US Corn Belt at the county level. Global Change Biology 2019, 26, 1754–1766. [Google Scholar] [CrossRef]
- Schwalbert, R.A.; Amado, T.; Corassa, G.; Pott, L.P.; Vara Prasad, P.V.; Ciampitti, I.A. Satellite-based soybean yield forecast: Integrating machine learning and weather data for improving crop yield prediction in southern Brazil. Agricultural and Forest Meteorology 2020, 284, 107886. [Google Scholar] [CrossRef]
- Sun, J.; Di, L.; Sun, Z.; Shen, Y.; Lai, Z. County-Level Soybean Yield Prediction Using Deep CNN-LSTM Model. Sensors 2019, 19, 4363. [Google Scholar] [CrossRef]
- Goward, S.N.; Markham, B.; Dye, D.G.; Dulaney, W.; Yang, J. Normalized difference vegetation index measurements from the advanced very high resolution radiometer. Remote Sensing of Environment 1991, 35, 257–277. [Google Scholar] [CrossRef]
- Huete, A.R. A soil-adjusted vegetation index (SAVI). Remote Sensing of Environment 1988, 25, 295–309. [Google Scholar] [CrossRef]
- Liu, H. Q.; Huete, A. A feedback based modification of the NDVI to minimize canopy background and atmospheric noise. IEEE Transactions on Geoscience and Remote Sensing 1995, 33, 457–465. [Google Scholar] [CrossRef]
- Gao, B. NDWI—A normalized difference water index for remote sensing of vegetation liquid water from space. Remote Sensing of Environment 1996, 58, 257–266. [Google Scholar] [CrossRef]
- Sentinel-2—Missions—Sentinel Online—Sentinel Online. (n.d.). Sentinel Online. https://sentinel.esa.int/web/sentinel/missions/sentinel-2 (accessed on 10 Oct 2024).
- Li, H.-Y.; Lawrence, J.A.; Mason, P.J.; Ghail, R.C. , 2025a. Assessing the Effect of Spatial Resolution on Crop Classification Success. IGARSS 2025—2025 IEEE International Geoscience and Remote Sensing Symposium, Brisbane, Australia, 2025. (Processing).
- Li, H.-Y.; Lawrence, J.A.; Mason, P. J.; Ghail, R.C. Fast Dynamic Time Warping and Hierarchical Clustering with Multispectral and Synthetic Aperture Radar Temporal Analysis for Unsupervised Winter Food Crop Mapping. Agriculture 2025, 15, 82. [Google Scholar] [CrossRef]
- Met Office, 2006. MIDAS: UK Hourly Weather Observation Data. NCAS British Atmospheric Data Centre. https://catalogue.ceda.ac.uk/uuid/916ac4bbc46f7685ae9a5e10451bae7c (accessed on 28th Feb 2025).
- Cereal and oilseed production in the United Kingdom 2023, Department of Environment, Food and Rural Affairs (DEFRA), UK, 2025. https://www.gov.uk/government/statistics/cereal-and-oilseed-rape-production#full-publication-update-history (accessed on 10th July 2024).
- Kiranyaz, S.; Ince, T.; Gabbouj, M. Personalized Monitoring and Advance Warning System for Cardiac Arrhythmias. Sci Rep 2017, 7, 9270. [Google Scholar] [CrossRef]
- Kiranyaz, S.; Ince, T.; Gabbouj, M. Real-Time Patient-Specific ECG Classification by 1-D Convolutional Neural Networks. IEEE Transactions on Biomedical Engineering 2016, 63, 664–675. [Google Scholar] [CrossRef]
- Hochreiter, S.; Schmidhuber, J. Long short-term memory. Neural Computation 1997, 9, 1735–1780. [Google Scholar] [CrossRef]
- Mirzaei, M.; Yu, H.; Dehghani, A.; Galavi, H.; Shokri, V.; Mohsenzadeh Karimi, S. , et al. A Novel Stacked Long Short-Term Memory Approach of Deep Learning for Streamflow Simulation. Sustainability 2021, 13, 13384. [Google Scholar] [CrossRef]
- Dehghani, A.; Moazam, H.M.Z.H. , Mortazavizadeh, F., Ranjbar, V., Mirzaei, M., Mortezavi, S., et al. Comparative evaluation of LSTM, CNN, and ConvLSTM for hourly short-term streamflow forecasting using deep learning approaches. Ecological Informatics 2023, 75, 102119. [Google Scholar] [CrossRef]
- Aksan, F.; Li, Y.; Suresh, V.; Janik, P. CNN-LSTM vs. LSTM-CNN to Predict Power Flow Direction: A Case Study of the High-Voltage Subnet of Northeast Germany. Sensors 2023, 23, 901. [Google Scholar] [CrossRef] [PubMed]
- Halbouni, A.; Gunawan, T.S.; Habaebi, M.H.; Halbouni, M.; Kartiwi, M.; Ahmad, R. CNN-LSTM: Hybrid Deep Neural Network for Network Intrusion Detection System. IEEE Access 2022, 10, 99837–99849. [Google Scholar] [CrossRef]
- Key development phases and growth stages in barley, Agriculture and Horticulture Development Board (AHDB), 2025. https://ahdb.org.uk/knowledge-library/key-development-phases-and-growth-stages-in-barley (accessed on 3rd September 2025).
- Sekiyama, T.; Nagashima, A. Solar Sharing for Both Food and Clean Energy Production: Performance of Agrivoltaic Systems for Corn. A Typical Shade-Intolerant Crop. Environments 2019, 6, 65. [Google Scholar] [CrossRef]
- Mkhabela, M.S.; Bullock, P.; Raj, S.; Wang, S.; Yang, Y. Crop yield forecasting on the Canadian Prairies using MODIS NDVI data. Agricultural and Forest Meteorology 2011, 151, 385–393. [Google Scholar] [CrossRef]
- Marti, J.; Bort, J.; Slafer, G.A.; Araus, J.L. Can wheat yield be assessed by early measurement of normalised difference vegetation index? Ann. Appl. Biol. 2007, 150, 253–257. [Google Scholar] [CrossRef]
- Salazar, L.; Kogan, F.; Roytman, L. Use of remote sensing data for estimation of winter wheat yield in the United States. International Journal of Remote Sensing 2007, 28, 3795–3811. [Google Scholar] [CrossRef]
- Panek, E.; Gozdowski, D. Analysis of relationship between cereal yield and NDVI for selected regions of Central Europe based on MODIS satellite data. Remote Sensing Applications: Society and Environment 2020, 17, 100286. [Google Scholar] [CrossRef]
- Johnson, D.M.; Rosales, A.; Mueller, R.; Reynolds, C.; Frantz, R.; Anyamba, A. , et al. USA Crop Yield Estimation with MODIS NDVI: Are Remotely Sensed Models Better than Simple Trend Analyses? Remote Sensing 2021, 13, 4227. [Google Scholar] [CrossRef]
- Vannoppen, A.; Gobin, A. Estimating Yield from NDVI, Weather Data, and Soil Water Depletion for Sugar Beet and Potato in Northern Belgium. Water 2022, 14, 1188. [Google Scholar] [CrossRef]
- Kouadio, L.; Newlands, N.K.; Davidson, A.; Zhang, Y.; Chipanshi, A. Assessing the Performance of MODIS NDVI and EVI for Seasonal Crop Yield Forecasting at the Ecodistrict Scale. Remote Sensing 2014, 6, 10193–10214. [Google Scholar] [CrossRef]
- Shammi, S.A.; Meng, Q. Use time series NDVI and EVI to develop dynamic crop growth metrics for yield modeling. Ecological Indicators 2021, 121, 107124z. [Google Scholar] [CrossRef]
- Raza, A.; Shahid, M.A.; Zaman, M.; Miao, Y.; Huang, Y.; Safdar, M. , et al. Improving Wheat Yield Prediction with Multi-Source Remote Sensing Data and Machine Learning in Arid Regions. Remote Sensing 2025, 17, 774. [Google Scholar] [CrossRef]
- Imtiaz, F.; Farooque, A.A.; Randhawa, S.G.; Wang, X.; Esau, J.T.; Acharya, B. , et al. An inclusive approach to crop soil moisture estimation: Leveraging satellite thermal infrared bands and vegetation indices on Google Earth engine. Agricultural Water Management 2024, 306, 109172. [Google Scholar] [CrossRef]
- Koohikeradeh, E.; Jose Gumiere, S.; Bonakdari, H. NDMI-Derived Field-Scale Soil Moisture Prediction Using ERA5 and LSTM for Precision Agriculture. Sustainability 2025, 17, 2399. [Google Scholar] [CrossRef]
- Knight, C.; Khouakhi, A.; Waine, T.W. The impact of weather patterns on inter-annual crop yield variability. Science of The Total Environment 2024, 955, 177181. [Google Scholar] [CrossRef]
- Juhász, C.; Gálya, B.; Kovács, E.; Nagy, A.; Tamás, J.; Huzsvai, L. Seasonal predictability of weather and crop yield in regions of Central European continental climate. Computers and Electronics in Agriculture 2020, 173, 105400. [Google Scholar] [CrossRef]
Figure 2.
The concept of Fast DTW. Fast DTW can calculate the similarities between X and Y pixels with the calculation among the values at multiple time points in time series which is different from the traditional Euclidean method. [40].
Figure 2.
The concept of Fast DTW. Fast DTW can calculate the similarities between X and Y pixels with the calculation among the values at multiple time points in time series which is different from the traditional Euclidean method. [40].
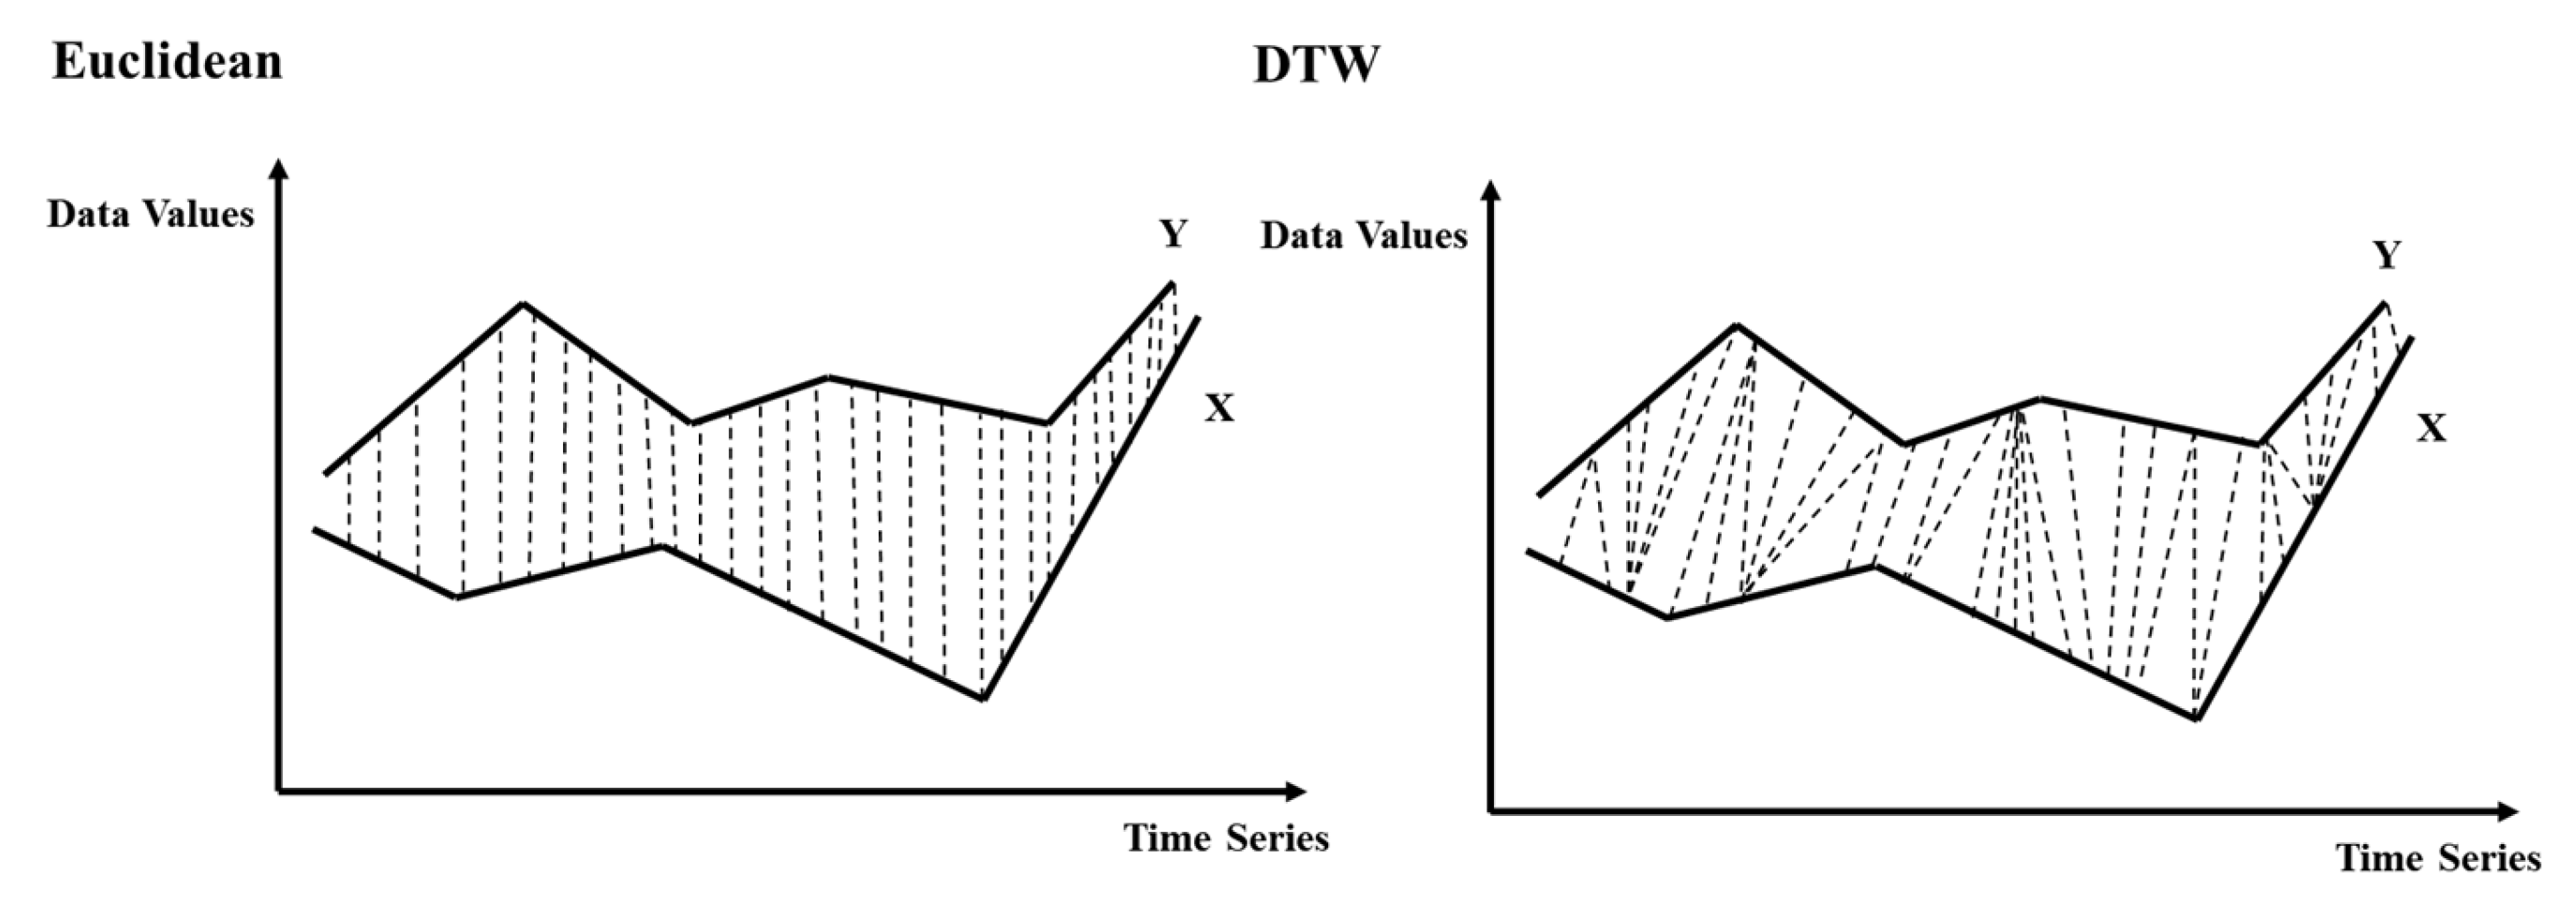
Figure 3.
The conceptualised hierarchical clustering with five individuals, A, B, C, D and E. The dendrogram of A, B, C, D, and E is formed with calculating the similarities and clustering five individuals by layers. [40].
Figure 3.
The conceptualised hierarchical clustering with five individuals, A, B, C, D and E. The dendrogram of A, B, C, D, and E is formed with calculating the similarities and clustering five individuals by layers. [40].
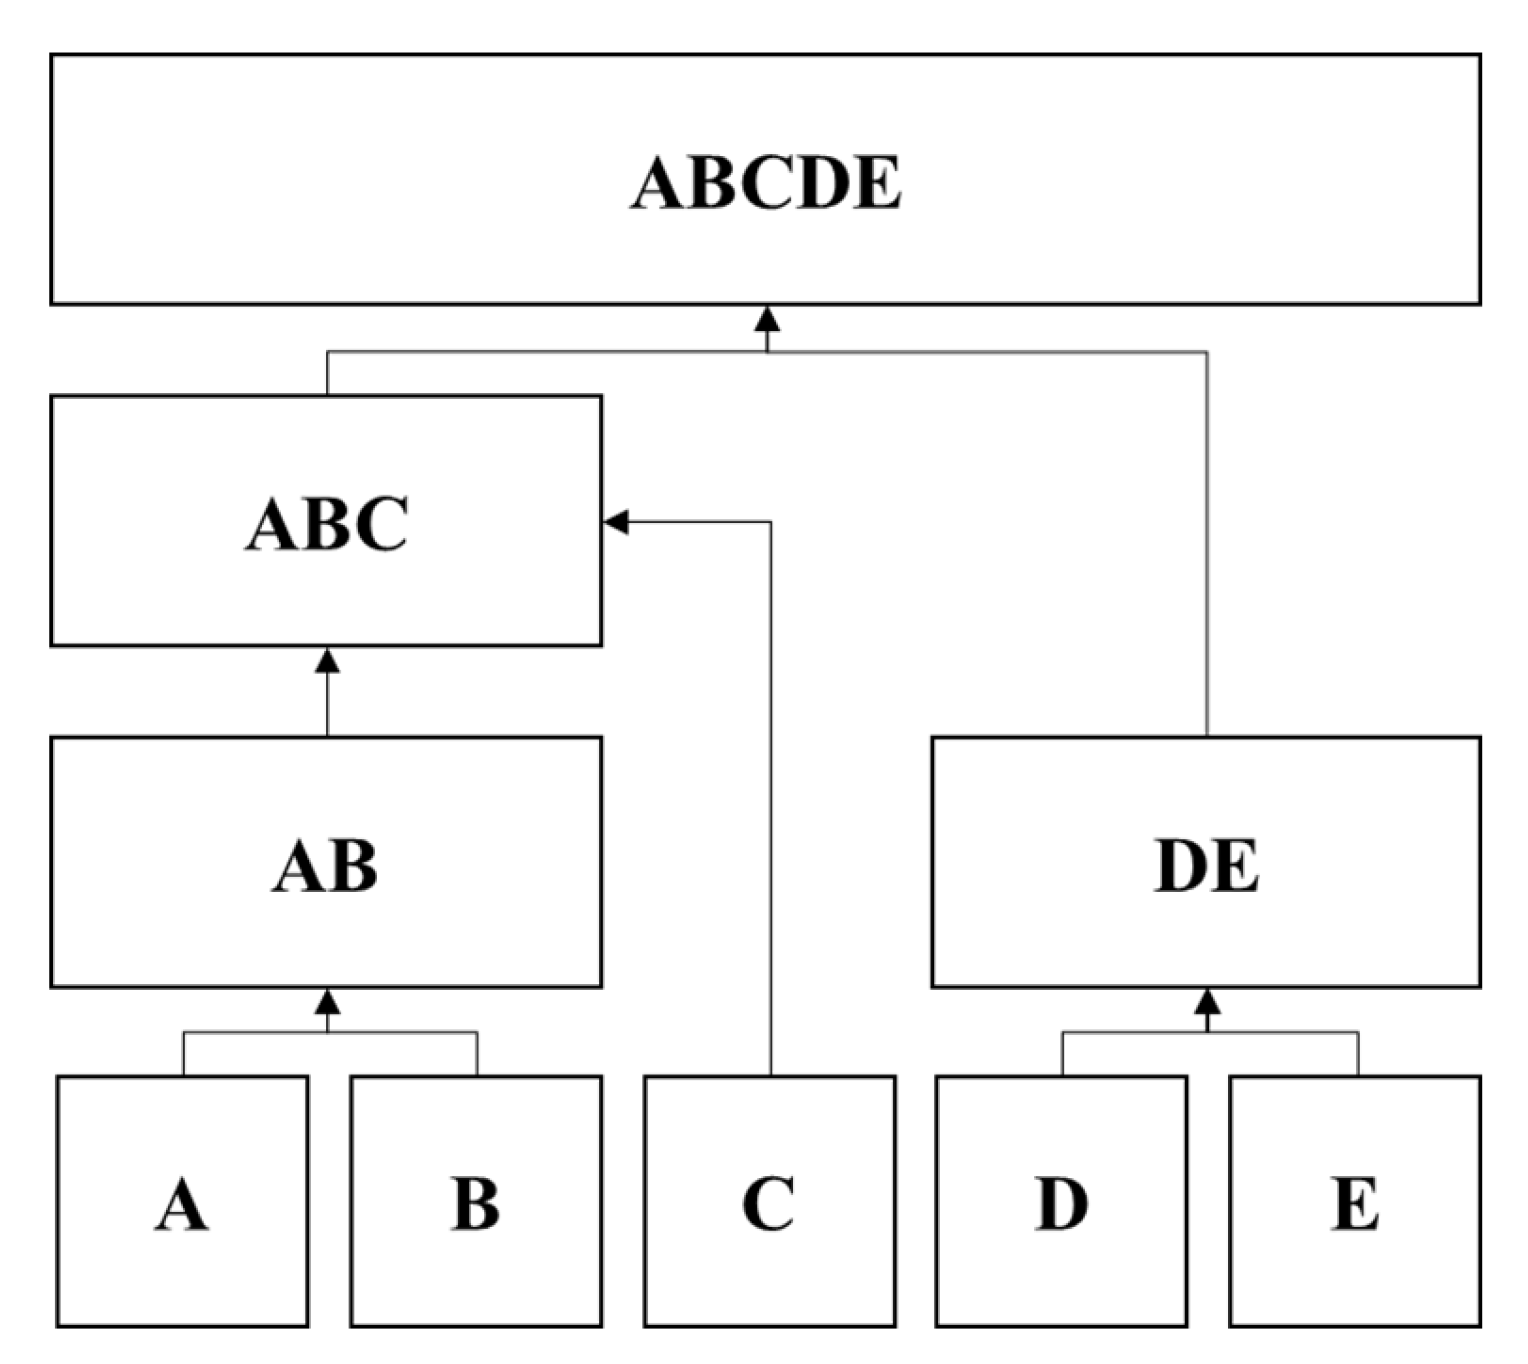
Figure 4.
The architecture of CNN.
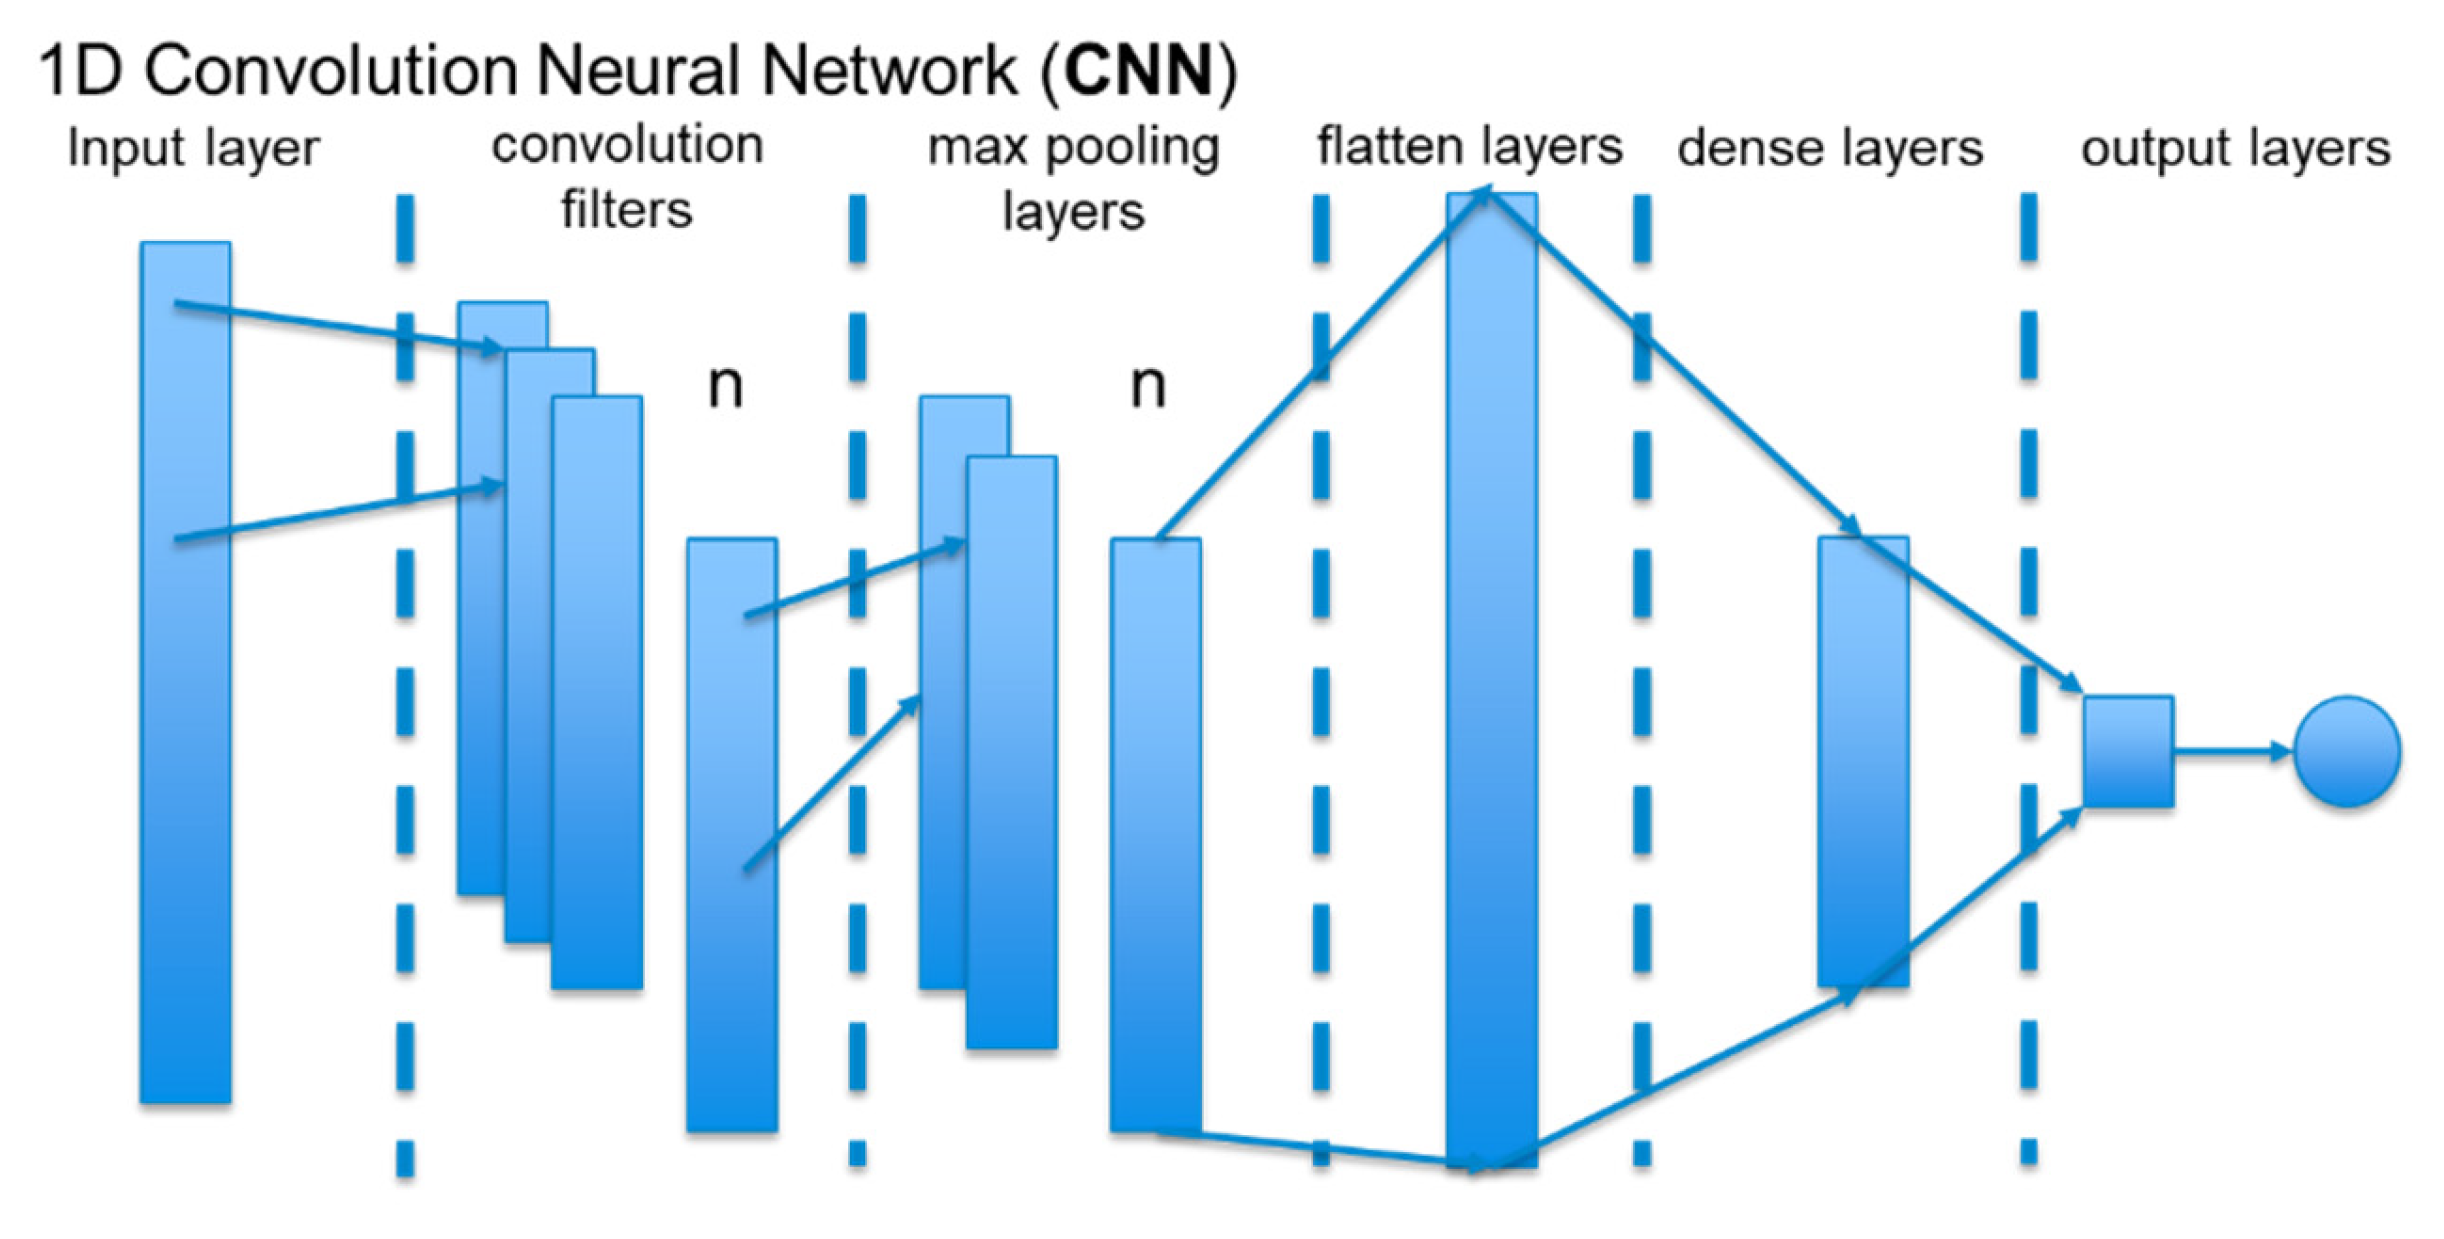
Figure 5.
The architecture of LSTM.
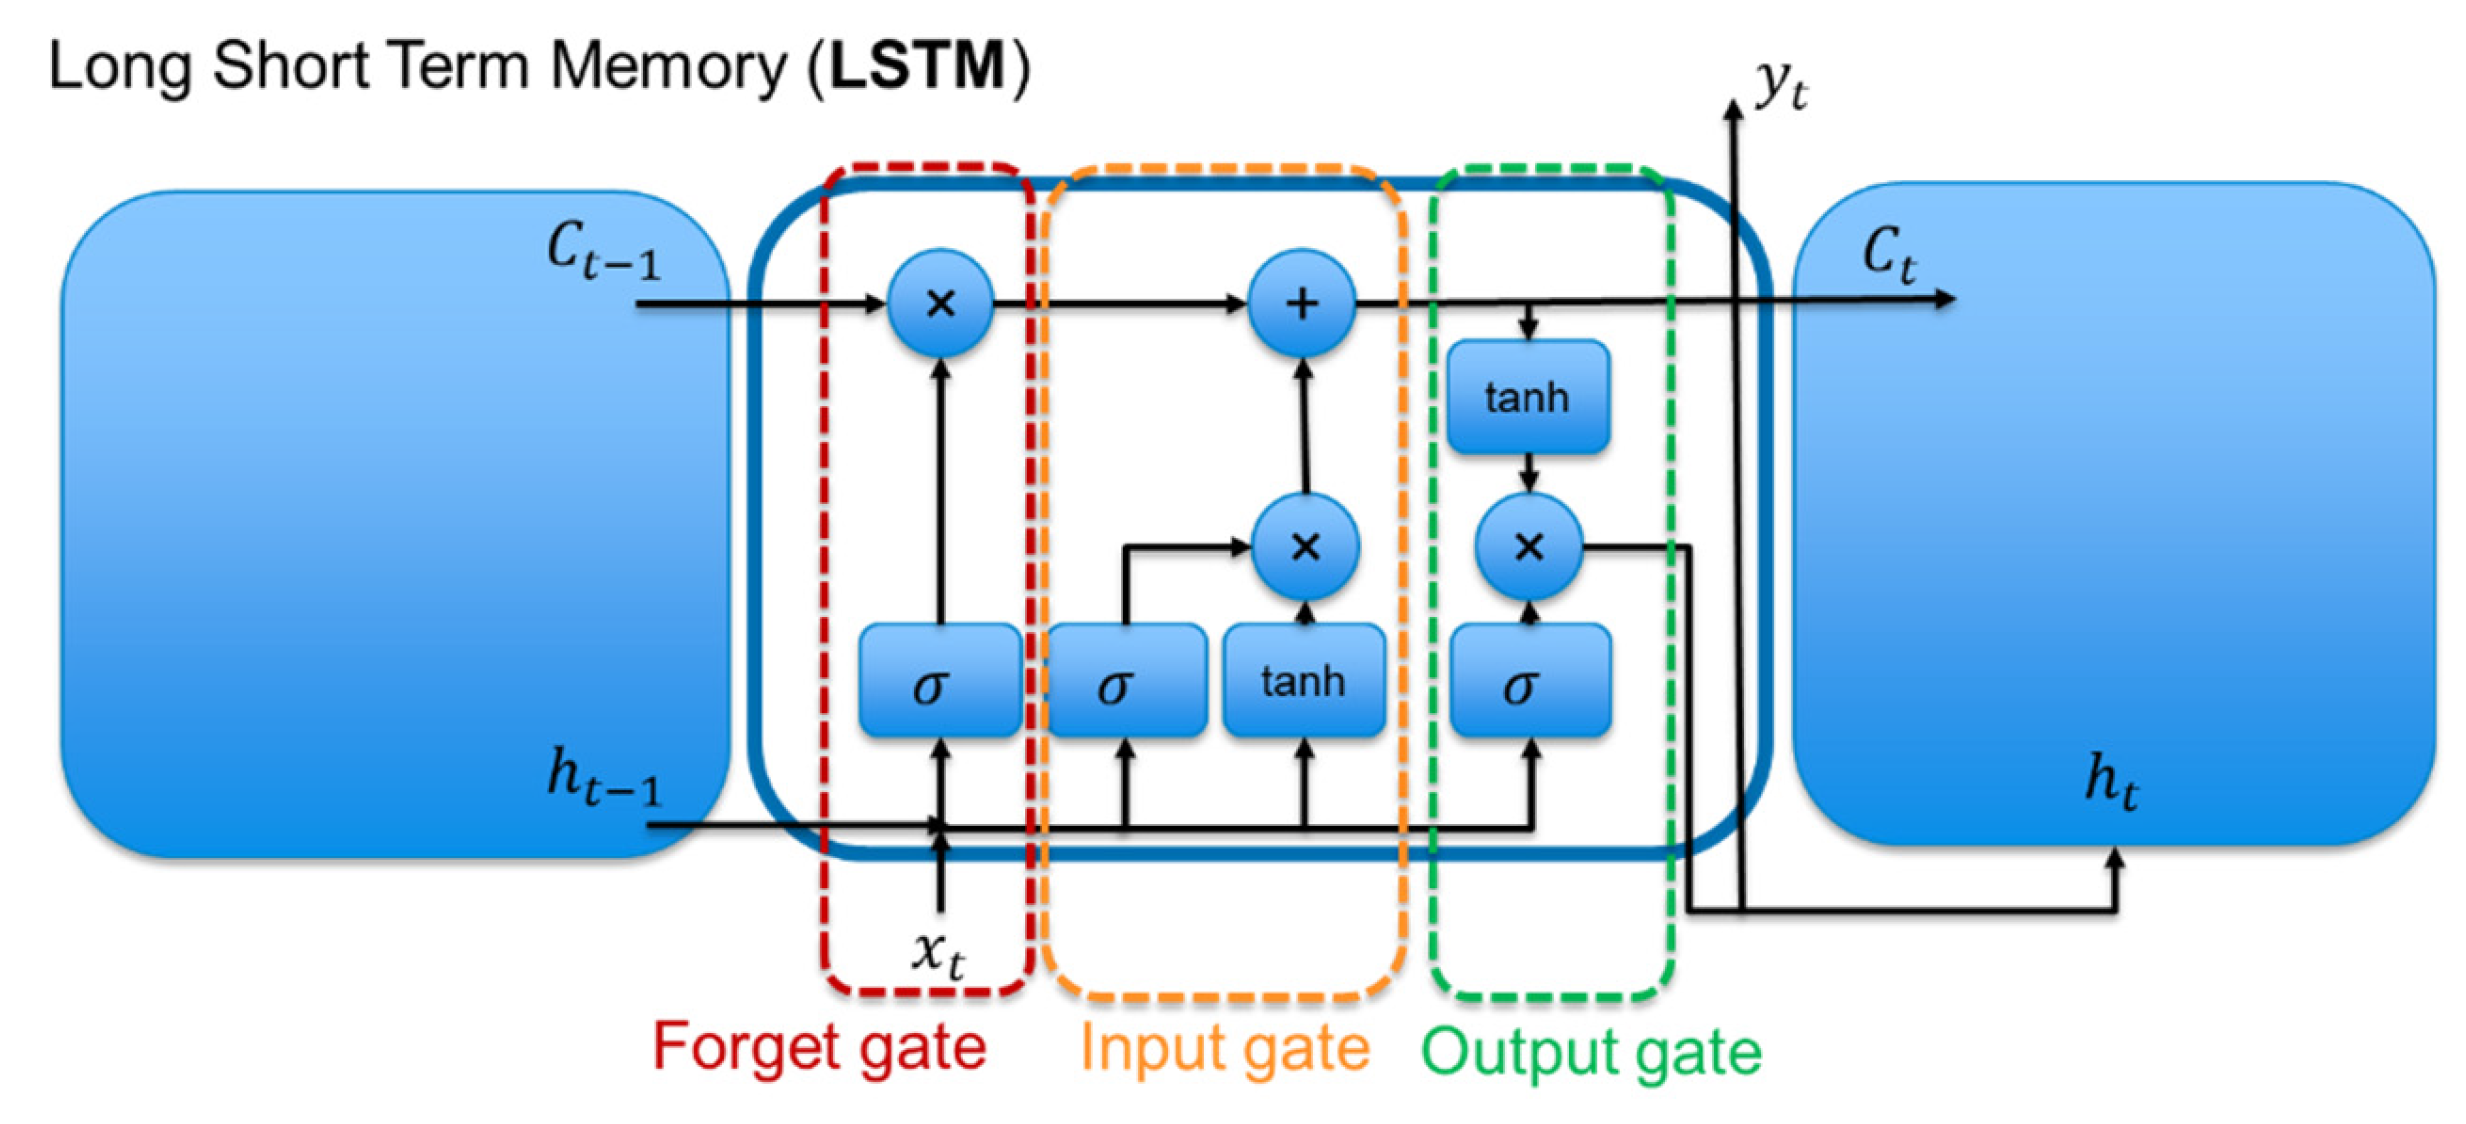
Figure 6.
Winter food crop maps. (a) The location of the selected study area of this research in Norfolk, UK. The map presents the scale of the study and the legend of winter barley, winter wheat, winter rapeseed and spring barley. Winter food crop maps of the selected study are in North Norfolk, UK, (b) 2018, (c) 2019, (d) 2020, (e) 2021 (f) 2022 (g) 2023.
Figure 6.
Winter food crop maps. (a) The location of the selected study area of this research in Norfolk, UK. The map presents the scale of the study and the legend of winter barley, winter wheat, winter rapeseed and spring barley. Winter food crop maps of the selected study are in North Norfolk, UK, (b) 2018, (c) 2019, (d) 2020, (e) 2021 (f) 2022 (g) 2023.

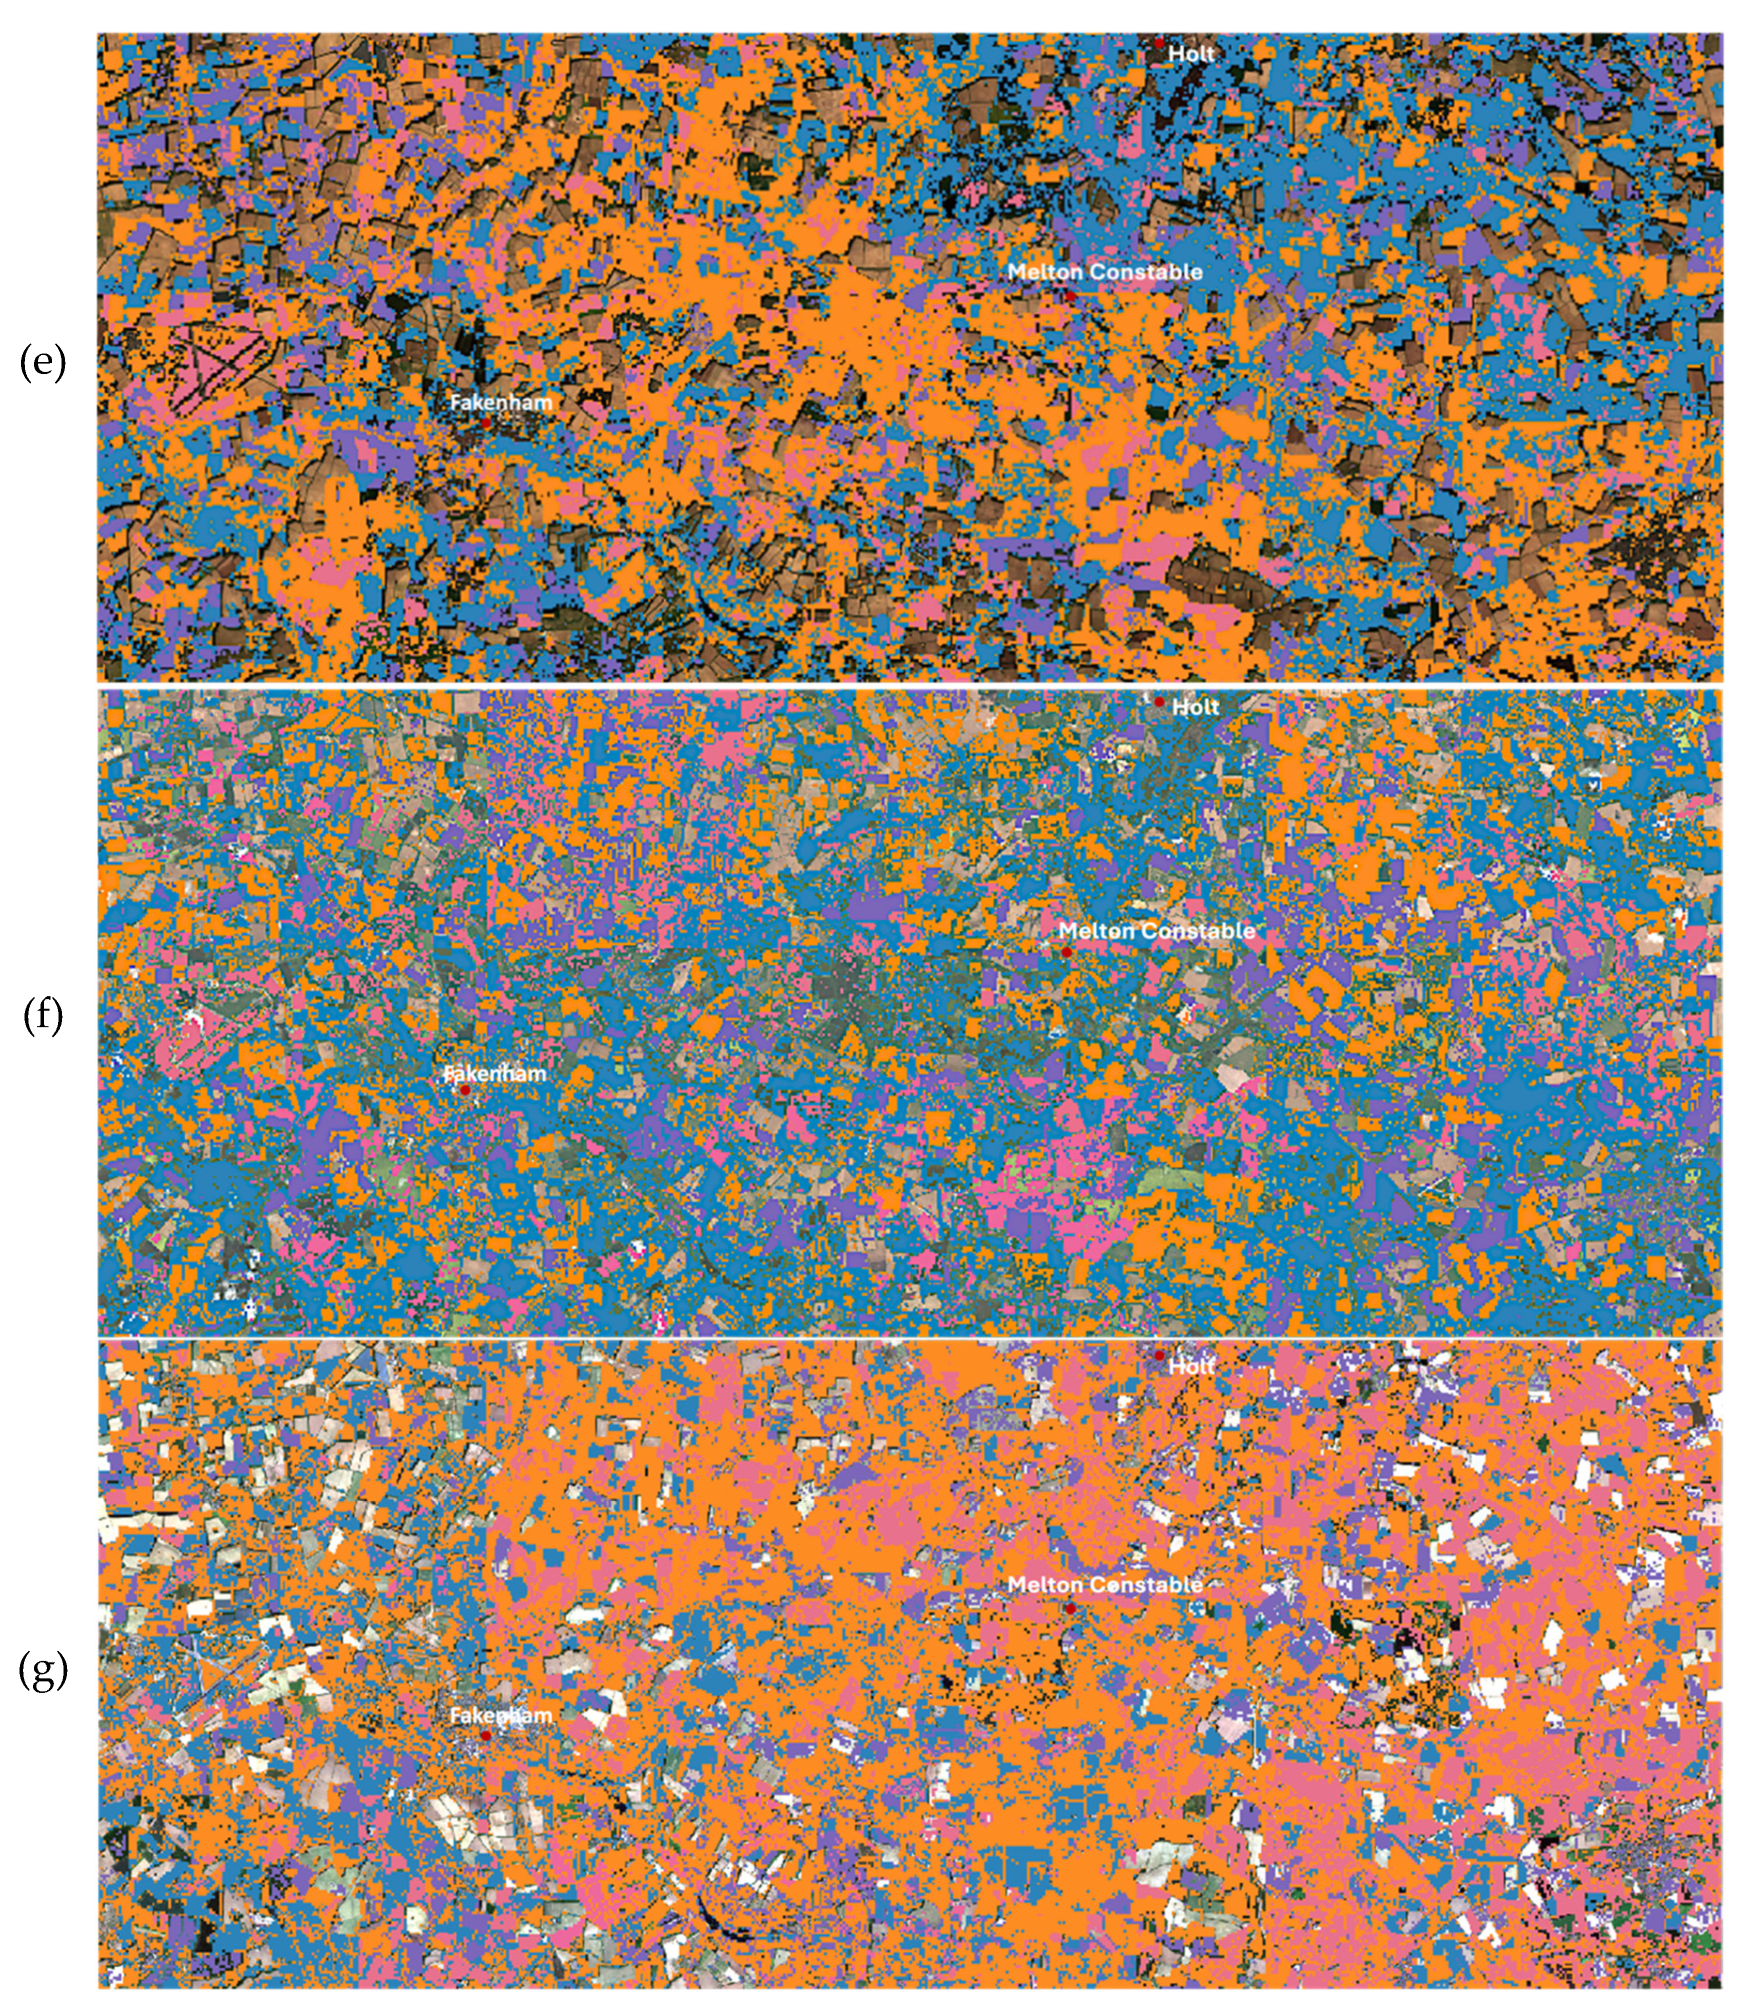
Figure 7.
The meteorological data (dark blue), including minimum and maximum temperature, rainfall and sun hours, and the yield of winter barley (orange) from 2018 to 2023 with annual (A) and seasonal (B) analysis.
Figure 7.
The meteorological data (dark blue), including minimum and maximum temperature, rainfall and sun hours, and the yield of winter barley (orange) from 2018 to 2023 with annual (A) and seasonal (B) analysis.
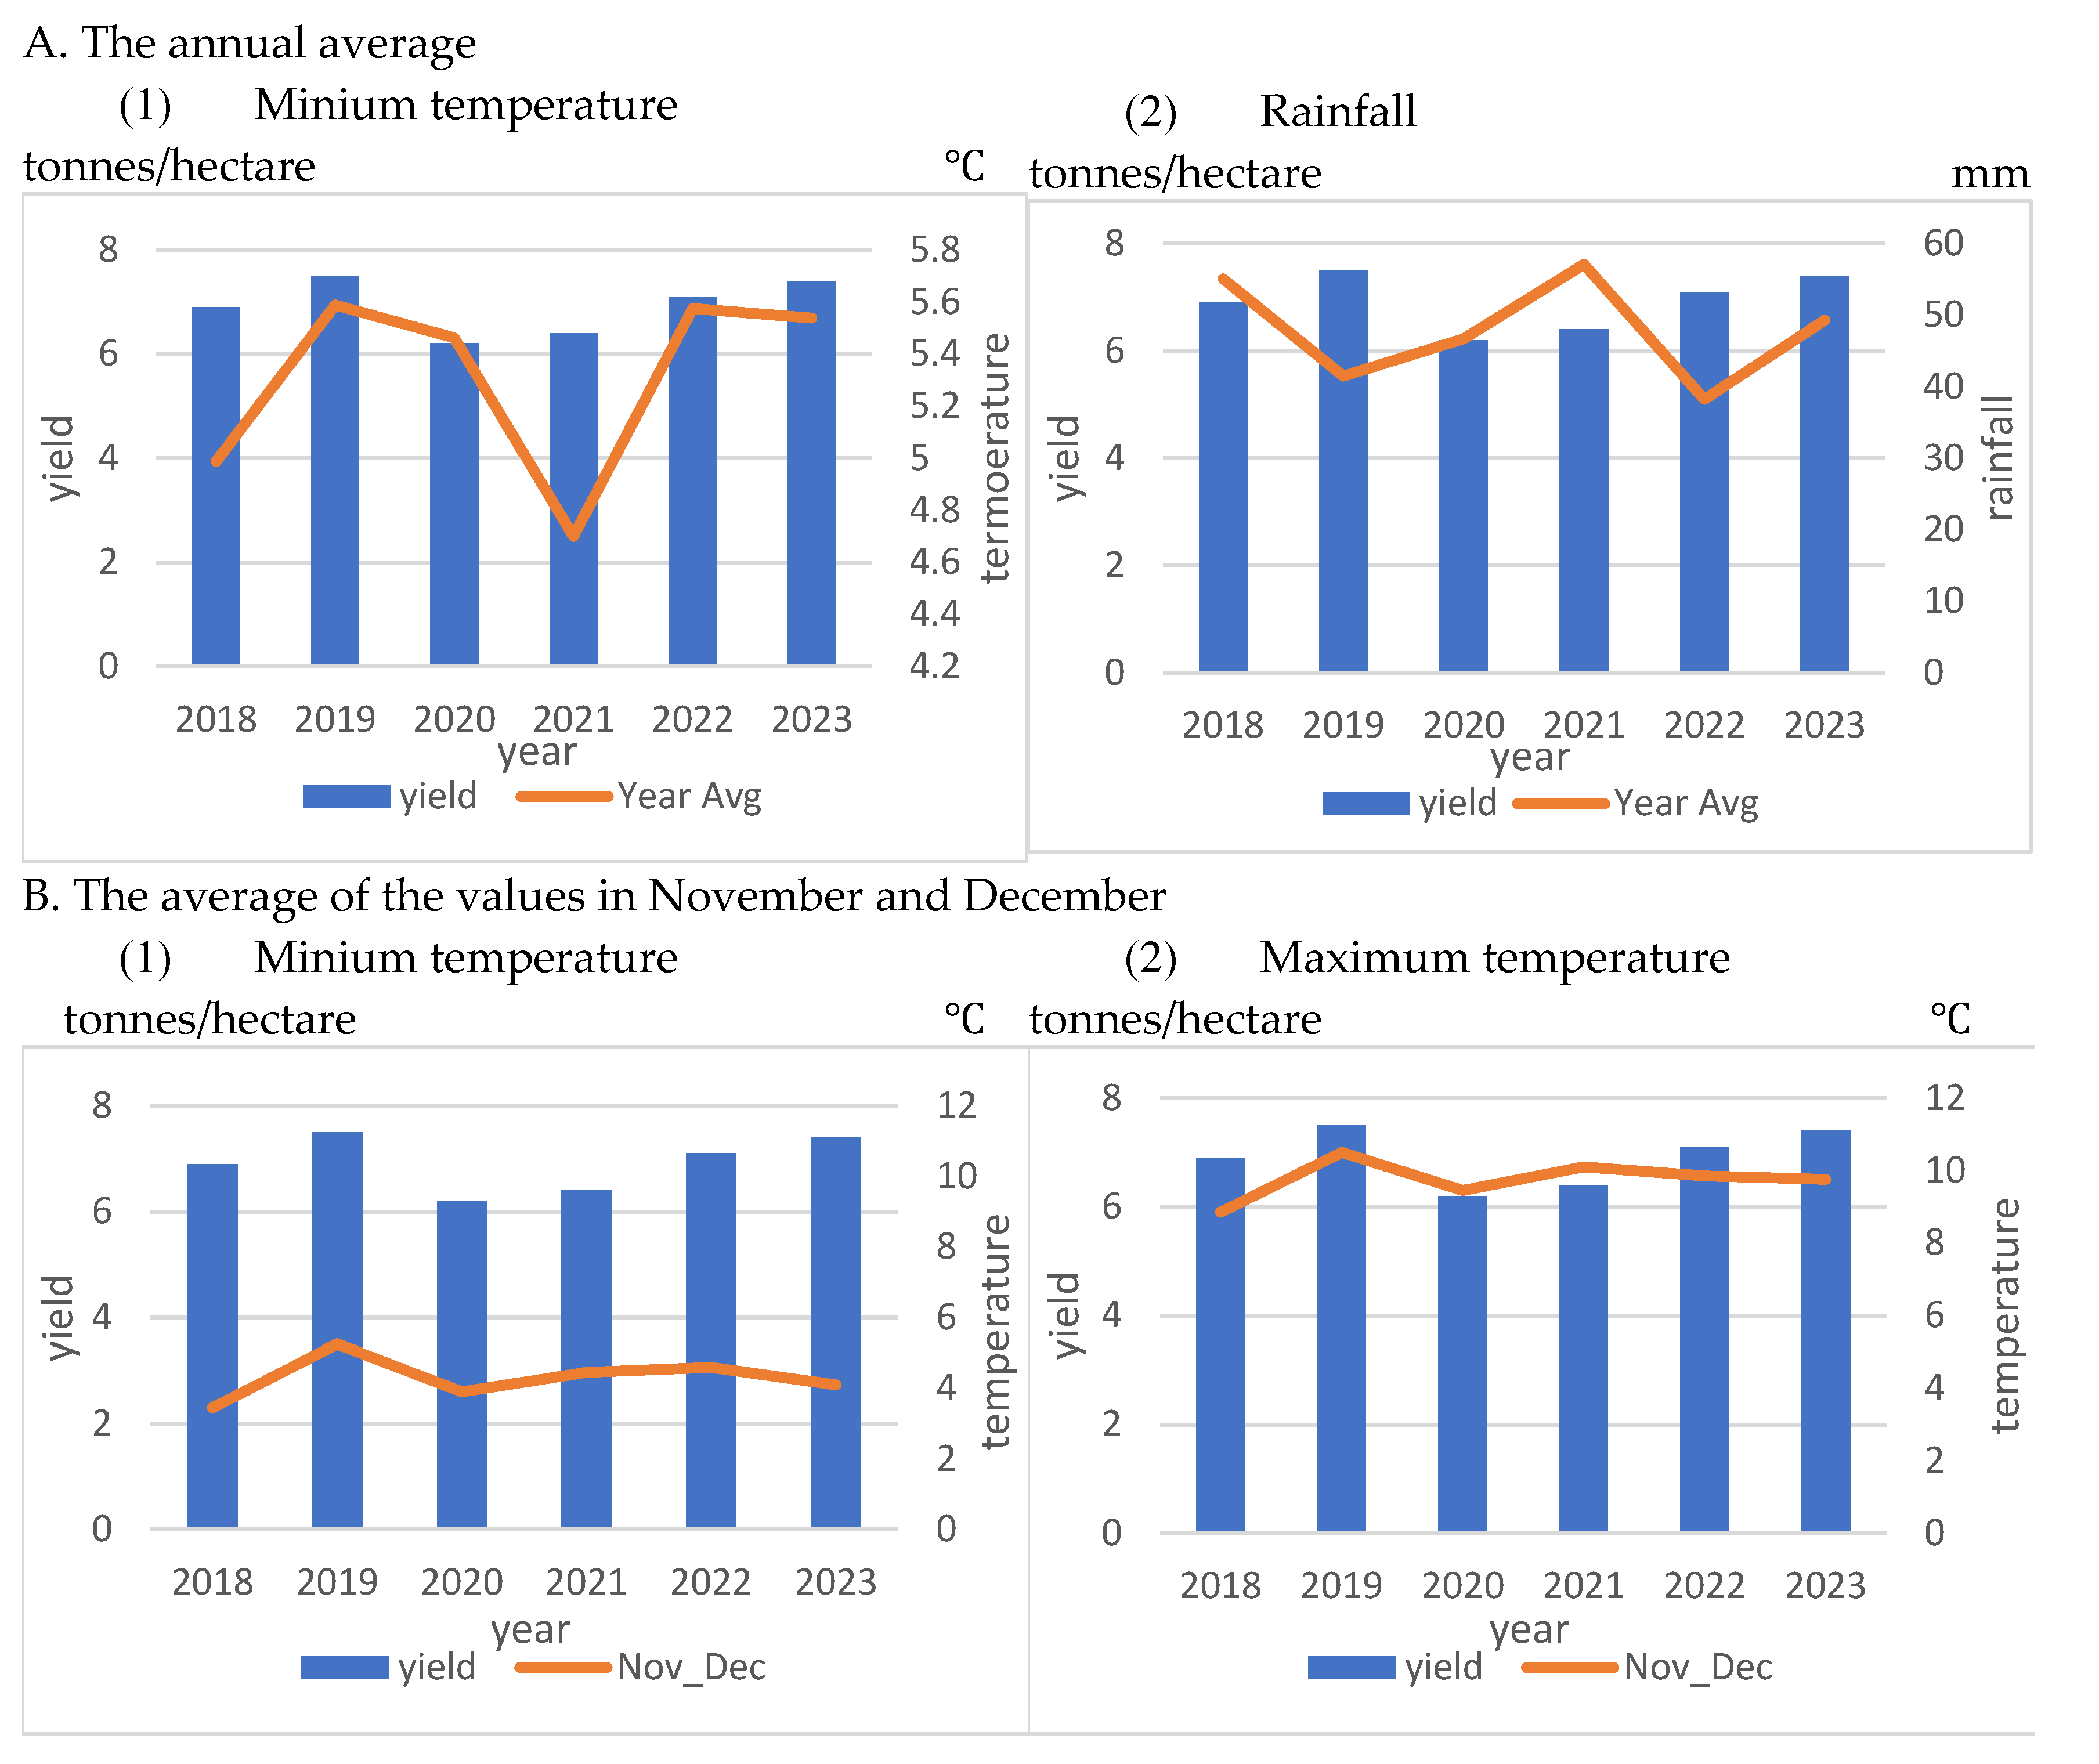
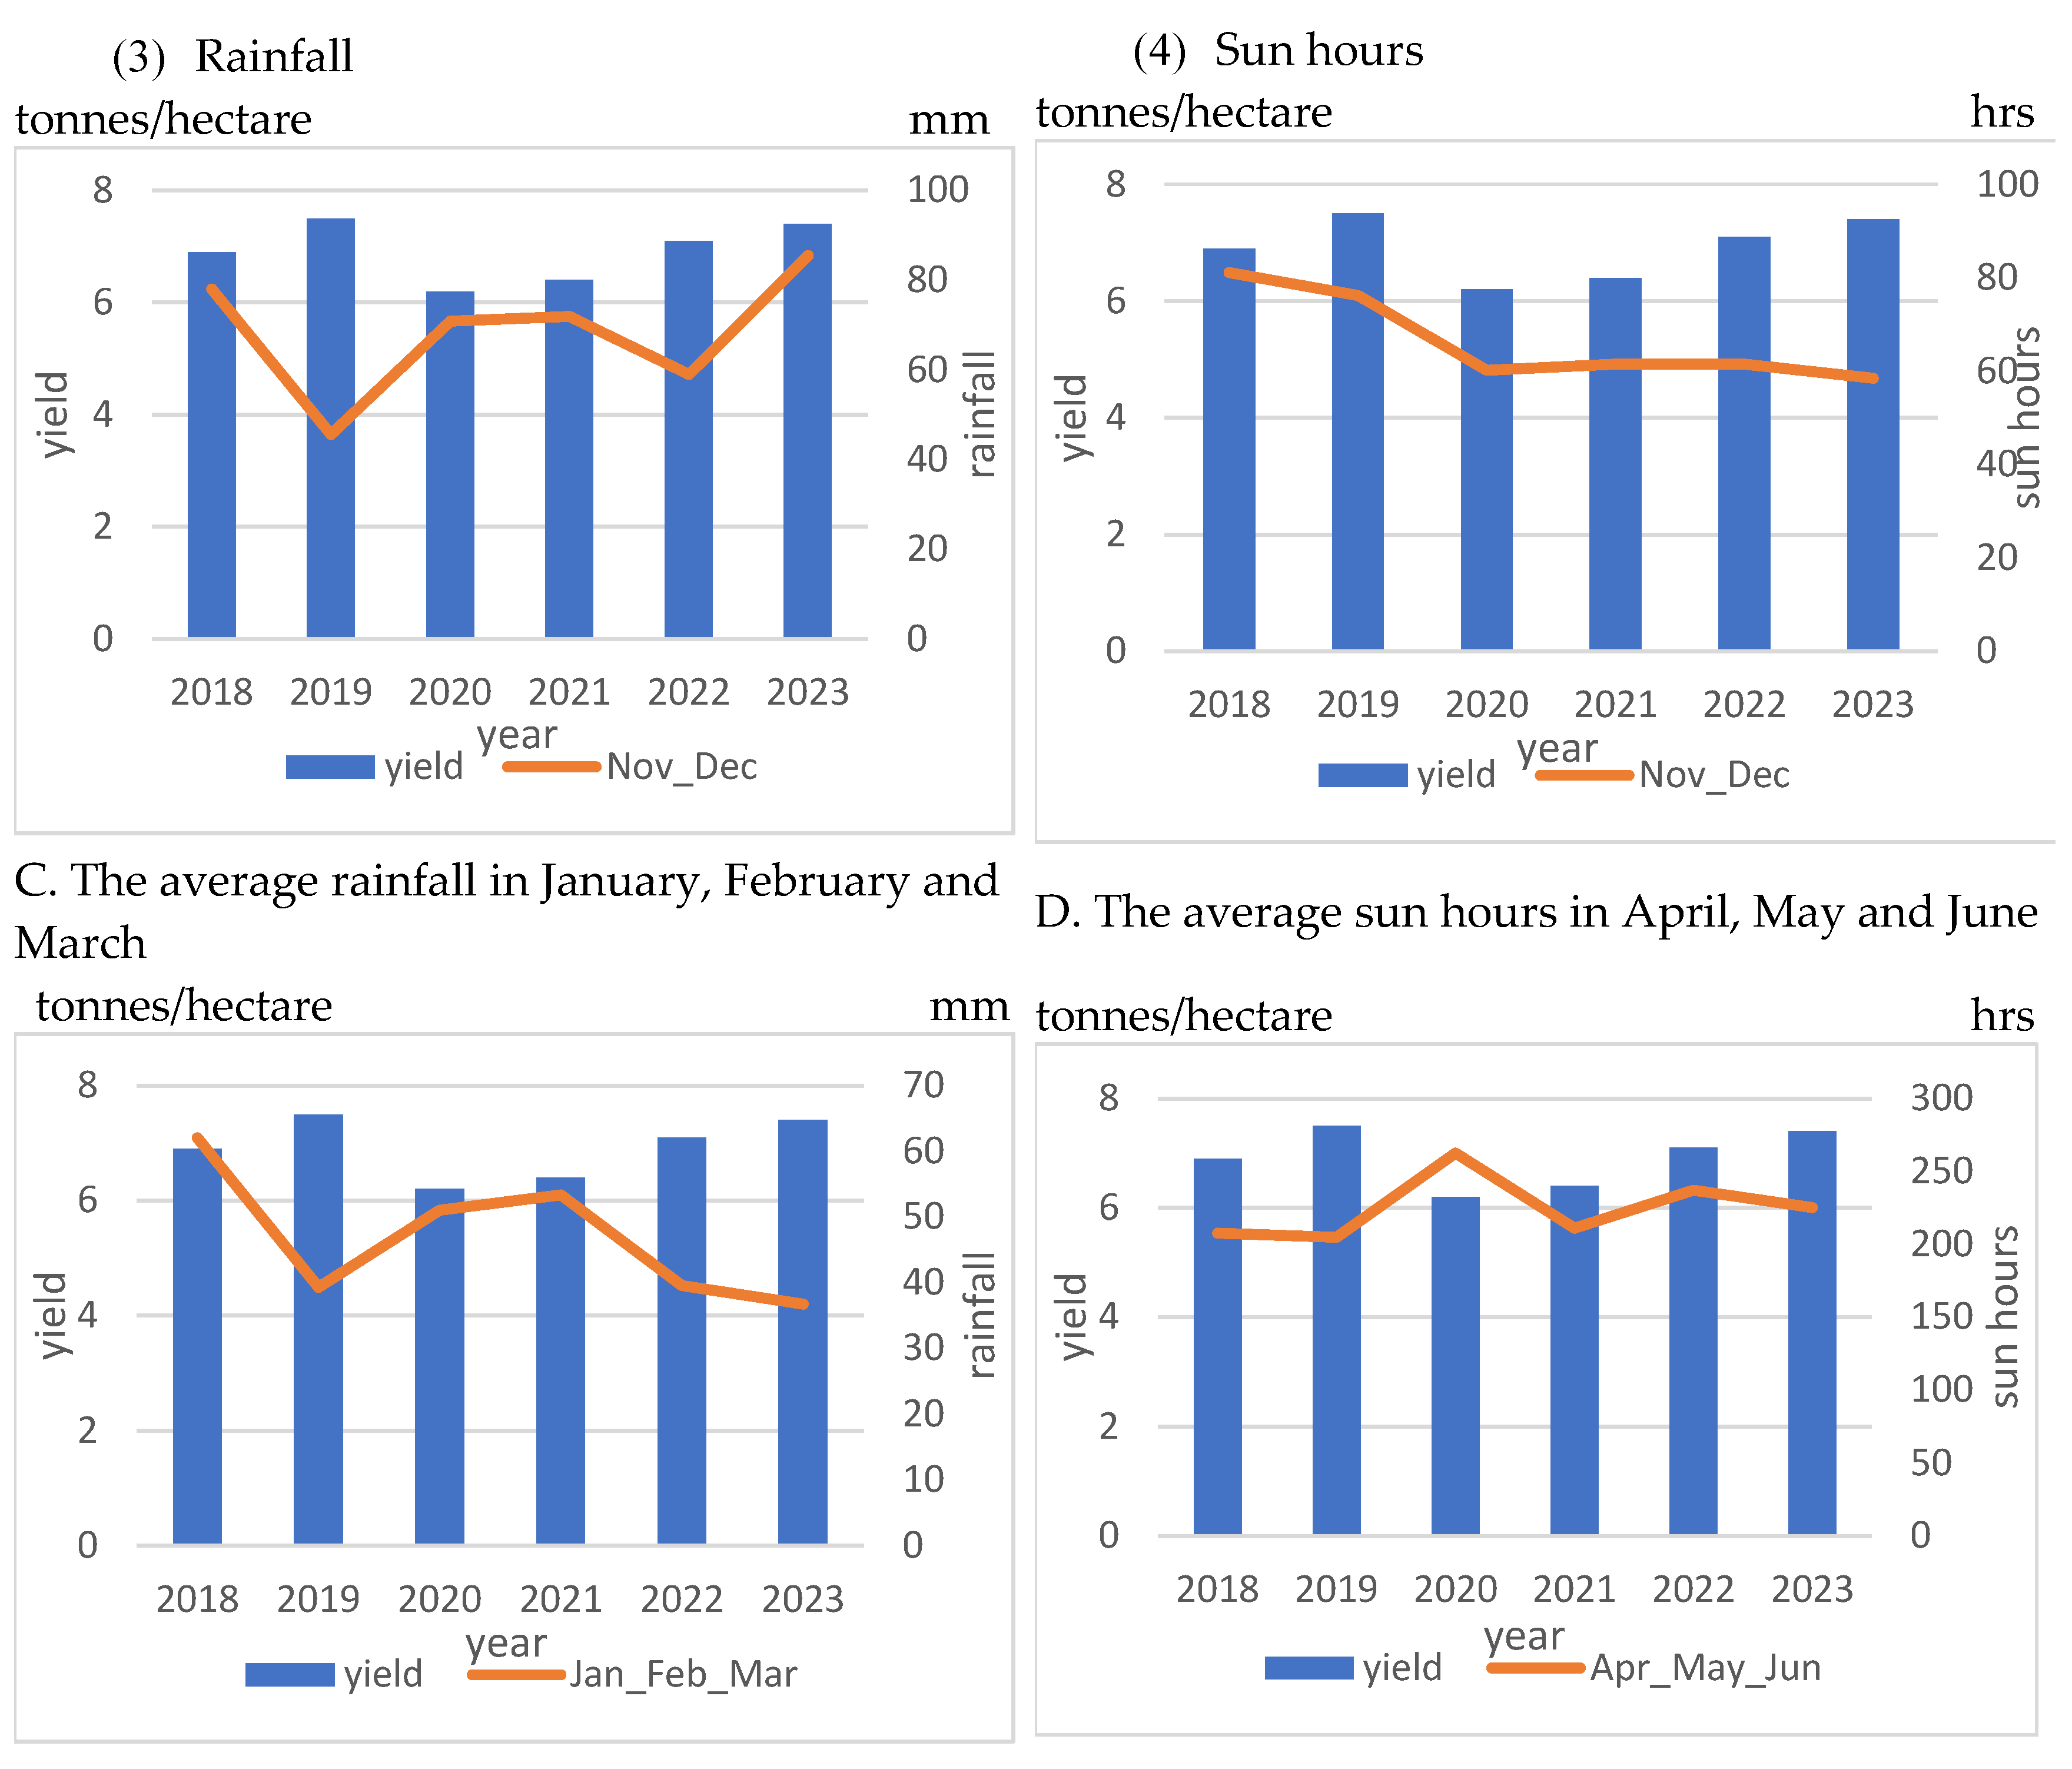
Table 2.
The evaluation of three models, CNN, LSTM, and CNN-LSTM with three sets of input parameters.
Table 2.
The evaluation of three models, CNN, LSTM, and CNN-LSTM with three sets of input parameters.
| CNN | LSTM | CNN-LSTM | ||
| NDVI+SAVI+EVI+NDMI | MSE | 0.15654 | 0.00132 | 0.00503 |
| MAE | 0.39565 | 0.03267 | 0.07083 | |
| NDVI | MSE | 0.498 | 0.00088 | 0.00596 |
| MAE | 0.70569 | 0.02825 | 0.07722 | |
| SAVI | MSE | 0.69752 | 0.00021 | 0.00125 |
| MAE | 0.85173 | 0.01363 | 0.01109 |
MSE: Mean Squared Errors. MAE: Mean Absolute Errors. Unit: tonnes/hectare.
Table 3.
The average values of spectral indices from 2018 to 2023 and the correlation with the yield of winter barley.
Table 3.
The average values of spectral indices from 2018 to 2023 and the correlation with the yield of winter barley.
| NDVI | SAVI | EVI | NDMI | |
| 2018 | 0.400 | 0.589 | 0.100 | 0.177 |
| 2019 | 0.368 | 0.538 | 0.118 | 0.152 |
| 2020 | 0.548 | 0.378 | 0.378 | 0.192 |
| 2021 | 0.480 | 0.365 | 0.119 | 0.196 |
| 2022 | 0.376 | 0.553 | 0.129 | 0.146 |
| 2023 | 0.423 | 0.621 | 0.092 | 0.201 |
| Correlation with yield | -0.871 | 0.854 | -0.684 | -0.477 |
Table 5.
The seasonal minimum and maximum temperatures, rainfall and sun hours and the correlation with the yield of winter barley.
Table 5.
The seasonal minimum and maximum temperatures, rainfall and sun hours and the correlation with the yield of winter barley.
| Minimum temperature () | Maximum temperature () | Rainfall (mm) | Sun hours (hrs) | |
| 2018 | 4.99 | 11.11 | 55.03 | 129.80 |
| 2019 | 5.59 | 12.15 | 41.46 | 138.40 |
| 2020 | 5.46 | 12.41 | 46.70 | 155.40 |
| 2021 | 4.70 | 10.84 | 57.09 | 125.99 |
| 2022 | 5.58 | 12.44 | 38.24 | 156.00 |
| 2023 | 5.54 | 11.94 | 49.30 | 135.54 |
| Correlation with yield | 0.54 | 0.26 | -0.46 | -0.11 |
Table 6.
The seasonal minimum and maximum temperatures, rain fall and sun hours and the correlation with the yield of winter barley.
Table 6.
The seasonal minimum and maximum temperatures, rain fall and sun hours and the correlation with the yield of winter barley.
| Nov Dec | Jan Feb Mar | Apr May Jun | Nov Dec | Jan Feb Mar | Apr May Jun | |
| Minimum temperature () | Rainfall (mm) | |||||
| 2018 | 3.45 | 1.93 | 9.07 | 78.00 | 62.03 | 32.70 |
| 2019 | 5.25 | 3.17 | 8.23 | 45.60 | 39.27 | 40.90 |
| 2020 | 3.90 | 3.77 | 8.20 | 70.85 | 51.00 | 26.30 |
| 2021 | 4.45 | 2.37 | 7.20 | 71.90 | 53.37 | 50.93 |
| 2022 | 4.60 | 3.37 | 8.43 | 58.95 | 39.53 | 23.13 |
| 2023 | 4.10 | 3.23 | 8.80 | 85.95 | 36.70 | 37.80 |
| Correlation with yield | 0.45 | -0.04 | 0.50 | -0.28 | -0.65 | 0.03 |
| Maximum temperature () | Sun hours (hrs) | |||||
| 2018 | 8.85 | 7.30 | 16.43 | 81.10 | 84.47 | 207.60 |
| 2019 | 10.50 | 9.70 | 15.70 | 76.20 | 113.47 | 204.80 |
| 2020 | 9.45 | 9.80 | 17.00 | 60.15 | 111.67 | 262.63 |
| 2021 | 10.10 | 7.93 | 14.23 | 61.45 | 84.00 | 211.00 |
| 2022 | 9.85 | 9.80 | 16.80 | 61.45 | 137.87 | 237.17 |
| 2023 | 9.75 | 9.53 | 15.80 | 58.45 | 97.30 | 225.17 |
| Correlation with yield | 0.34 | 0.28 | 0.024 | 0.31 | 0.25 | -0.49 |
Disclaimer/Publisher’s Note: The statements, opinions and data contained in all publications are solely those of the individual author(s) and contributor(s) and not of MDPI and/or the editor(s). MDPI and/or the editor(s) disclaim responsibility for any injury to people or property resulting from any ideas, methods, instructions or products referred to in the content. |
© 2025 by the authors. Licensee MDPI, Basel, Switzerland. This article is an open access article distributed under the terms and conditions of the Creative Commons Attribution (CC BY) license (http://creativecommons.org/licenses/by/4.0/).
Copyright: This open access article is published under a Creative Commons CC BY 4.0 license, which permit the free download, distribution, and reuse, provided that the author and preprint are cited in any reuse.


