Submitted:
12 September 2025
Posted:
15 September 2025
You are already at the latest version
Abstract
Palantir Technologies has been widely criticized in the financial press as dangerously overvalued, with a price-to-earnings ratio exceeding 500. Conventional wisdom — what might be called the perceived Wall Street brain — interprets such valuations as irrational exuberance, relying on static measures such as P/E, PEG, or Earnings Yield. Yet these measures ignore the dynamic interplay of growth, risk, and time. This article uses Palantir as a case study to introduce the Potential Payback Period (PPP) framework and its derived return metrics: Stock Internal Rate of Return (SIRR), Stock Price Appreciation Rate of Return (SPARR), and Stock Internal Rate of Return Including Price Appreciation (SIRRIPA). Under a cautious and internally consistent hypothesis — one that assumes declining earnings growth and rules out inflated exit multiples — these metrics reveal why Palantir’s valuation is not a bubble but an expression of hidden market rationality. Most importantly, SIRRIPA plays for stocks the same role that Yield to Maturity (YTM) plays for bonds: it condenses a complex stream of earnings and terminal price appreciation into a single, risk-adjusted annual return. Viewed this way, Palantir’s SIRRIPA—close to 6% in early September—exceeds the 10-year U.S. Treasury yield (slightly above 4%), demonstrating that even astronomical P/Es can produce rational, bond-comparable returns. The same logic applies well beyond Palantir — including at the index level — explaining why the S&P 500’s elevated valuations are consistent with market rationality rather than speculative excess.
Keywords:
Palantir Technologies
; high P/E ratios
; Potential Payback Period (PPP)
; Stock Internal Rate of Return (SIRR)
; Stock Price Appreciation Rate of Return (SPARR)
; Stock Internal Rate of Return Including Price Appreciation (SIRRIPA)
Palantir Technologies has long been viewed as an enigma on Wall Street, trading at multiples that appear detached from financial reality. Yet beneath these seemingly irrational valuations lies a coherent internal logic—one that conventional metrics like the P/E ratio or PEG often fail to capture. This article uses Palantir as a case study to reveal the hidden rationale behind such extreme valuations and to explore what they tell us about modern market dynamics.
1. Conventional Wisdom—The Perceived Wall Street Brain Against Palantir
Few companies have divided opinion on Wall Street as sharply as Palantir Technologies. Since its dramatic rise in 2023–2025, Palantir has carried a valuation that often exceeds 500 times earnings. To most commentators, this looks like the very definition of market folly.
The financial press has been almost unanimous in condemning Palantir as dangerously overpriced:
- The Economist branded it “perhaps the most overvalued firm of all time,” pointing to a market capitalization worth more than 600 times its profits.
- Bloomberg captured the bewilderment with its October 2024 headline: “Palantir Is a Rare Puzzle for the Wall Street Brain.” Analysts could not reconcile the stock’s surging price with traditional valuation metrics, and consensus targets implied sharp downside.
- Business Insider quoted short-seller Andrew Left of Citron Research, who called Palantir’s multiple “absurd” and warned that no company with such a valuation had avoided a 50% collapse.
- Barron’s analysts went further, calling the stock “egregiously rich,” noting its enterprise value at nearly 18× forward revenues, triple that of peers.
- Quartz and Investopedia ran similar stories, emphasizing that Palantir would need to sustain >40% annual revenue growth for years to justify its valuation—an outcome conventional models dismissed as impossible.
This near-uniform narrative—what might be called the perceived Wall Street brain—treats the static P/E ratio as the ultimate arbiter of value. In this worldview, Palantir’s astronomical multiple can only mean one thing: a bubble waiting to burst.
2. SIRRIPA—Rationalizing the Astronomical P/E
The problem with this conventional wisdom is not arithmetic but perspective. The P/E ratio is static: it assumes that returns to shareholders come only from today’s earnings power. At extreme P/E levels, the intrinsic return implied by this measure—what the Potential Payback Period (PPP) framework calls Stock Internal Rate of Return (SIRR)—collapses toward zero. Palantir, by that standard, should be untouchable.
But markets have not behaved irrationally. They have been implicitly pricing in a second source of return that traditional ratios ignore. This is revealed by PPP and its derived measures—SIRR, Stock Price Appreciation Rate of Return (SPARR), and ultimately Stock Internal Rate of Return Including Price Appreciation (SIRRIPA).
2.1. Step 1. PPP—Potential Payback Period
PPP generalizes the P/E ratio by incorporating both growth (g) and discounting (r):
It answers: How many years of discounted, growing earnings does it take to repay the share price?
When g = 0 and r = 0, PPP reduces exactly to the P/E ratio—showing that PPP is not a replacement but an extension of P/E into a dynamic world of growth and discounting.
2.2. Step 2. SIRR—Stock Internal Rate of Return
At the end of the PPP horizon, when the accumulated EPS have recouped the share price, investors have effectively ‘doubled’ their investment value through earnings alone.
That doubling converts to an annualized return:
Meaning: SIRR is the return from earnings power alone. At high P/Es, PPP stretches far into the future, and SIRR becomes modest.
2.3. Step 3. SPARR—Stock Price Appreciation Rate of Return
To capture terminal value, PPP assumes a realistic and cautious hypothesis:
- Exit P/E = PPP—avoiding the common but arbitrary practice of assigning inflated terminal multiples. This equality reflects internal consistency, since it is embedded in the model in the case where g = r.
-
Earnings growth declines over time—the growth rate is not held constant at its initial high level but gradually converges toward a sustainable long-term rate (e.g., the risk-free rate).
- Exit EPS = Eend = E0 (1 + gavg)PPP, where gavg is the declining-average growth rate.
- Exit Price = Eend × PPP.
Discount the Exit Price back PPP years and convert to a per-year rate:
Meaning: SPARR is the annualized return from price appreciation alone. By assuming both a linearly declining growth trajectory and a conservative exit multiple, SPARR reflects not optimism but disciplined prudence.
2.4. Step 4. SIRRIPA—Stock Internal Rate of Return Including Price Appreciation
Finally, combine both legs—earnings and terminal price—into one unified measure. Since SIRR already represents the annualized return from discounted earnings, and SPARR represents the annualized return from terminal price appreciation, SIRRIPA integrates them:
Meaning: SIRRIPA is the complete, risk-adjusted internal rate of return. It integrates both SIRR (earnings power) and SPARR (terminal price appreciation) into one coherent metric, directly comparable to a bond’s yield to maturity.
Importantly, under this cautious framework, a stock is not overvalued as long as its SIRRIPA stands above the risk-free rate, commonly represented by the 10-year U.S. Treasury yield, currently slightly over 4%.
2.5. Step 5. Why SIRRIPA Can Be Compared to a Bond’s Yield to Maturity
A stock’s SIRRIPA is directly comparable to a bond’s Yield to Maturity (YTM) because the two share the same economic logic:
- A bond’s YTM annualizes the internal rate of return from its fixed coupon payments plus redemption at maturity, discounted back to the present.
- A stock’s SIRRIPA annualizes the internal rate of return from its stream of discounted earnings (SIRR) plus its terminal price at the end of the PPP horizon (SPARR), likewise discounted back to the present.
Both measures collapse different cash flow structures into a single, risk-adjusted, time-consistent return number. Just as YTM allows investors to compare bonds with different maturities and coupons, SIRRIPA allows investors to benchmark stocks—even those with astronomical P/Es—against the risk-free rate or bond yields.
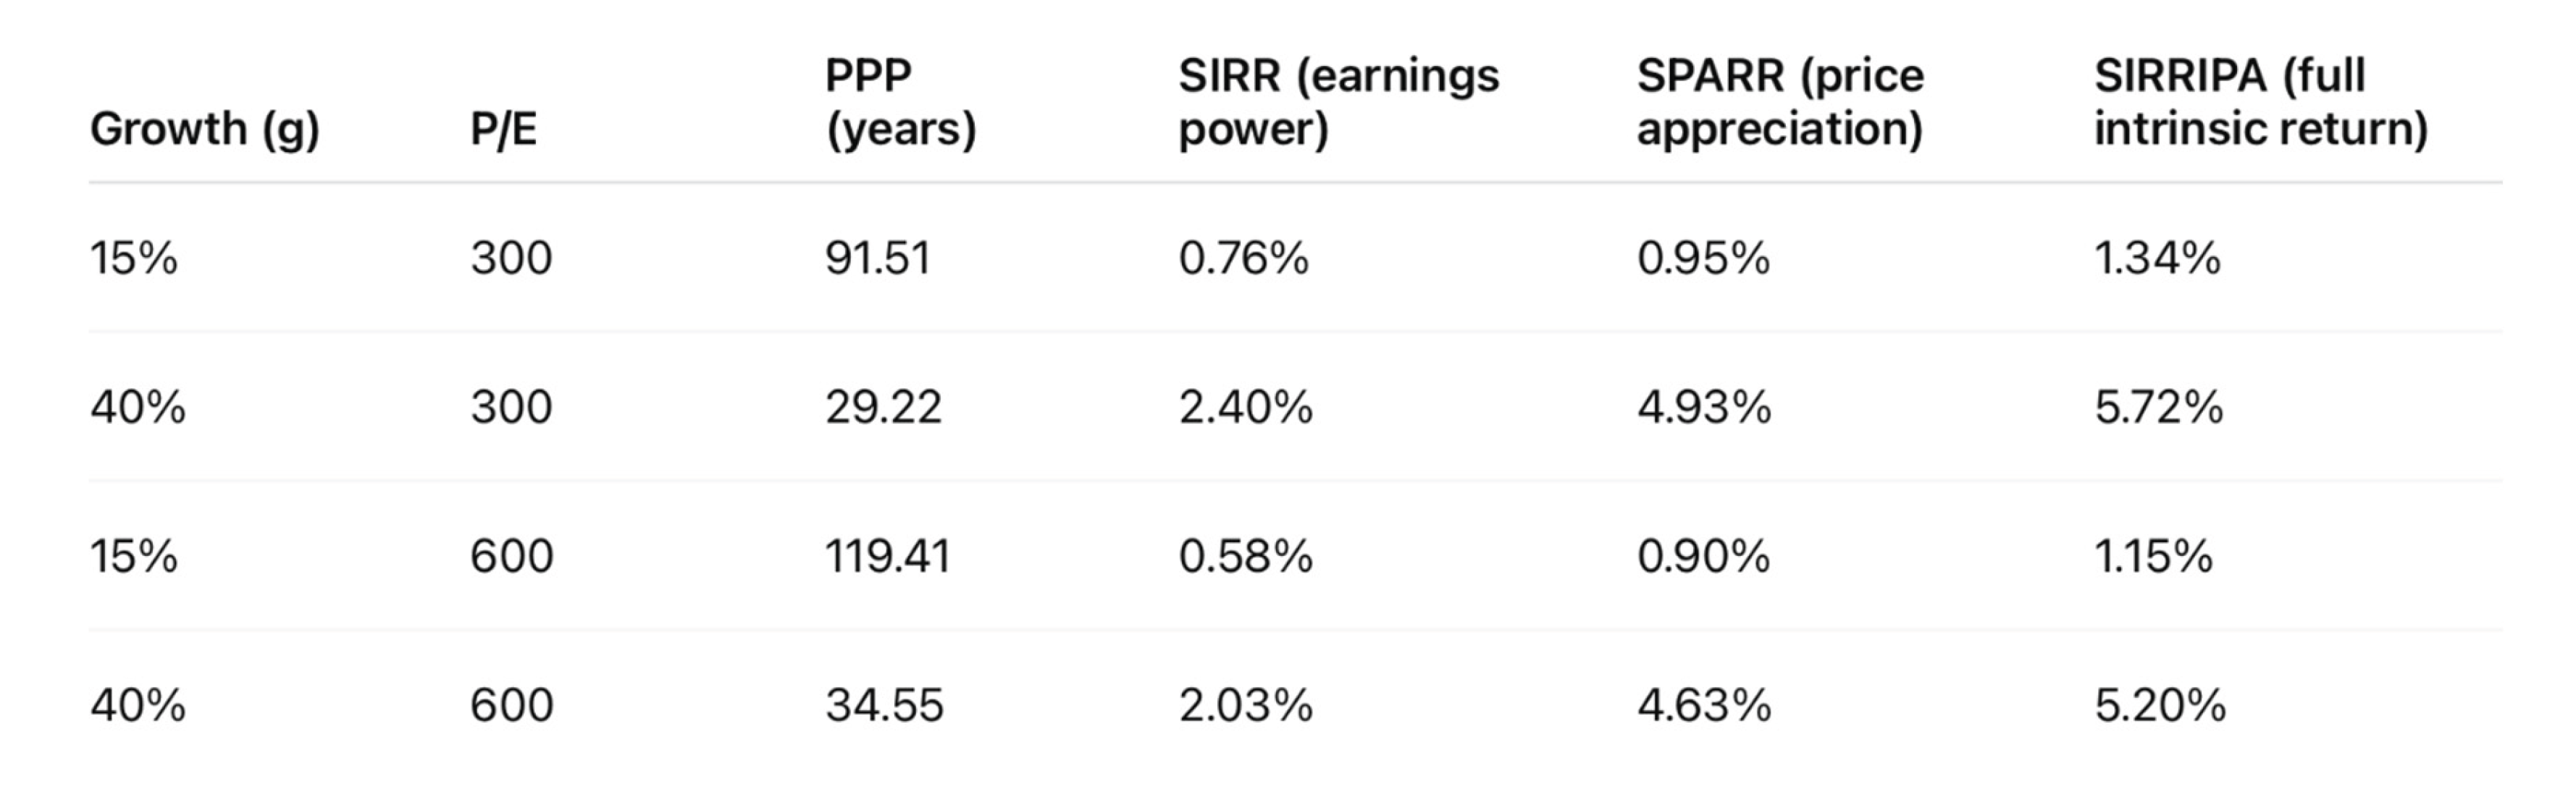
3. The Palantir Example
The Palantir case study makes this crystal clear:
- At P/E = 300 with 40% growth, SIRR is only 2.40%, but SPARR adds 4.93%, yielding a SIRRIPA of 5.72%.
- At P/E = 600 with the same growth, SIRR falls to 2.03%, yet SPARR still contributes 4.63%, keeping SIRRIPA at 5.20%.
Both outcomes stand above the 10-year U.S. Treasury yield (~4%), meaning Palantir is not overvalued when judged by SIRRIPA. This plateau effect shows that beyond a certain level, the P/E ratio has diminishing relevance, which explains why Palantir’s extreme multiples—whether 300 or 600—can still align with rational, bond-comparable returns.

Table 1.
Palantir: Numerical Decomposition.
4. Conclusions—From Conventional Wisdom to Hidden Market Rationality
Palantir’s valuation is not the irrational exuberance conventional wisdom claims. It is a reflection of growth, time, and risk-adjusted returns, captured in SIRRIPA.
Where the perceived Wall Street brain—shorthand for the consensus of the financial press and traditional analyst models—sees absurdity, SIRRIPA reveals a hidden rationality: the market correctly pricing a high-growth stock’s potential. The paradox of a company valued at hundreds of times earnings still offering an approximate 6% intrinsic return dissolves once SPARR is acknowledged as the missing leg.
Crucially, Palantir is not an isolated anomaly. Its case highlights a broader reality: SIRRIPA is the only rational explanation not only for Palantir’s astronomical P/E ratio, but also for the S&P 500’s present valuation. With index-level P/Es markedly above historical averages, the PEG ratio and Earnings Yield, which are derived from the P/E ratio and share its limitations, unsurprisingly signal persistent ‘overvaluation.’ Yet these static metrics are misleading for the same reason: they ignore growth-driven price appreciation.
The deeper reason SIRRIPA matters is its comparability. Just as a bond’s Yield to Maturity (YTM) condenses coupons and redemption into a single rate of return, a stock’s SIRRIPA condenses earnings and terminal price appreciation into one coherent, annualized return. This symmetry allows equities to be benchmarked directly against bonds.
SIRRIPA resolves the riddle. By integrating both earnings power (SIRR) and price appreciation (SPARR) into a single, risk-adjusted measure, it explains why equities can trade at sustained high multiples while still delivering bond-comparable yields. Under this lens, a stock—or an index—is not overvalued as long as its SIRRIPA exceeds the risk-free rate, commonly represented by the 10-year U.S. Treasury yield.
Palantir, far from being an irrational puzzle, is a proof of concept: when viewed through SIRRIPA, even extreme P/Es are not anomalies but evidence of hidden market rationality. The same framework applies to the S&P 500, showing that today’s valuations are less a bubble than a reflection of the deeper equilibrium between risk, growth, and time.
5. Takeaway
Conventional wisdom—the perceived Wall Street brain echoed in headlines from The Economist, Bloomberg, and Barron’s—condemns Palantir’s valuation as absurd. But static ratios like P/E, PEG, and Earnings Yield capture only half the story.
The SIRRIPA framework adds the missing piece: SPARR, the return from growth-driven price appreciation. By combining this with earnings power (SIRR), SIRRIPA functions for stocks exactly as YTM does for bonds—compressing different cash flows into a single, risk-adjusted annual rate.
So long as SIRRIPA exceeds the 10-year Treasury yield, equities are not overvalued but instead embody hidden market rationality. Palnantir is therefore not a puzzle that defies logic, but a proof of how markets rationally reprice growth in a dynamic world.
References
- Sam, R. (2025). Extending the P/E and PEG Ratios: The Role of the Potential Payback Period (PPP) in Modern Equity Valuation. https://papers.ssrn.com/sol3/papers.cfm?abstract_id=5240458.
- Sam, R. (2025). Why SIRRIPA is Set to Replace the P/E Ratio in Modern Equity Valuation. https://doi.org/10.20944/preprints202504.1213.v1Sam, R. (2025). SIRRIPA—A Groundbreaking Return Metric to Value Stocks Just Like Bonds. [CrossRef]
- https://papers.ssrn.com/sol3/papers.cfm?abstract_id=5360502.
- Sam, R. (2025). SIRRIPA: The Stock-Tailored Yield to Maturity (YTM) and the Emergence of a Cross-Asset Valuation Metric. https://www.preprints.org/manuscript/202504.1934/v1.
- Sam, R. (2025). Discovering the Mathematical Symmetry Between Bonds and Equities: A Paradigm Shift Triggered by the Potential Payback Period (PPP). [CrossRef]
Disclaimer/Publisher’s Note: The statements, opinions and data contained in all publications are solely those of the individual author(s) and contributor(s) and not of MDPI and/or the editor(s). MDPI and/or the editor(s) disclaim responsibility for any injury to people or property resulting from any ideas, methods, instructions or products referred to in the content. |
© 2025 by the authors. Licensee MDPI, Basel, Switzerland. This article is an open access article distributed under the terms and conditions of the Creative Commons Attribution (CC BY) license (http://creativecommons.org/licenses/by/4.0/).
Copyright: This open access article is published under a Creative Commons CC BY 4.0 license, which permit the free download, distribution, and reuse, provided that the author and preprint are cited in any reuse.


