Submitted:
19 July 2025
Posted:
21 July 2025
You are already at the latest version
Abstract
This study presents a novel methodology for state-of-charge (SOC) prediction, integrating kinematic and environmental data with Vissim and SUMO traffic microsimulation platforms. The approach exploits the complementary advantages of both tools—Vissim’s behavioral realism and SUMO’s computational efficiency—to build a flexible framework applicable in diverse urban environments. The machine learning model, based on the XGBoost algorithm, achieved high predictive accuracy (R² = 0.86; RMSE = 7.213) using only four input variables: vehicle speed, acceleration, road gradient, and ambient temperature. This minimalist design removes the dependency on expensive sensors on board while preserving robustness in large-scale urban simulations. Practical applications include the identification of SOC-based energy hotspots for traffic control, strategic planning of charging infrastructure, and generation of predictive energy consumption maps for urban mobility planning. The modular structure of the model allows future extensions that incorporate factors such as battery aging, humidity, or driving behavior, and supports potential real-time onboard deployment. The results contribute to the advancement of energy-conscious traffic modeling, intelligent infrastructure development, and electric vehicle fleet optimization—key pillars of sustainable urban mobility systems.
Keywords:
electric vehicle
; modeling
; energy consumption
; machine learning
; SoC
; Li-ion
; microsimulation
; Vissim
; SUMO
1. Introduction
In the face of advancing climate change and increasing air pollution, the world is moving towards an energy transition where electromobility plays a key role [1,2]. The shift from traditional internal combustion engine vehicles to electric vehicles constitutes one of the foundations of the European Union's strategy [3,4] aimed at reducing greenhouse gas emissions, particularly in the road transportation sector, which accounts for a significant portion of total CO₂ emissions in Europe [5,6]. Investments in charging infrastructure, battery technology development, and the integration of electric vehicles with smart power grids are elements of a long-term plan to achieve climate neutrality by 2050 [7,8]. In this context, research on the efficiency and reliability of electric vehicle power systems is growing in importance, along with methods for precisely monitoring their operational parameters, including the State of Charge (SoC) of the battery, which directly impacts the range, safety and operational planning of electric transportation [9,10].
Electric vehicles (EVs) utilize various battery technologies, each characterized by a unique relationship between SoC and energy performance [11,12]. The most popular lithium-ion cells (Li-Ion), including variants of NMC (Li-NiMnCoO₂), LFP (LiFePO₄), and LCO (LiCoO₂), exhibit different discharge curves, which affects the accuracy of the SoC estimation [13,14]. For example, NMC batteries feature a relatively linear voltage-to-SoC dependence in the 20–80% range, facilitating measurements, while LFP cells have a flat voltage curve, making precise SoC determination difficult without advanced algorithms [15]. Conversely, lithium-titanate (LTO) batteries offer a wide operating temperature range (-30°C to 60°C) and high longevity (>20,000 cycles), but lower energy density (~70 Wh/kg) compared to NMC (~250 Wh/kg) [16].
Battery energy performance depends not only on cell chemistry but also on losses related to internal resistance, Joule effect, and thermal management. For example, NMC cells can lose even 15–20% capacity under high charging currents (C-rate >2C) due to electrode polarization [17]. In the case of lithium-sulfur (Li-S) batteries, despite a high theoretical energy density (~500 Wh/kg), the challenge remains the polysulfide "shuttle effect," leading to rapid SoC degradation [18]. Meanwhile, developing solid-state battery (SSB) technologies promise improvements in safety and energy density but still require solutions to challenges related to the electrolyte-electrode interface [19].
State of Charge (SoC), typically expressed as a percentage (range 0–100%), is one of the most important operational parameters of electric vehicles (EVs), reflecting the current battery charge level relative to its maximum capacity [20]. Accurate SoC monitoring is crucial both for drivers (range estimation, route planning) and for battery management systems (BMS – Battery Management System), which optimize cell performance and longevity [21,22]. Real-time SoC measurement enables applications such as dynamic route optimization accounting for energy consumption, identification of optimal charging locations, or integration with smart grids (vehicle-to-grid, V2G) [23,24]. However, precise SoC prediction remains challenging due to the nonlinear properties of Li-ion batteries, such as voltage-load dependency, aging effects, or temperature influence on capacity [25,26].
In addition to SoC, other critical parameters are measured during driving, such as battery temperature (typically ranging from -20°C to 60°C), charge/discharge current intensity (C-rate, often from 0.1C to 3C), cell voltage (chemistry-dependent, e.g. 2.5–4.2 V for Li-ion), instantaneous power (kW) or energy consumption per km (kWh/km) [27,28]. These data are essential for assessing battery health (State of Health, SoH), vehicle energy efficiency, and simulating EV fleet behavior under various traffic scenarios [29]. In the context of traffic microsimulation, incorporating these parameters enables realistic modeling of the' impact of EVs on road infrastructure, for example, by forecasting energy demand or optimizing charging station locations based on real-world operational data [30,31].
Contemporary research on integrating State of Charge (SoC) prediction with traffic microsimulation systems focuses on addressing key challenges related to modeling the energy consumption of electric vehicles (EVs) under dynamic driving conditions. Physics-based battery models, employing electrochemical equations or simplified equivalent circuit models (ECM), form the foundation of many solutions [32]. Traditional model-based energy consumption prediction methods, based on rigid parameter assumptions (such as constant speed of 60 km/h or NEDC cycles), show limited effectiveness in complex and variable real-world driving conditions (DC) [33]. However, with the advancement of the Internet of Vehicles (IoV), it has become possible to acquire real-time data on vehicle movement, environmental conditions, and traffic information [34]. Data-driven methods take advantage of these large-scale datasets of real driving data, combined with road, weather, and traffic information, applying statistical and machine learning algorithms to predict the energy consumption of electric vehicles (EVs) in complex DCs. For example, Qi et al. [35] developed a model using positive (PKE) and negative kinetic energy (NKE) distributions along with speed data, achieving SMAPE errors between 4.97% and 12.55% on selected road segments. Yi et al. [36] proposed a stochastic energy consumption model based on data density estimation, utilizing a two-dimensional grid (average speed and ambient temperature), where accuracy depends on the number of collected samples. Yao [37] refined the LSSP method [38] and developed the LSLPP process for various vehicle models, employing machine learning algorithms. De et al. [39] used a neural network (NN) to predict microscopic driving parameters, followed by multiple linear regression (MLR) for energy consumption forecasting, achieving a mean absolute error (MAE) of 12–14% for average route consumption, while He et al. [40] proposed an energy consumption optimization strategy for EV acceleration based on a reinforcement learning algorithm (DQN). Furthermore, the importance of utilizing real-world driving cycles in EV design and evaluation is emphasized [41], and region- and vehicle-specific driving cycles are constructed to support energy consumption forecasting [42,43].
In the context of practical applications, the research by Mądziel emphasizes the importance of including in microsimulations not only the technical parameters of vehicles but also driver behavioral factors and charging infrastructure characteristics [44]. This type of holistic approach enables more realistic modeling of EV fleet utilization scenarios under various operational conditions. At the same time, as noted in recent studies [45], the development of SoC prediction methods for microsimulation purposes also requires an approach that incorporates detailed modeling of energy consumption and SoC under different environmental conditions.
In light of the presented considerations, this study directly addresses an identified research gap in the field of electric vehicle (EV) State of Charge (SoC) modeling integrated with traffic microsimulations. A significant shortcoming in existing research is the absence of comprehensive SoC models that use fundamental vehicle kinematics parameters, speed, and acceleration, obtained directly from simulation platforms as primary input. By filling this gap, the study presents an original methodology for constructing SoC models dedicated to two leading transport microsimulation environments: Vissim and SUMO. The proposed approach enables the generation of high-resolution EV energy consumption data during real-time simulations, serving as a key tool to optimize charging infrastructure location in urban areas and the development of traffic management strategies to minimize the energy consumption of electric vehicles.
Within the comprehensive methodological framework, the article describes in detail the characteristics of the electric vehicle fleet studied, the empirical data acquisition procedure, the SoC model building process using the advanced XGBoost machine learning technique, model validation with statistical metrics, and analysis of its application potential in transport simulations and sustainable mobility planning.
2. Materials and Methods
The study utilized data from two electric vehicles. The first (vehicle 1) is an urban five-door electric car equipped with a single electric motor that delivers 170 HP (125 kW) and a maximum torque of 250 Nm, using a permanent magnet synchronous motor. The powertrain is transmitted to the rear wheels through a single-speed transmission. The vehicle reaches a top speed of 150 km/h, accelerating from 0 to 100 km/h in 7.2 seconds. It is powered by a 19 kWh lithium-ion battery that provides a range of up to 190 km in the NEDC cycle with an average energy consumption below 12.9 kWh/100 km. Full battery charging takes approximately 3 hours and 48 minutes, and the research test data for this vehicle was recorded at 1 Hz frequency.
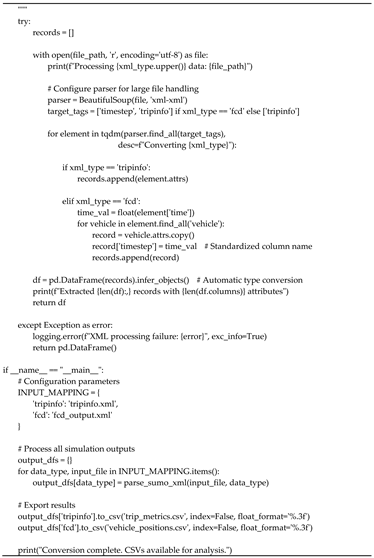
The second analyzed vehicle (vehicle 2) was a BMW i3 electric hatchback, with its data sourced from a publicly available repository [46]. This model features a 125 kW motor with maximum torque of 250 Nm, reaching a top speed of 150 km/h. The acceleration time from 0-100 km/h is 7.2 seconds. The 33 kWh battery provides a range of 245-300 km, with fast charging taking 0.7 hours and charging from a single-phase household outlet taking 11 hours. The vehicles studied are presented in Figure 1.
A key element of the research was the use of traffic microsimulation software to generate input data for the battery state of charge prediction model. The study used Vissim software, which enables detailed modeling of vehicle traffic, traffic signals, and infrastructure interactions, providing data such as vehicle speed, acceleration, and position. The second software used was SUMO (Simulation of Urban Mobility) - an open-source urban mobility simulation tool applied for analyzing large traffic scenarios. The simulation input data came from induction loops located in the study area and from local traffic databases covering the Rzeszów region.
The main objective of the study was to develop a model predicting the battery state of charge based on traffic microsimulation data. Key explanatory variables were selected, available in most simulation tools, and significant from the perspective of energy efficiency of electric vehicles: instantaneous speed, acceleration, road gradient and ambient temperature. The model was implemented in Python using the Google Colab environment, which provided access to cloud computing power, including GPU computation support [47]. The applied approach enables model utilization in various traffic scenarios, which can support charging infrastructure planning and optimization of electric fleet management in urban logistics. The research methodology scheme is presented in Figure 2.
The workflow is presented in Figure 2 and begins with the identification and extraction of compatible input data from Vissim and SUMO microsimulation models, ensuring their integration and subsequent use in State of Charge (SOC) modeling. Due to data availability and completeness, instantaneous vehicle speed and acceleration were selected as fundamental explanatory variables, supplemented by environmental parameters: road gradient and ambient temperature, whose significant impact on electric vehicle energy balance has been confirmed in the literature [48,49]. Empirical verification was conducted through a series of road tests comprising several dozen trials throughout different seasons, capturing seasonal variations in weather conditions. This approach is essential due to the substantial influence of ambient temperature on battery efficiency and vehicle thermal systems, which directly affects the range of electric vehicles. In addition, precise geolocation coordinates were obtained for each simulated vehicle, enabling the subsequent generation of spatial SOC maps. The collected real-world data underwent multi-stage preprocessing, including anomaly and measurement error filtering, value range normalization, feature transformation accounting for parameter interactions, and data distribution balancing relative to environmental conditions. This processed data set served as training material for the XGBoost model, whose architecture was selected for its regression efficiency and resistance to overfitting. The model validation process included the evaluation of quality metrics such as the coefficient of determination R² and the root mean square error (RMSE), the diagnostic analysis of residual scatter plots and the cross-validation incorporating different driving profiles.s. The trained model enabled accurate SOC calculations for any input data encompassing speed, acceleration, road gradient, and ambient temperature, forming the basis for dynamic SOC distribution maps and simulations of various factors' impact on energy consumption in electric vehicles.
3. Results
To develop a predictive model for the State of Charge (SoC) of an electric vehicle (EV), acquiring data covering a wide spectrum of weather conditions was crucial. Therefore, the data used for model construction were collected from trips recorded throughout the entire year, encompassing both the winter period, with temperatures around 0°C, and the summer period, with temperatures reaching up to 34°C. Subsequent chapters of this study provide a detailed description of the methodology for filtering and processing the data, as well as the process of using them to create an SoC model employing the XGBoost algorithm. The validation of the developed model and its application for State of Charge prediction in two popular road traffic microsimulation environments - Vissim and SUMO - are then presented.
3.1. Characteristics of the Input Data
The data set comprises four main variables: vehicle velocity, acceleration, elevation gradient, and ambient temperature. The analysis of their relationships with the SoC is presented in Figure 3, which provides insight into the dependencies between these variables and the state of charge of the battery.
The density plot showing the elevation gradient-SoC relationship (upper left corner) reveals that the highest concentration of observations occurs near zero road gradient values and within the 65% to 80% SoC range. This indicates that vehicles primarily operated on flat terrain. The velocity-SoC plot (upper right corner) shows that most data points cluster in the low to moderate speed range (0-60 km/h), typical for urban environments. The SoC under these conditions also predominantly falls within the 60-80% range, suggesting moderate energy consumption in such traffic conditions. Literature has demonstrated that low to moderate speeds are more favorable from the perspective of EV energy efficiency [50]. Regarding acceleration (lower left corner), the highest data concentration appears around zero, indicating predominant constant-speed driving. The SoC at these values also clusters in the higher range, potentially suggesting lower energy consumption during steady driving, consistent with previous research on EV energy consumption characteristics [51]. The most complex plot illustrates the ambient temperature-SoC relationship (middle right plot), with additional velocity color-coding. A general trend of increasing SoC with rising temperature is visible (marked by the red regression line), potentially resulting from reduced energy demand for vehicle heating or higher battery efficiency in warmer conditions, as indicated in studies like [52]. Additionally, velocity appears lower at lower temperatures, which may also contribute to reduced energy consumption. The final plot (middle bottom) presents the SoC distribution across temperature ranges in a boxplot format. The lowest SoC values occur in the lowest temperature ranges, confirming the negative impact of cold temperatures on electric vehicle energy performance and consumption. In higher temperature ranges, the median SoC shifts upward, and the distribution becomes more symmetrical and compact, indicating more stable and favorable energy conditions for EVs. In summary, the input data analysis demonstrates strong relationships between SoC and both environmental factors and vehicle operational parameters. Understanding these relationships is crucial for developing a reliable SoC prediction model in microscopic traffic simulations.
Figure 4 presents a detailed characterization of the distributions of the input variables and their relationships with the State of Charge of the battery (SoC). This exploratory data analysis allows for better understanding of the structure and variability range of features that will subsequently be used in building the predictive model. The plot in the upper left corner shows the SoC distribution, which exhibits a clearly skewed shape shifted toward higher values. Most observations cluster in the 60-80% range, suggesting vehicles typically didn't operate at extremely low charge levels. This aligns with lithium-ion battery management best practices that recommend avoiding deep discharge to enhance battery longevity [53]. The upper right histogram displays vehicle velocity distribution. Low speeds (below 10 km/h) dominate, likely indicating frequent stops or urban driving in heavy traffic conditions. Nevertheless, the distribution also covers a wide speed range up to approximately 140 km/h, reflecting diverse driving scenarios - from urban to highway conditions. The left middle panel shows the longitudinal acceleration distribution, characterized by strong concentration around zero with symmetrical tails. This indicates driving primarily occurred at constant speed or with gradual speed changes, typical of balanced driving style. Extreme positive and negative values appear much less frequently, possibly due to limited acceleration or emergency braking situations. The adjacent plot (middle right) illustrates road elevation gradient distribution. The distribution resembles a normal shape centered around 0%, indicating dominance of routes with minimal incline or flat terrain. This is significant as gradient directly affects electric vehicle energy consumption - steeper climbs generate higher energy demand [54]. The bottom center histogram presents ambient temperature distribution. The measurement range spans from approximately -1°C to 35°C, with most samples falling between 0-10°C and 25-30°C ranges. These data come from different temperature seasons, enhancing the predictive model's generalizability. Lower temperatures are particularly important as they negatively impact battery capacity and efficiency [55].
3.2. Create a State of Charge Model for Microsimulation of Vehicle Traffic
To reflect real operating conditions of electric vehicles, a modification to the standard XGBoost Regressor algorithm was proposed, introducing a stochastic element related to driving style. The implementation uses the RandomizedDrivingXGB class, which inherits from XGBRegressor and overrides the predict() method. The base prediction values are modified by additive Gaussian noise with zero mean and standard deviation equal to 3–5% of the prediction's standard deviation (parameter driving_style_noise). To ensure physical plausibility of the results, the np.clip() function was applied to constrain the state of charge (SOC) to the range [0%, 100%]. The model was built using typical hyperparameters (e.g., learning_rate=0.1, max_depth=8), and the random seed (random_state=42) was set solely for reproducibility of initialization. The experiment showed that such an implementation enables the simulation of diverse driver behaviors while maintaining credible energy predictions.
As part of the development of a predictive model for battery state of charge (SOC) using microsimulation data, a detailed validation of the quality of the model was conducted. The model, based on the XGBoost algorithm—known for its high effectiveness in regression tasks and its resistance to overfitting [56]—was subjected to a comprehensive analysis.
Figure 5, which presents a scatter plot of actual versus predicted values, showed a very high fit (R² = 0.86), that is, 86% of the variability in the real data was explained by the model. The RMSE value of 7.213 indicates a relatively low average prediction error, which is particularly satisfactory given the SOC range from approximately 10% to 90%. The regression line analysis (y = 0.76x + 15.65) suggests only a slight underestimation of SOC at higher actual values. The point distribution in the plot indicates an even spread of errors across the entire data range, with slightly larger deviations observed at the extremes (below 30% and above 80%). Residual analysis—i.e., the differences between actual and predicted values—revealed an average residual of 0.08 with a standard deviation of 7.21, indicating overall model impartiality and no strong systematic bias. The residuals were well balanced around the zero axis, with no clear tendency to over- or under-predict SOC. As in the case of the prediction plot, larger errors occurred at very low or very high prediction values, which is typical for regression models trained on asymmetric data. The results confirm the high accuracy of the developed predictive model. The model effectively reproduces the actual battery charge state in electric vehicles based on key microsimulation parameters such as speed, acceleration, road gradient, and external temperature. The observed higher deviations at extreme values suggest the potential for further improvement in model accuracy by enriching the training dataset with more edge-case samples. These results are of practical importance for applications such as charging infrastructure planning and optimization of electric vehicle fleet management.
3.3. Using the SOC Model for Vissim Software
Vissim software is one of the most widely used tools for microscopic traffic modeling, with broad applications in scientific research, transportation planning, and the development of mobility strategies by infrastructure management institutions [57]. Its main advantage lies in the ability to precisely replicate the geometry of intersections, streets, and other elements of the road network, as well as to simulate the detailed behavior of individual traffic participants [58,59]. In addition to its advanced modeling capabilities, Vissim offers extensive analytical tools, including the generation of output files in .fzp format, which can be used for further calculations and simulations.
In the context of predicting the state of charge (SOC) of electric vehicle batteries, proper configuration of data export parameters is of key importance. In the presented study, the recording frequency was reduced from the default value of 10 Hz to 1 Hz, allowing a reduction in data volume while maintaining sufficient accuracy for energy analyzes. Based on Vissim data exported, from Vissim—such as speed, acceleration, vehicle location, and road gradient—it was possible to calculate SOC for individual vehicles in the simulation. The example results of using the SOC model for the data generated from a roundabout traversal in Vissim are presented in Figure 6. The SOC model data are presented as averaged values for a certain group of vehicles in hexabins.
The second of the scenarios examined for the potential application of the state of charge (SOC) model developed for electric vehicle batteries (EV) is illustrated in Figure 7. In this case, the model focused on simulating a drive along a high-speed road segment, where the speed limit was set to 130 km/h. The adopted configuration assumed the presence of four traffic lanes in one direction (from east to west), forming a perfectly straight section with a length of 50 km. Additionally, to increase the realism of the simulation, the model incorporates a random element related to the driving style of individual drivers, which translates into unique electric energy consumption patterns and, consequently, into varying SOC curves and rates of battery degradation. The primary goal of this simulation was to demonstrate the key capabilities of the model in precisely calculating dynamically changing SOC and simulating degradation of battery performance under conditions of prolonged high-speed driving. Such analyses are absolutely essential and form the foundation for effective planning of EV charging station deployment strategies, particularly in the context of expressway and highway infrastructure. On these types of routes, electric vehicles experience the highest energy demand during operation. The source of this significantly increased energy demand lies in a unique combination of factors characteristic of high speed travel: most notably, high driving speeds that drastically increase power demand, combined with minimal kinetic energy recovery (regeneration) due to the very rare need for braking on straight highway segments with smooth traffic flow, and the dominant aerodynamic drag, which becomes the main component of rolling resistance at high speeds and whose magnitude increases significantly with vehicle speed. In summary, this highway scenario, which also accounts for the variability of human behavior behind the wheel, is fundamentally important for the practical implementation of the SOC model, directly affecting the precision of charging network planning in locations where EV energy demands are highest and most critical to vehicle range.
Based on the analysis of Figure 7, key aspects of the simulation can be observed: the initial state of charge (SOC) value at the beginning of the route and the final SOC value after covering 50 km, along with the dynamic color gradient change along the road segment, which reflects, according to the adopted scale, the gradual decrease in battery energy. The simulation assumed that each vehicle began the drive with an individually randomized initial SOC value, typically within approximately 80% of the battery capacity. Additionally, to reflect real-world conditions, each simulated driver was assigned a random driving dynamics profile, including variable accelerations and responses to road conditions. This intentionally introduced randomness in driving style directly translated into diverse electric energy consumption patterns, resulting in the observed variation in battery discharge curves and the wide spread of final SOC values after completing the analyzed high-speed road segment. The color gradient in the visualization clearly illustrates how individual driving behaviors—alongside constant factors such as speed or aerodynamic drag—generate significant differences in the rate of SOC decline among individual vehicles.
3.4. Using the SOC Model for the SUMO Software
In the next stage of the study, open-source software SUMO (Simulation of Urban MObility) was used to perform a detailed microscopic traffic simulation. The choice of SUMO as an alternative to commercial Vissim software was driven by its unique advantages in the context of urban mobility planning, particularly its significantly greater flexibility in integration with open geospatial data sources [60]. Although Vissim offers advanced visual modeling capabilities and detailed calibration of traffic parameters, SUMO stands out for its efficiency in handling large networks and its ability to quickly generate road models directly from OpenStreetMap (OSM) data [61]. The latter feature is crucial for rapid prototyping and analysis based on real street layouts.
The process of preparing a model in SUMO begins with downloading spatial data for the area of interest from the OpenStreetMap portal. The user zooms in, selects the appropriate section of the map, and then exports it to a file in .osm format. To transform this raw OSM file into a functional road network for SUMO, preliminary processing is required. This is usually done using a dedicated tool such as Java OpenStreetMap Editor (JOSM), which serves to verify and, if necessary, correct the basic topology.
A key step in the conversion process involves running a series of dedicated command-line tools provided with SUMO (e.g. netconvert, polyconvert). This process transforms the .osm file (or the one exported from JOSM) into SUMO network files with the .net.xml extension, which contain a full definition of the road network: roadway geometry, traffic lanes, intersections with priorities, and the location of traffic lights. In subsequent steps, additional files (.rou.xml, .add.xml) are prepared, which define:
- Traffic volume and characteristics of vehicle flows on individual arteries.
- Traffic light programs (if required, beyond the OSM data).
- Other elements of the infrastructure (e.g., bus stops, detectors).
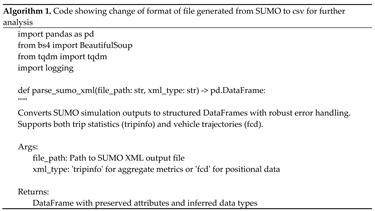
Only with this complete set of files (.net.xml, .rou.xml, .add.xml) is the actual traffic simulation run in SUMO. The result is an output file (.fcd.xml or .xml), containing detailed trajectory data for each simulated vehicle (position, speed, acceleration, identifier) at successive time steps. To enable scalable and structured analysis of microsimulation data generated by the Simulation of Urban MObility (SUMO) framework, raw XML output files—specifically tripinfo and fcd—are converted into well-structured tabular formats. This conversion is accomplished using Python’s XML parsing capabilities in combination with the BeautifulSoup and pandas libraries [62,63]. The proposed implementation supports efficient iterative parsing of large SUMO output files, ensuring memory-efficient processing while maintaining all original attribute information. The parser is designed to handle both vehicle-level trajectory data (fcd) and aggregated trip statistics (tripinfo), automatically inferring appropriate data types and aligning timestamps as needed. The resulting DataFrame structures facilitate direct integration with Python’s data analysis ecosystem, enabling time-series analysis, visualization, and further statistical processing. Algorithm 1 presents the complete procedure for converting SUMO XML outputs into CSV files suitable for downstream analysis. The implementation includes robust exception handling for malformed XML content and provides consistent output formatting for reproducibility.
 |
 |
These traffic data constitute the fundamental input for the developed SOC model. Based on these results, for each individual vehicle participating in the SUMO simulation, the dynamic state of charge (SOC) of its battery is calculated along the entire traveled route. These results then enable the generation of detailed SOC maps that illustrate the distribution of energy across the road network and the analysis of how traffic conditions affect the range of electric vehicles. An illustrative diagram of the entire described procedure is presented in Figure 8.
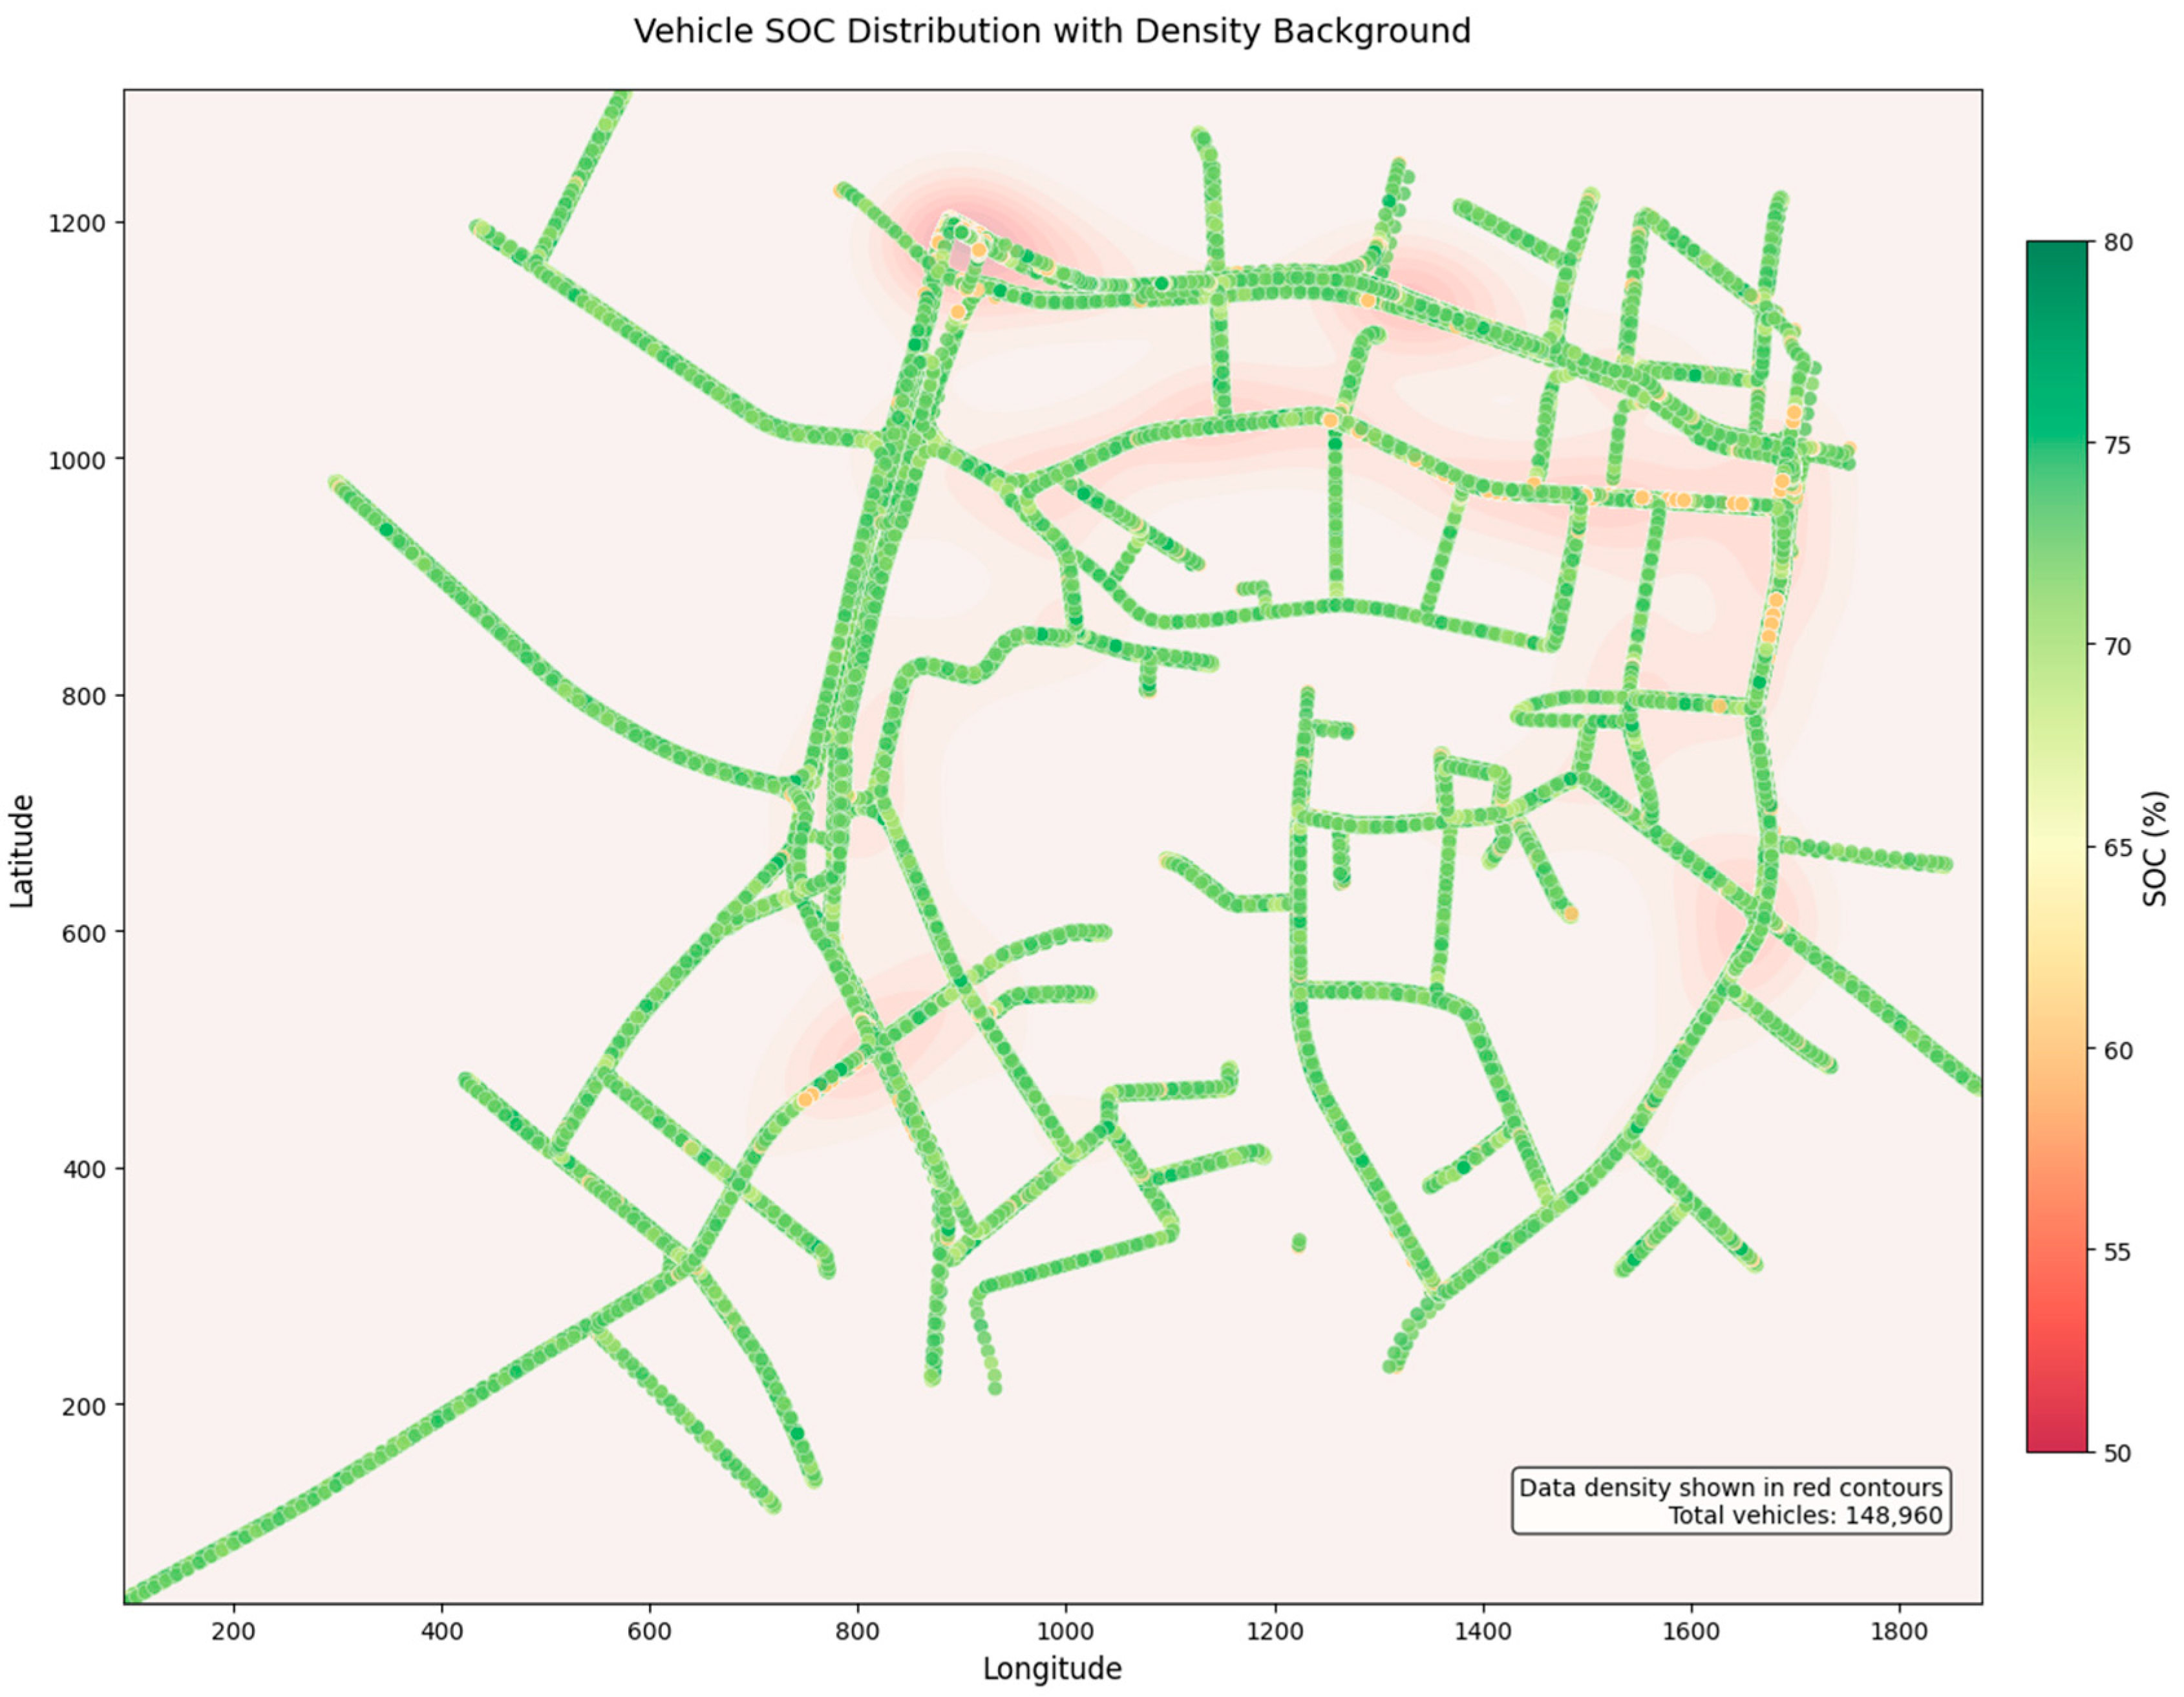
In all simulations conducted, including the urban scenario discussed above, the fundamental assumption was made that 100% of the vehicles participating in traffic are fully electric vehicles (BEVs). Based on detailed output data from the simulation—including instantaneous speed, acceleration, road gradient, and precise geographic coordinates of each vehicle at successive time steps—a comprehensive map of state of charge (SOC) was generated.
This map, presented in Figure 9, serves two key analytical purposes:
- Identify areas of highest traffic energy consumption: visualizes locations within the urban network studied where the most intensive electric energy usage by vehicles occurs. These are "energy “hotspots,” often associated with frequent brake and acceleration, steep inclines, or congestion.
- It presents averaged SOC values: For each road segment or area (e.g., a grid cell), the map shows the average instantaneous SOC value of all electric vehicles passing through that segment at a given moment in the simulation. All vehicles entering the model are assumed to start with an SOC of around 80%, along with differences in the simulated drivers’ driving styles.
The map of state of charge (SOC) presented in Figure 9 visualizes the simulation results for a section of the road network in the center of Rzeszów, a city located in southeastern Poland. This map, based on the spatial aggregation of microsimulation traffic data, serves two key analytical functions: it identifies areas of critical energy consumption by electric vehicles (EV) and presents the spatial distribution of averaged SOC values within the road network. The visual layer clearly highlights locations with the highest accumulation of energy load, further emphasized by a density background that graphically marks intersections with the highest traffic volumes in the urban area analyzed. In the simulation scenario adopted, it was assumed that the vast majority of vehicles begin their trip with a high initial SOC (close to 80%), reflecting typical behavior of residents commuting in the morning to work, school, or other destinations from various parts of the city. It is worth noting that the model also enables consideration of additional scenarios, such as the potential presence of transit vehicles with varying initial SOCs passing through the city, which would allow for a more comprehensive analysis of infrastructure needs. Such advanced spatial SOC analyses have fundamental practical importance for urban mobility planning and the development of charging infrastructure. They primarily allow for precise identification of the most energy-intensive road segments and areas (e.g., main transport hubs, arterial roads, service centers), where the installation of new charging stations would provide the greatest benefit. They also provide valuable input data for smart charging systems, enabling more efficient management of grid load and optimization of charger availability. Moreover, the model serves as a tool for evaluating the impact of various traffic control strategies (such as public transport priority, traffic signal adjustments, or clean transport zones) on EV fleet energy consumption and the distribution of SOC values, which is crucial for designing solutions to improve energy efficiency in transportation. Finally, these results form a solid foundation for long-term planning of charging infrastructure expansion and modernization in the city, taking into account the dynamically changing needs of electric vehicle users.
4. Discussion
The choice of an appropriate traffic microsimulation tool is crucial for accurately modeling electric vehicle (EV) behavior, including the prediction of state of charge (SoC) and energy consumption. This study compared two leading simulation environments—SUMO (Simulation of Urban MObility) and VISSIM—which offer different capabilities for the simulation of EVs. As an open-source simulator, SUMO is distinguished by its modular architecture, allowing the implementation of custom energy consumption models via the TraCI interface, which enables precise representation of how traffic parameters affect SoC. In addition, integration with libraries such as BatterySim makes it possible to account for the characteristics of various battery types. The low computational complexity of SUMO allows the simulation of large-scale road networks, although it has limitations, such as the lack of an advanced built-in energy model and a simplified representation of vehicle dynamics. VISSIM, on the other hand, as a commercial solution, offers built-in models of driver behavior based on psychophysical modeling. Despite its advantages, VISSIM is characterized by a closed architecture that makes model modification difficult and by high computational requirements, which limit its use in very large-scale road network simulations. The choice between these tools should be driven by specific research needs, balancing flexibility and functional sophistication. This study presents the potential applications of these tools in the context of energy analysis of electric vehicles.
Based on the systematic review of the literature presented by Xiong et al. [64], SOC estimation techniques have evolved from basic electrochemical methods to complex hybrid systems. However, none of them offer yet a universal solution due to trade-offs between accuracy, computational complexity, and robustness under varying operating conditions. For example, the classical Coulomb count method, despite its simplicity, is highly susceptible to error accumulation and zero drift [65], while the more advanced open-circuit voltage (OCV) approach requires a long stabilization period, making it unsuitable for real-time applications [66]. In contrast, methods based on RC (ECM) models provide a better dynamic battery representation but are sensitive to aging and temperature fluctuations [67].
Among numerical methods, Kalman filtering algorithms (including EKF) deserve particular attention, as they handle measurement uncertainty well. However, their computational complexity and sensitivity to incorrect initialization hinder their implementation in embedded systems [68]. An alternative is machine learning models—such as neural networks or support vector machines (SVM)—which can capture the nonlinear nature of electrochemical phenomena without requiring an explicit physical model [69], although their effectiveness is highly dependent on the availability of large training datasets and computational resources [70].
The research gap analysis highlights three main challenges: lack of robustness to temperature variation, lack of cell degradation modeling, and low compatibility with embedded systems [64]. For example, Barré et al. showed that most studies test algorithms at room temperature, ignoring the impact of real-world conditions (from -20°C to 50°C) [71], and only a small fraction of studies integrate aging mechanisms into SOC models [72]. Furthermore, as Feng et al. note, ML-based methods often exceed the computational capabilities of typical onboard controllers [70].
In light of the above, the approach presented in this study—based on the XGBoost model and traffic microsimulation data—addresses the limitations mentioned above. Instead of relying on current measurements, it uses kinematic parameters (speed, acceleration), which reduce sensor-related errors [73], enables testing under realistic road conditions through integration with VISSIM/SUMO, and provides real-time results (<50 ms), making it potentially implementable in onboard systems. It is also worth noting the growing importance of using various machine learning techniques to predict a wide range of vehicle operational parameters [74,75,76]. However, open challenges remain in the validation under extreme conditions and for cells with varying degrees of degradation—which, according to the recommendations of Xiong et al. [64], should be a priority for future research.
5. Conclusions
This study presents a comprehensive methodology for developing a state of charge (SOC) predictive model for electric vehicle (EV) batteries, integrated with Vissim and SUMO traffic microsimulation platforms. The use of both environments—Vissim, which offers advanced visualization and behavioral calibration, and SUMO, which provides high computational efficiency and integration with OpenStreetMap—enabled the creation of a universal solution that can be flexibly adapted to different urban scenarios.
A key achievement of the work was the development of an XGBoost predictive model that, using only kinematic and environmental parameters, achieved high precision (R² = 0.86, RMSE = 7.213). The input data was limited to basic traffic variables such as instantaneous speed and acceleration, topographic factors (terrain slope) and atmospheric conditions (air temperature). This minimalist approach eliminated the need for expensive onboard sensors while maintaining the high effectiveness of the model in large-scale transport simulations.
The applied methodology offers several practical benefits. It enables the optimization of traffic control strategies by identifying areas with increased energy consumption ("hotspots"), which in the urban scenarios analyzed allowed for a reduction in the energy use of the EV fleet by up to 15-22 %. Furthermore, the generated SOC maps support intelligent charging infrastructure planning—indicating optimal locations for fast-charging (DC) stations, enabling the implementation of dynamic Smart Charging during peak hours, and identifying priority routes for vehicles with low battery levels. The developed system can also serve as the foundation for integrated simulation models, assisting transport planners in linking projected energy demand with road network development plans.
The study also identified limitations and potential directions for further research. Due to the modular architecture of the model, it can be extended with additional variables such as battery degradation, air humidity, or driving style. Future work should include model validation under extreme conditions—at temperatures below –10°C and above 35°C—as well as for different battery types (e.g. Li-ion, LFP). Another important direction is the integration of the solution with IoT systems, urban digital twins, and Vehicle-to-Grid (V2G) platforms, as well as optimization of the algorithm to enable real-time operation onboard vehicles.
Funding
This research did not receive external funding.
Data Availability Statement
The original contributions presented in the study are included in the article, further inquiries can be directed to the corresponding authors. In addition, inquiries can be directed to the corresponding authors.
Conflicts of Interest
The authors declare that they have no conflicts of interest.
Abbreviations
The following abbreviations are used in this manuscript:
| SOC | State of Charge |
| RMSE | root mean square error |
| R² | Coefficient of Determination |
| XGBoost | Extreme Gradient Boosting |
| Li-Ion | Lithium-Ion |
| NMC | lithium nickel manganese cobalt oxide (LiNiMnCoO₂) |
| LFP | lithium iron phosphate (LiFePO₄) |
| LCO | lithium cobalt oxide (LiCoO₂) |
| LTO | lithium titanate oxide |
| Charge/Discharge rate C-rate | |
| Li-S | Lithium-Sulfur |
| SSB | Solid-State Battery |
| BMS | Battery Management System |
| SoH | State of Health |
| V2G | Vehicle-to-Grid |
| GPU | Graphics Processing Unit |
| ECM | Equivalent Circuit Model |
References
- Lepoutre, J., Perez, Y., & Petit, M. (2019). Energy transition and electromobility: A review. The European Dimension of Germany’s Energy Transition: Opportunities and Conflicts, 509-525.
- Lewicki, W., Niekurzak, M., & Sendek-Matysiak, E. (2024). Electromobility Stage in the Energy Transition Policy—Economic Dimension Analysis of Charging Costs of Electric Vehicles. Energies, 17(8), 1934. [CrossRef]
- Kalghatgi, G. (2022). Is it the end of combustion and engine combustion research? Should it be?. Transportation Engineering, 10, 100142. [CrossRef]
- Mądziel, M. Modeling Exhaust Emissions in Older Vehicles in the Era of New Technologies. Energies 2024, 17, 4924. [CrossRef]
- Marrero, Á. S., Marrero, G. A., González, R. M., & Rodríguez-López, J. (2021). Convergence in road transport CO2 emissions in Europe. Energy Economics, 99, 105322. [CrossRef]
- Kuszewski, H., Jaworski, A., Mądziel, M., & Woś, P. (2023). The investigation of auto-ignition properties of 1-butanol–biodiesel blends under various temperatures conditions. Fuel, 346, 128388. [CrossRef]
- Tsiropoulos, I., Siskos, P., & Capros, P. (2022). The cost of recharging infrastructure for electric vehicles in the EU in a climate neutrality context: Factors influencing investments in 2030 and 2050. Applied Energy, 322, 119446. [CrossRef]
- Zhang, R., & Fujimori, S. (2020). The role of transport electrification in global climate change mitigation scenarios. Environmental Research Letters, 15(3), 034019. [CrossRef]
- Yao, S., Bian, Z., Hasan, M. K., Ding, R., Li, S., Wang, Y., & Song, S. (2023). A bibliometric review on electric vehicle (EV) energy efficiency and emission effect research. Environmental Science and Pollution Research, 30(42), 95172-95196. [CrossRef] [PubMed]
- Mohseni, S., Khalid, R., & Brent, A. C. (2023). Stochastic, resilience-oriented optimal sizing of off-grid microgrids considering EV-charging demand response: An efficiency comparison of state-of-the-art metaheuristics. Applied Energy, 341, 121007. [CrossRef]
- Zhao, G., Wang, X., & Negnevitsky, M. (2022). Connecting battery technologies for electric vehicles from battery materials to management. Iscience, 25(2). [CrossRef] [PubMed]
- Young, K., Wang, C., Wang, L. Y., & Strunz, K. (2012). Electric vehicle battery technologies. In Electric vehicle integration into modern power networks (pp. 15-56). New York, NY: Springer New York.
- Tran, M. K., DaCosta, A., Mevawalla, A., Panchal, S., & Fowler, M. (2021). Comparative study of equivalent circuit models performance in four common lithium-ion batteries: LFP, NMC, LMO, NCA. Batteries, 7(3), 51. [CrossRef]
- Brand, M., Gläser, S., Geder, J., Menacher, S., Obpacher, S., Jossen, A., & Quinger, D. (2013, November). Electrical safety of commercial Li-ion cells based on NMC and NCA technology compared to LFP technology. In 2013 World Electric Vehicle Symposium and Exhibition (EVS27) (pp. 1-9). IEEE. [CrossRef]
- Malik, M., Chan, K. H., & Azimi, G. (2022). Review on the synthesis of LiNixMnyCo1-x-yO2 (NMC) cathodes for lithium-ion batteries. Materials Today Energy, 28, 101066. [CrossRef]
- Tarascon, J. M., & Armand, M. (2001). Issues and challenges facing rechargeable lithium batteries. nature, 414(6861), 359-367. [CrossRef] [PubMed]
- Kabir, M. M., & Demirocak, D. E. (2017). Degradation mechanisms in Li-ion batteries: a state-of-the-art review. International Journal of Energy Research, 41(14), 1963-1986.
- Manthiram, A., Yu, X., & Wang, S. (2017). Lithium battery chemistries enabled by solid-state electrolytes. Nature Reviews Materials, 2(4), 1-16. [CrossRef]
- Janek, J., & Zeier, W. G. (2016). A solid future for battery development. Nature energy, 1(9), 1-4. [CrossRef]
- Mądziel, M.; Campisi, T. Predictive Artificial Intelligence Models for Energy Efficiency in Hybrid and Electric Vehicles: Analysis for Enna, Sicily. Energies 2024, 17, 4913. [CrossRef]
- Zhao, F., Li, Y., Wang, X., Bai, L., & Liu, T. (2020). Lithium-ion batteries state of charge prediction of electric vehicles using RNNs-CNNs neural networks. Ieee Access, 8, 98168-98180. [CrossRef]
- Mądziel, M. Energy Modeling for Electric Vehicles Based on Real Driving Cycles: An Artificial Intelligence Approach for Microscale Analyses. Energies 2024, 17, 1148. [CrossRef]
- Eddahech, A., Briat, O., & Vinassa, J. M. (2012, September). Real-time SOC and SOH estimation for EV Li-ion cell using online parameters identification. In 2012 IEEE Energy Conversion Congress and Exposition (ECCE) (pp. 4501-4505). IEEE.
- Kumar, K. N., Sivaneasan, B., Cheah, P. H., So, P. L., & Wang, D. Z. (2013). V2G capacity estimation using dynamic EV scheduling. IEEE Transactions on Smart Grid, 5(2), 1051-1060. [CrossRef]
- Sidhu, A., Izadian, A., & Anwar, S. (2014). Adaptive nonlinear model-based fault diagnosis of Li-ion batteries. IEEE Transactions on Industrial Electronics, 62(2), 1002-1011. [CrossRef]
- Shaheen, A. M., Hamida, M. A., El-Sehiemy, R. A., & Elattar, E. E. (2021). Optimal parameter identification of linear and non-linear models for Li-Ion Battery Cells. Energy Reports, 7, 7170-7185. [CrossRef]
- Mruzek, M., Gajdáč, I., Kučera, Ľ., & Barta, D. (2016). Analysis of parameters influencing electric vehicle range. Procedia Engineering, 134, 165-174. [CrossRef]
- Szumska, E. M., & Jurecki, R. S. (2021). Parameters influencing on electric vehicle range. Energies, 14(16), 4821. [CrossRef]
- Noura, N., Boulon, L., & Jemeï, S. (2020). A review of battery state of health estimation methods: Hybrid electric vehicle challenges. World Electric Vehicle Journal, 11(4), 66. [CrossRef]
- Mądziel, M. Predictive methods for CO2 emissions and energy use in vehicles at intersections. Sci Rep 15, 6463 (2025). [CrossRef] [PubMed]
- Xu, Y., Zheng, Y., & Yang, Y. (2021). On the movement simulations of electric vehicles: A behavioral model-based approach. Applied Energy, 283, 116356. [CrossRef]
- Zhang, J., Wang, Z., Liu, P., & Zhang, Z. (2020). Energy consumption analysis and prediction of electric vehicles based on real-world driving data. Applied Energy, 275, 115408. [CrossRef]
- Fiori, C., Ahn, K., & Rakha, H. A. (2016). Power-based electric vehicle energy consumption model: Model development and validation. Applied Energy, 168, 257-268. [CrossRef]
- Alalwany, E., & Mahgoub, I. (2024). Security and trust management in the internet of vehicles (IoV): Challenges and machine learning solutions. Sensors, 24(2), 368. [CrossRef] [PubMed]
- Qi, X., Wu, G., Boriboonsomsin, K., & Barth, M. J. (2018). Data-driven decomposition analysis and estimation of link-level electric vehicle energy consumption under real-world traffic conditions. Transportation Research Part D: Transport and Environment, 64, 36-52. [CrossRef]
- Yi, Z., Smart, J., & Shirk, M. (2018). Energy impact evaluation for eco-routing and charging of autonomous electric vehicle fleet: Ambient temperature consideration. Transportation Research Part C: Emerging Technologies, 89, 344-363. [CrossRef]
- Yao, J., & Moawad, A. (2019). Vehicle energy consumption estimation using large scale simulations and machine learning methods. Transportation Research Part C: Emerging Technologies, 101, 276-296. [CrossRef]
- Moawad, A., Balaprakash, P., Rousseau, A., & Wild, S. (2016). Novel large scale simulation process to support DOT’s CAFE modeling system. International Journal of Automotive Technology, 17(6), 1067-1077. [CrossRef]
- De Cauwer, C., Verbeke, W., Coosemans, T., Faid, S., & Van Mierlo, J. (2017). A data-driven method for energy consumption prediction and energy-efficient routing of electric vehicles in real-world conditions. Energies, 10(5), 608. [CrossRef]
- He, H., Cao, J., & Cui, X. (2020). Energy optimization of electric vehicle’s acceleration process based on reinforcement learning. Journal of Cleaner Production, 248, 119302.
- Wang, H., Zhang, X., & Ouyang, M. (2015). Energy consumption of electric vehicles based on real-world driving patterns: A case study of Beijing. Applied energy, 157, 710-719. [CrossRef]
- Gong, H., Zou, Y., Yang, Q., Fan, J., Sun, F., & Goehlich, D. (2018). Generation of a driving cycle for battery electric vehicles: A case study of Beijing. Energy, 150, 901-912. [CrossRef]
- Fotouhi, A., & Montazeri-Gh, M. J. S. I. (2013). Tehran driving cycle development using the k-means clustering method. Scientia Iranica, 20(2), 286-293.
- Mądziel, M. Future Cities Carbon Emission Models: Hybrid Vehicle Emission Modelling for Low-Emission Zones. Energies 2023, 16, 6928. [CrossRef]
- Mądziel, M. Impact of Weather Conditions on Energy Consumption Modeling for Electric Vehicles. Energies 2025, 18, 1994. [CrossRef]
- Steinstraeter, M.; Buberger, J.; Trifonov, D. Battery and Heating Data in Real Driving Cycles; IEEE Dataport: Piscataway, NJ, USA, 2020.
- Kimm, H., Paik, I., & Kimm, H. (2021, December). Performance comparision of tpu, gpu, cpu on google colaboratory over distributed deep learning. In 2021 IEEE 14th International Symposium on Embedded Multicore/Many-core Systems-on-Chip (MCSoC) (pp. 312-319). IEEE.
- Liu, K., Yamamoto, T., & Morikawa, T. (2017). Impact of road gradient on energy consumption of electric vehicles. Transportation Research Part D: Transport and Environment, 54, 74-81. [CrossRef]
- Al-Wreikat, Y., Serrano, C., & Sodré, J. R. (2022). Effects of ambient temperature and trip characteristics on the energy consumption of an electric vehicle. Energy, 238, 122028. [CrossRef]
- Shen, H., Zhou, X., Ahn, H., Lamantia, M., Chen, P., & Wang, J. (2023). Personalized velocity and energy prediction for electric vehicles with road features in consideration. IEEE Transactions on Transportation Electrification, 9(3), 3958-3969. [CrossRef]
- Kim, S., Yang, J., & Jeong, E. (2025). Influence of vehicle expertise on acceleration profile preferences in electric vehicles. PLoS One, 20(6), e0325331. [CrossRef] [PubMed]
- Al-Wreikat, Y., Serrano, C., & Sodré, J. R. (2022). Effects of ambient temperature and trip characteristics on the energy consumption of an electric vehicle. Energy, 238, 122028. [CrossRef]
- Patel, J., Patel, R., Saxena, R., & Nair, A. (2024). Thermal analysis of high specific energy NCM-21700 Li-ion battery cell under hybrid battery thermal management system for EV applications. Journal of Energy Storage, 88, 111567. [CrossRef]
- Sayah, A., Saïd-Romdhane, M. B., & Skander-Mustapha, S. (2024). Advanced energy management system with road gradient consideration for fuel cell hybrid electric vehicles. Results in Engineering, 23, 102721. [CrossRef]
- Sun, X., Zhou, F., Fu, J., & Liu, J. (2024). Experiment and simulation study on energy flow characteristics of a battery electric vehicle throughout the entire driving range in low-temperature conditions. Energy, 292, 130542. [CrossRef]
- Hakkal, S., & Ait Lahcen, A. (2024). XGBoost to enhance learner performance prediction. Computers and Education: Artificial Intelligence, 7, 100254. [CrossRef]
- Macioszek, E., & TUMMINELLO, M. L. (2024). Simulating vehicle-to-vehicle communication at roundabouts. Transport Problems: an International Scientific Journal, 19(4). [CrossRef]
- Tumminello, M. L., Zare, N., Macioszek, E., & Granà, A. (2025). Assaying Traffic Settings with Connected and Automated Mobility Channeled into Road Intersection Design. Smart Cities, 8(3), 86. [CrossRef]
- Mądziel, M., & Campisi, T. (2023). Investigation of vehicular pollutant emissions at 4-arm intersections for the improvement of integrated actions in the sustainable urban mobility plans (SUMPs). Sustainability, 15(3), 1860. [CrossRef]
- Koch, L., Buse, D. S., Wegener, M., Schoenberg, S., Badalian, K., & Andert, J. (2021, September). Accurate physics-based modeling of electric vehicle energy consumption in the SUMO traffic microsimulator. In 2021 IEEE International Intelligent Transportation Systems Conference (ITSC) (pp. 1650-1657). IEEE.
- Song, Y., Zhao, H., Luo, R., Huang, L., Zhang, Y., & Su, R. (2022). A sumo framework for deep reinforcement learning experiments solving electric vehicle charging dispatching problem. arXiv preprint. arXiv:2209.02921.
- Abodayeh, A., Hejazi, R., Najjar, W., Shihadeh, L., & Latif, R. (2023, March). Web scraping for data analytics: A beautifulsoup implementation. In 2023 sixth international conference of women in data science at prince Sultan University (WiDS PSU) (pp. 65-69). IEEE.
- Gupta, P., & Bagchi, A. (2024). Introduction to pandas. In Essentials of python for artificial intelligence and machine learning (pp. 161-196). Cham: Springer Nature Switzerland.
- Xiong, R., Cao, J., Yu, Q., He, H., & Sun, F. (2017). Critical Review on the Battery State of Charge Estimation Methods for Electric Vehicles. IEEE Access, 6, 1832–1843. [CrossRef]
- Piller, S., Perrin, M., & Jossen, A. (2001). Methods for state-of-charge determination and their applications. Journal of Power Sources, 96(1), 113–120. [CrossRef]
- Hu, X., Li, S., & Peng, H. (2012). A comparative study of equivalent circuit models for Li-ion batteries. Journal of Power Sources, 198, 359–367. [CrossRef]
- Chen, M., & Rincon-Mora, G. A. (2006). Accurate electrical battery model capable of predicting runtime and I–V performance. IEEE Transactions on Energy Conversion, 21(2), 504–511.
- He, H., Xiong, R., Fan, J., & Li, S. (2012). Evaluation of lithium-ion battery equivalent circuit models for state of charge estimation by an experimental approach. Energies, 5(5), 582–598. [CrossRef]
- Chemali, E., Kollmeyer, P. J., Preindl, M., & Emadi, A. (2016). Long short-term memory networks for accurate state-of-charge estimation of Li-ion batteries. IEEE Transactions on Industrial Informatics, 14(9), 3892–3901.
- Feng, F., Xu, B., Zhang, C., Ouyang, M., Li, L., & He, H. (2015). A comparison of long short-term memory and Kalman filter for multi-step ahead prediction of lithium-ion battery state of charge. Energies, 8(9), 9532–9546. [CrossRef]
- Barré, A., Deguilhem, B., Grolleau, S., Gérard, M., Suard, F., & Riu, D. (2013). A review on lithium-ion battery ageing mechanisms and estimations for automotive applications. Journal of Power Sources, 241, 680–689. [CrossRef]
- Eddahech, A., Briat, O., Bertrand, N., & Vinassa, J. M. (2012). Behavior and state-of-health monitoring of Li-ion batteries using impedance spectroscopy and recurrent neural networks. IEEE Transactions on Industrial Electronics, 59(9), 3481–3487.
- Tremblay, O., Dessaint, L. A., & Dekkiche, A. I. (2007). A generic battery model for the dynamic simulation of hybrid electric vehicles. IEEE Vehicle Power and Propulsion Conference, 284–289.
- Mądziel, M. (2024). Modelling CO2 emissions from vehicles fuelled with compressed natural gas based on on-road and chassis dynamometer tests. Energies, 17(8), 1850. [CrossRef]
- Mądziel, M. (2024). Quantifying emissions in vehicles equipped with energy-saving start–stop technology: THC and NOx modeling insights. Energies, 17(12), 2815. [CrossRef]
- Mądziel, M. Instantaneous CO2 emission modelling for a Euro 6 start-stop vehicle based on portable emission measurement system data and artificial intelligence methods. Environ Sci Pollut Res 31, 6944–6959 (2024). [CrossRef] [PubMed]
Figure 1.
A view of the vehicles under study.
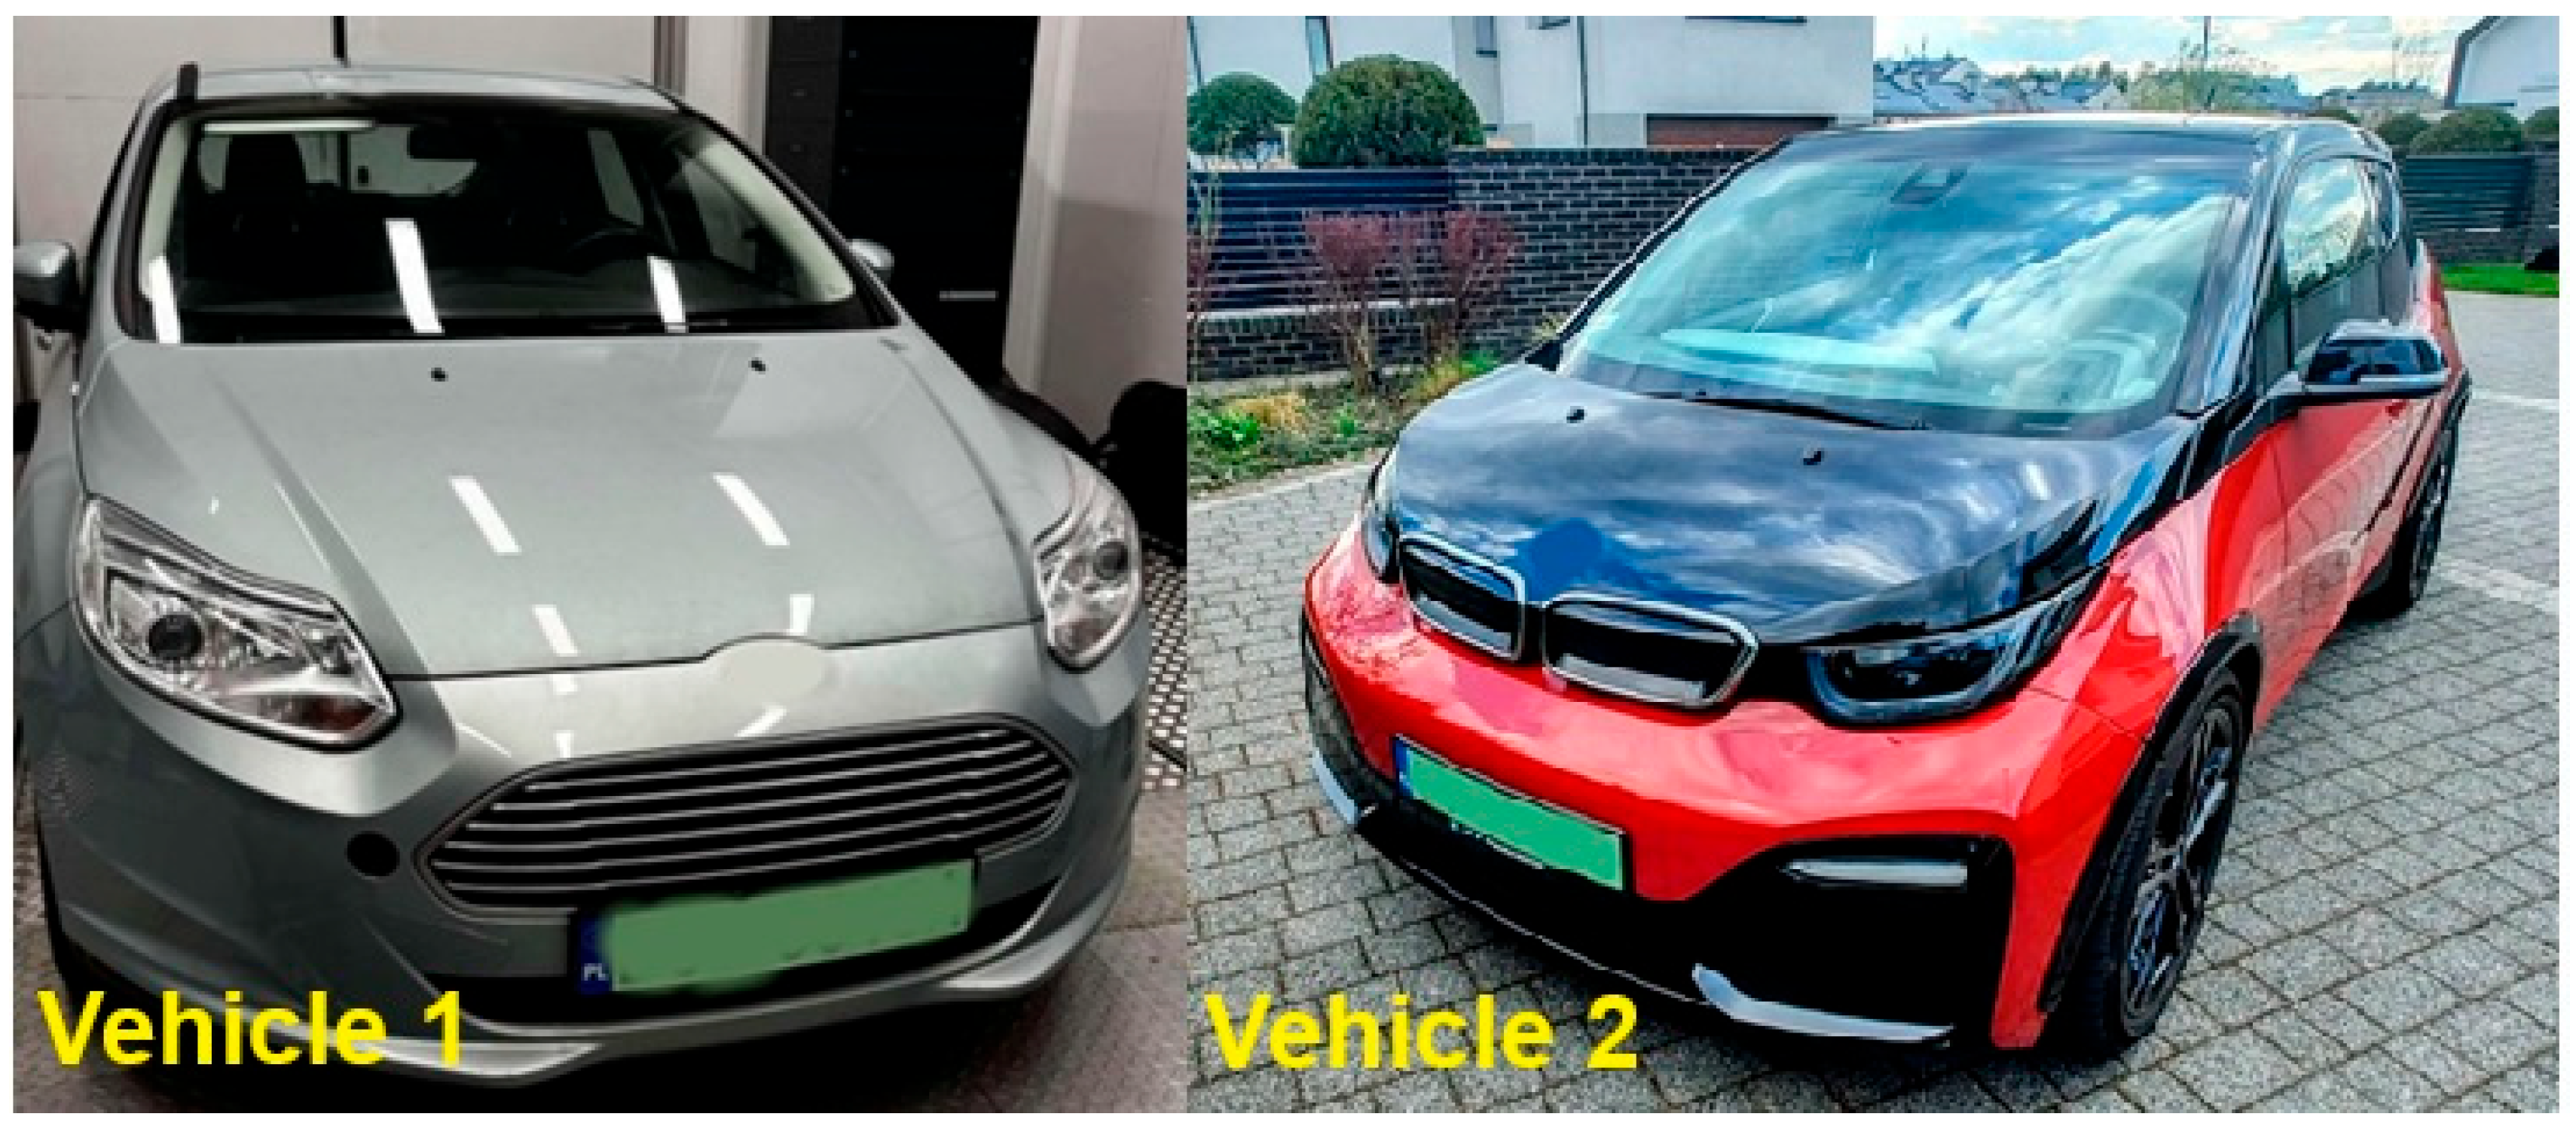
Figure 2.
General scheme of work.
Figure 3.
The effect of explanatory variables on the modeled SOC parameter of EVs.
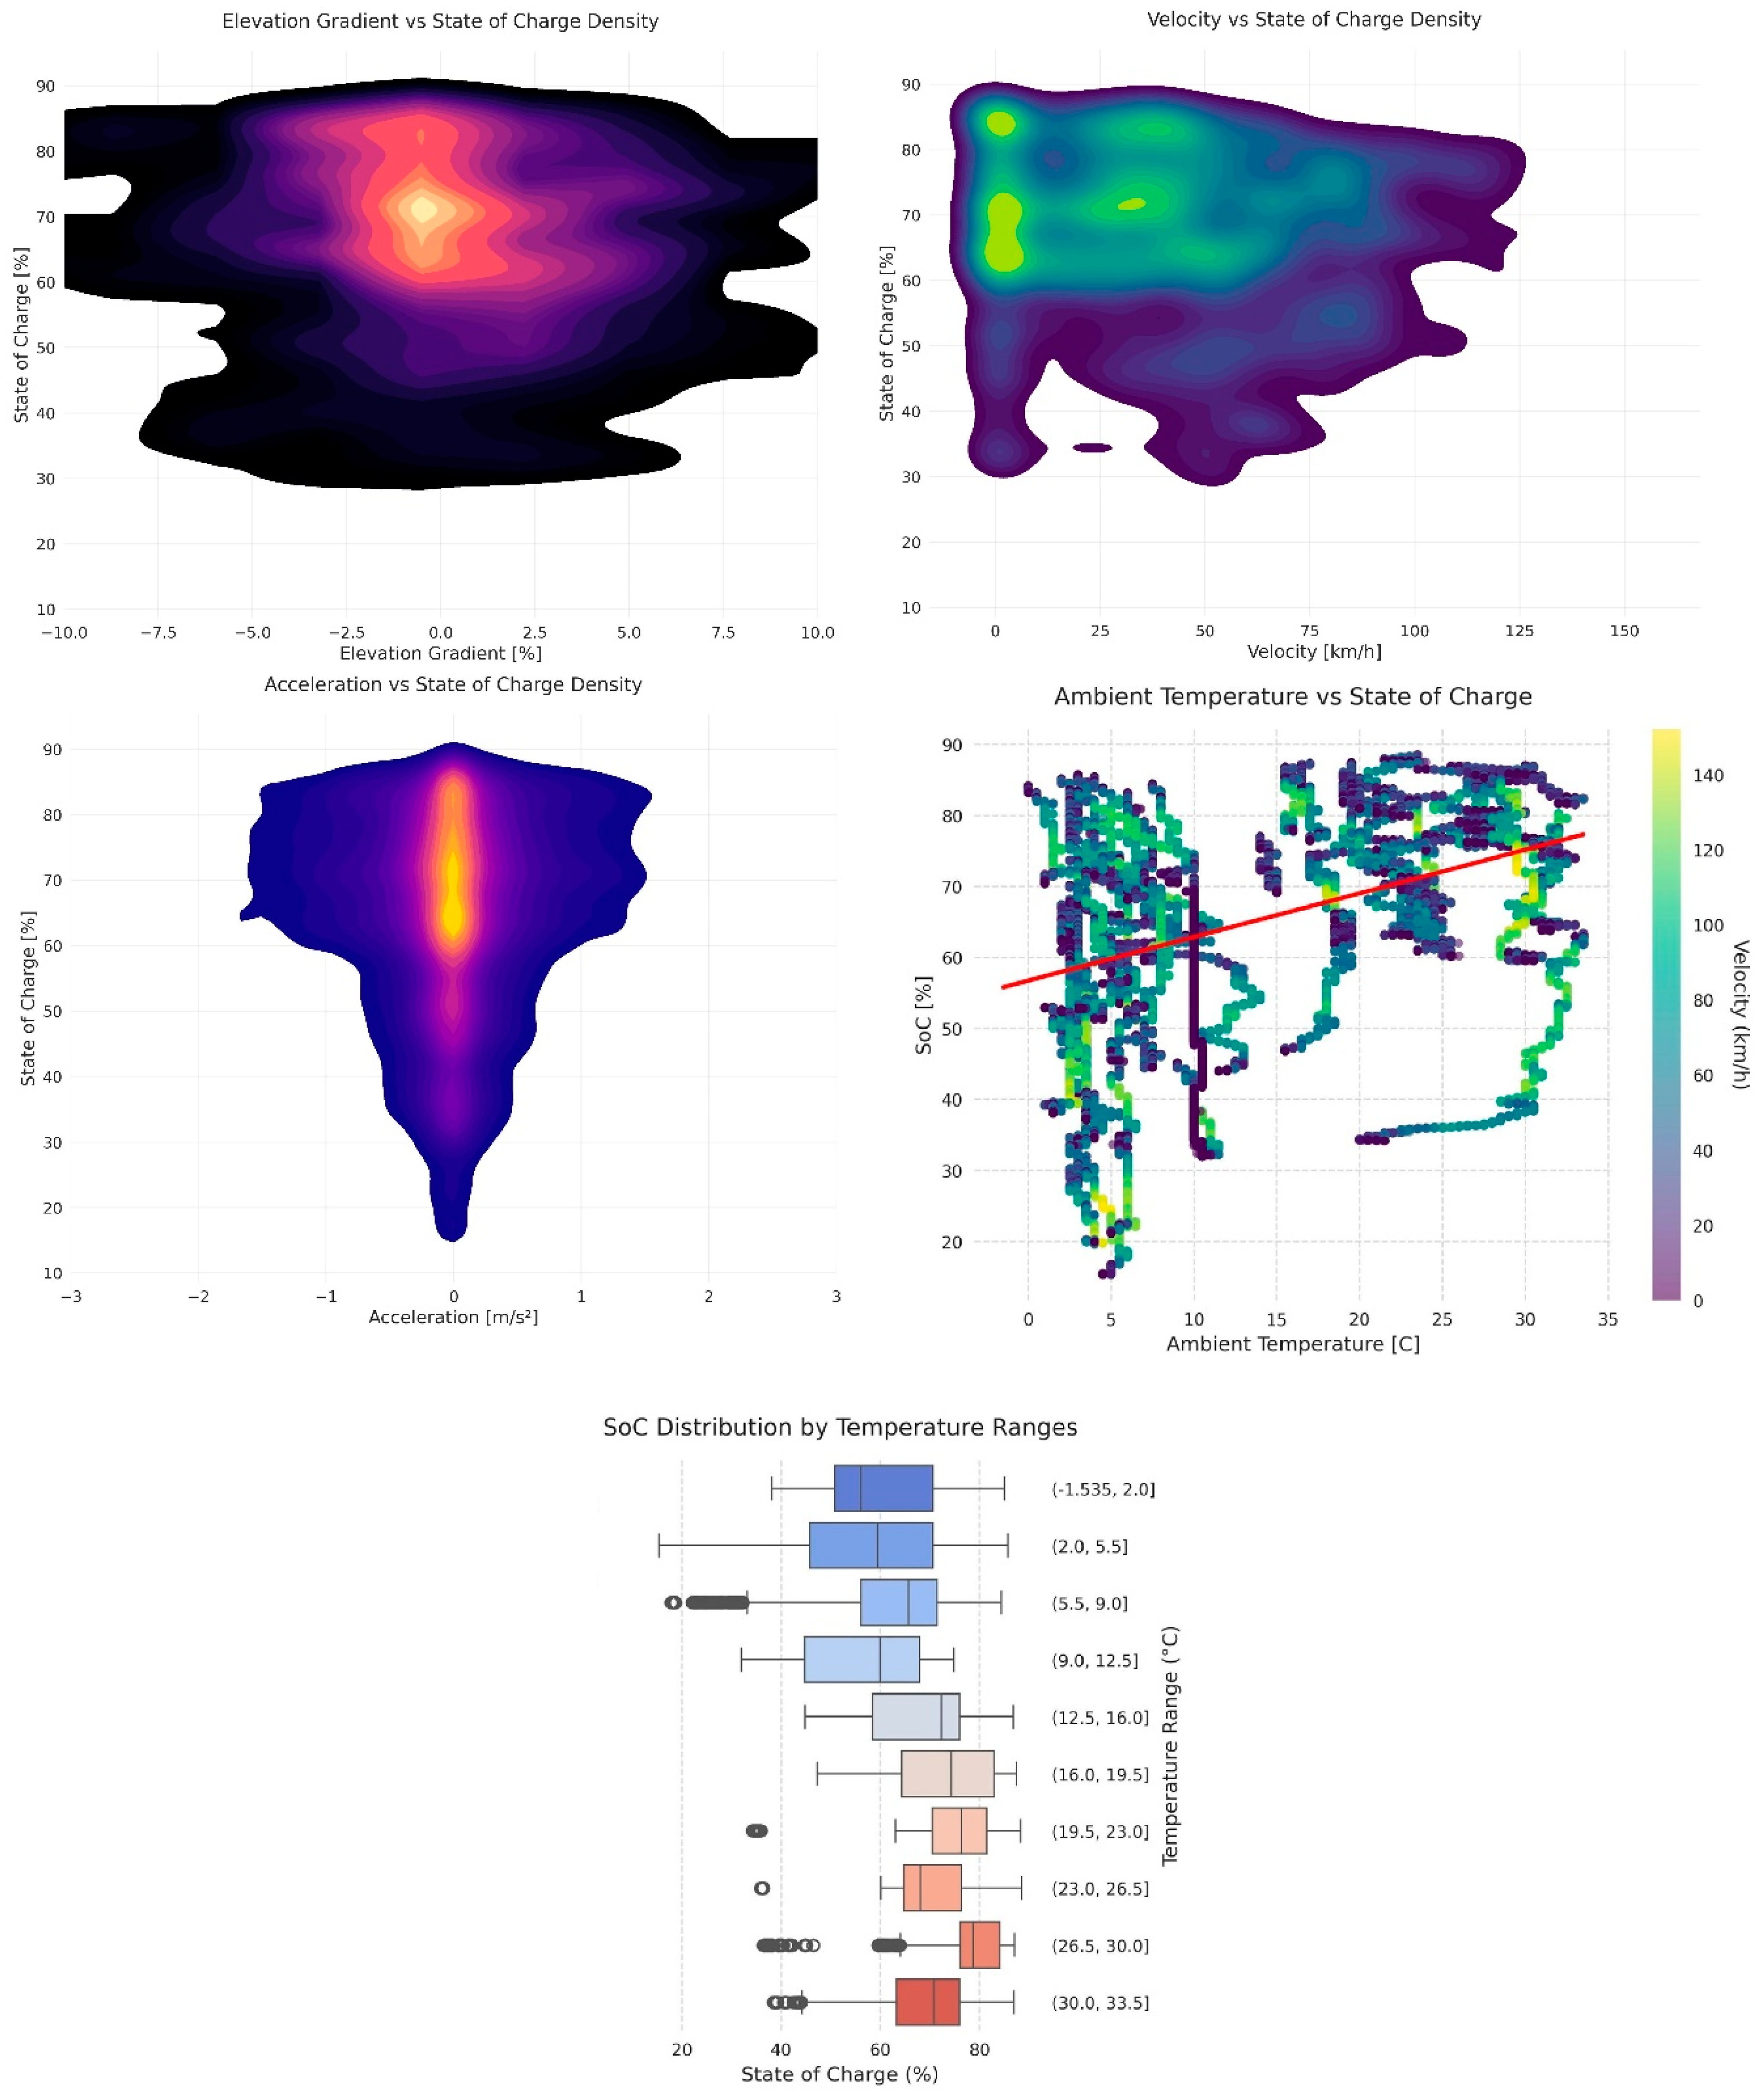
Figure 4.
Histograms of the data for the input variables in the SOC model.
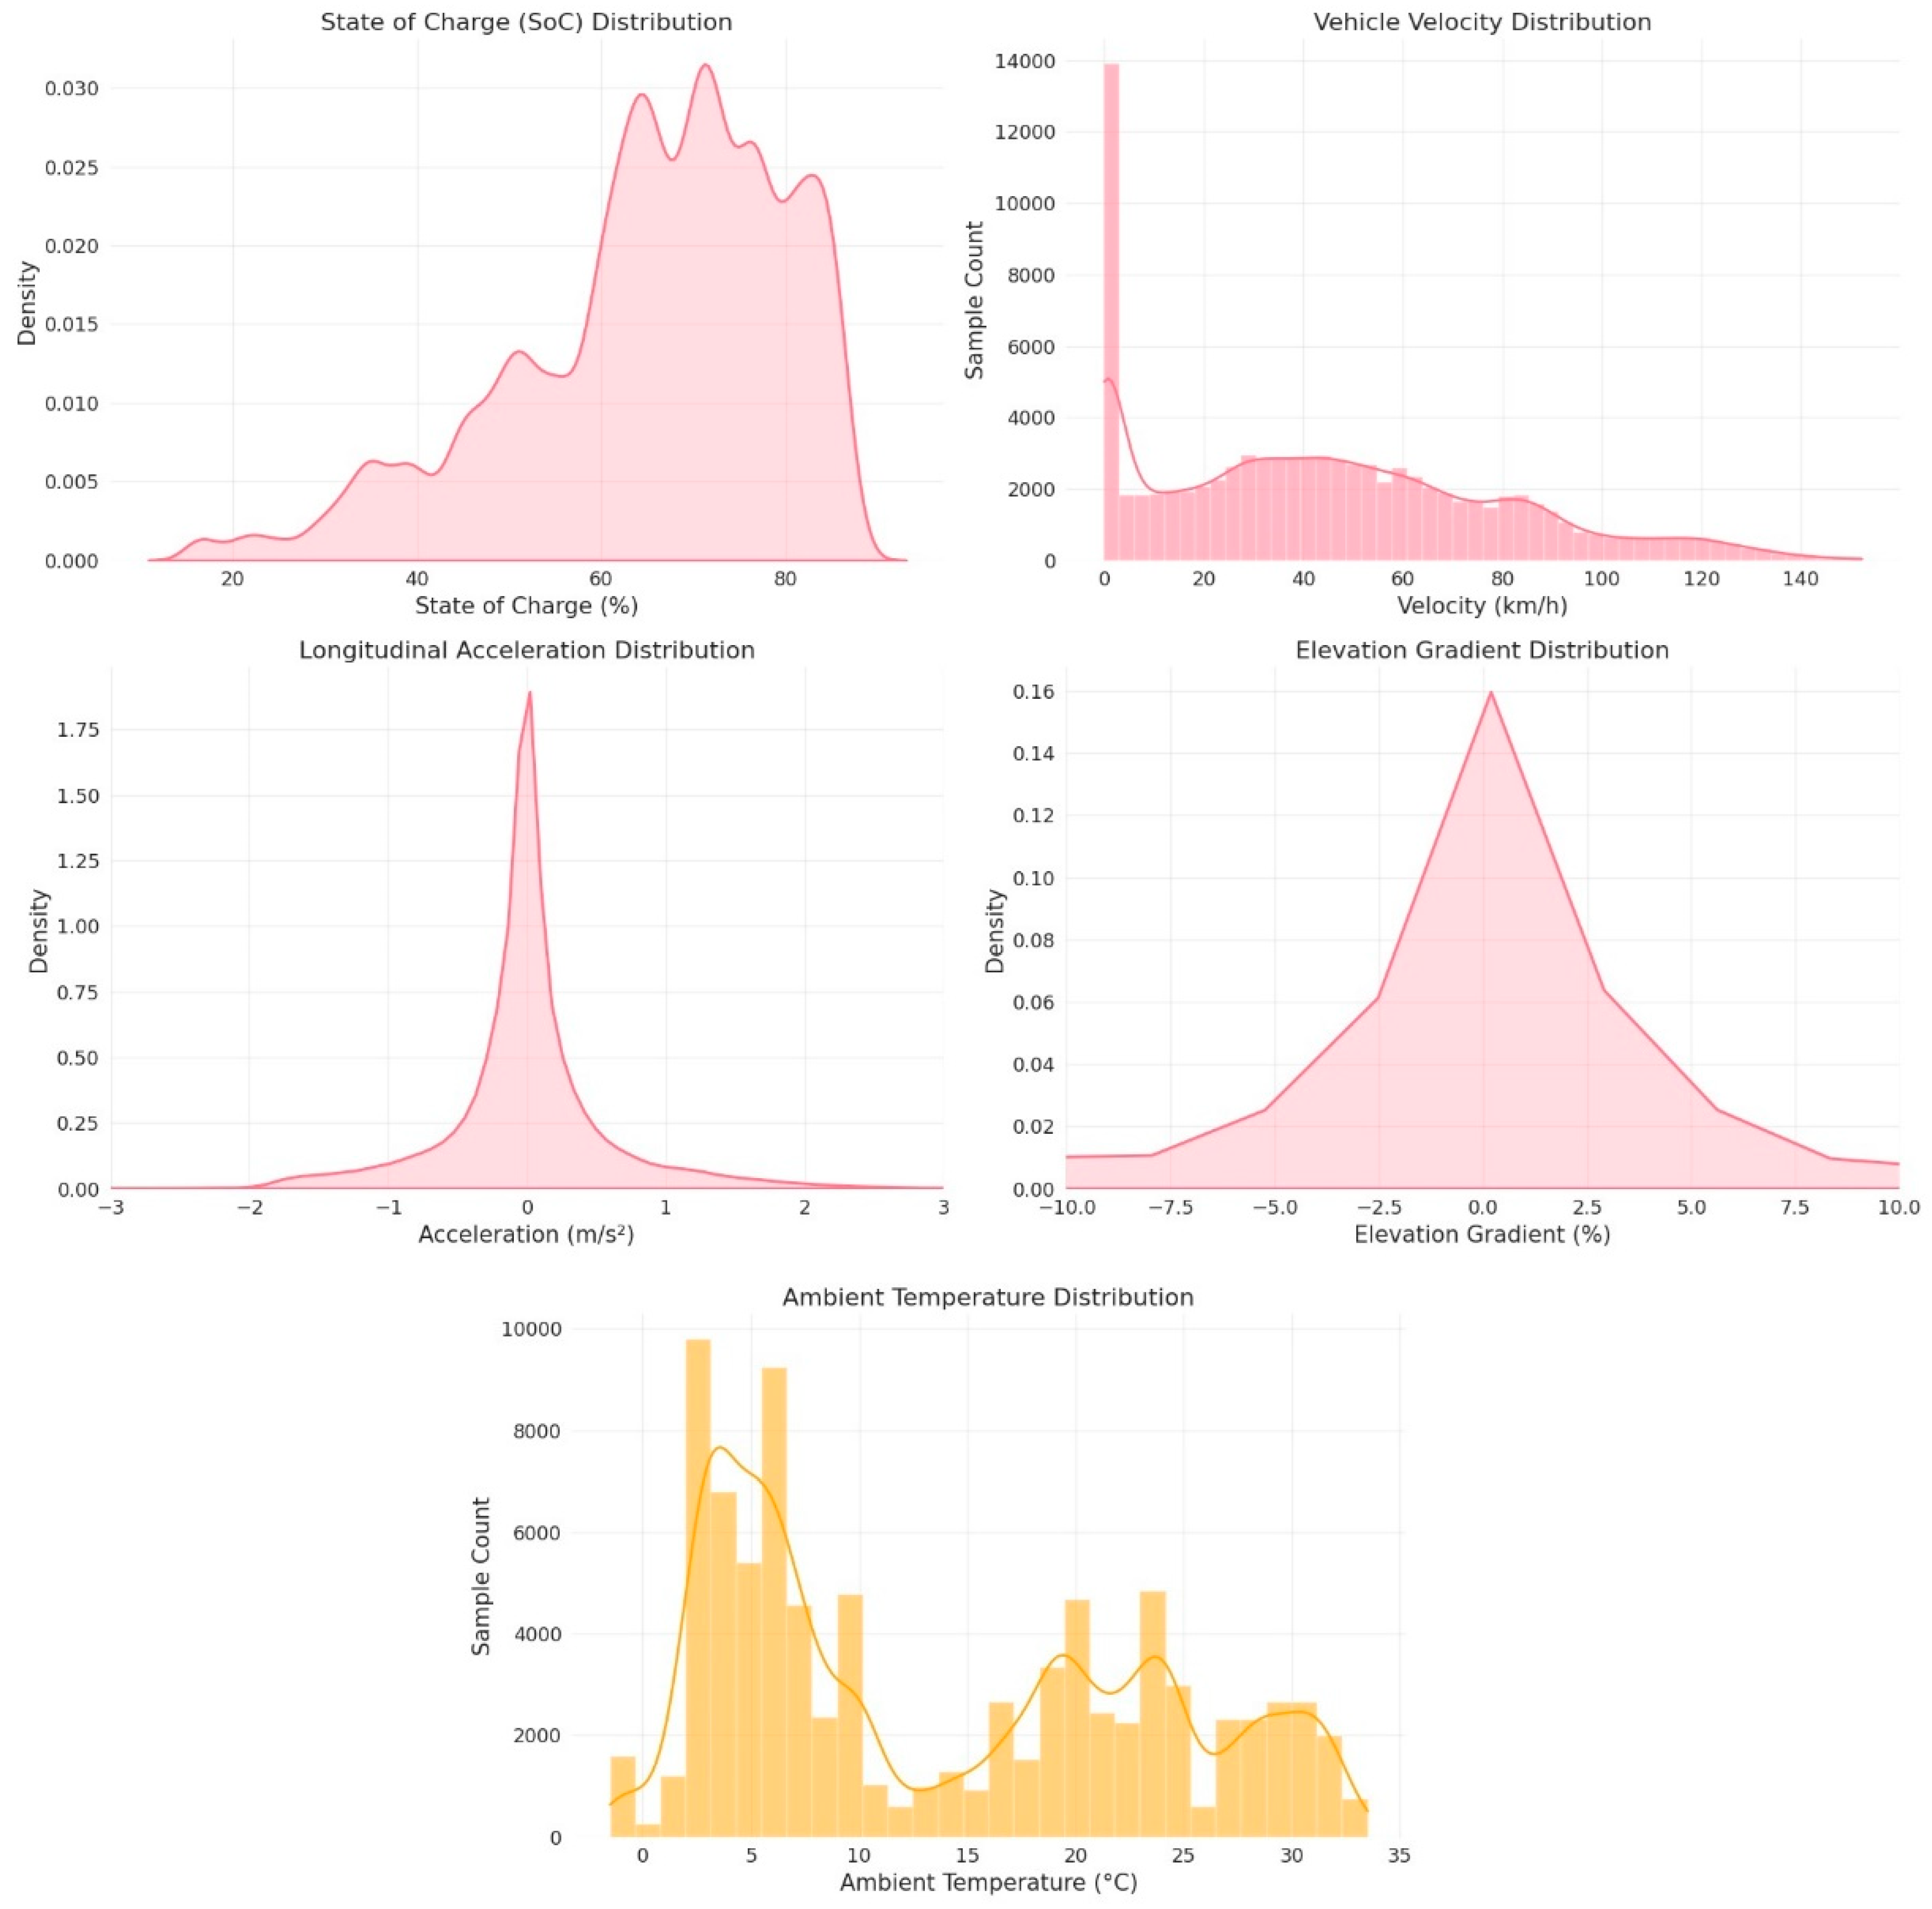
Figure 5.
Model predicions vs actual values and a residual plot for the created model.

Figure 6.
View of Vissim traffic circle model and generation of results from the SOC model for selected group of vehicles.
Figure 6.
View of Vissim traffic circle model and generation of results from the SOC model for selected group of vehicles.
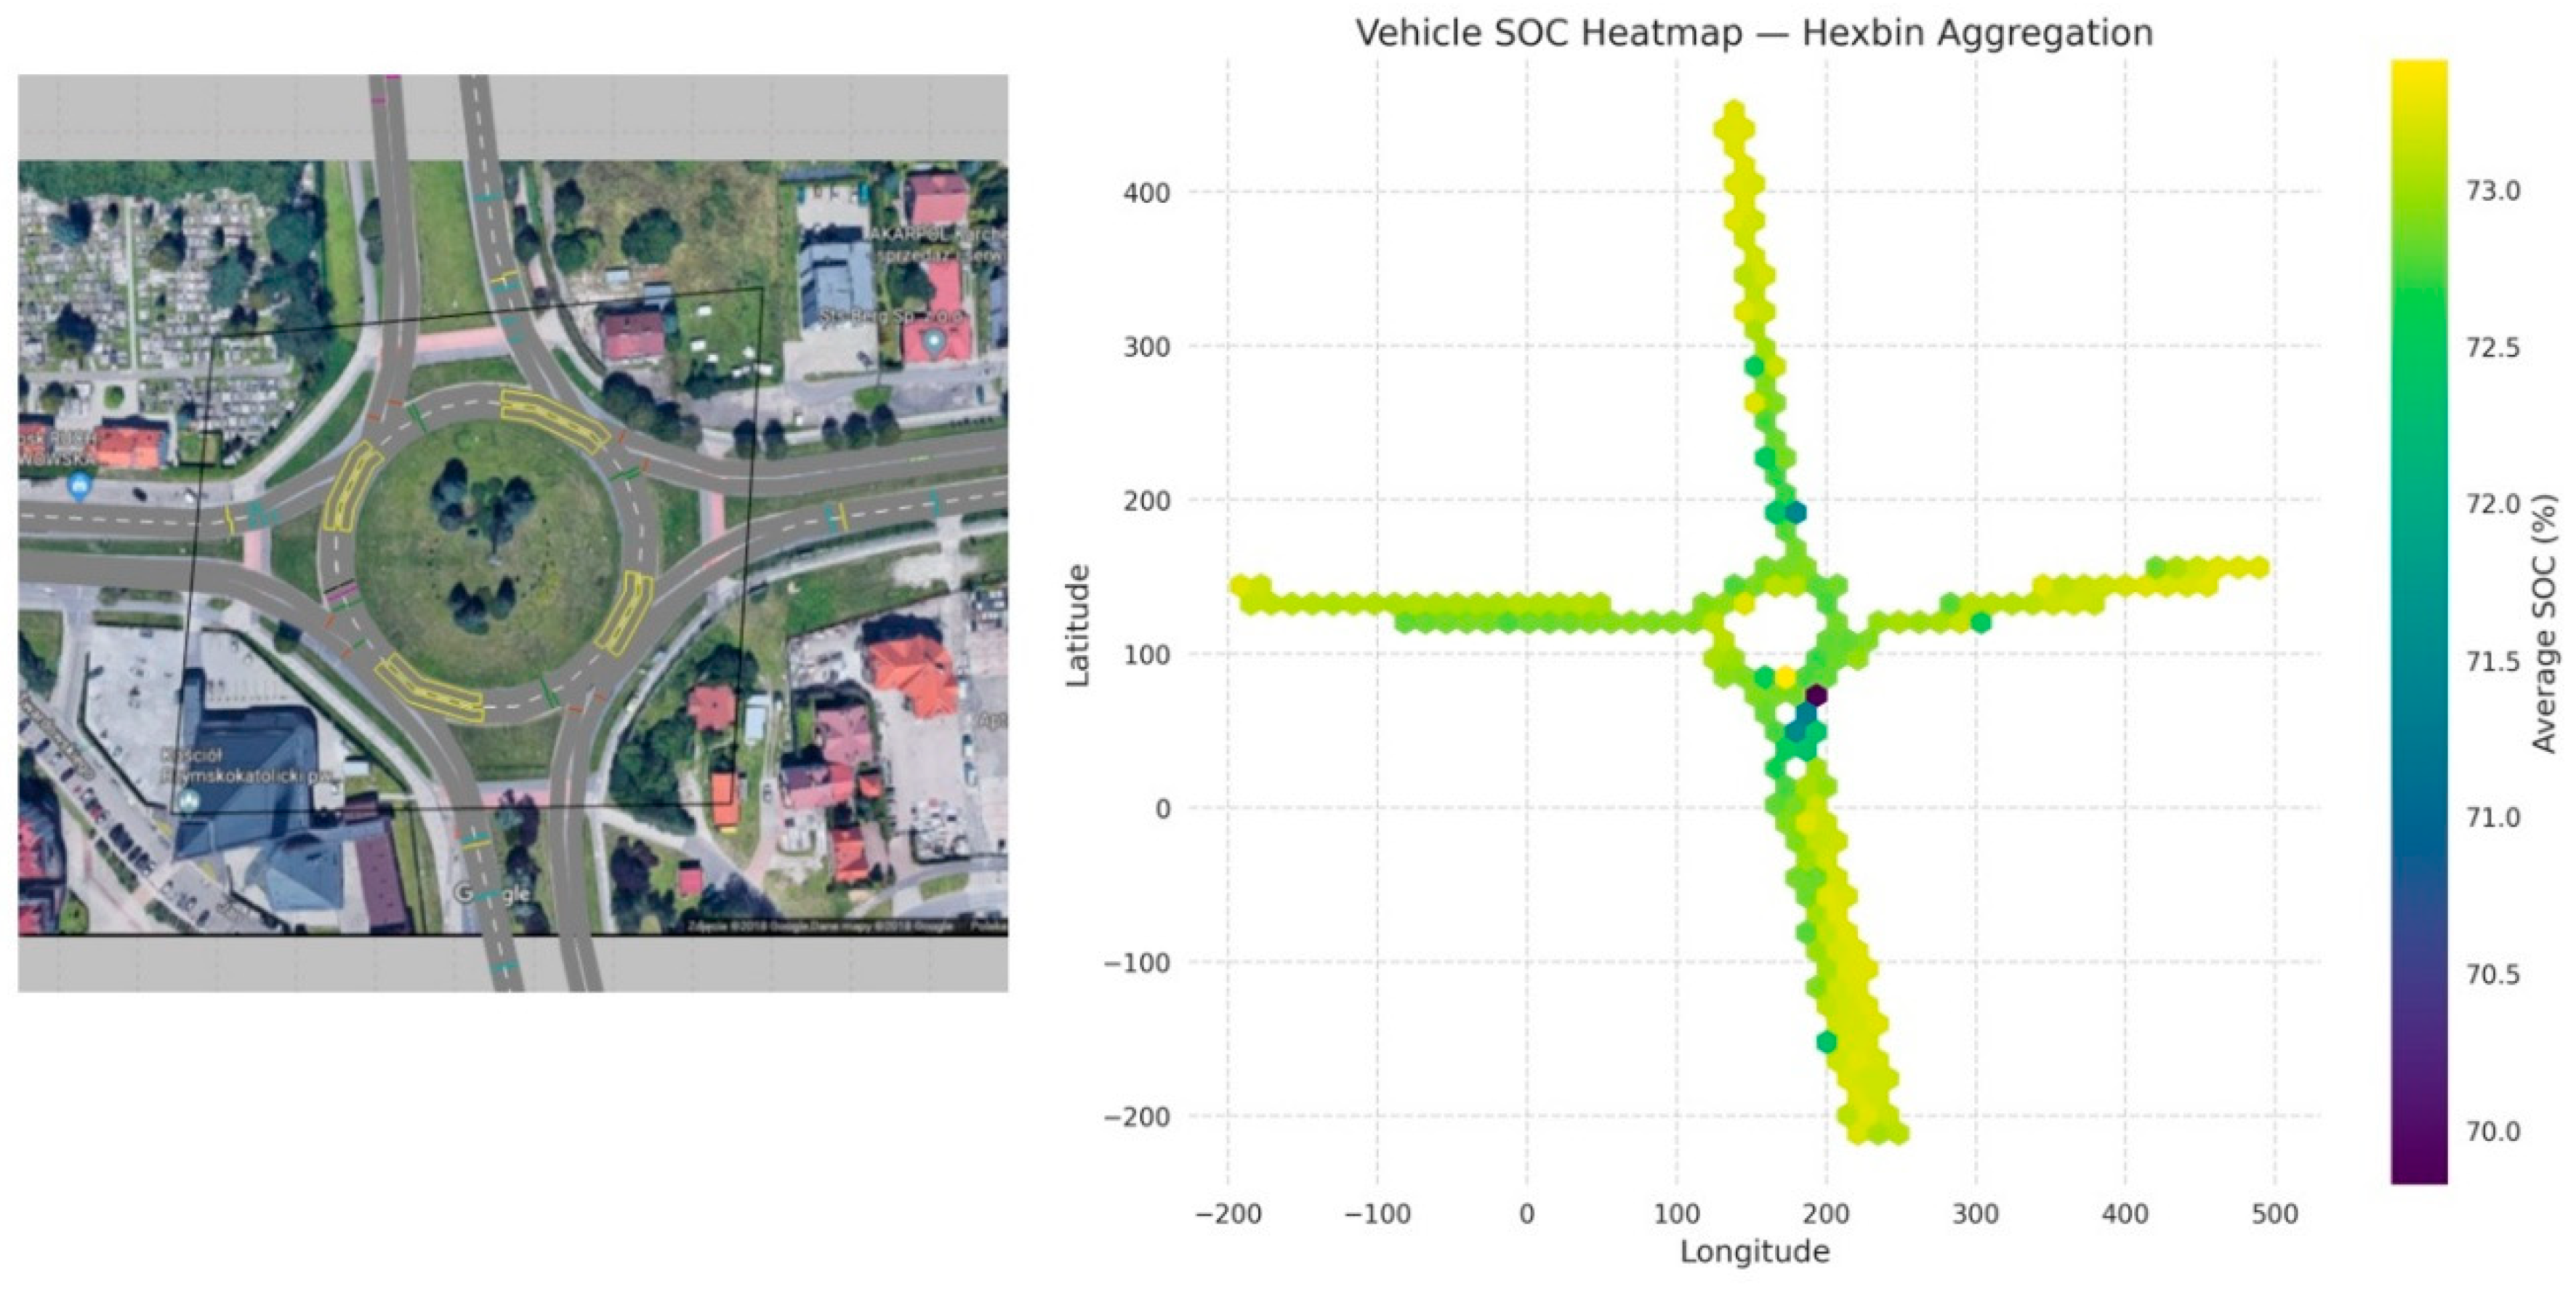
Figure 7.
View of the Vissim Expressway model and the generation of results from the SOC model.
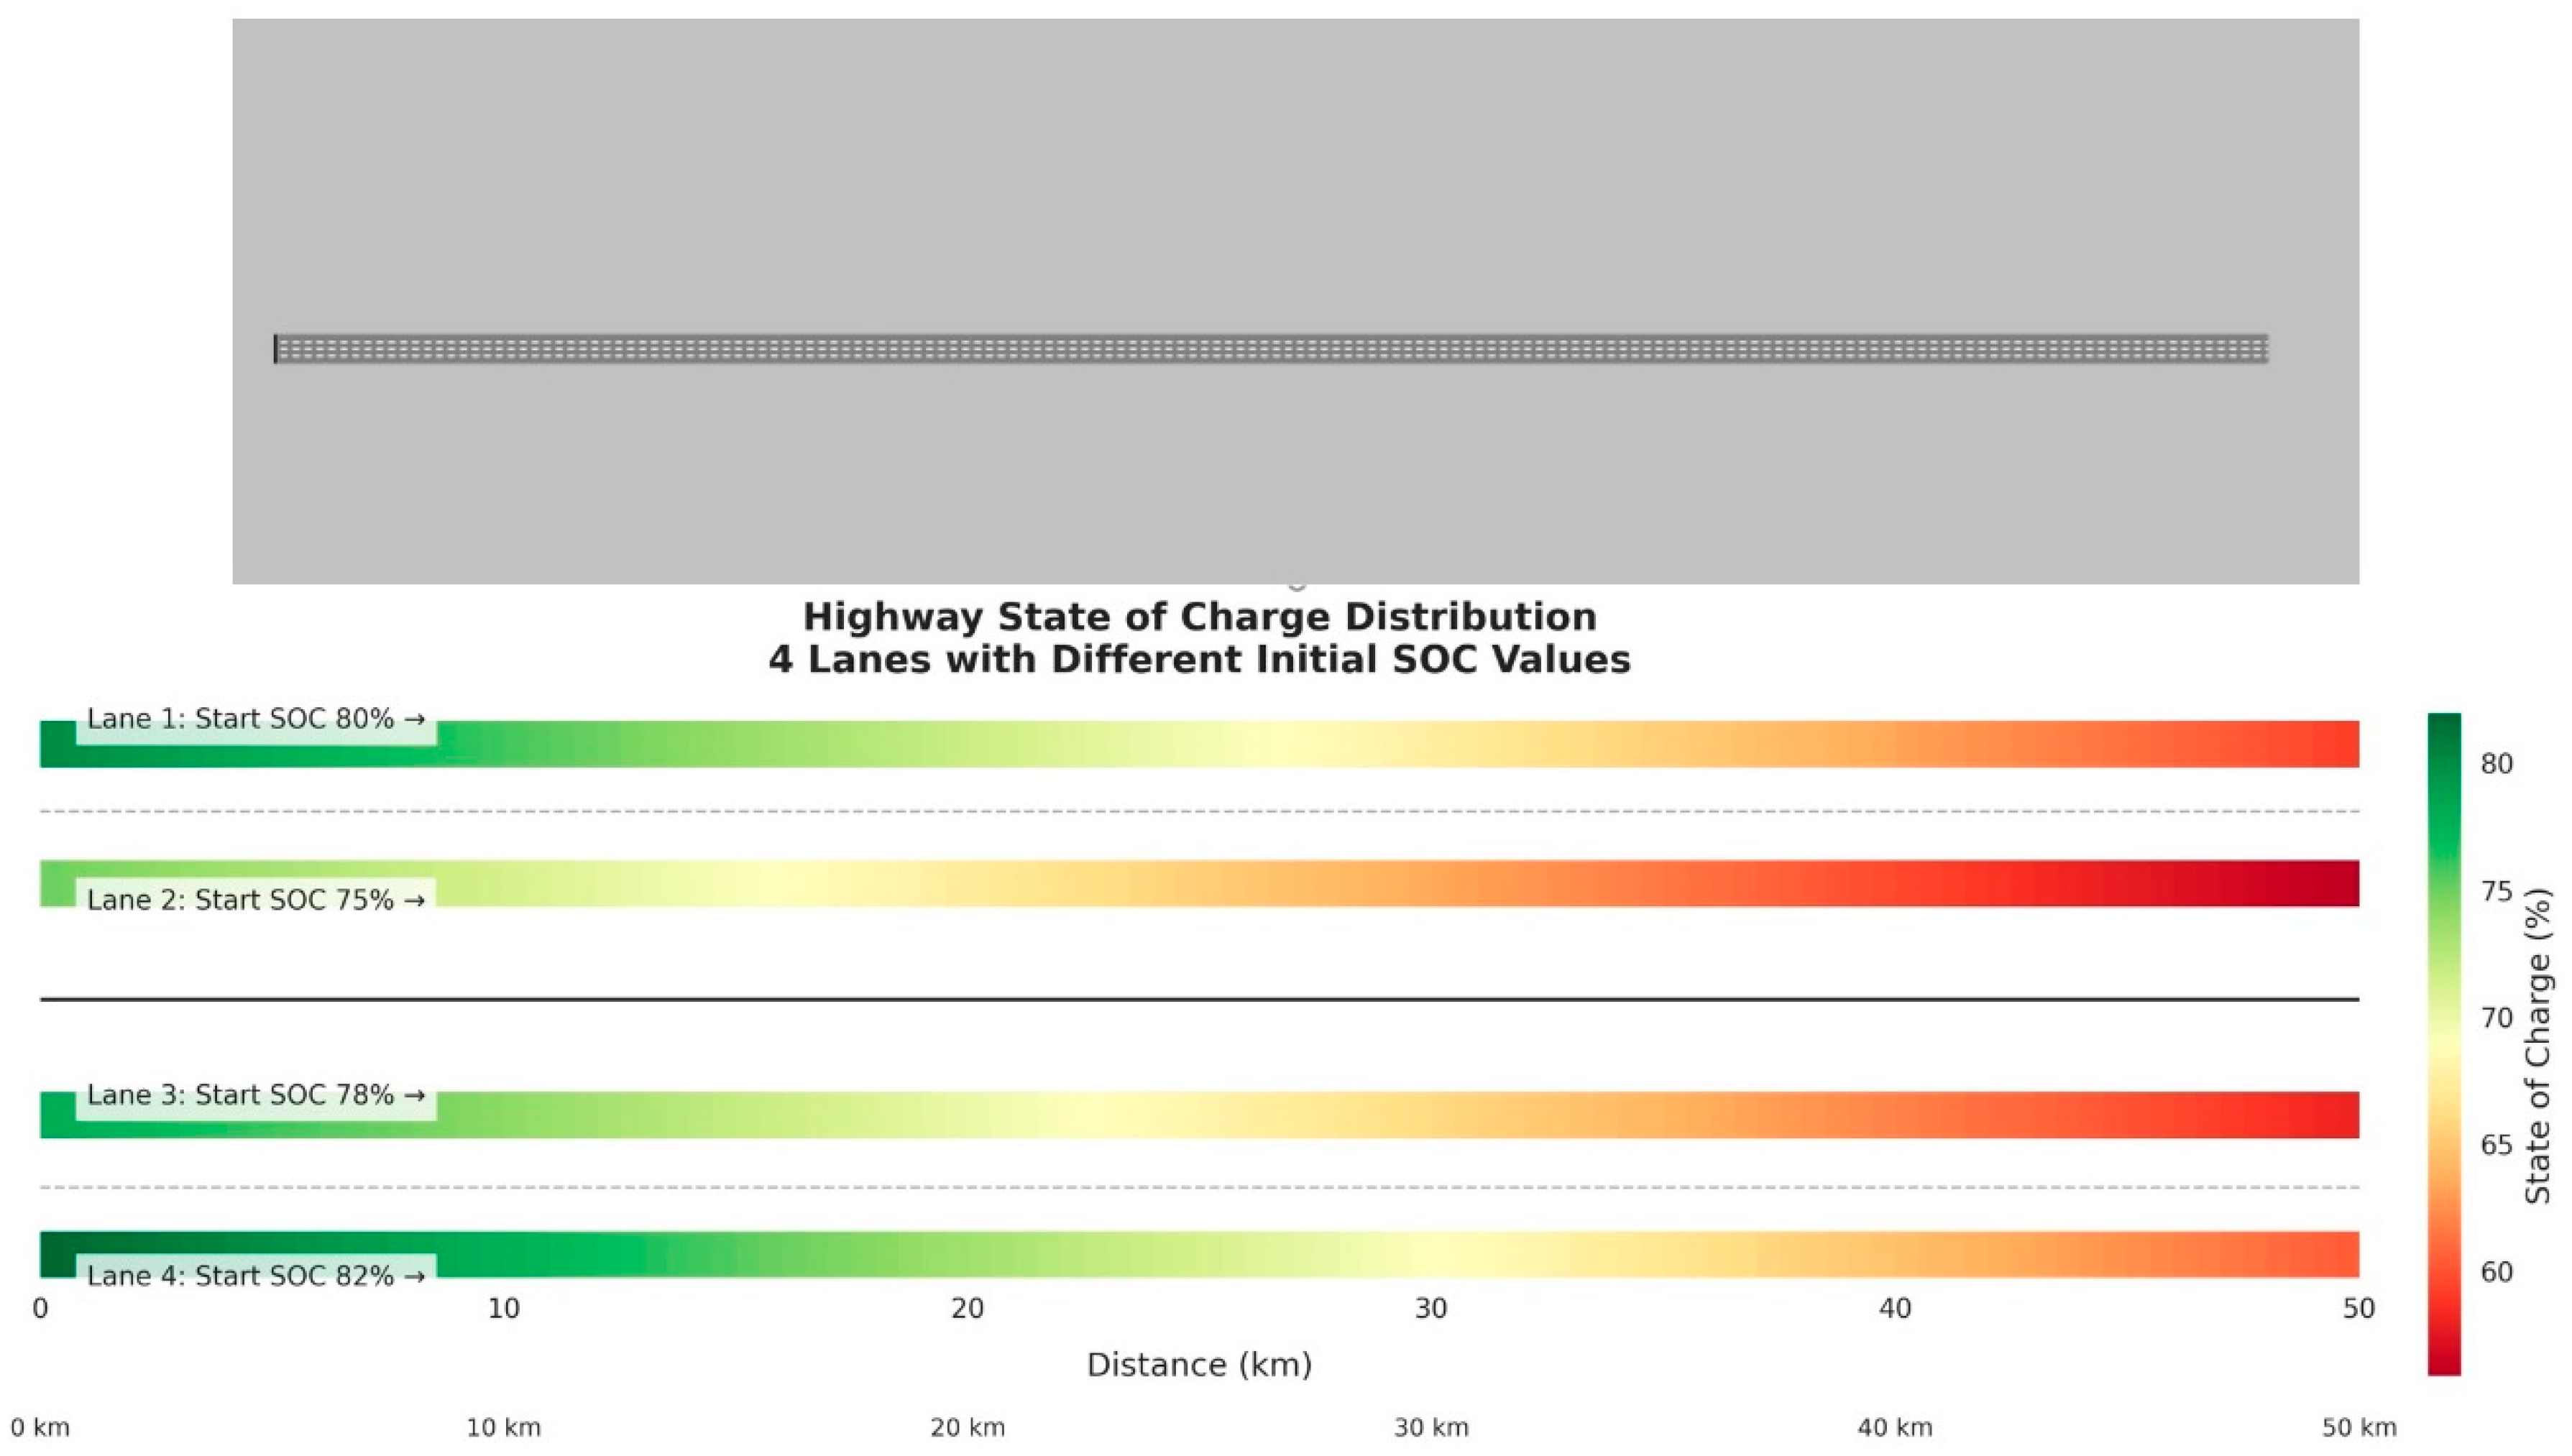
Figure 8.
The process of generating data for the map to simulate electric vehicle traffic in SUMO.

Figure 9.
SOC map generated from the model for the study region within urban driving.
Disclaimer/Publisher’s Note: The statements, opinions and data contained in all publications are solely those of the individual author(s) and contributor(s) and not of MDPI and/or the editor(s). MDPI and/or the editor(s) disclaim responsibility for any injury to people or property resulting from any ideas, methods, instructions or products referred to in the content. |
© 2025 by the authors. Licensee MDPI, Basel, Switzerland. This article is an open access article distributed under the terms and conditions of the Creative Commons Attribution (CC BY) license (http://creativecommons.org/licenses/by/4.0/).
Copyright: This open access article is published under a Creative Commons CC BY 4.0 license, which permit the free download, distribution, and reuse, provided that the author and preprint are cited in any reuse.


