Submitted:
08 May 2025
Posted:
09 May 2025
You are already at the latest version
Abstract
This study explores machine learning approaches for predicting unconfined compressive strength (UCS) of cement-treated clayey silt from northwestern Iași, Romania. Laboratory testing generated 185 UCS measurements examining the influence of cement content, curing period, and compaction rate. Exploratory data analysis revealed strong correlations between UCS and cement content and moderate correlations with curing period, while compaction rate showed minimal impact. Multiple regression algorithms were evaluated using a nested cross-validation framework with Bayesian hyperparameter optimization. Random Forest demonstrated superior performance when trained on the complete dataset. Feature importance analysis confirmed cement content and curing period as the dominant factors influencing strength development. The model enables geotechnical engineers to predict stabilized soil strength without extensive laboratory testing, supporting efficient design of ground improvement works. The methodology demonstrates the potential of data-driven approaches in geotechnical engineering applications, with both original data and the trained model made publicly available to support further research and practical implementation.
Keywords:
soil-cement
; unconfined compression strength
; soil stabilization
; cement treatment
; machine learning
; ground improvement
1. Introduction
Soil stabilization using cement is a widely implemented technique in geotechnical engineering to enhance the mechanical properties of fine-grained soils, particularly those with poor load-bearing capacities. This technique is commonly applied in foundation systems, pavement layers, embankments and slope stability projects where soil properties such as compressibility, permeability and shear strength require improvement [1]. The early strength development of cement-treated soils primarily occurs through cement hydration whereas pozzolanic reactions (clay minerals interaction with calcium hydroxide ()), carbonation (atmospheric carbon dioxide () infiltration of cementitious materials and reaction with hydrates like and calcium silicate hydrate (C–S–H)), and suction development, leading to long-term stability in engineering applications [2,3].
The effectiveness of cement-treated soil is governed by a complex interplay of various strength-determining factors; thus the soil’s physicochemical characteristics (such as the particle size distribution, density, porosity and Atterberg limits), compaction parameters (moisture content and dry density at the time of compaction), the type and proportion of cement used, as well as curing duration and conditions [4,5]. Fine-grained soils such as silts and clays exhibit significant strength variation depending on their physicochemical properties and the effectiveness of cement bonding [6]. In this study, the static compaction rate applied to the samples is also a determinant in the effectiveness of the soil treatment. This is related to the porosity-to-volumetric cement content ratio which is a crucial parameter affecting the unconfined compressive strength (UCS) of cement treated soils. This directly affects the cementation efficiency and the development of a stable soil matrix [1].
Empirical models have traditionally been used to estimate the UCS of cement-treated soils, relying on simplified relationships between soil properties and cement content. However, these models are often limited in their applicability due to the variability of soil types and the inability to account for complex interactions among strength-controlling factors [6]. Recent advances in predictive modeling, including artificial intelligence (AI) and machine learning (ML) techniques, have enabled more accurate and data-driven assessments of soil stabilization performance [1]. This study employs varying static compaction velocities (0.75 mm/min, 1.0 mm/min and 1.25 mm/min) in the preparation of cement-treated soil specimens. This is aimed at having a controlled investigation of the influence of compaction rate on sample density, microstructure and ultimately the UCS. By incorporating different cement contents (2.5%, 5.0%, 7.5%, and 10%) and subjecting specimens to curing durations of 24 hours, 7 days, 14 days, and 28 days, this methodology provides critical insights into how compaction energy and cement dosage interact over time to affect strength development. The range of cement percentages was deliberately selected to cover various applications in geotechnical engineering – from lower dosages typically used in road subgrade stabilization (2.5-5%) to higher contents often employed in deep soil mixing and ground improvement applications (7.5-10%). This comprehensive range allows us to evaluate strength development across the spectrum of common cement treatment applications. Previous studies have demonstrated that silty clay soils, used in this study, with high moisture content, such as those in naturally soft deposits, require careful optimization of the cement-to-soil ratio to ensure adequate performance in engineering applications [7]. Given the complexity of cement-treated soil behavior, adopting varying compaction velocities and advanced modeling techniques can improve the prediction and optimization of UCS which can lead to a more efficient and reliable stabilization practices.
1.1. The Importance of Using the UCS as a Design Parameter
The UCS serves as a direct indicator of the soil’s ability to withstand axial loading without lateral confinement [8]. This makes it essential for assessing the stability and performance of foundations, embankments and other soil-structure interactions. In order to facilitate the optimization of soil-cement mixtures, accurate determination of UCS is critical in ensuring that the treated soil meets the required strength criteria for specific engineering applications [9]. Moreover, UCS values are integral to the calibration and validation of predictive models, such as artificial neural networks (ANNs), which aim to forecast the behavior of stabilized soils under various loading conditions [10]. Making UCS a part of design protocols enhances the reliability and safety of geotechnical structures since it provides a quantifiable measure of soil improvement efficiency.
Furthermore, UCS testing offers a relatively simple and cost-effective means of obtaining vital data on soil strength. It also enables timely and informed decision-making during the design and construction phases. UCS is a straightforward procedure and allows for rapid assessment of soil properties, which is particularly advantageous in large-scale projects where time and resource efficiency are paramount. Additionally, understanding the UCS of cement-treated soils aids in the selection of appropriate cement types and dosages, contributing to more sustainable and economical construction practices [11]. UCS ultimately helps engineers to better predict and mitigate potential issues related to soil deformation and failure, thereby extending the lifespan and functionality of geotechnical infrastructures.
1.2. Challenges in Predicting UCS Through Traditional Methods
Traditional methods for predicting UCS of cement-treated soils rely on empirical correlations that consider factors such as cement content, water content and curing time. However, these correlations face major challenges due to the complex interplay of variables influencing UCS. Some of these variables include the soil type with its variable properties, particle size distribution and environmental conditions (pH, organic content, groundwater chemistry etc.). Soils are highly heterogeneous with their properties varying significantly even within a small area. This variability makes it difficult to develop accurate predictive models using traditional methods. Thapa and Ghani [12], in a study of AI-based models to predict UCS in soft soils, found that predicting UCS with traditional methods struggled with the high variability in soil properties which lead to inaccurate predictions. They went on to propse a non-destructive soil UCS measurement technique using robust AI-based models which improved predicition accuracy. Also, Zhang et al. [8] highlighted that the mixture of water-to-cement ratio can broadly characterize the effects of cement content and water content on the UCS of cement-stabilized clay, yet traditional models do not adequately capture this complex relationship.
Traditional methods often lack the flexibility to account for the non-linear and site-specific nature of soil behavior. Jeremiah et al. [10] emphasized that while ANNs have been applied to predict geo-mechanical properties of stabilized clays, traditional empirical methods may not effectively capture the complex relationships between input variables and UCS outcomes. Additionally, Mozumber and Laskar [13] demonstrated that ANNs could estimate the UCS of stabilized clayey soil with higher accuracy compared to traditional regression models which underscores the limitations of the traditional methods in handling complex datasets.
Traditional empirical methods often require laborious laboratory testing of samples and well-log analysis for large projects, which are both resource-intensive and time-consuming. Due to human error, the over reliance on these methods can lead to inaccurate estimation of UCS which could potentially compromise the safety and performance of geotechnical structures. Standard prediction methods might overestimate the UCS of cement-treated silty clay cured for extended periods, indicating a discrepancy between predicted and actual strength values [14]. Moreover, the inability of traditional models to incorporate real-time data and adapt to varying field conditions limits their practical applicability. Additionally, field application presents challenges related to mixing technique variability, operator skill differences, and equipment limitations – factors that traditional empirical methods rarely incorporate but which significantly impact the final properties of stabilized soil. As a result, there is a growing need for advanced predictive models that can accommodate the multi-layered factors affecting UCS and enhance their reliability in soil stabilization practices.
Machine learning (ML) algorithms offer a highly accurate and efficient alternative to traditional geotechnical methods to predict various soil properties, including UCS. They not only reduce the time and cost associated with laboratory testing, but also adapt well to different types of soils and stabilization techniques, making them a valuable tool in geotechnical engineering.
ML models such as artificial neural networks (ANN), gradient boosting (GB), and convolutional neural networks (CNN) have shown high precision in predicting UCS. For example, ANN models achieved an R2 of 0.947 and 0.923 in predicting the UCS of soil-lime mixtures, while CNN models reached an R2 of 0.9938 for stabilized soils [15,16,17]. Techniques like boosted Decision Tree Regression (DTR) and Radial Basis Function (RBF) models have shown exceptional performance, with R2 values exceeding 99% in some cases, indicating their robustness in UCS prediction [18,19].
2. Materials and Methods
2.1. Characterization of the Materials Used
2.1.1. Soil Samples
Soil samples were collected from a site in the Copou area of Iași, Romania, at depths of 1 to 2 meters to capture variations in subsurface soil characteristics. To preserve in-situ moisture levels, the samples were carefully retrieved as both monoliths and bagged specimens, promptly sealed in airtight containers to minimize moisture loss, and transported to the laboratory for analysis.
A comprehensive set of geotechnical tests was conducted to characterize the soil’s physical properties. Grain size distribution, determined through hydrometer analysis in compliance with STAS 1913/5-85 [20], revealed a composition dominated by silt (64%), followed by clay (27%) and sand (9%). Atterberg limits testing yielded a liquid limit (LL) of 36%, plastic limit (PL) of 24%, and plasticity index (PI) of 12%.
According to the current European standard EN ISO 14688-2:2018 [21], fine soils or fine fractions within coarse composite soils should be classified primarily based on their plasticity characteristics, using the Casagrande plasticity chart. In this case, the material would fall in the medium plasticity clay (ClM) region, albeit near the boundary with silt. However, the material exhibited characteristic silt behavior, including rapid disintegration in water and low cohesion when dry. These behavioral observations, combined with the predominant silt fraction (64%), led to the identification of the soil as clayey SILT (clSi) according to the EN ISO 14688-1:2018 [22]. Thus, while the plasticity-based classification places the soil within the clay category, its actual behavior and granulometric composition justify its identification as clayey silt.
Further laboratory assessments quantified the soil’s bulk unit weight () as 16.87 kN/m3 and moisture content (w) of 20.24%. The material had a void ratio (e) of 0.87 and a degree of saturation () of 0.62, indicating slightly moist conditions. Compaction testing identified an optimum moisture content (OMC) of 14.9% and a maximum dry unit weight () as 15.37 kN/m3 critical for evaluating its engineering behavior under densification.
2.1.2. Portland Cement (PC)
The cement that was used for the stabilization of the soil is Portland Cement (PC) type CEM II/B-M(S-LL) 42.5 R. This is a composite cement that conforms to the European standard EN 197-1 [23] and has rapid strength development and efficacy in geotechnical applications. It also has the ability to enhance soil mechanics through hydration reactions. These reactions involve primary clinker phases; tricalcium silicate (), dicalcium silicate (), tricalcium aluminate () and tetracalcium aluminoferrite (). This generates calcium silicate hydrate (C-S-H) and calcium hydroxide (), forming rigid matrices that bind soil particles [24]. The cement comprises 65–79% clinker, 6–20% granulated blast furnace slag (S) and 6–20% limestone (LL) by mass [23]. Its chemical composition is characterized by 56.2% CaO, 19.8% , and 7.1% , among other oxides [25]. These ensure the PC having a minimum compressive strength of 42.5 MPa at 28 days, qualifying it as a high-early-strength cement (denoted by "R"). The inclusion of slag improves sulfate resistance and long-term durability by refining pore structures and mitigating deleterious expansive reactions [26,27], while limestone enhances particle packing and fresh-state workability [28]. In soil stabilization, these attributes contribute to increased load-bearing capacity, reduced plasticity and enhanced resistance to environmental degradation. However, successful application necessitates careful evaluation of site-specific variables, including soil mineralogy, organic content and curing regimes, to ensure compatibility and long-term performance [29]. Table 1 gives the detailed chemical composition of the PC.
2.2. Experimental Program
2.2.1. Sample Preparation
The soil specimens were prepared by oven-drying at a temperature of , and subsequently milled and sieved. Using the dry unit weight () of 15.37 kN/m3 and optimum moisture content (OMC) of 14.9%, the samples were mixed thoroughly in airtight plastic bags to prevent moisture loss and to ensure proper hydration and bonding of the cement with the soil particles (Figure 1a).
The soil-cement mixtures were prepared using four different cement dosages (2.5%, 5%, 7.5%, and 10% by dry weight of soil). These mixtures were placed in stainless steel containers and compacted using a static compaction technique to form cylindrical samples (Figure 1c) for UCS testing. A controlled axial load was applied with a triaxial load frame to achieve the target density (Figure 1b). All samples were molded to a standard size of 3.8 cm in diameter and 7.6 cm in height. The cemented samples were compacted at three different velocities (0.75 mm/min, 1.0 mm/min, and 1.25 mm/min), while the non-cemented control samples were compacted at four velocities (0.5 mm/min, 0.75 mm/min, 1.0 mm/min, and 1.25 mm/min). Each molded sample was carefully extruded after compaction.
For cement-treated samples, a minimum of 9 specimens were prepared for each combination of cement content and curing period, with 3 replications for each compaction velocity. This resulted in at least 36 specimens for each cement percentage (across four curing periods), yielding a total of 171 cement-treated samples. Additionally, 14 samples without cement were prepared (at least 3 for each compaction velocity). The soil-cement samples were cured for periods of 1 day, 7 days, 14 days, and 28 days at a constant temperature of approximately in a desiccator (Figure 1d). The detailed breakdown of sample configurations is presented in Table 2.
2.2.2. Testing Methodology
Each of the cured soil-cement cylindrical specimen was positioned on the lower platen of the unconfined compression testing apparatus, ensuring proper alignment to prevent eccentric loading. The lower platen was elevated until the specimen established full contact with the upper platen, guaranteeing uniform stress distribution during loading. Axial load and displacement were recorded automatically via the machine’s integrated data acquisition system (Figure 2a). For specimens which exceeded the maximum axial capacity of 2.5 kN, manual proving ring and dial gauge instrumentation was employed (Figure 2b). Pre-test calibration procedures were performed to zero both the strain dial gauge and proving ring. A monotonic axial load was applied at a constant strain rate of 1.27 mm/min to evaluate the stress-strain response. Continuous monitoring of axial strain and corresponding stress values was conducted at 5-second intervals until test termination. Testing was terminated upon specimen failure (defined by visible macro-cracking or structural disintegration) or attainment of 20% vertical deformation, whichever occurred first (Figure 2c and Figure 2d). Post-failure analysis included measurement of shear plane inclination relative to the horizontal plane to characterize failure mechanisms.
2.3. Machine Learning Methodology
The complex, multi-factor relationship between cement stabilization parameters and unconfined compressive strength (UCS) presents an ideal scenario for applying machine learning techniques. Traditional empirical equations often fail to capture the non-linear interactions between cement content, curing time, and compaction parameters. This study employed supervised regression algorithms to develop predictive models for UCS estimation without extensive laboratory testing.
The modeling strategy strategy followed a systematic progression from exploratory data analysis to algorithm selection, rigorous validation, and hyperparameter optimization. This methodical approach was designed to maximize predictive accuracy while ensuring model generalizability across different soil treatment conditions. Given the relatively modest dataset size (185 observations), special attention was paid to validation techniques that would provide reliable performance estimates while minimizing the risk of overfitting.
2.3.1. Data Preprocessing and Feature Engineering
Prior to model development, the experimental dataset underwent comprehensive preprocessing to ensure data quality and enhance model performance. The preprocessing pipeline included:
Outlier Detection: Potential outliers were identified using visual boxplot analysis and Tukey’s rule [30,31], which flags values lying beyond 1.5 times the interquartile range (IQR) from the first or third quartile. Identified outliers were examined individually to determine whether they represented experimental errors or legitimate but extreme results.
Feature Scaling: While some algorithms (such as tree-based methods) are invariant to feature scaling, others (including distance-based and gradient-based methods) benefit from standardized inputs. Therefore, both original and scaled versions of the dataset were prepared, with the appropriate version supplied to each algorithm according to its requirements.
Feature Engineering: Given the known physical relationships in cement-treated soils, we considered potential interaction terms, such as the cement/water ratio and porosity/cement ratio, which have mechanistic significance in cementation processes. However, after preliminary testing, we found that models using the original features (cement content, curing period, and compaction rate) performed optimally, suggesting that the algorithms were capable of implicitly capturing the relevant interactions.
2.3.2. Algorithm Selection and Initial Screening
A diverse range of regression algorithms was initially evaluated to identify approaches best suited for UCS prediction. This comprehensive selection included traditional linear models, non-linear regression techniques, and ensemble methods:
Linear Methods: Linear Regression, Ridge Regression, Lasso Regression, and Elastic Net were included to establish baseline performance and evaluate whether linear relationships could adequately capture UCS behavior.
Linear regression models capture relationships between a dependent variable y and one or more independent variables X. A multiple linear regression model takes the form: where n is the number of instances, are coefficients, represents the ith instance of the jth predictor, and is the error term [32]. For simple linear regression (), the least squares method typically determines optimal coefficients.
Ridge regression extends linear regression by adding an L2 regularization term to the cost function, penalizing large coefficients to prevent overfitting. This approach is particularly effective with highly correlated independent variables [33]. In contrast, Lasso regression employs L1 regularization, adding a penalty proportional to the absolute value of coefficients, which can reduce some coefficients to zero, effectively performing feature selection [34]. Elastic Net combines both Ridge and Lasso approaches, balancing feature selection and coefficient shrinkage by incorporating both penalty terms [35].
Tree-Based Methods: Decision Tree, Random Forest, Gradient Boosting, XGBoost, LightGBM, and CatBoost were selected for their ability to model complex non-linear relationships and feature interactions without requiring explicit feature engineering.
Regression decision trees create a hierarchical structure by recursively partitioning data based on feature values [36]. Each internal node represents a feature-based decision, each branch an outcome, and each leaf node a predicted value. Training involves: (i) selecting features and thresholds that minimize target variable variance, (ii) splitting datasets accordingly, (iii) continuing until reaching stopping criteria such as minimum instances per leaf, and (iv) optionally pruning branches that contribute minimally to predictive power.
Random Forest builds upon decision trees by constructing multiple trees through bootstrap aggregation (bagging) and training each on a random subset of data [37]. To enhance diversity, each tree considers only a random subset of features at each split. Predictions from all trees are averaged, reducing overfitting while improving accuracy and resilience compared to a single decision tree.
Gradient Boosting creates sequential trees where each tree corrects errors made by previous trees [38]. By optimizing along the gradient descent, it progressively reduces overall error. XGBoost enhances the gradient boosting framework with regularization strategies and parallel tree construction for improved speed and performance [39]. LightGBM improves efficiency through leaf-wise tree growth rather than level-wise growth, employing techniques like Exclusive Feature Bundling and Gradient-Based One-Side Sampling for faster training with large datasets [40]. CatBoost optimizes categorical data handling through permutation-driven approaches, reducing extensive preprocessing requirements while supporting GPU training and providing model analysis tools [41].
Other Non-Linear Methods: Support Vector Regression (SVR) with radial basis function (RBF) kernel, k-Nearest Neighbors (KNN), Gaussian Process Regression, and AdaBoost were included to explore alternative non-linear modeling approaches.
SVR extends Support Vector Machine concepts to predict continuous target values [42]. It aims to find a function that approximates target values within a specified tolerance margin while minimizing model complexity. Kernel functions—including linear, polynomial, and RBF—transform input features into higher-dimensional spaces where linear separation becomes feasible.
KNN is a nonparametric approach that determines the k nearest data instances to a test point using distance metrics, typically Euclidean distance [43]. For regression tasks, it predicts target values by averaging neighbors’ values, making it conceptually simple yet effective for many applications.
Gaussian Process Regression offers a Bayesian, nonparametric technique that produces a distribution over potential functions fitting the data [44]. It defines a prior over functions using a Gaussian process, then updates with observed data to create the posterior distribution. The covariance function (kernel) characterizes relationships between data points, while the mean function is often set to zero.
AdaBoost combines multiple weak classifiers to form a strong classifier [45]. It iteratively focuses on instances misclassified by previous classifiers by adjusting their weights. This adaptive approach emphasizes challenging cases, continuing until reaching a specified number of weak classifiers or achieving an acceptable error rate.
This diverse algorithm portfolio was designed to thoroughly explore modeling capabilities across fundamentally different mathematical frameworks, as recommended in comprehensive regression algorithm surveys [46]. This systematic approach ensures identification of the most appropriate technique for this specific UCS prediction task.
2.3.3. Nested Cross-Validation Framework
Given the relatively small dataset and the considerable dispersion of UCS values, a simple train-test split was deemed insufficient for estimating model performance reliably [47,48,49]. A Nested Cross-Validation (NCV) approach was therefore employed to mitigate the risk of overfitting and provide a more robust assessment of model generalization. NCV is a rigorous procedure employed to obtain unbiased estimates of a model’s generalization performance while simultaneously performing model selection and hyperparameter tuning. Hyperparameter optimization is essential for configuring machine learning algorithms, with approaches ranging from simple grid search to advanced techniques like Bayesian optimization or Hyperband [50].
The method involves two nested loops: the outer loop partitions the dataset into distinct training and test sets, ensuring that the evaluation of the final model is conducted on unseen data, whereas the inner loop further subdivides the training data to optimize model parameters and select the best-performing model configuration. This separation of model tuning and performance evaluation is crucial to mitigate overfitting and avoid selection bias, thereby yielding more reliable performance estimates [51,52,53,54,55].
This approach ensured that hyperparameter tuning was conducted independently within inner folds, while performance estimation was carried out on separate outer folds, reducing the likelihood of overoptimistic or pessimistic model evaluations due to a lucky or unlucky data split.
The NCV procedure was implemented with a 5-fold outer cross-validation loop for performance estimation, combined with a 5-fold inner cross-validation loop for hyperparameter tuning. This nested approach allowed for a comprehensive evaluation of each model while ensuring that hyperparameters were optimized exclusively within the training data of each outer fold, avoiding data leakage into the validation process.
2.3.4. Hyperparameter Optimization Strategy
To maximize model performance, an advanced hyperparameter optimization strategy was implemented using the Optuna framework [56]. Unlike traditional grid search or random search methods, Optuna employs a Bayesian optimization approach that adaptively explores the hyperparameter space based on previous trial results, making the search process more efficient and effective.
For each algorithm, a custom search space was defined based on its specific hyperparameters:
- Random Forest: The tuning process focused on optimizing the number of estimators, tree depth, and node splitting criteria, as these parameters significantly impact the model’s ability to balance bias and variance.
- Gradient Boosting: The search space was centered around learning rate, maximum tree depth, subsampling rate, and the number of estimators, as these factors govern the model’s ability to learn from sequential errors.
- XGBoost: Given its greater flexibility, additional hyperparameters, including minimum child weight and column sampling, were explored to optimize feature selection during training.
The optimization process incorporated efficiency-enhancing features including a MedianPruner for early termination of unpromising trials, balanced exploration through 50 trials per fold with a one-hour runtime limit per model, all guided by R2 score as the optimization objective.
This approach enabled systematic exploration of hyperparameter combinations to identify configurations that maximized predictive performance while maintaining computational efficiency.
2.3.5. Model Evaluation Metrics
Multiple complementary metrics were employed to comprehensively evaluate model performance across different dimensions [57,58,59]:
Coefficient of Determination (R2) measures the proportion of variance in UCS values that is predictable from the input variables. R2 values range from 0 to 1, with higher values indicating better model fit. For geotechnical applications, R2 values above 0.9 generally indicate good predictive capability [60]. While R2 provides an intuitive measure of overall fit quality, it can be sensitive to dataset characteristics and may not fully capture prediction accuracy.
Mean Squared Error (MSE) measures the average squared difference between predicted and actual UCS values. This metric was used as the primary optimization objective during hyperparameter tuning.
Root Mean Square Error (RMSE) quantifies the average magnitude of prediction errors in the same units as the target variable (kPa). By squaring errors before averaging, RMSE gives higher weight to larger errors, making it particularly relevant for engineering applications where larger deviations may have significant consequences.
Mean Absolute Error (MAE) represents the average absolute difference between predicted and actual UCS values (kPa), providing a more intuitive measure of typical error magnitude that is less sensitive to outliers than RMSE.
Mean Absolute Percentage Error (MAPE) expresses errors as percentages relative to actual values, offering a dimensionless measure of prediction accuracy that facilitates interpretation across different scales.
Explained Variance Score (EVS) measures how well the model accounts for the variation in the data. Differences between R2 and EVS can indicate the presence of systematic bias in predictions.
Maximum Error captures the worst-case prediction scenario, which is particularly relevant for engineering applications where safety margins must account for potential prediction inaccuracies.
Median Absolute Error (MedAE) measures the median of all absolute differences between predicted and actual values. As a robust statistic, it provides insight into typical prediction error magnitude while being less influenced by outliers than MAE.
Coefficient of Variation of RMSE (CV RMSE) normalizes the RMSE by the mean of observed values, expressed as a percentage. This relative error metric facilitates comparison across different scales and enhances interpretability in engineering contexts. Values below 10% generally indicate good performance for engineering applications.
These diverse metrics enable comprehensive evaluation of model performance beyond single-dimensional assessment, facilitating the selection of models that balance different aspects of prediction quality relevant to geotechnical applications.
2.3.6. Final Model Selection and Training
Following the nested cross-validation process, final models were trained using the entire dataset to maximize predictive capability. This approach ensures that the deployed model benefits from all available information while maintaining the rigorous validation framework to prevent overfitting. For the final model training, two parameter selection strategies were implemented:
Optimal Parameter Strategy: This approach utilized Optuna’s sophisticated probabilistic modeling of the hyperparameter space to identify configurations that maximize performance across all cross-validation trials. Unlike traditional approaches that simply average parameters, Optuna’s optimization framework adaptively learns from previous trials to focus on promising regions of the hyperparameter space [56,61]. This strategy aims to develop models with robust generalization capabilities that effectively capture underlying data patterns while minimizing sensitivity to dataset peculiarities.
Best Fold Parameter Strategy: This strategy employed the hyperparameter configuration from the specific cross-validation fold that yielded the highest R2 score. While potentially more sensitive to particular data characteristics, this approach emphasizes maximum performance potential under specific conditions. Similar strategies have been employed in geotechnical applications [62], particularly when predictive accuracy for specific scenarios is the primary concern.
The deliberate implementation of these complementary strategies serves multiple critical purposes in the development of machine learning models [63,64]. First, comparing models trained with these different parameter selection approaches provides a robust evaluation of model stability: If performance metrics remain consistent despite different hyperparameter configurations, this indicates an inherent stability in the underlying algorithm when applied to the current problem domain [65]. Second, this dual approach allows for a thorough exploration of the bias-variance tradeoff; optimal parameters tend to balance bias and variance across different data distributions, while best fold parameters may achieve higher performance but with potentially increased variance [66].
3. Results and Discussion
3.1. Experimental Test Results
3.1.1. Overview of UCS Measurements
The experimental program generated a comprehensive dataset of 185 unconfined compressive strength (UCS) measurements (171 from cement-treated samples and 14 from control samples without cement). Statistical analysis (Figure 3 of these measurements revealed considerable variation in strength values, with UCS ranging from 157.47 kPa to 5054.61 kPa across all combinations of cement content, curing period, and compaction rate. The mean UCS value was 2169.93 kPa with a standard deviation of 1289.17 kPa, indicating significant dispersion across the experimental conditions. This variability underscores the complex nature of strength development in cement-stabilized soils and highlights the need for sophisticated predictive approaches that can capture these intricate patterns.
The quartile distribution further illustrates this dispersion, with the first quartile (Q1) at 989.44 kPa, the median at 2135.62 kPa, and the third quartile (Q3) at 3138.21 kPa. This relatively symmetrical distribution around the median suggests that the experimental design adequately captured the central tendency of UCS development. The interquartile range (IQR) of 2148.77 kPa demonstrates the substantial variability in strength outcomes, reflecting the complex interplay between cement content and curing period in strength development.
The wide range of UCS values observed in the experimental data (4897.15 kPa from minimum to maximum) reflects the substantial influence of the investigated parameters on strength development. The lowest UCS values were associated with untreated soil samples (0% cement), while the highest values were recorded for specimens with 10% cement content cured for 28 days. This range spans typical strength requirements for various geotechnical applications, from temporary works requiring minimal strength enhancement to permanent structures demanding substantial load-bearing capacity.
3.1.2. Primary Factors Influencing UCS Development
To comprehensively assess the dominant factors governing UCS development, correlation analysis was performed using three complementary methods: Pearson, Kendall, and Spearman coefficients. While Pearson’s coefficient measures linear relationships, Kendall and Spearman capture monotonic but potentially non-linear relationships between variables [67]. Figure 4 presents heat maps of correlation coefficients that quantify the relationships between UCS and the three experimental parameters.
All three correlation methods consistently identified cement content as the primary factor influencing UCS, with strong positive correlations (Pearson: 0.87, Kendall: 0.74, Spearman: 0.87). The slightly lower Kendall coefficient suggests some non-linearity in this relationship, supporting our observation of accelerating strength gains at higher cement percentages. This finding aligns with established geotechnical engineering principles, which recognize cement dosage as the primary design parameter for soil stabilization projects (e.g., [68,69,70,71]).
Curing period demonstrated moderate positive correlations with UCS across all methods (Pearson: 0.50, Kendall: 0.45, Spearman: 0.56), reflecting the time-dependent nature of cement hydration and strength development. The higher Spearman coefficient compared to Pearson suggests that the relationship between curing time and UCS may follow a monotonic but not strictly linear pattern. This correlation confirms that while significant strength gains occur during the initial curing period, continued strength enhancement takes place over extended timeframes as cementation processes progress.
Notably, compaction rate exhibited negligible correlation with UCS across all methods (Pearson: 0.04, Kendall: 0.03, Spearman: 0.03), suggesting that within the range investigated (0.75-1.25 mm/min), variations in compaction velocity have minimal impact on the ultimate strength development of cement-stabilized soil. This finding has important practical implications for field application, indicating that precise control of compaction rate may be less critical than ensuring adequate cement content and sufficient curing time.
The correlation patterns observed provide valuable guidance for both practical applications and predictive modeling. From an engineering perspective, these results suggest that design efforts should primarily focus on optimizing cement content and ensuring sufficient curing duration, rather than implementing stringent controls on compaction procedures. For modeling purposes, the strong correlation between cement content and UCS, coupled with the moderate correlation with curing period, indicates that these two variables should be prioritized in developing predictive algorithms for strength estimation.
3.1.3. Effect of Cement Content on Strength Development
The influence of cement content on UCS was further examined through detailed analysis of strength measurements across different cement percentages. Figure 5 presents a consolidated boxplot analysis of UCS values grouped by cement content and curing period.
The results demonstrate a clear monotonic increase in UCS with increasing cement content across all curing periods. Specimens prepared with 2.5% cement exhibited median UCS values of approximately 1000 kPa after 28 days of curing, while those with 10% cement achieved median strengths of approximately 4500 kPa over the same curing period–more than a fourfold increase. This substantial strength enhancement can be attributed to the increased formation of cementitious hydration products that bind soil particles and create a more rigid soil matrix.
A noteworthy observation is the accelerating rate of strength gain with increasing cement content. The experimental data reveals that the relationship between cement content and UCS is not strictly linear but exhibits a positive second-order component. The incremental strength increase when moving from 2.5% to 5% cement was less pronounced than the increase observed when transitioning from 7.5% to 10% cement. This non-linearity suggests that beyond a certain threshold, additional cement provides disproportionately greater strength benefits, likely due to the formation of a more continuous cementitious network throughout the soil matrix.
The physical mechanism behind this behavior can be understood through the fundamental principles of soil-cement interaction. At low cement contents (2.5%), the cementitious products primarily strengthen individual contact points between soil particles. As cement content increases to intermediate levels (5-7.5%), these localized cementation zones begin to overlap, creating stronger particle clusters. At higher cement contents (10%), a more continuous cementitious matrix forms, dramatically enhancing the soil’s resistance to deformation and failure.
Additionally, the interquartile range (IQR) of UCS values progressively expanded at higher cement percentages, particularly at 7.5% and 10%. This increased variability indicates that at higher cement contents, the stabilized soil becomes more sensitive to other factors such as mixing homogeneity, moisture distribution, and microstructural development during curing. From a practical perspective, this finding suggests that while higher cement contents yield greater strengths, they may also require more stringent quality control measures during mixing and placement to ensure consistent performance.
For geotechnical applications with moderate strength requirements (), cement contents in the range of 5-7.5% appear to offer an optimal balance between strength enhancement and economic considerations. For applications demanding higher strength levels, the 10% cement content consistently delivered UCS values exceeding 3000 kPa after 14 days of curing, making it suitable for more demanding applications.
3.1.4. Effect of Compaction Rate
The effect of compaction rate on UCS development was examined by comparing median UCS values across the three different compaction velocities (0.75, 1.0, and 1.25 mm/min) for each combination of cement content and curing period. Figure 6 presents a multi-panel boxplot visualization of these comparisons, with each panel representing a specific combination of cement content and curing time.
The detailed analysis of median UCS values across different compaction rates reveals interesting patterns. While the impact of compaction rate appears less dominant than cement content and curing period, the relative differences between compaction rates were not entirely negligible for certain combinations. For most cement content and curing time combinations, the relative differences between median UCS values at different compaction rates ranged from approximately 1% to 9%. However, several combinations exhibited more substantial variations.
For specimens with 5% cement after 1 day of curing, the relative difference between compaction rates of 0.75 mm/min and 1.0 mm/min reached approximately 20%, with the higher compaction rate producing greater strength. Similarly, for 5% cement specimens cured for 28 days, the difference between compaction rates of 1.0 mm/min and 1.25 mm/min was also around 20%, though in this case, the lower compaction rate yielded higher strength. For 10% cement specimens after 1 day of curing, the difference between compaction rates of 1.0 mm/min and 1.25 mm/min was roughly 15%, with the higher compaction rate producing greater strength.
These more pronounced differences were primarily observed at either very early curing times (1 day) or relatively high cement contents (10%), suggesting that compaction rate may have a more noticeable effect under specific conditions. At early curing times, the soil-cement mixture is still developing its initial structure, and the rate of compaction might influence particle rearrangement and initial cement hydration. For higher cement contents, the greater quantity of cementitious material may make the mixture more sensitive to compaction procedures.
However, it is important to note that no consistent pattern emerged across all combinations. The relationship between compaction rate and UCS did not follow a uniform trend, with some cases showing higher strength at increased compaction rates and others showing the opposite. For many combinations, particularly at intermediate curing periods (7 to 14 days), the differences were relatively modest (typically below 5%).
These observations should be interpreted within the specific context of this experimental program, which utilized a particular soil type and a relatively narrow range of compaction velocities. Furthermore, all specimens were compacted to the same target density regardless of compaction rate, which likely contributed to the generally modest differences in strength outcomes for most combinations.
From a practical perspective, these findings suggest that while compaction rate may not be the dominant factor governing UCS development in cement-stabilized soils, it can still influence strength characteristics under specific conditions, particularly during early curing or at higher cement contents.
For routine applications with intermediate cement contents (5-7.5%) and standard curing periods (7-28 days), the influence of compaction rate variations within the studied range appears generally limited (typically less than 7% difference).
For predictive modeling purposes, these results indicate that while cement content and curing period should remain the primary variables, incorporating compaction rate as a secondary factor might enhance model accuracy for certain specific combinations, particularly those involving high cement contents or early strength assessment.
3.2. Model Performance Comparison
After establishing the experimental relationships between soil stabilization parameters and UCS through laboratory testing, predictive models were developed to estimate strength development without the need for extensive physical testing. This section presents the performance analysis of various machine learning algorithms and the detailed evaluation of the final selected model.
Following the experimental characterization of cement-treated soil behavior, this section presents the development and evaluation of machine learning models for predicting unconfined compressive strength. These predictive models aim to provide reliable UCS estimates based on cement content, curing period, and compaction rate parameters, reducing the need for extensive laboratory testing in future applications. The analysis begins with an initial screening of various algorithms, followed by rigorous validation of the most promising candidates, and concludes with a detailed assessment of the optimal model’s performance.
3.2.1. Initial Model Screening Results
The initial screening phase evaluated 14 regression algorithms using a conventional train-test split. The dataset was divided into 80% training data and 20% testing data, allowing for a straightforward evaluation of model accuracy before implementing more advanced techniques such as cross-validation and hyperparameter tuning. Table 3 presents the performance metrics of each model in terms of mean squared error (MSE), root mean squared error (RMSE), mean absolute error (MAE), and R-squared (R2) score.
The results revealed distinct patterns in model performance. Linear models (Linear Regression, Ridge, Lasso, and Elastic Net) achieved moderate R2 values ranging from 0.76 to 0.84, with RMSE values between 479 and 588 kPa. The relatively limited performance of these models indicates that UCS development in cement-stabilized soils follows non-linear patterns that cannot be adequately captured by linear relationships.
In contrast, tree-based ensemble methods demonstrated superior predictive capability. Gradient Boosting achieved the highest accuracy with an R2 of 0.96 and RMSE of 253 kPa, followed closely by Random Forest (R2 = 0.95, RMSE = 265 kPa) and LightGBM (R2 = 0.95, RMSE = 270 kPa). These algorithms effectively captured the complex, non-linear interactions between cement content, curing period, and UCS. Support Vector Regression (SVR) with an RBF kernel performed notably poorly (R2 = 0.02), suggesting that the chosen kernel configuration was unsuitable for this particular prediction task. Other algorithms, including Decision Tree, XGBoost, CatBoost, KNN, Gaussian Process, and AdaBoost, demonstrated good performance with R2 values around 0.94, but did not match the accuracy of the top-performing ensemble methods.
The substantial performance gap between linear and tree-based models () supports the hypothesis that UCS development in cement-treated soils is governed by complex, nonlinear processes that cannot be adequately captured by simple parametric relationships. Similar nonlinear dependencies have been documented in previous research on various geotechnical properties [72,73,74,75,76].
Based on these initial screening results, three algorithms—Random Forest, Gradient Boosting, and XGBoost—were selected for further optimization and rigorous evaluation through nested cross-validation.
3.2.2. Nested Cross-Validation Results
Following the initial screening, the dataset was further refined to remove outliers that could potentially compromise model generalization. After grouping the UCS values based on curing period and cement percentage, 10 anomalous measurements were identified that deviated significantly from the expected patterns. These outliers were carefully scrutinized to determine whether they stemmed from experimental inconsistencies or natural variability. Upon analysis, these data points were found to represent experimental anomalies rather than valid extreme cases and were excluded from subsequent modeling to improve the robustness of the predictive models.
The refined dataset, consisting of 175 observations, was then used for the rigorous evaluation of the three top-performing algorithms (Random Forest, Gradient Boosting, and XGBoost) through nested cross-validation with Bayesian hyperparameter optimization. This approach ensured that the developed models would generalize effectively to new data while maintaining high prediction accuracy. Table 4 presents the cross-validated performance metrics.
These metrics show that all three models performed exceptionally well, with Random Forest achieving marginally better results across all metrics. The R2 values are very close to each other (within 0.002), indicating that all three ensemble methods captured the underlying patterns in the data effectively. The standard deviations (approximately 0.01 for all models) demonstrate consistent performance across different data partitions, suggesting robust generalization capabilities.
The RMSE values range from approximately 221 kPa (Random Forest) to 227 kPa (XGBoost), representing about 10% of the mean UCS value in the dataset. The MAE values follow a similar pattern, with Random Forest showing the lowest average absolute error at 152.58 kPa. Notably, Random Forest achieved a substantially lower MAPE (7.41%) compared to Gradient Boosting (9.52%) and XGBoost (9.02%), indicating better relative accuracy across the UCS range.
The cross-validation results confirmed that all three tree-based ensemble methods could effectively capture the complex relationships governing UCS development in cement-stabilized soil. The consistency across different validation folds suggested that these models would maintain reliable performance when applied to new, unseen data from the same experimental domain.
3.2.3. Final Model Performance Analysis
After evaluating model performance through Nested Cross-Validation (NCV) with Optuna optimization, the subsequent step involved training the final models using the entire available dataset. This approach ensures that all models benefit from the complete information contained in the dataset, enhancing their robustness and predictive capability for practical applications in cement-stabilized soil strength prediction [77,78,79].
During the NCV process, the dataset was strategically partitioned to facilitate rigorous performance evaluation and hyperparameter optimization. While this method provides an unbiased estimate of model performance, each model in the cross-validation process is trained on only a subset of the available data. To fully leverage all information and enhance generalization capabilities, we retrained our final models on the entire dataset using hyperparameters identified through Optuna’s advanced optimization techniques [52,80].
As described in the Methodology section, two parameter selection strategies were implemented: the Optimal Parameter Strategy that prioritizes robust performance across all cross-validation folds, and the Best Fold Parameter Strategy that employs configurations from the highest-performing individual fold. Table 5 presents the key hyperparameter configurations for each model under both parameter selection strategies.
Examining the structural differences between optimal and best fold configurations (as shown in Table 5) provides valuable insights into the hyperparameter sensitivity of different algorithms [81]. For instance, significant performance differences between the two configurations would indicate high sensitivity to hyperparameter selection, warranting additional caution during deployment. Conversely, similar performance despite different configurations suggests multiple viable solutions within the hyperparameter space—a desirable characteristic for practical engineering applications where data distributions may gradually shift over time [64].
Additionally, this comparative approach mitigates the risk of overfitting to the validation procedure itself, a phenomenon that can occur when optimization focuses too narrowly on a specific performance metric or dataset partition [52]. By maintaining multiple parameter selection strategies, we establish a more comprehensive understanding of model behavior across different conditions, enhancing confidence in the final model selection for UCS prediction in cement-stabilized soils [82].
The performance metrics for all final models trained using both parameter selection strategies are presented in Table 6.
The Random Forest model trained with Optuna’s optimal parameters demonstrated superior performance, achieving the highest R2 score (0.9825) and lowest RMSE (167.52 kPa) among all configurations. Notably, this configuration utilized deeper decision trees () compared to the best fold configuration (), indicating that Optuna successfully identified a more complex model architecture that better captures the intricate relationships in cement-stabilized soil data without overfitting.
The Random Forest model with optimal parameters also exhibited the best performance across all other metrics, with the lowest MAE (112.48 kPa), maximum error (636.97 kPa), and CV RMSE (7.83%). The consistency of superior performance across both goodness-of-fit metrics (R2 and EVS) and error metrics demonstrates the robust predictive capability of this model configuration.
The Gradient Boosting models showed minimal performance differences between parameter strategies (R2 of 0.9817 versus 0.9814), suggesting a certain stability plateau in the hyperparameter space for this algorithm. Both configurations converged to similar structural parameters (), with slight variations in learning rate and number of estimators. This stability is further evidenced by the close values for CV RMSE (8.02% vs. 8.09%) and maximum error (665.92 kPa vs. 677.68 kPa).
The XGBoost models exhibited nearly identical performance metrics regardless of parameter selection strategy (R2 of 0.9804 for both), despite substantial differences in their hyperparameter configurations. The optimal parameter configuration utilized deeper trees () with lower (4), while the best fold configuration employed shallower trees () with higher (6). This demonstrates the existence of multiple equivalent solutions in the hyperparameter space—a common phenomenon in complex machine learning algorithms where different hyperparameter combinations can yield similar performance through varying mechanisms.
The identical EVS and R2 values for each model pair confirm that none of the models suffer from systematic bias, as these metrics diverge when predictions follow the correct pattern but with consistent offsets. Additionally, the relatively low MAPE values (5.55-7.57%) across all models indicate good relative accuracy, with predictions typically falling within 5-8% of the actual UCS values.
The error distribution analysis (Table 7) reveals that the Random Forest model predicted 60.6% of UCS values within kPa of their actual measurements and 91.4% within ±300 kPa. The near-zero mean error (-1.62 kPa) confirms unbiased predictions across the dataset. The maximum errors of -583.13 kPa (underprediction) and 636.97 kPa (overprediction) occurred primarily for specimens with high cement content (10%) and extended curing periods (28 days), where natural variability in strength development is more pronounced.
All models demonstrated excellent performance in capturing the relationship between cement content, curing period, compaction velocity, and unconfined compressive strength (UCS) of cement-stabilized soils. However, the Random Forest model with Optuna-optimized parameters provided the best balance of accuracy, generalization capability, and error distribution characteristics, making it particularly suitable for practical engineering applications where reliable strength predictions across diverse soil conditions are required.
To further illustrate the performance of the Random Forest model with optimal parameters, Figure 7 provides a comprehensive visual analysis of its predictive capabilities. The strong alignment between predicted and measured UCS values is evident in Figure 7a, where data points closely follow the 1:1 line across the entire strength range, confirming the model’s high R² value of 0.9825. Figure 7b reveals the near-normal distribution of prediction errors centered very close to zero (mean error of only -1.62 kPa), indicating unbiased predictions. The residual analysis in Figure 7c shows no discernible patterns or trends across the prediction range, confirming the absence of systematic bias at different strength levels. Finally, Figure 7d quantifies the relative importance of input variables, confirming that cement content (78.4%) and curing period (21.2%) are the dominant factors governing UCS development, while compaction velocity contributes minimally (0.4%)—a finding that aligns with our earlier exploratory data analysis. This comprehensive visualization framework reinforces the selection of the optimized Random Forest model as the most suitable algorithm for practical UCS prediction in cement-stabilized soils.
3.3. Model Deployment and Accessibility
To maximize the practical utility of this research for geotechnical engineers and researchers, the optimal Random Forest model has been deployed as a publicly accessible web application. This implementation bridges the gap between research findings and engineering practice, enabling immediate application of the predictive capabilities developed in this study.
The deployment architecture utilizes a modern, robust approach centered on FastAPI, a high-performance web framework that facilitates efficient handling of prediction requests. The trained Random Forest model with optimal parameters was serialized and integrated into a RESTful API service that processes input parameters (cement percentage, curing period, and compaction velocity) and returns predicted UCS values in real-time. This implementation ensures both computational efficiency and scalability for multiple concurrent users.
The web interface (accessible at http://www.bi4e-at.tuiasi.ro/ucs-prediction/) provides an intuitive user experience, allowing practitioners to input soil stabilization parameters and immediately receive predicted UCS values without requiring specialized software or programming knowledge. The interface includes value range validation, clear input guidance, and visualization of prediction results to enhance usability.
3.4. Practical Applications and Limitations
The developed predictive model offers several practical applications for geotechnical engineering practice. During the preliminary design phase of infrastructure projects, engineers can rapidly estimate the UCS of cement-treated soil based on proposed cement content and expected curing conditions, without the need for extensive laboratory testing. This capability enables more efficient evaluation of ground improvement alternatives and optimization of cement dosage to meet specific strength requirements while minimizing material costs. For quality control during construction, the model can provide benchmark values for expected strength development, helping engineers interpret field test results and identify potential issues with mixing, placement, or curing procedures. The web-based implementation enhances accessibility, allowing practitioners to utilize the model’s predictive capabilities without specialized software or programming knowledge.
Based on our experimental findings and model predictions, the following practical recommendations can be made:
- For applications with moderate strength requirements ( kPa), cement contents in the range of 5-7.5% provide an optimal balance between mechanical performance and economic efficiency.
- For more demanding applications requiring higher strength (UCS > 3000 kPa), a cement content of 10% is recommended, with curing periods of at least 14 days to achieve consistent results.
- Compaction rate control (within the studied range of 0.75-1.25 mm/min) does not significantly impact final strength for most practical scenarios, allowing for more flexible field implementation protocols.
- Quality control measures should be more stringent for mixtures with higher cement contents (), as these exhibited greater variability in strength outcomes due to increased sensitivity to mixing homogeneity and curing conditions.
However, several limitations should be acknowledged. First, the model was developed using a specific soil type (clayey silt from northwestern Iași) and may not generalize perfectly to soils with substantially different mineralogical compositions or physical properties. Application to other soil types should be approached with caution, potentially using the model as a starting point for estimation and validating predictions with limited laboratory testing. Second, the experimental program explored a relatively narrow range of compaction velocities (0.75-1.25 mm/min) and cement contents (up to 10%). Extrapolating predictions substantially beyond these ranges may introduce additional uncertainty. The relationship between cement content and UCS appears to accelerate at higher dosages, suggesting that the model may underestimate strength for cement contents beyond 10% if this non-linear pattern continues.
Third, all specimens were prepared and cured under controlled laboratory conditions. Field implementation of soil-cement mixing inevitably introduces additional variables, including heterogeneity in mixing, moisture variations, and environmental factors such as temperature, humidity, and pH levels that may influence the hydration process and strength development. Additionally, operator-related variability – including differences in mixing technique, compaction consistency, and curing practices – can further affect the performance of cement-treated soils. Therefore, the model’s predictions should be interpreted as representing potential strength under ideal conditions, with appropriate safety factors applied for field applications.
The comparison of our findings with previous studies reveals both similarities and differences. The strong influence of cement content on UCS development aligns with established literature [68,71], but the minimal impact of compaction rate observed in our study must be interpreted within the specific context of our experimental methodology. All specimens were compacted to the same target density regardless of the compaction velocity used. Therefore, the total compaction energy was effectively adjusted to achieve the same final density. This finding does not contradict studies such as Kraszewski et al. [83], who reported substantial effects of compaction energy on strength development in cement-stabilized soils. In their study, different levels of compaction energy produced variable densities, which then directly influenced the strength of the material.
Our results instead suggest that when the final density is the same, the rate at which compaction is applied has limited effect on the mechanical properties of cement-treated soil. This observation is significant for practical applications in geotechnical engineering, as it indicates that as long as the target density is achieved, the precise rate of compaction application may be a less critical parameter than previously assumed. This aligns with the fundamental understanding that density, rather than the specific process through which this density is obtained, is the primary determining factor for strength development in cement-treated soils.
3.5. Future Research Directions
This study opens several promising avenues for future research. First, expanding the experimental program to include a wider range of soil types would enhance understanding of how soil characteristics influence the effectiveness of cement stabilization and the transferability of predictive models across different geotechnical contexts. Incorporating additional soil parameters (such as clay mineralogy, organic content, and specific surface area) as input variables could potentially improve model accuracy and generalizability.
Second, exploring the long-term strength development and durability aspects of cement-treated soils would provide valuable insights for infrastructure projects with extended design lives. While our study examined curing periods up to 28 days, many cementation processes continue beyond this timeframe, and understanding these long-term effects would enhance the model’s utility for permanent infrastructure applications.
Third, integrating microstructural analysis techniques (such as scanning electron microscopy, X-ray diffraction, and mercury intrusion porosimetry) with mechanical testing and machine learning approaches could elucidate the fundamental mechanisms governing strength development in cement-treated soils. This multi-scale approach would bridge the gap between empirical modeling and mechanistic understanding, potentially leading to more physically-based predictive frameworks.
Finally, extending the machine learning approach to predict additional properties beyond UCS would provide a more comprehensive toolkit for designing cement-stabilized soil systems. A holistic predictive framework encompassing multiple performance criteria would significantly enhance the practical utility of machine learning approaches in geotechnical engineering.
The methodology and findings presented in this study demonstrate the significant potential of combining experimental geotechnical testing with machine learning techniques to develop robust predictive models for soil stabilization applications. By making both the original experimental data and the trained machine learning model publicly available, this work provides a foundation for continued research and practical implementation of data-driven approaches in geotechnical engineering.
4. Conclusions
This study combined experimental testing with advanced machine learning techniques to investigate and predict the unconfined compressive strength (UCS) of cement-treated clayey silt from northwestern Iași, Romania. Based on the comprehensive analysis of 185 UCS measurements and the development of predictive models, the following key conclusions can be drawn:
- The experimental program revealed that cement content is the primary determinant of strength development, exhibiting a strong positive correlation (R2 = 0.87) with UCS values. This relationship follows a non-linear pattern with accelerating strength gains at higher cement contents (7.5-10%), which can be attributed to the formation of more continuous cementitious matrices throughout the soil structure.
- Curing period demonstrated a moderate positive correlation with UCS (R2 = 0.50), confirming the time-dependent nature of cement hydration and pozzolanic reactions in stabilized soils. While significant strength development occurred within the first 7 days, continued gains were observed through 28 days, particularly at higher cement contents.
- Within the range investigated (0.75-1.25 mm/min), compaction rate exhibited minimal influence on UCS development () for most combinations of cement content and curing time. Notable exceptions were observed at early curing times (1 day) and high cement contents (10%), suggesting that compaction rate becomes more influential under specific conditions.
- The application of machine learning techniques demonstrated that tree-based ensemble methods significantly outperformed traditional linear models in predicting UCS. The optimized Random Forest model achieved exceptional accuracy (R2 = 0.9825, RMSE = 167.52 kPa), confirming that soil-cement interactions follow complex non-linear patterns that require sophisticated modeling approaches.
- Feature importance analysis from the Random Forest model provided quantitative confirmation of experimental observations, attributing 78.4% of predictive power to cement content, 21.2% to curing period, and only 0.4% to compaction velocity. This alignment between algorithmic feature ranking and experimental correlations strengthens the reliability of both approaches.
- For practical applications, cement contents of 5-7.5% were found to provide an optimal balance between strength enhancement and economic considerations for projects with moderate strength requirements ( kPa). For applications demanding higher strength levels, 10% cement content consistently delivered UCS values exceeding 3000 kPa after 14 days of curing.
The deployment of the optimized Random Forest model as a publicly accessible web application facilitates the practical implementation of these research findings, enabling geotechnical engineers to rapidly estimate stabilized soil strength without extensive laboratory testing. This capability supports more efficient evaluation of ground improvement alternatives during preliminary design phases and provides benchmark values for quality control during construction.
By making both the original experimental data and the trained machine learning model publicly available, this work establishes a foundation for continued research in data-driven geotechnical engineering. Future studies should focus on expanding these approaches to diverse soil types, incorporating additional soil parameters as predictive variables, exploring long-term durability aspects, and extending the prediction framework to encompass other critical performance metrics beyond UCS.
This research demonstrates that the integration of experimental geotechnical testing with advanced data science techniques can significantly enhance our ability to predict and optimize soil stabilization outcomes, potentially leading to more efficient, economical, and sustainable ground improvement practices.
Author Contributions
Conceptualisation, I.L. and I.-B.T.; methodology, M.A., I.L., I.-B.T., Z.O.-Y., A.A. and A.V.D.; software, I.-B.T.; validation, I.L. and I.-B.T.; investigation, I.-B.T.; resources, Z.O.-Y., M.A. and A.V.D.; data curation, I.-B.T.; writing–original draft preparation, I.-B.T. and Z.O.-Y.; writing–review and editing, I.-B.T., I.L., F.H. and A.A.; visualisation, I.-B.T.; supervision, I.L. All authors have read and agreed to the published version of the manuscript.
Funding
This research was funded by the Romanian National Authority for Scientific Research, UEFISCDI, through project PN-IV-P8-8.1-PRE-HE-ORG-2023-0051.
Data Availability Statement
The original data presented in this study are openly available in FigShare at https://doi.org/10.6084/m9.figshare.28553693.v1, under a CC BY license. Additionally, the trained machine learning model is accessible for predictions through a web-based interface at http://www.bi4e-at.tuiasi.ro/ucs-prediction/.
Acknowledgments
This research paper was supported by Boosting Ingenium for Excellence (BI4E) project, funded by the European Union’s HORIZON-WIDERA-2021-ACCESS-05-01: European Excellence Initiative, under the Grant Agreement No. 101071321
Conflicts of Interest
The authors declare no conflicts of interest.
References
- Khan, M.H.A.; Abdallah, A.; Cuisinier, O. Insights into the strength development in cement-treated soils: An explainable AI-based approach for optimized mix design. Computers and Geotechnics 2025, 180, 107103. [Google Scholar] [CrossRef]
- Kitazume, M.; Terashi, M. The deep mixing method; CRC Press: London, 2013. [Google Scholar]
- Nakarai, K.; Yoshida, T. Effect of carbonation on strength development of cement-treated Toyoura silica sand. Soils and Foundations 2015, pp. 857–865. [CrossRef]
- Felt, E. Factors influencing physical properties of soil-cement mixtures. Highway Research Board Bulletin 1955. [Google Scholar]
- Abdallah, A.; Russo, G.; Cuisinier, O. Statistical and Predictive Analyses of the Strength Development of a Cement-Treated Clayey Soil. Geotechnics 2023, 3, 465–479. [Google Scholar] [CrossRef]
- Kang, G.; Kim, Y.; Kang, J. Predictive strength model of cement-treated fine-grained soils using key parameters: Consideration of the total water/cement and soil/cement ratios. Case Studies in Construction Materials 2023, 18, e02069. [Google Scholar] [CrossRef]
- Petchgate, W.; et al. Sustainable soil stabilization: Evaluating the feasibility of hydraulic cement in the deep mixing method. Case Studies in Construction Materials 2025, p. e04394. [CrossRef]
- Zhang, L.; Li, Y.; Wei, X.; Liang, X.; Zhang, J.; Li, X. Unconfined Compressive Strength of Cement-Stabilized Qiantang River Silty Clay. Materials 2024, 17. [Google Scholar] [CrossRef] [PubMed]
- Wan, W. Enhancing unconfined compressive strength of stabilized soil with lime and cement prediction through a robust hybrid machine learning approach utilizing Naive Bayes Algorithm. Journal of Engineering and Applied Science 2024, 71, 84. [Google Scholar] [CrossRef]
- Jeremiah, J.; Abbey, S.; Booth, C.; Kashyap, A. Results of Application of Artificial Neural Networks in Predicting Geo-Mechanical Properties of Stabilised Clays—A Review. Geotechnics 2021, 1, 147–171. [Google Scholar] [CrossRef]
- Onyelowe, K.; et al. Estimating the strength of soil stabilized with cement and lime at optimal compaction using ensemble-based multiple machine learning. Scientific Reports 2024, 14, 15308. [Google Scholar] [CrossRef]
- Thapa, I.; Ghani, S. Advancing earth science in geotechnical engineering: A data-driven soft computing technique for unconfined compressive strength prediction in soft soil. Journal of Earth System Science 2024, 133, 159. [Google Scholar] [CrossRef]
- Mozumber, R.; Laskar, A. Prediction of unconfined compressive strength of geopolymer stabilized clayey soil using Artificial Neural Network. Computers and Geotechnics 2015, 69. [Google Scholar] [CrossRef]
- Deng, D.; Liu, L.; Liu, S.; Zhang, G.; Sun, H.; Zhang, B. Strength enhancement of cement-based stabilized clays via vacuum-assisted filtration. Case Studies in Construction Materials 2023, 18, e02204. [Google Scholar] [CrossRef]
- Guo, X.; Garcia, C.; Valle, A.I.A.; Onyelowe, K.; Villacrés, A.N.Z.; Ebid, A.; Hanandeh, S. Modeling the influence of lime on the unconfined compressive strength of reconstituted graded soil using advanced machine learning approaches for subgrade and liner applications. PLOS ONE 2024, 19, e0301075. [Google Scholar] [CrossRef] [PubMed]
- Chen, Q.; Hu, G.; Wu, J. Prediction of the Unconfined Compressive Strength of a One-Part Geopolymer-Stabilized Soil Using Deep Learning Methods with Combined Real and Synthetic Data. Buildings 2024, 14. [Google Scholar] [CrossRef]
- Eyo, E.; Abbey, S.; Booth, C. Strength Predictive Modelling of Soils Treated with Calcium-Based Additives Blended with Eco-Friendly Pozzolans—A Machine Learning Approach. Materials 2022, 15. [Google Scholar] [CrossRef]
- Wudil, Y.; Al-Najjar, O.A.; Al-Osta, M.; Al-Amoudi, O.S.B.; Gondal, M. Investigating the Soil Unconfined Compressive Strength Based on Laser-Induced Breakdown Spectroscopy Emission Intensities and Machine Learning Techniques. ACS Omega 2023, 8, 26391–26404. [Google Scholar] [CrossRef] [PubMed]
- Zhao, H.; Bing, H. Prediction of the Unconfined Compressive Strength of Salinized Frozen Soil Based on Machine Learning. Buildings 2024, 14. [Google Scholar] [CrossRef]
- IRS. STAS 1913/5-85: Teren de fundare. Determinarea granulozităţii; Institutul Român de Standardizare, 1985. In Romanian.
- CEN. EN ISO 14688-2:2018: Geotechnical investigation and testing – Identification and classification of soil – Part 2: Principles for a classification; European Committee for Standardization, 2018.
- CEN. EN ISO 14688-1:2018: Geotechnical investigation and testing – Identification and classification of soil – Part 1: Identification and description; European Committee for Standardization, 2018.
- CEN. EN 197-1: Cement – Part 1: Composition, specifications, and conformity criteria for common cements; European Committee for Standardization, 2011.
- Taylor, H.F.W. Cement Chemistry; Thomas Telford, 1997.
- De Weerdt, K.; et al. Hydration mechanisms of ternary Portland cements containing limestone powder and fly ash. Cement and Concrete Research 2011, 41, 279–291. [Google Scholar] [CrossRef]
- Shi, C.; Pavel, K.; Roy, D.M. Alkali-activated cements and concretes; CRC Press: London, 2003. [Google Scholar]
- Pol Segura, I.; Ranjbar, N.; Juul Damø, A.; Skaarup Jensen, L.; Canut, M.; Arendt Jensen, P. A review: Alkali-activated cement and concrete production technologies available in the industry. Heliyon 2023, 9, e15718. [Google Scholar] [CrossRef]
- Lothenbach, B.; Le Saout, G.; Gallucci, E.; Scrivener, K. Influence of limestone on the hydration of Portland cements. Cement and Concrete Research 2008, 38, 848–860. [Google Scholar] [CrossRef]
- Sherwood, P.T. Soil stabilization with cement and lime; HMSO: London, 1993. [Google Scholar]
- Tukey, J.W. Exploratory Data Analysis; Addison-Wesley: Reading, MA, 1977. [Google Scholar]
- Aggarwal, C.C. Outlier Analysis; Springer International Publishing AG: Cham, Switzerland, 2017. [Google Scholar]
- Maulud, D.; Abdulazeez, A.M. A Review on Linear Regression Comprehensive in Machine Learning. Journal of Applied Science and Technology Trends 2020, 1, 140–147. [Google Scholar] [CrossRef]
- Hoerl, A.E.; Kennard, R.W. Ridge regression: Biased estimation for nonorthogonal problems. Technometrics 1970, 12, 55–67. [Google Scholar] [CrossRef]
- Tibshirani, R. Regression shrinkage and selection via the lasso. Journal of the Royal Statistical Society: Series B (Methodological) 1996, 58, 267–288. [Google Scholar] [CrossRef]
- Zou, H.; Hastie, T. Regularization and variable selection via the elastic net. Journal of the Royal Statistical Society: Series B (Statistical Methodology) 2005, 67, 301–320. [Google Scholar] [CrossRef]
- Breiman, L.; Friedman, J.; Stone, C.J.; Olshen, R.A. Classification and regression trees; CRC Press: Boca Raton, FL, 1984. [Google Scholar]
- Breiman, L. Random forests. Machine Learning 2001, 45, 5–32. [Google Scholar] [CrossRef]
- Friedman, J.H. Greedy function approximation: A gradient boosting machine. Annals of Statistics 2001, 29, 1189–1232. [Google Scholar] [CrossRef]
- Chen, T.; Guestrin, C. XGBoost: A scalable tree boosting system. In Proceedings of the Proceedings of the 22nd ACM SIGKDD International Conference on Knowledge Discovery and Data Mining. ACM, 2016, pp. 785–794. [CrossRef]
- Ke, G.; Meng, Q.; Finley, T.; Wang, T.; Chen, W.; Ma, W.; Ye, Q.; Liu, T.Y. LightGBM: A highly efficient gradient boosting decision tree. In Proceedings of the Advances in Neural Information Processing Systems; 2017; Vol. 30, pp. 3146–3154. [Google Scholar]
- Prokhorenkova, L.; Gusev, G.; Vorobev, A.; Dorogush, A.V.; Gulin, A. CatBoost: Unbiased boosting with categorical features. In Proceedings of the Advances in Neural Information Processing Systems; 2018; Vol. 31, pp. 6638–6648. [Google Scholar]
- Drucker, H.; Burges, C.J.; Kaufman, L.; Smola, A.J.; Vapnik, V. Support vector regression machines. In Proceedings of the Advances in Neural Information Processing Systems; 1997; Vol. 9, pp. 155–161. [Google Scholar]
- Cover, T.; Hart, P. Nearest neighbor pattern classification. IEEE Transactions on Information Theory 1967, 13, 21–27. [Google Scholar] [CrossRef]
- Rasmussen, C.E.; Williams, C.K.I. Gaussian processes for machine learning; MIT Press: Cambridge, MA, 2006. [Google Scholar]
- Freund, Y.; Schapire, R.E. A decision-theoretic generalization of on-line learning and an application to boosting. Journal of Computer and System Sciences 1997, 55, 119–139. [Google Scholar] [CrossRef]
- Delgado, M.F.; Sirsat, M.S.; Cernadas, E.; Alawadi, S.; Barro, S.; Febrero-Bande, M. An extensive experimental survey of regression methods. Neural Networks 2019, 111, 11–34. [Google Scholar] [CrossRef]
- Vabalas, A.; Gowen, E.; Poliakoff, E.; Casson, A.J. Machine learning algorithm validation with a limited sample size. PLoS ONE 2019, 14. [Google Scholar] [CrossRef]
- Xu, P.; Ji, X.; Li, M.; Lu, W. Small data machine learning in materials science. npj Computational Materials 2023, 9, 1–15. [Google Scholar] [CrossRef]
- Ghasemzadeh, H.; Hillman, R.E.; Mehta, D.D. Toward Generalizable Machine Learning Models in Speech, Language, and Hearing Sciences: Estimating Sample Size and Reducing Overfitting. Journal of Speech, Language, and Hearing Research 2024, 67, 753–781. [Google Scholar] [CrossRef] [PubMed]
- Bischl, B.; Binder, M.; Lang, M.; Pielok, T.; Richter, J.; Coors, S.; Thomas, J.; Ullmann, T.; Becker, M.; Boulesteix, A.; et al. Hyperparameter optimization: Foundations, algorithms, best practices, and open challenges. Wiley Interdisciplinary Reviews: Data Mining and Knowledge Discovery 2021, 13. [Google Scholar] [CrossRef]
- Varma, S.; Simon, R.M. Bias in error estimation when using cross-validation for model selection. BMC Bioinformatics 2006, 7, 91–91. [Google Scholar] [CrossRef]
- Cawley, G.C.; Talbot, N.L. On Over-fitting in Model Selection and Subsequent Selection Bias in Performance Evaluation. Journal of Machine Learning Research 2010, 11. [Google Scholar]
- Tsamardinos, I.; Rakhshani, A.; Lagani, V. Performance-Estimation Properties of Cross-Validation-Based Protocols with Simultaneous Hyper-Parameter Optimization. In Proceedings of the Artificial Intelligence: Methods and Applications; Likas, A.; Blekas, K.; Kalles, D., Eds., Cham, 2014; pp. 1–14.
- Stephen Bates, T.H.; Tibshirani, R. Cross-Validation: What Does It Estimate and How Well Does It Do It? Journal of the American Statistical Association 2024, 119, 1434–1445. [Google Scholar] [CrossRef]
- Allgaier, J.; Pryss, R. Cross-Validation Visualized: A Narrative Guide to Advanced Methods. Machine Learning and Knowledge Extraction 2024, 6, 1378–1388. [Google Scholar] [CrossRef]
- Akiba, T.; Sano, S.; Yanase, T.; Ohta, T.; Koyama, M. Optuna: A Next-generation Hyperparameter Optimization Framework. In Proceedings of the Proceedings of the 25th ACM SIGKDD International Conference on Knowledge Discovery & Data Mining, New York, NY, USA, 2019; KDD ’19, p. 2623–2631. [CrossRef]
- Botchkarev, A. A New Typology Design of Performance Metrics to Measure Errors in Machine Learning Regression Algorithms. Interdisciplinary Journal of Information, Knowledge, and Management 2019, 14. [Google Scholar] [CrossRef]
- Plevris, V.; Solorzano, G.; Bakas, N.; El, M.; Seghier, A.B. Investigation of performance metrics in regression analysis and machine learning-based prediction models. In Proceedings of the World Congress in Computational Mechanics and ECCOMAS Congress; 2022. [Google Scholar] [CrossRef]
- Chicco, D.; Warrens, M.J.; Jurman, G. The coefficient of determination R-squared is more informative than SMAPE, MAE, MAPE, MSE and RMSE in regression analysis evaluation. PeerJ Computer Science 2021, 7, e623. [Google Scholar] [CrossRef]
- Moayedi, H.; Rezaei, A. An artificial neural network approach for under-reamed piles subjected to uplift forces in dry sand. Neural Computing and Applications 2019, p. 327–336. [CrossRef]
- Bergstra, J.; Bengio, Y. Random search for hyper-parameter optimization. Journal of Machine Learning Research 2012, 13, 281–305. [Google Scholar]
- Zhang, J.; Li, D.; Wang, Y. Toward intelligent construction: Prediction of mechanical properties of manufactured-sand concrete using tree-based models. Journal of Cleaner Production 2020, 258, 120665. [Google Scholar] [CrossRef]
- Probst, P.; Boulesteix, A.L.; Bischl, B. Tunability: importance of hyperparameters of machine learning algorithms. Journal of Machine Learning Research 2019, 20, 1934–1965. [Google Scholar]
- Feurer, M.; Hutter, F., Hyperparameter Optimization. In Automated Machine Learning: Methods, Systems, Challenges; Hutter, F.; Kotthoff, L.; Vanschoren, J., Eds.; Springer International Publishing: Cham, 2019; pp. 3–33. [CrossRef]
- Boulesteix, A.L.; Binder, H.; Abrahamowicz, M.; Sauerbrei, W.; for the Simulation Panel of the STRATOS Initiative. On the necessity and design of studies comparing statistical methods. Biometrical Journal 2018, 60, 216–218. [Google Scholar] [CrossRef]
- Fernández-Delgado, M.; Cernadas, E.; Barro, S.; Amorim, D. Do we need hundreds of classifiers to solve real world classification problems? Journal of Machine Learning Research 2014, 15, 3133–3181. [Google Scholar]
- Akoglu, H. User’s guide to correlation coefficients. Turkish Journal of Emergency Medicine 2018, 18, 91–93. [Google Scholar] [CrossRef]
- Eskisar, T. Influence of Cement Treatment on Unconfined Compressive Strength and Compressibility of Lean Clay with Medium Plasticity. Arabian Journal for Science and Engineering 2015, 40, 763–772. [Google Scholar] [CrossRef]
- Yao, K.; tao Pan, Y.; jiu Jia, L.; Yi, J.; Hu, J.; Wu, C. Strength evaluation of marine clay stabilized by cementitious binder. Marine Georesources & Geotechnology 2020, 38, 730–743. [Google Scholar] [CrossRef]
- Wu, J.; Liu, L.; Deng, Y.; Zhang, G.; Zhou, A.; Wang, Q. Distinguishing the effects of cementation versus density on the mechanical behavior of cement-based stabilized clays. Construction and Building Materials 2020, p. 121571. [CrossRef]
- Horpibulsuk, S.; Rachan, R.; Chinkulkijniwat, A.; Raksachon, Y.; Suddeepong, A. Analysis of strength development in cement-stabilized silty clay from microstructural considerations. Construction and Building Materials 2010, 24, 2011–2021. [Google Scholar] [CrossRef]
- Zhang, W.; Wu, C.; Zhong, H.; Li, Y.; Wang, L. Prediction of undrained shear strength using extreme gradient boosting and random forest based on Bayesian optimization. Geoscience Frontiers 2021, 12, 469–477. [Google Scholar] [CrossRef]
- Zhang, Q.; Wang, L.; Gu, H. Having Deep Investigation on Predicting Unconfined Compressive Strength by Decision Tree in Hybrid and Individual Approaches. International Journal of Advanced Computer Science and Applications 2024, 15, 127–140. [Google Scholar] [CrossRef]
- Md. Ikramul Hoque, Muzamir Hasan, M.S.I.M.H.M.A.; Sobuz, M.H.R. Machine Learning Methods to Predict and Analyse Unconfined Compressive Strength of Stabilised Soft Soil with Polypropylene Columns. Cogent Engineering 2023, 10, 2220492. [CrossRef]
- Kim, M.; Senturk, M.A.; Li, L. Compression Index Regression of Fine-Grained Soils with Machine Learning Algorithms. Applied Sciences 2024, 14. [Google Scholar] [CrossRef]
- Zhou, J.; Li, E.; Wei, H.; Li, C.; Qiao, Q.; Armaghani, D.J. Random Forests and Cubist Algorithms for Predicting Shear Strengths of Rockfill Materials. Applied Sciences 2019, 9. [Google Scholar] [CrossRef]
- Mohr, F.; van Rijn, J.N. Fast and Informative Model Selection Using Learning Curve Cross-Validation. IEEE Transactions on Pattern Analysis and Machine Intelligence 2023, 45, 9669–9680. [Google Scholar] [CrossRef] [PubMed]
- Gallitto, G.; Englert, R.; Kincses, B.; Kotikalapudi, R.; Li, J.; Hoffschlag, K.; Bingel, U.; Spisak, T. External validation of machine learning models - registered models and adaptive sample splitting. bioRxiv 2024. [Google Scholar] [CrossRef]
- Raschka, S. Model evaluation, model selection, and algorithm selection in machine learning. arXiv preprint arXiv:1811.12808 2018. arXiv:1811.12808 2018.
- Kuhn, M.; Johnson, K. Applied Predictive Modeling; SpringerLink: Bücher, Springer New York, 2013. [Google Scholar]
- van Rijn, J.N.; Hutter, F. Hyperparameter Importance Across Datasets. In Proceedings of the Proceedings of the 24th ACM SIGKDD International Conference on Knowledge Discovery & Data Mining, New York, NY, USA, 2018; p. 2367–2376. [CrossRef]
- Rodriguez, J.D.; Perez, A.; Lozano, J.A. Sensitivity Analysis of k-Fold Cross Validation in Prediction Error Estimation. IEEE Transactions on Pattern Analysis and Machine Intelligence 2010, 32, 569–575. [Google Scholar] [CrossRef]
- Kraszewski, C.; Rafalski, L.; Gajewska, B. Effect of Compaction Ratio on Mechanical Properties of Low-Strength Hydraulically Bound Mixtures for Road Engineering. Materials 2022, 15. [Google Scholar] [CrossRef]
Figure 1.
Sample Preparation: (a) Soil mixture in plastic bags. (b) Tritech 50kN compressor used to compact the soil. (c) Cylindrical samples. (d) Curing in desiccator.
Figure 1.
Sample Preparation: (a) Soil mixture in plastic bags. (b) Tritech 50kN compressor used to compact the soil. (c) Cylindrical samples. (d) Curing in desiccator.
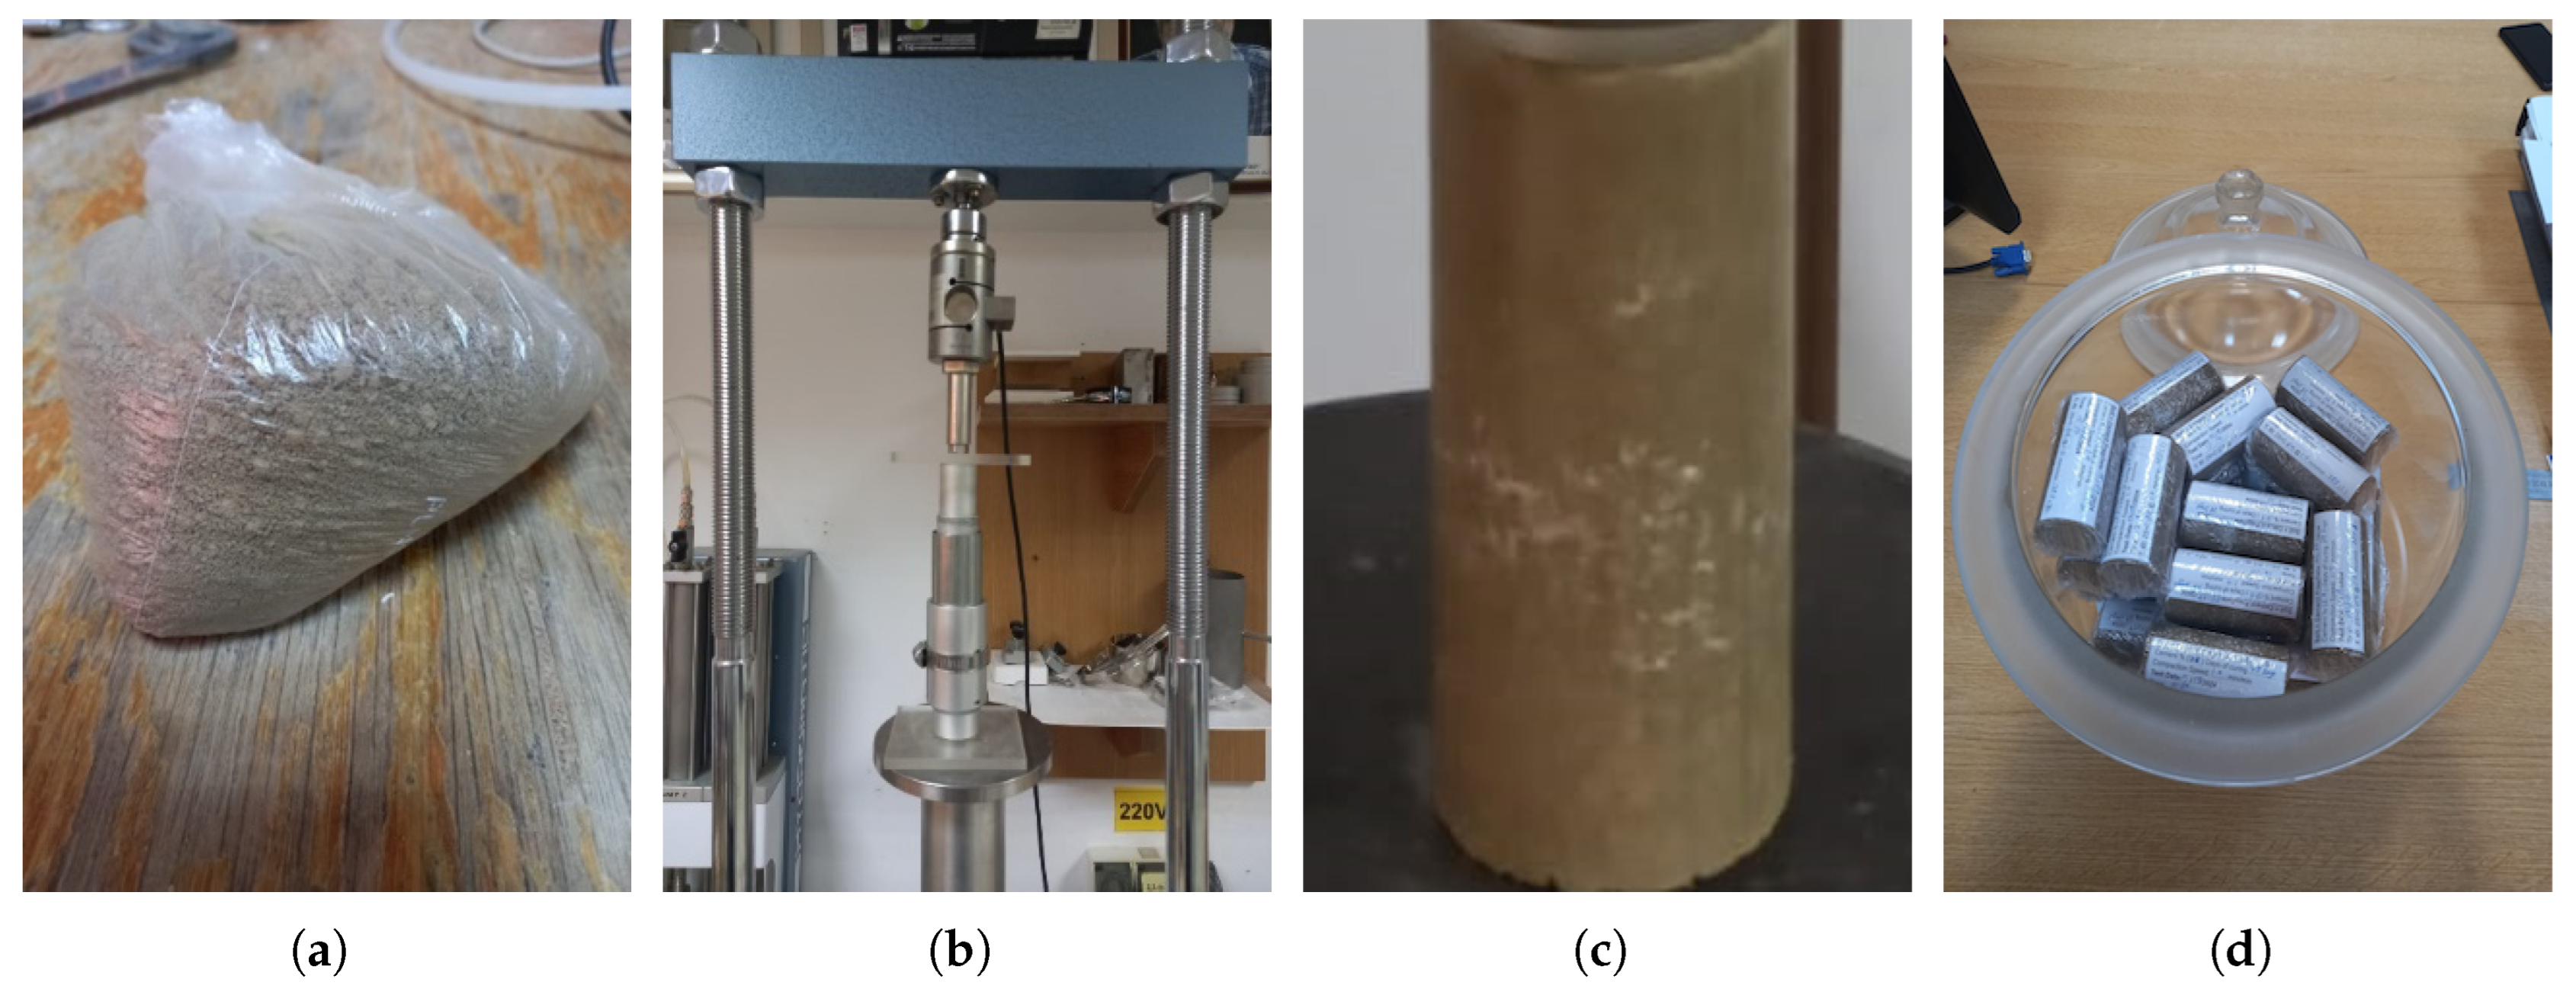
Figure 2.
Experimental setup and failure patterns of UCS tests: (a) Initial setup for specimens subjected to axial loads below 2.5 kN. (b) Initial setup for specimens subjected to axial loads exceeding 2.5 kN. (c) Failure mode of specimens loaded below 2.5 kN, showing macro-cracking and deformation patterns. (d) Failure mode of specimens loaded above 2.5 kN, illustrating shear plane inclination and structural disintegration.
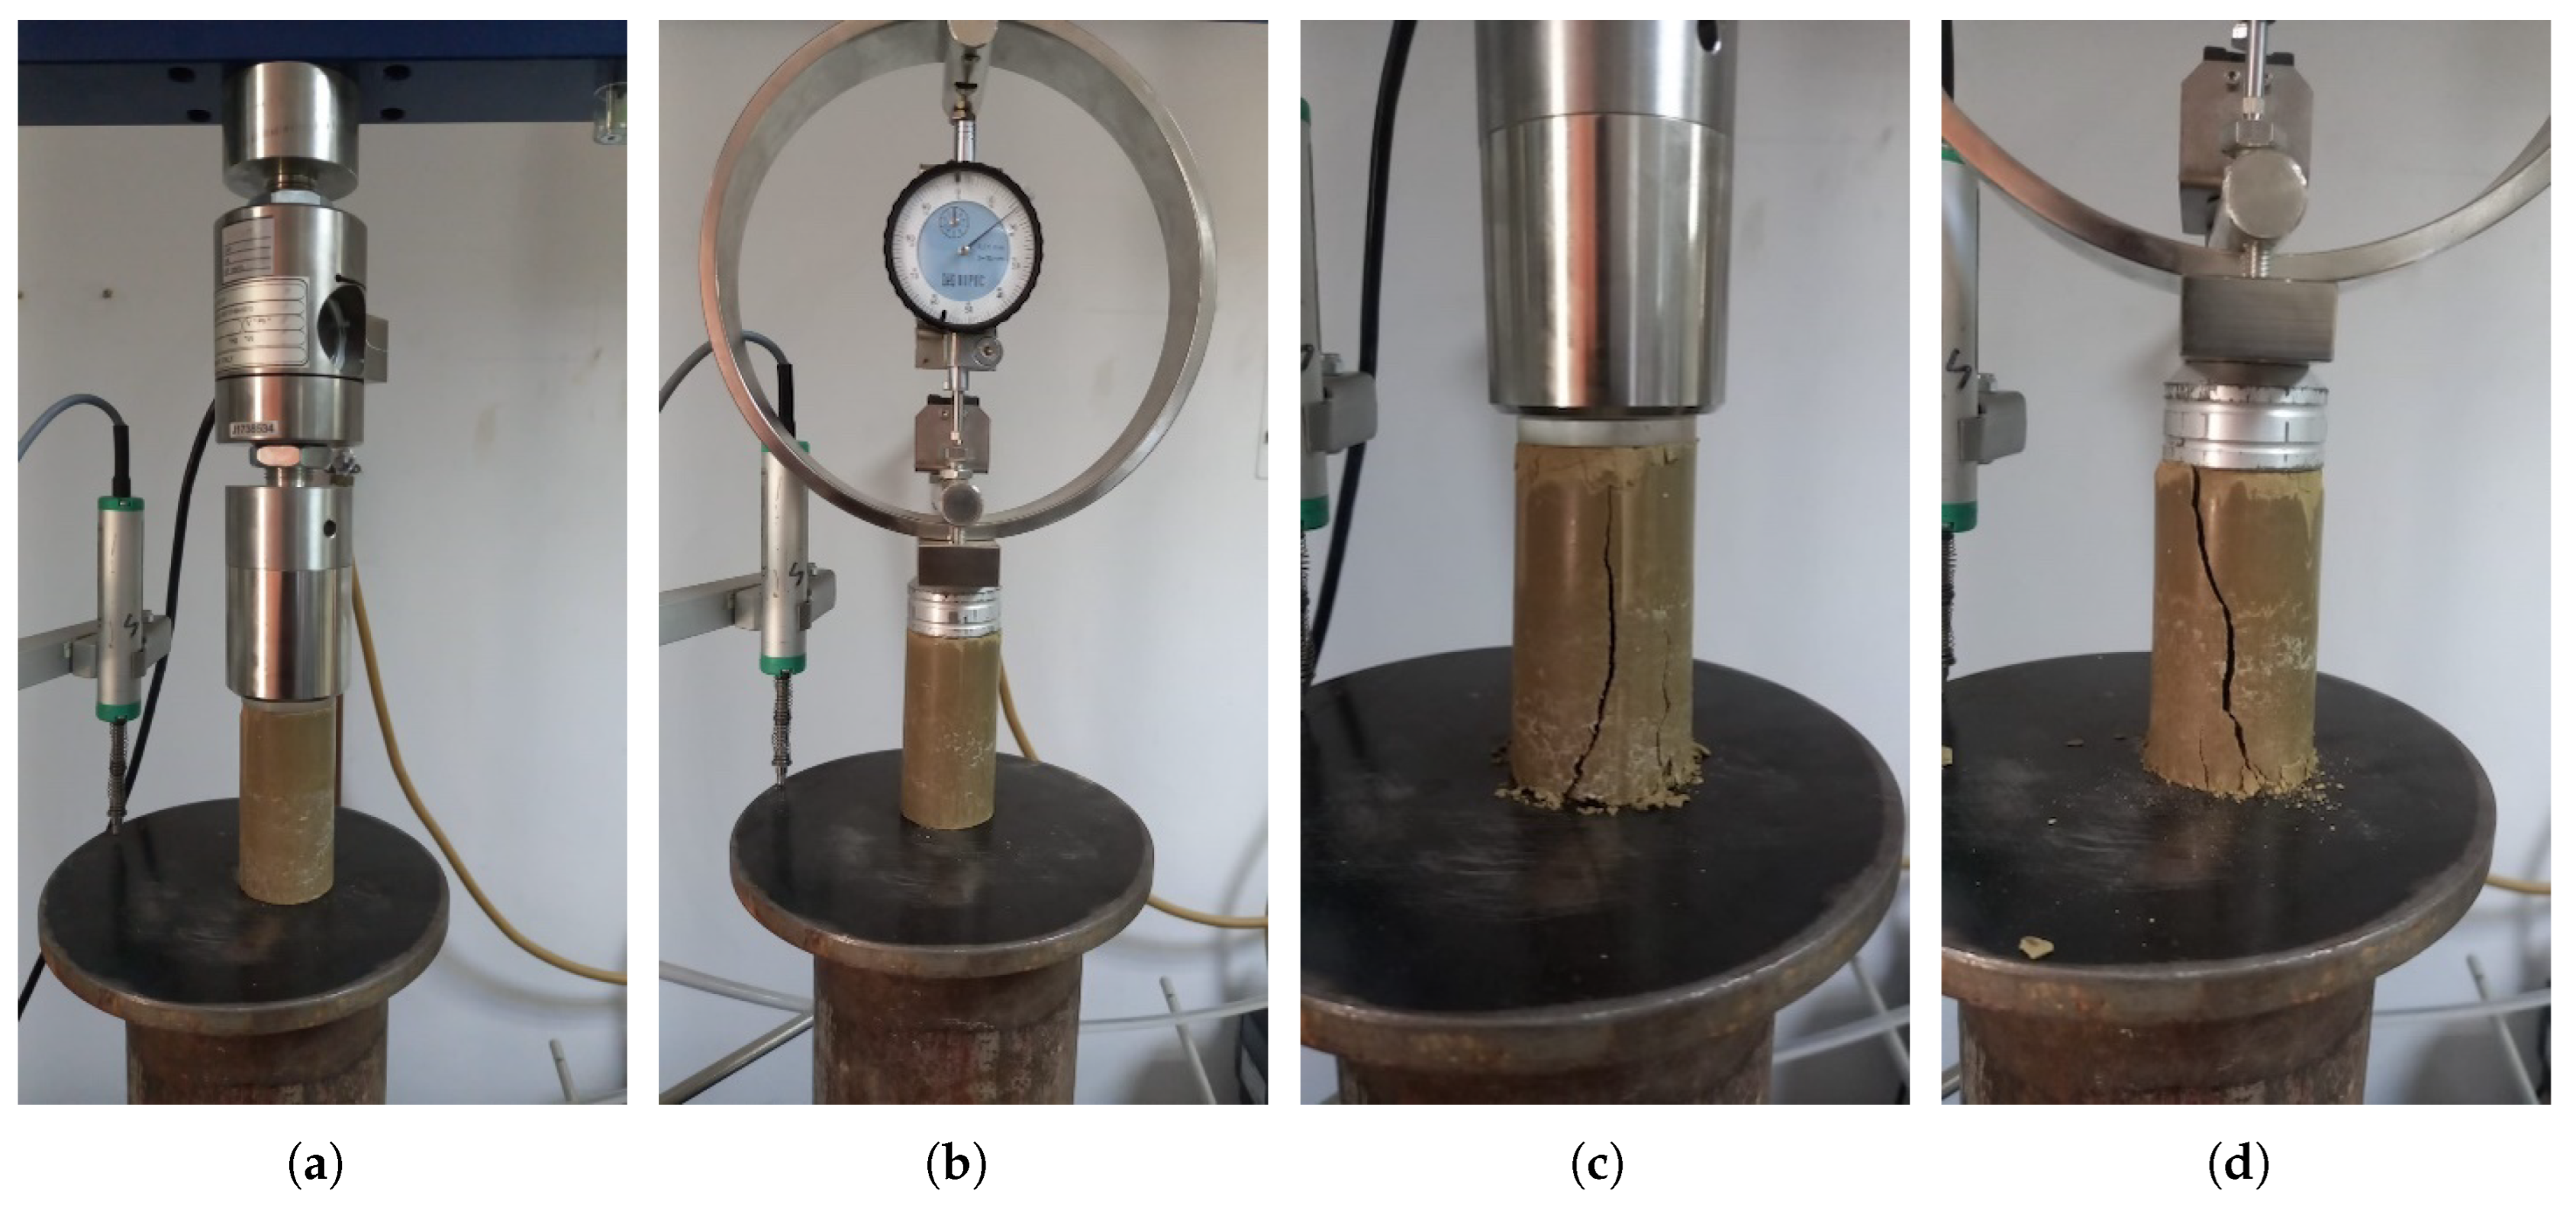
Figure 3.
Boxplot of UCS values.
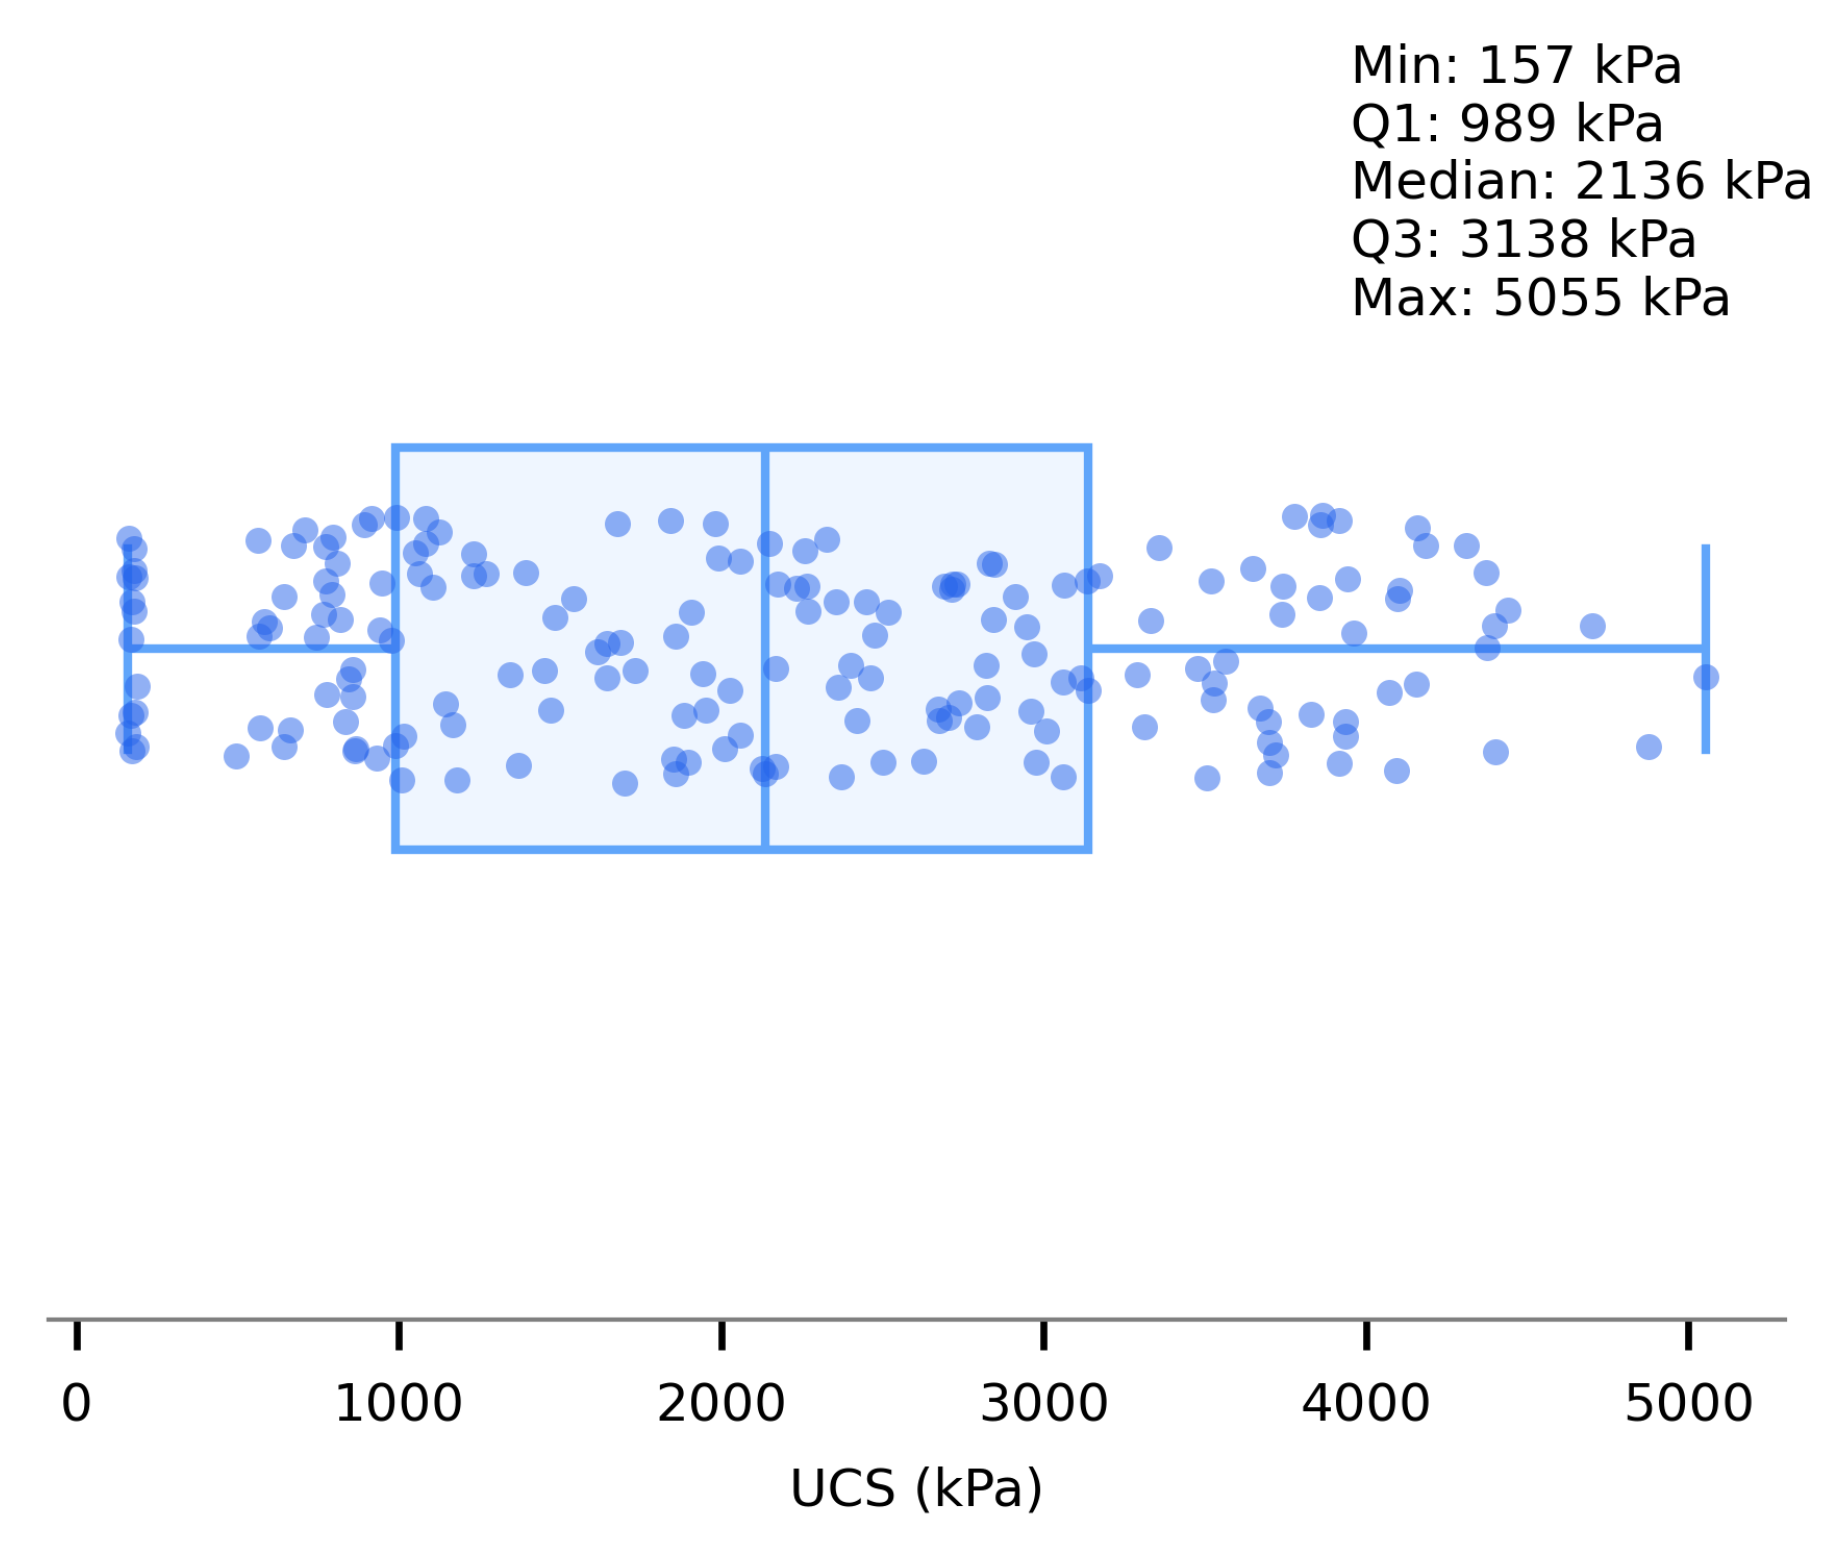
Figure 4.
Heat maps of correlation coefficients using three different methods.
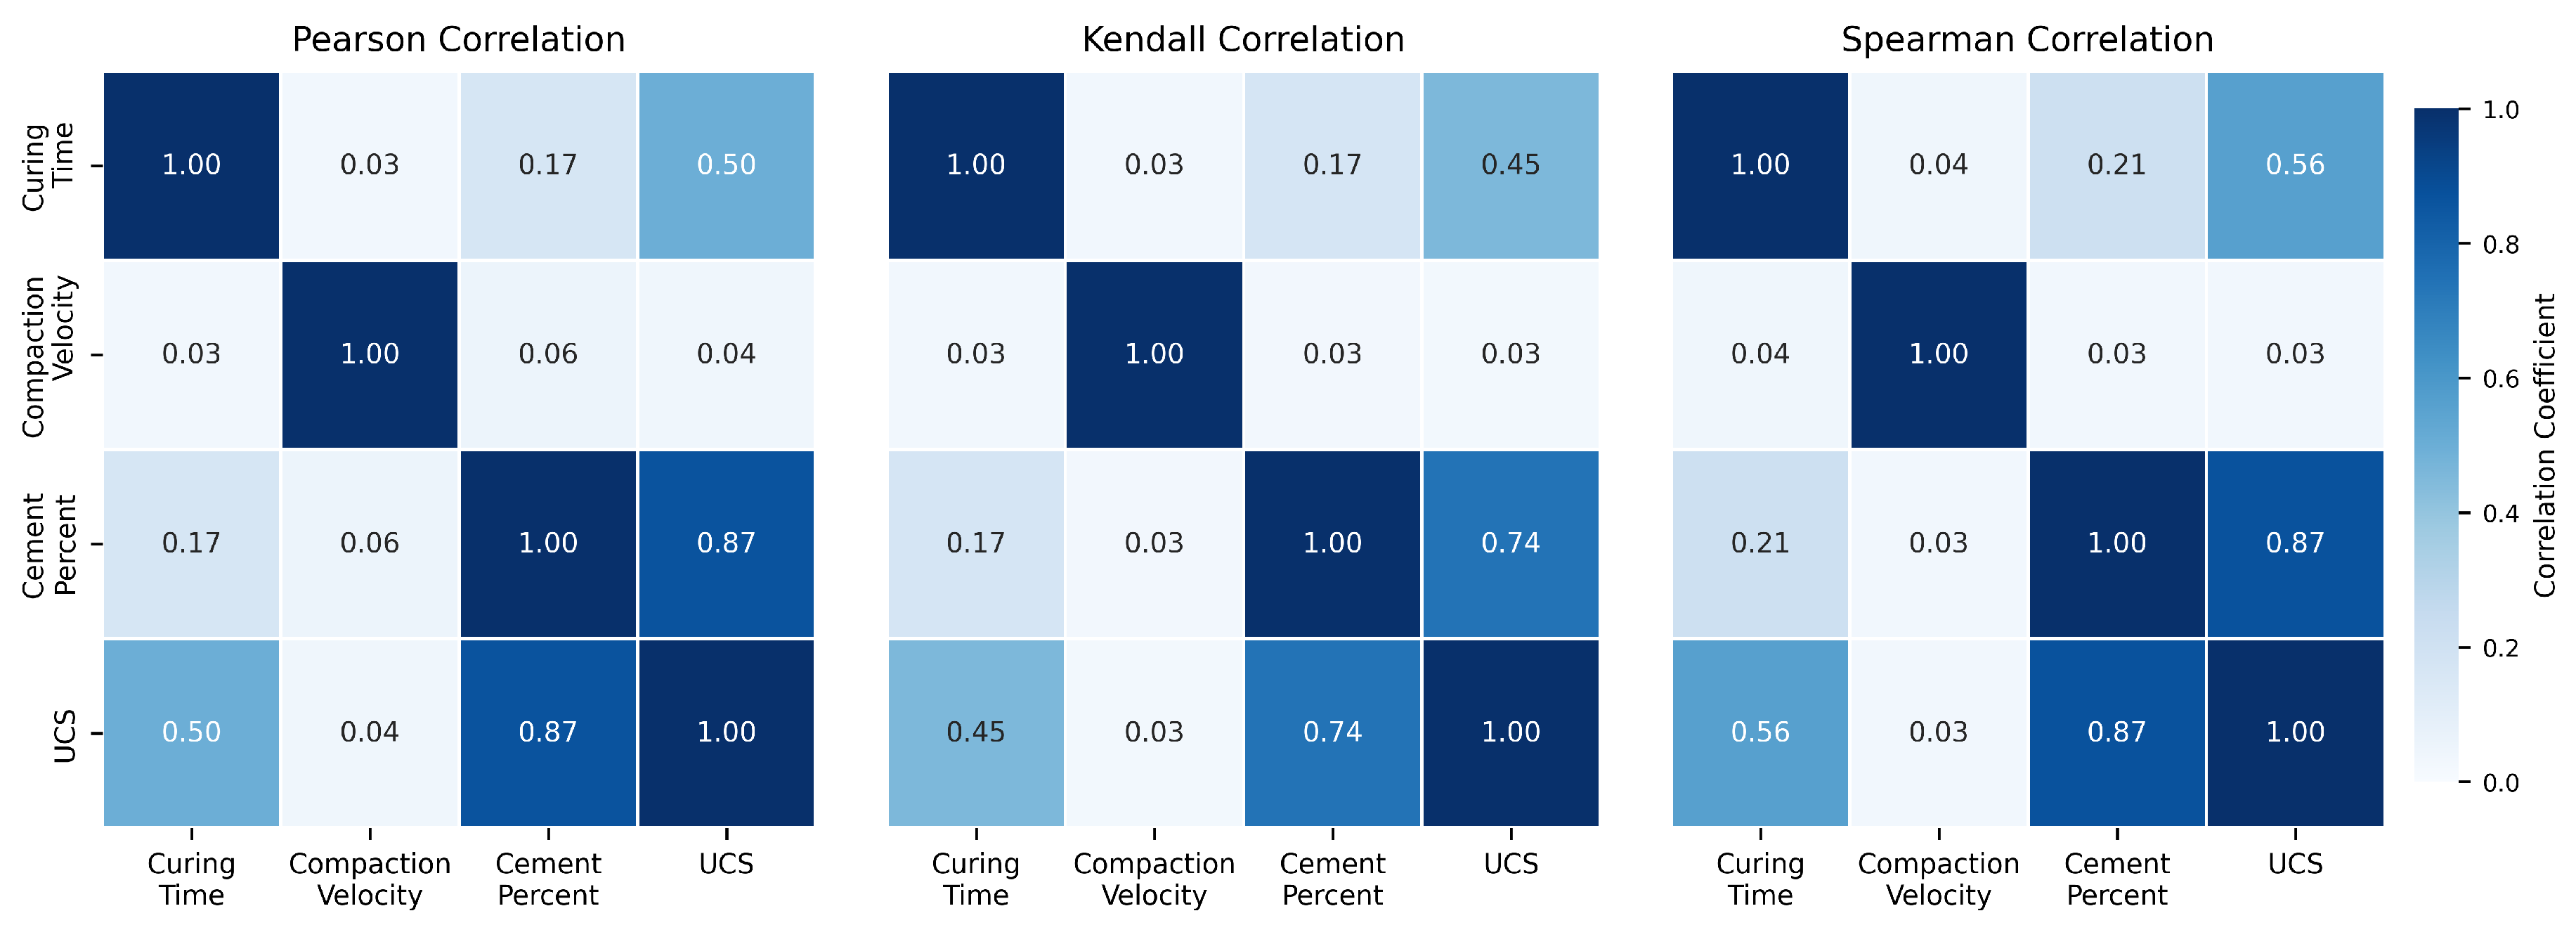
Figure 5.
Consolidated UCS analysis: effect of cement content and curing time.
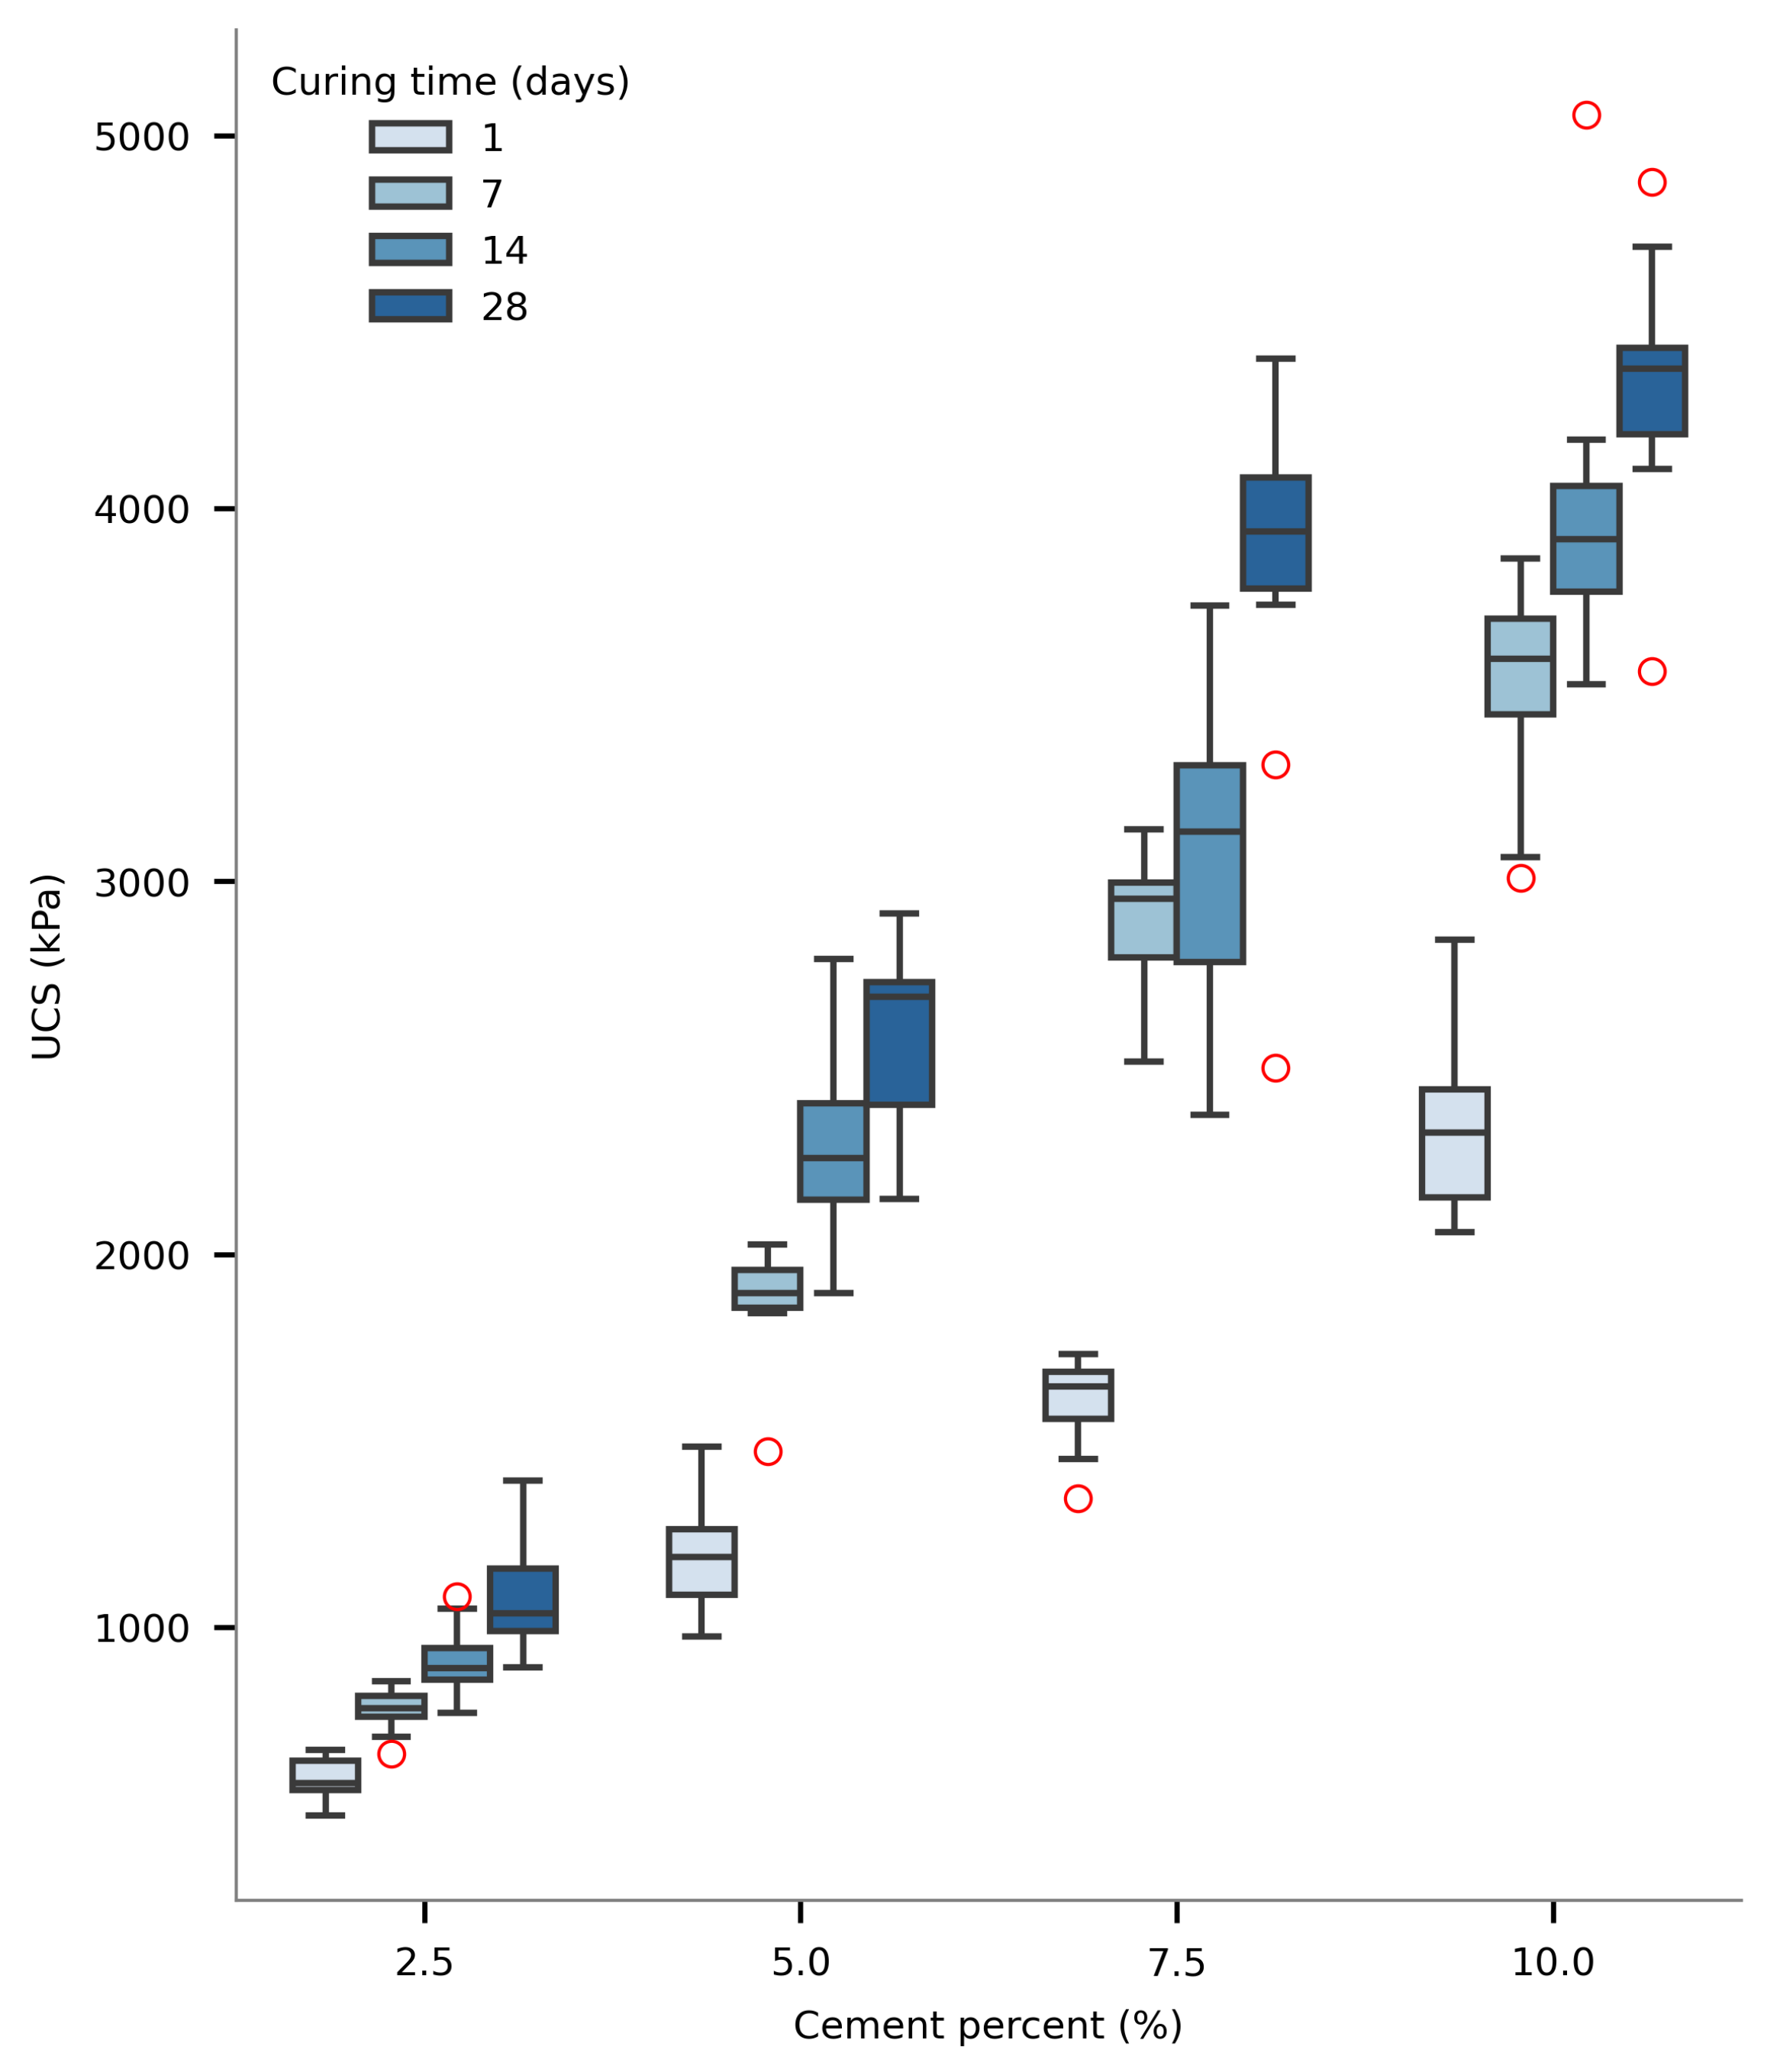
Figure 6.
Effect of compaction rate on UCS values for cement-treated soil across cement contents (increasing top-to-bottom) and curing times (increasing left-to-right).
Figure 6.
Effect of compaction rate on UCS values for cement-treated soil across cement contents (increasing top-to-bottom) and curing times (increasing left-to-right).
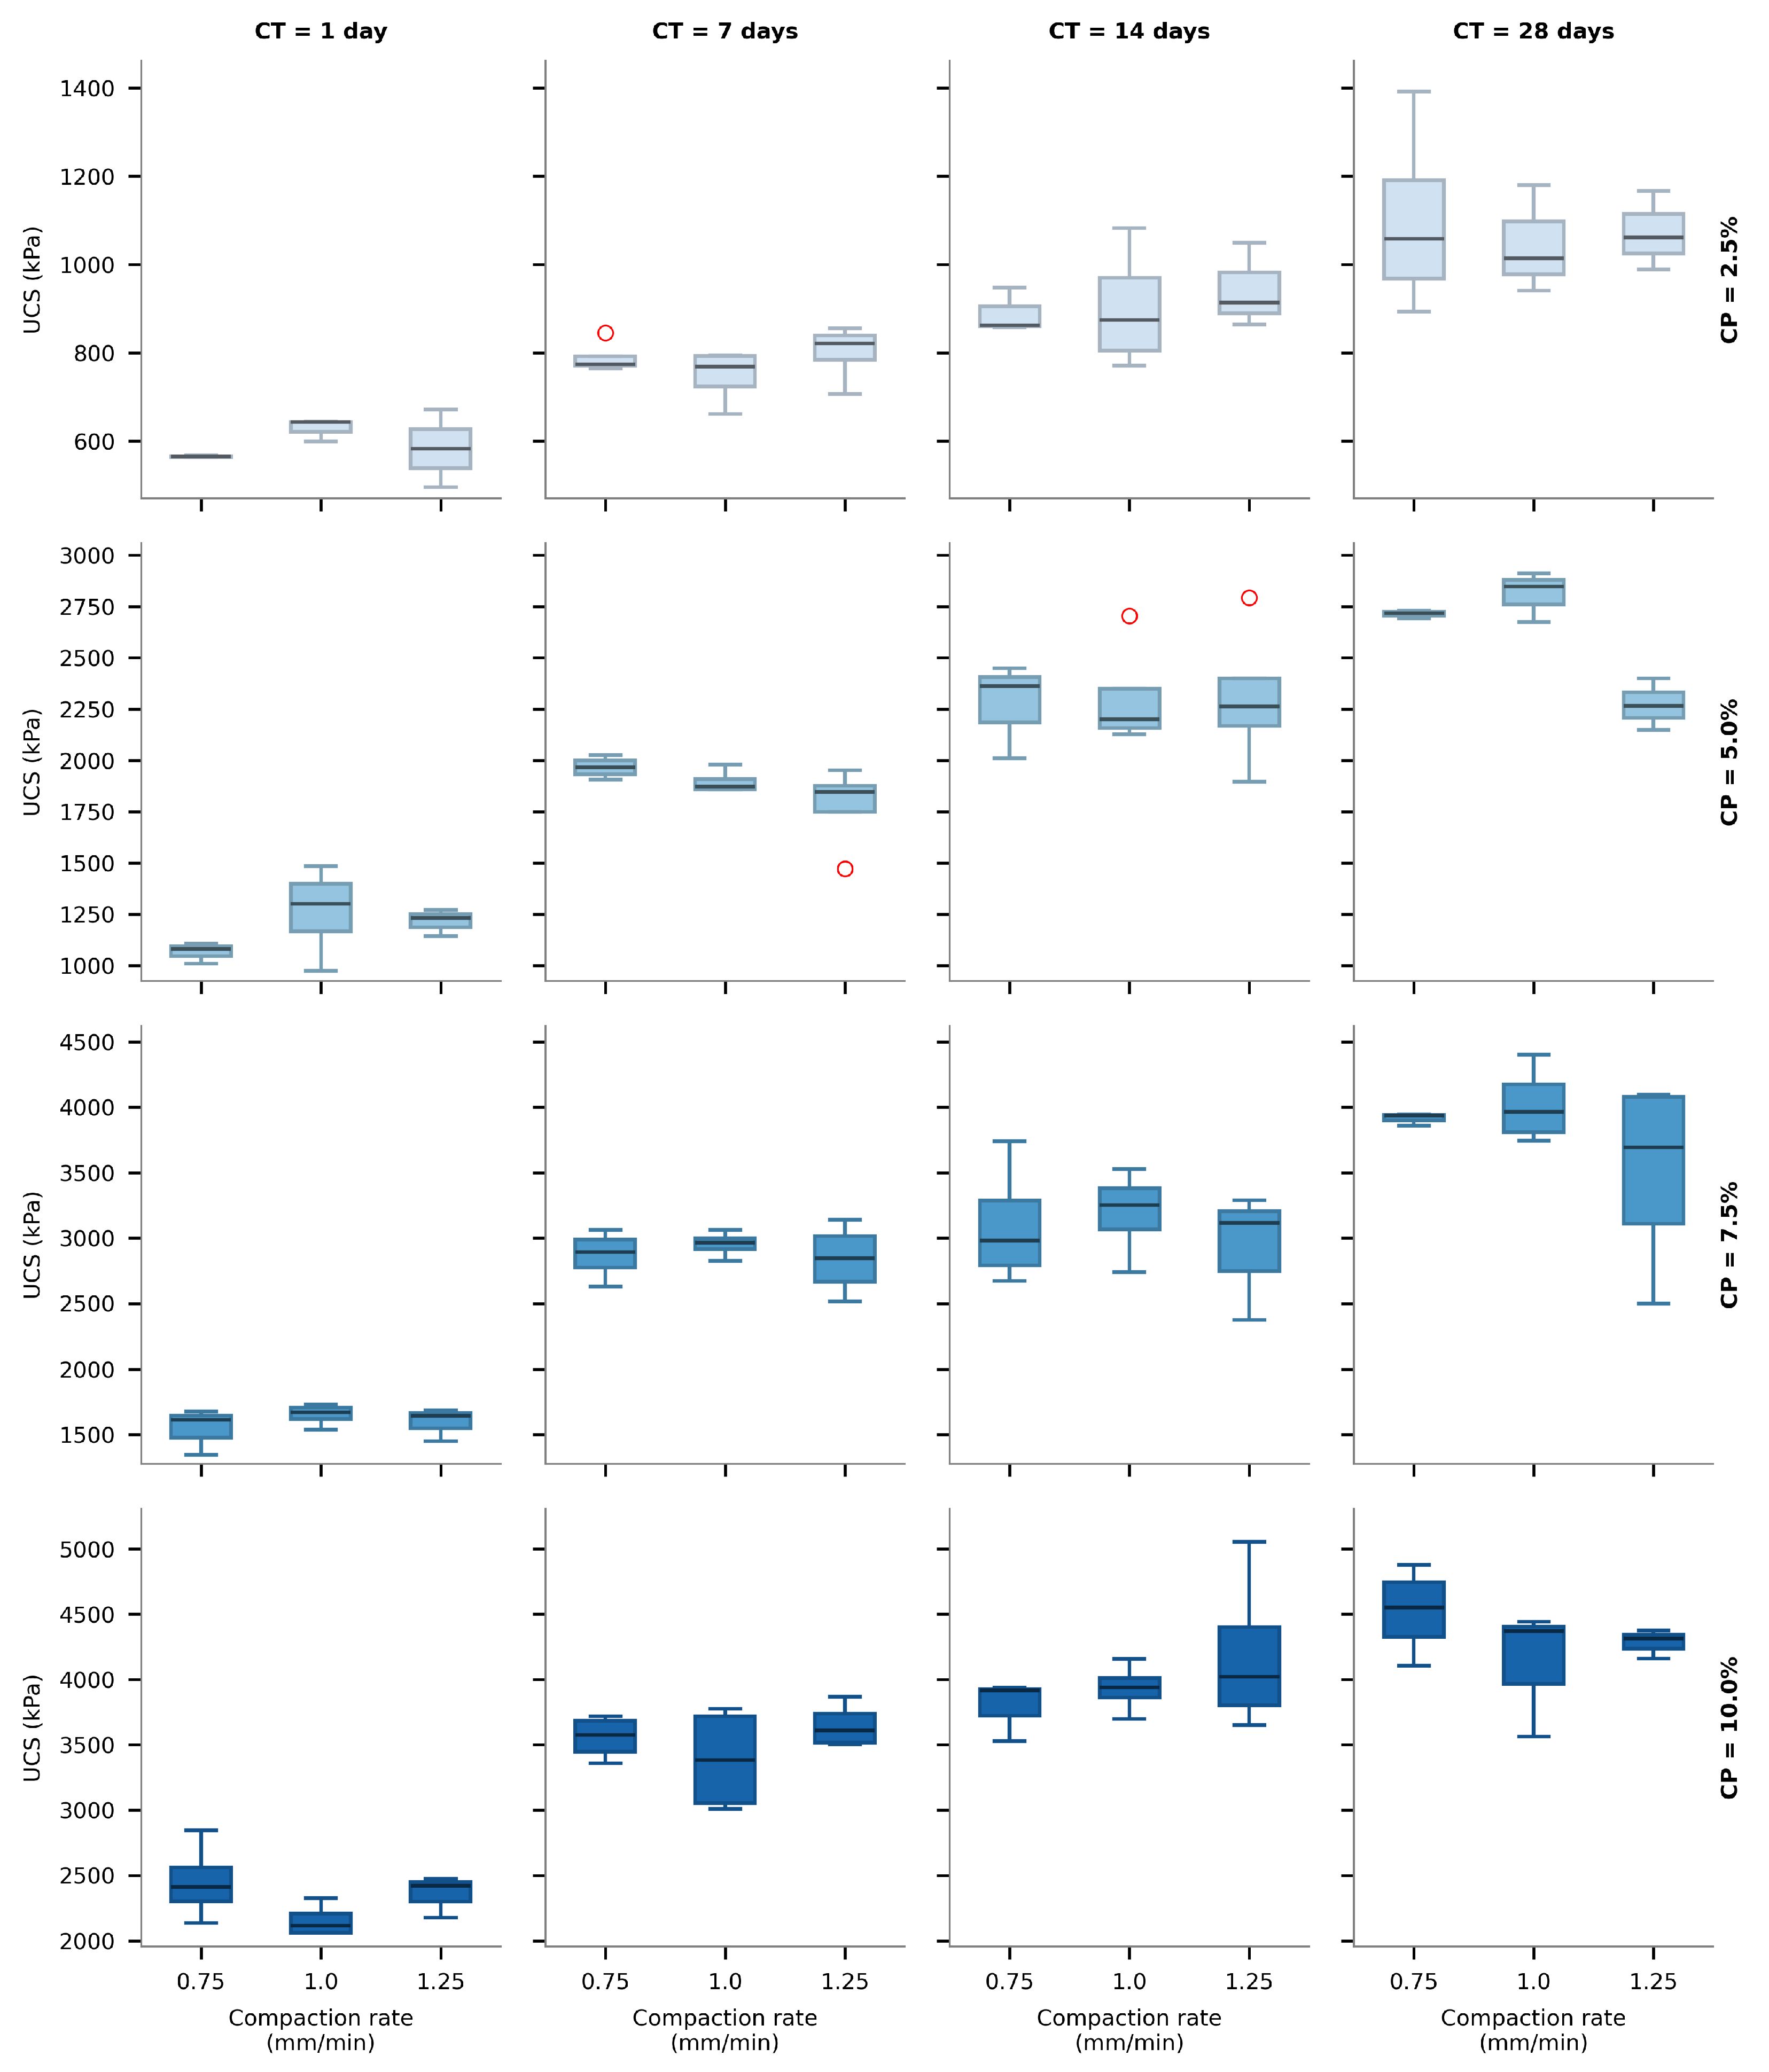
Figure 7.
Performance Analysis of Optimal Random Forest Model for UCS Prediction of Cement-Stabilized Soils: (a) UCS Predicted vs. Measured Values. (b) Distribution of Prediction Errors. (c) Residual Analysis of Predictions. (d) Relative Importance of Input Variables.
Figure 7.
Performance Analysis of Optimal Random Forest Model for UCS Prediction of Cement-Stabilized Soils: (a) UCS Predicted vs. Measured Values. (b) Distribution of Prediction Errors. (c) Residual Analysis of Predictions. (d) Relative Importance of Input Variables.
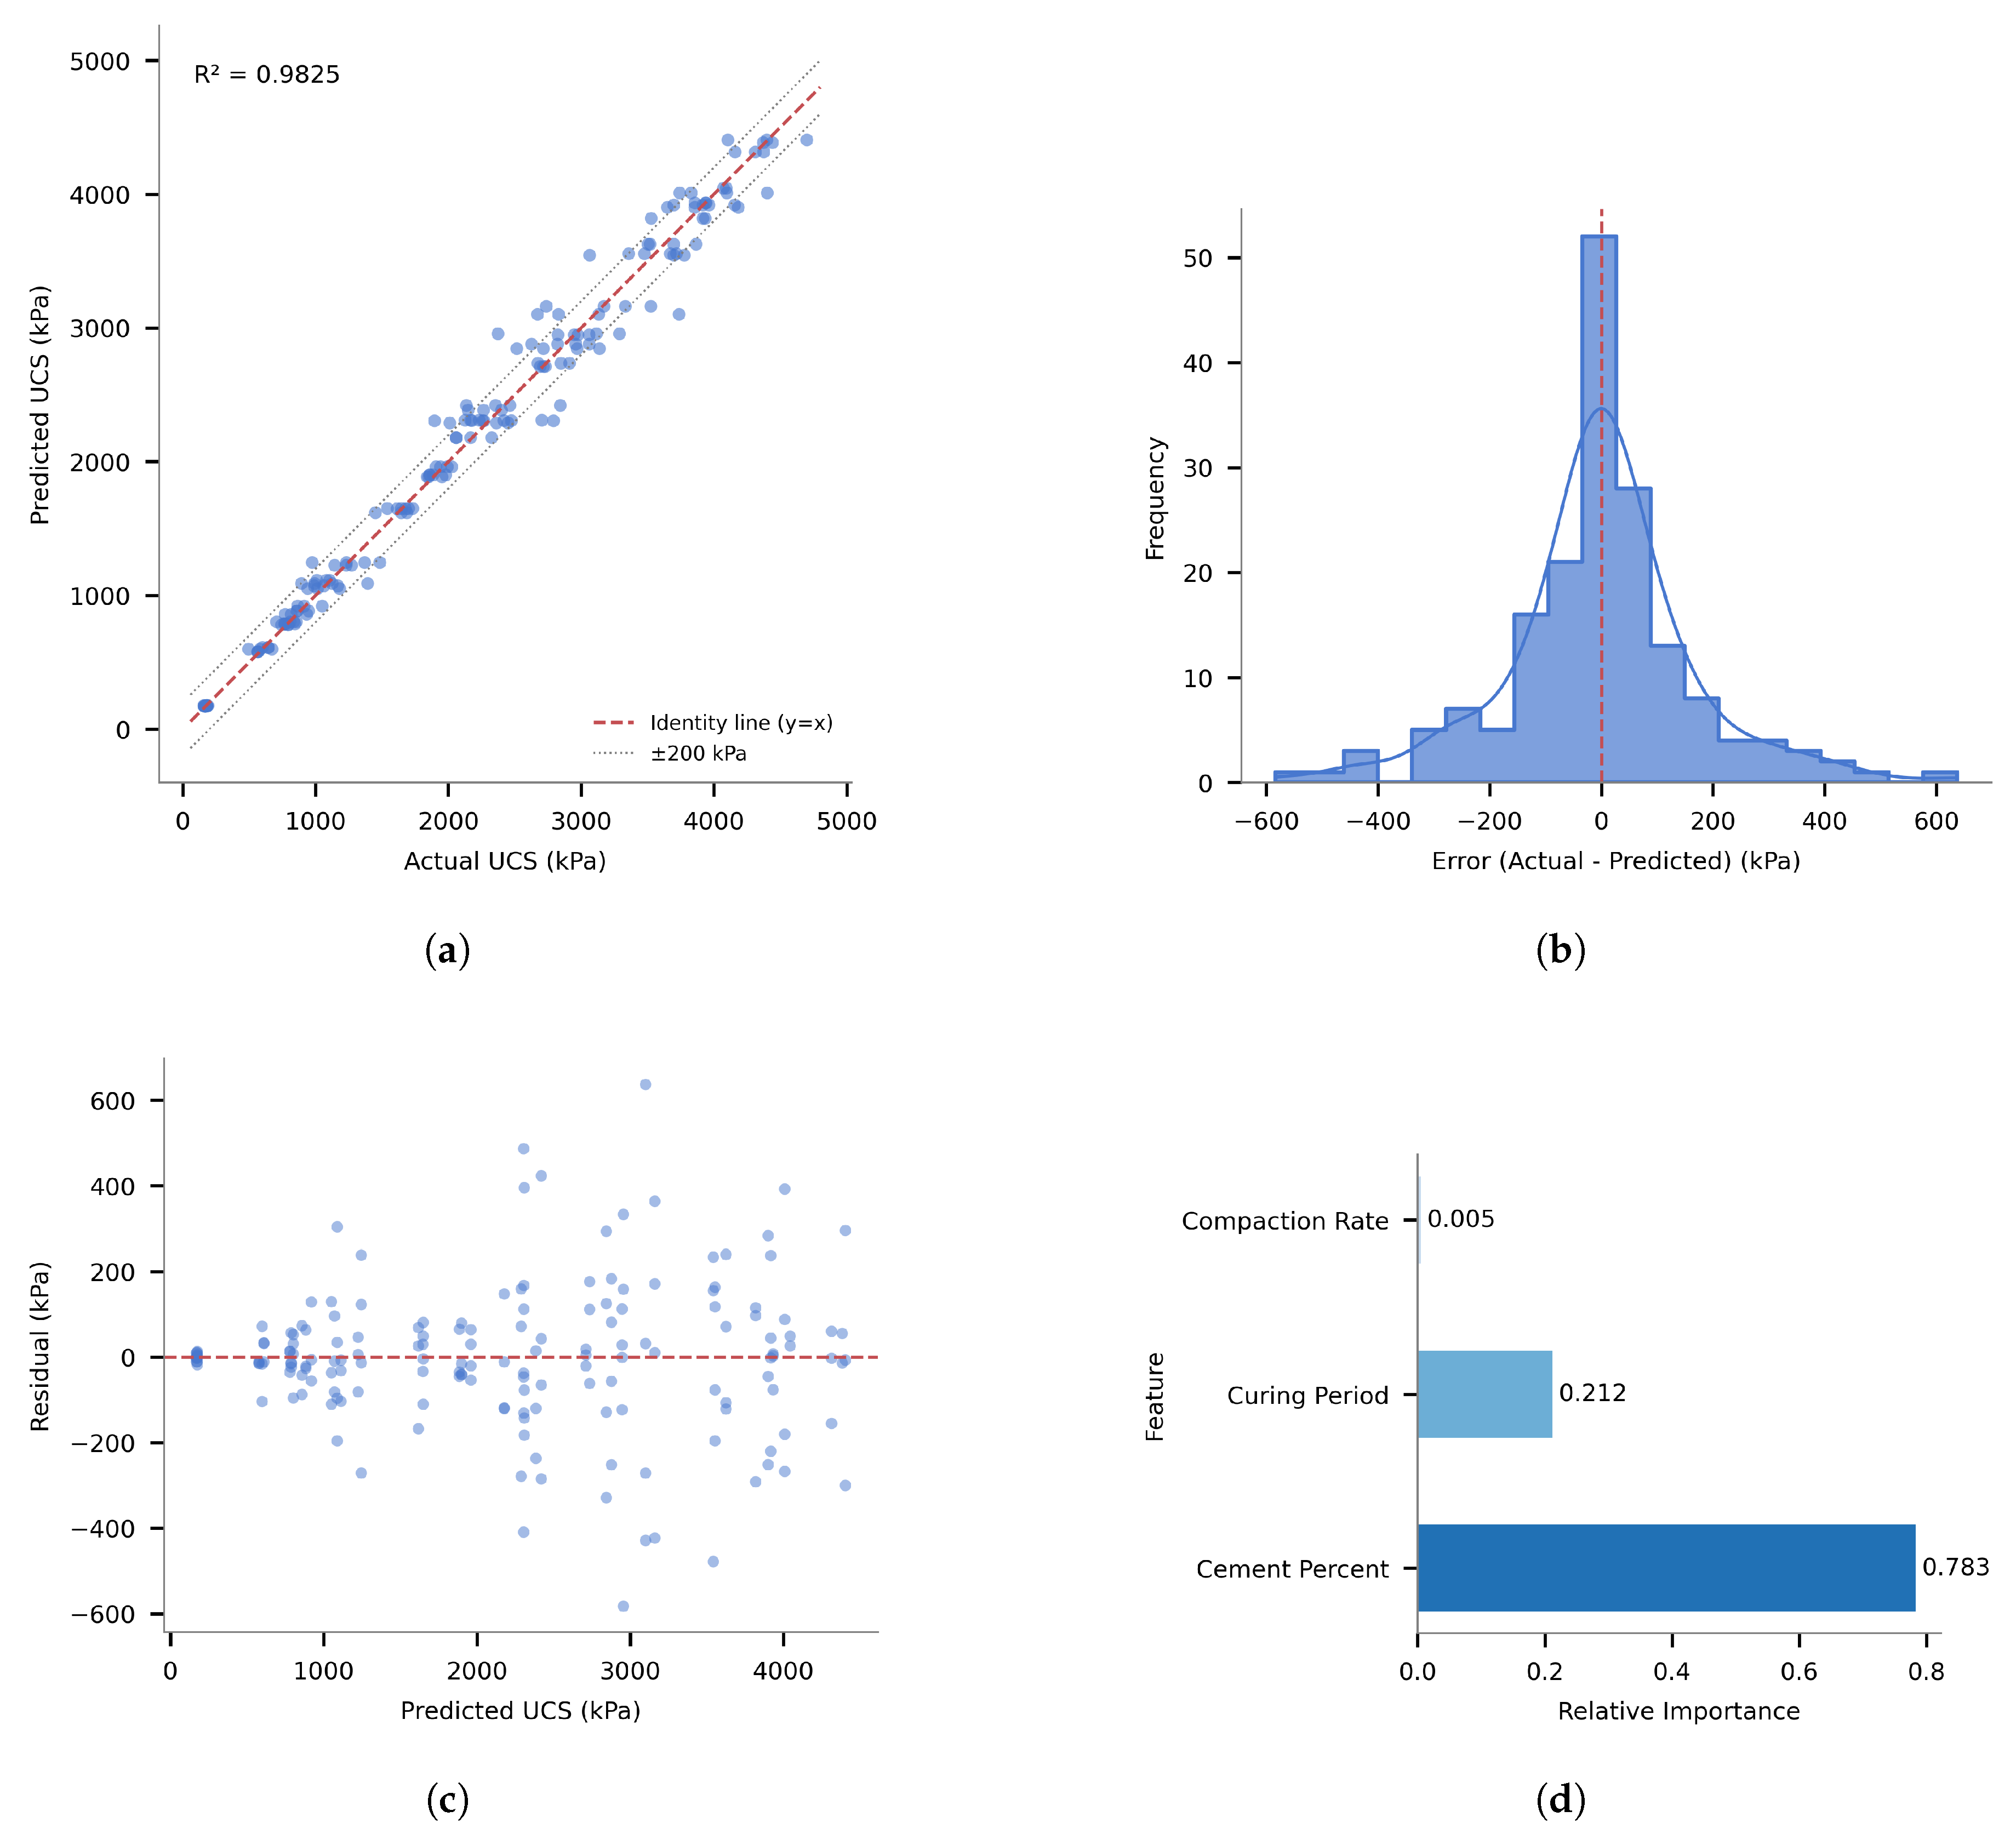

Table 1.
Chemical Composition (%) of Portland Cement Type CEM II/B-M(S-LL) 42.5 R
| CaO | MgO | ||||||
| 56.2 | 19.8 | 7.1 | 3.6 | 1.2 | 0.38 | 0.69 | 2.9 |
Table 2.
Cement - Soil Mix Samples Prepared by Static Compaction for Experimentation
| Sample Preparations |
Compaction Velocities (mm/min) |
Cement Percentages (%) | |||
| 2.5 | 5 | 7.5 | 10 | ||
| For 24 Hrs. | 1.25 | 3 | 4 | 3 | 3 |
| 1.0 | 3 | 3 | 4 | 4 | |
| 0.75 | 3 | 3 | 3 | 4 | |
| For 7 days | 1.25 | 4 | 4 | 4 | 4 |
| 1.0 | 4 | 4 | 4 | 4 | |
| 0.75 | 4 | 4 | 4 | 4 | |
| For 14 days | 1.25 | 3 | 4 | 3 | 4 |
| 1.0 | 4 | 4 | 4 | 4 | |
| 0.75 | 3 | 3 | 4 | 3 | |
| For 28 days | 1.25 | 3 | 3 | 4 | 3 |
| 1.0 | 3 | 3 | 4 | 3 | |
| 0.75 | 4 | 3 | 3 | 4 | |
| Overall Samples Used for Tests | 41 | 42 | 44 | 44 | |
| 171 | |||||
Table 3.
Model performance grouped by algorithm type.
| Model | MSE | RMSE | MAE | R2 |
|---|---|---|---|---|
| Linear Methods | ||||
| Linear Regression | 229558.94 | 479.12 | 405.85 | 0.8390 |
| Ridge | 229731.25 | 479.3 | 406.75 | 0.8388 |
| Lasso | 229581.38 | 479.15 | 406.16 | 0.8389 |
| ElasticNet | 345532.78 | 587.82 | 516.76 | 0.7576 |
| Tree-Based Methods | ||||
| Decision Tree | 83397.33 | 288.79 | 201.92 | 0.9415 |
| Random Forest | 70209.46 | 264.97 | 178.98 | 0.9507 |
| Gradient Boosting | 64004.83 | 252.99 | 171.5 | 0.9551 |
| XGBoost | 83396.61 | 288.78 | 201.92 | 0.9415 |
| LightGBM | 72716.76 | 269.66 | 181.41 | 0.9490 |
| CatBoost | 81478.5 | 285.44 | 200.55 | 0.9428 |
| Ada Boost | 84803.66 | 291.21 | 193.61 | 0.9405 |
| Other Non-Linear Methods | ||||
| SVR | 1403743.36 | 1184.8 | 1018.6 | 0.0152 |
| KNN | 83397.33 | 288.79 | 201.92 | 0.9415 |
| Gaussian Process | 83397.3 | 288.79 | 201.92 | 0.9415 |
Table 4.
Cross-validated performance metrics of optimized models.
| Model | R2 (mean ± std) | RMSE (kPa) | MAE (kPa) | MAPE (%) |
|---|---|---|---|---|
| Random Forest | 0.9673 ± 0.0097 | 220.76 | 152.58 | 7.41 |
| Gradient Boosting | 0.9669 ± 0.0095 | 221.60 | 156.65 | 9.52 |
| XGBoost | 0.9655 ± 0.0099 | 226.61 | 164.63 | 9.02 |
Table 5.
Hyperparameter Configurations for Machine Learning Models Used in UCS Prediction
| Hyperparameter | Random Forest | Gradient Boosting | XGBoost | |||
|---|---|---|---|---|---|---|
| Optimal | Best Fold | Optimal | Best Fold | Optimal | Best Fold | |
| n_estimators | 174 | 211 | 157 | 120 | 231 | 203 |
| max_depth | 9 | 5 | 4 | 4 | 8 | 4 |
| min_samples_split | 4 | 4 | - | - | - | - |
| min_samples_leaf | 2 | 2 | - | - | - | - |
| learning_rate | - | - | 0.026 | 0.032 | 0.121 | 0.079 |
| min_child_weight | - | - | - | - | 4 | 6 |
| subsample | - | - | 0.857 | 0.856 | 0.835 | 0.954 |
| colsample_bytree | - | - | - | - | 0.968 | 0.813 |
Table 6.
Comparative Performance of Machine Learning Models for UCS Prediction.
| Metric | Random Forest | Gradient Boosting | XGBoost | |||
|---|---|---|---|---|---|---|
| Optimal | Best Fold | Optimal | Best Fold | Optimal | Best Fold | |
| R2 | 0.9825 | 0.9806 | 0.9817 | 0.9814 | 0.9804 | 0.9804 |
| RMSE | 167.52 | 176.69 | 171.68 | 173.08 | 177.47 | 177.45 |
| MAE | 112.48 | 118.84 | 120.08 | 121.92 | 124.93 | 124.52 |
| EVS | 0.9825 | 0.9806 | 0.9817 | 0.9814 | 0.9804 | 0.9804 |
| Max Error | 636.97 | 701.06 | 665.92 | 677.68 | 708.35 | 682.96 |
| Median AE | 69.17 | 73.86 | 73.56 | 71.42 | 84.79 | 85.83 |
| CV RMSE | 7.83 | 8.26 | 8.02 | 8.09 | 8.29 | 8.29 |
| MAPE | 5.55 | 5.80 | 7.08 | 7.57 | 6.37 | 6.39 |
Table 7.
Error statistics
| Metric | Random Forest | Gradient Boosting | XGBoost | |||
|---|---|---|---|---|---|---|
| Optimal | Best Fold | Optimal | Best Fold | Optimal | Best Fold | |
| Mean Error (kPa) | -1.62 | -0.58 | 0.99 | 0.56 | 0.71 | -0.57 |
| Std Dev (kPa) | 167.51 | 176.69 | 171.67 | 173.08 | 177.47 | 177.45 |
| Min Error (kPa) | -583.13 | -634.52 | -665.92 | -677.68 | -646.61 | -678.60 |
| Max Error (kPa) | 636.97 | 701.06 | 660.95 | 668.68 | 708.35 | 682.96 |
| Errors ±100 kPa (%) | 60.6 | 57.7 | 58.3 | 57.1 | 53.7 | 56.6 |
| Errors ±200 kPa (%) | 81.7 | 79.4 | 80.6 | 80.6 | 77.7 | 76.6 |
| Errors ±300 kPa (%) | 91.4 | 89.1 | 90.9 | 91.4 | 90.9 | 91.4 |
Disclaimer/Publisher’s Note: The statements, opinions and data contained in all publications are solely those of the individual author(s) and contributor(s) and not of MDPI and/or the editor(s). MDPI and/or the editor(s) disclaim responsibility for any injury to people or property resulting from any ideas, methods, instructions or products referred to in the content. |
© 2025 by the authors. Licensee MDPI, Basel, Switzerland. This article is an open access article distributed under the terms and conditions of the Creative Commons Attribution (CC BY) license (http://creativecommons.org/licenses/by/4.0/).
Copyright: This open access article is published under a Creative Commons CC BY 4.0 license, which permit the free download, distribution, and reuse, provided that the author and preprint are cited in any reuse.


