Submitted:
19 March 2025
Posted:
21 March 2025
You are already at the latest version
Abstract
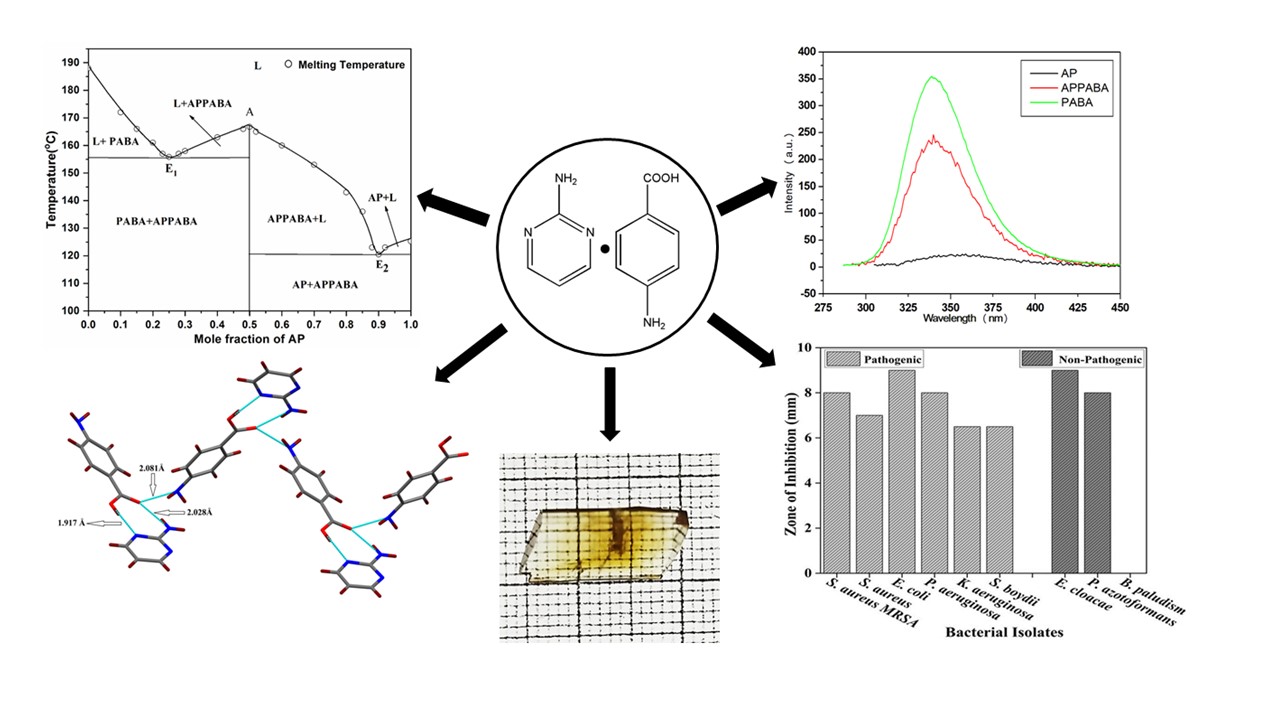
The organic compounds, 2-aminopyrimidine (AP) and 4-aminobenzoic acid (PABA), are selected for the synthesis of a compound by establishing the phase diagram adopting the solid-state synthesis method. Phase diagram study infers the formation of a novel intermolecular compound (IMC) at 1:1 stoichiometric ratio of AP and PABA along with two eutectics at 0.25 and 0.90 mole fractions of AP. The FTIR and NMR spectroscopy are studied for structure elucidation of intermolecular compound. Powder X-ray diffraction study reveals the novel nature of IMC (APPABA) and the mechanical mixture nature of eutectics. Sharp and single peak of the DSC curve suggests the melting and pure nature of the synthesised IMC. Various thermodynamic parameters of IMC and eutectics have been studied. The single crystal of IMC has grown from solution and its single crystal X-ray diffraction analysis reveals that IMC has crystallised in a monoclinic having P21/n space group. Hirshfeld surface analysis further validated the weak non-covalent interactions summarized through single crystal X-ray study. Studies on IMC thoroughly have been done for its antibacterial activity and it has shown significant positive responses against various pathogenic microbial isolates (Staphylococcus aureus, Escherichia coli, Pseudomonas aeruginosa, Klebsiella aeruginosa, Shigella boydii) and non-pathogenic microbial isolates (Enterobacter cloacae, Pseudomonas azotoformans). It was also found effective against methicillin-resistant bacterial strains viz. Staphylococcus aureus MRSA. The biodegradable IMC is an effective functional material with its future applicability as an antibacterial agent extending up to drug-resistant bacterial strains.
Keywords:
phase diagram
; solid-state synthesis
; intermolecular compound
; single crystal
; antibacterial activity
1. Introduction
Over the years, the world has witnessed several important applications of organic compounds, which have immense importance particularly in the field of biomedical and pharmaceutical sciences as biomaterials [1,2]. International health organizations and research scientists across the globe are serious about the infectious diseases which are posing a mortal threat to human health. The rise in health hazards and excessive use of antibiotics influence the pathogens to become resistant to them. The development of newer and more advanced drugs is demanded to work effectively against both, the drug-sensitive and drug-resistant bacteria [3]. The organic ligands, containing heteroatoms such as nitrogen, sulphur, and oxygen in the aromatic ring system, often possess important medicinal properties such as anti-bacterial [4], anti-fungal [5], anti-tubercular [6] and anti-inflammatory [7]. Nonetheless, the solubility and bioavailability of the synthesized drug molecules are the major challenges in the pharmaceutical sector. To improve and overcome these issues, binary organic materials such as eutectics [8], deep eutectics [9], co-crystals [10] and salt formation [11] have been recognised in the past few years. The systematic studies on binary organic materials for their physicochemical, thermodynamic, solidification behaviour, thermal stability, reaction kinetics, hygroscopicity and solubility [12,13,14,15,16] are the worth parameters of the newer materials which improve the organic materials to that of the starting parent compounds.
The adopted solid-state green synthesis approach is significant, because it is environment friendly, solvent free, not tedious, less time consuming and cost effective, over many other synthetic procedures. The study of the phase diagram infers the nature of each binary composition, solidification behaviour, and phases which are in equilibrium at temperatures and composition. It also infers the stoichiometric ratio of parents which could yield the novel material with utmost 100% yield. The solid-state synthesis helps in avoiding the use of solvents. Because of the importance of binary organic materials, two starting parent compounds, 2-aminopyrimidine (AP) and 4-aminobenzoic acid (PABA) are selected to search the materials having medicinal properties. The nitrogen containing heterocyclic ring, such as pyrimidine, is the key structural unit in many natural and synthetic biomolecules which are known for their significant applications in medicinal chemistry [17,18]. 2-aminopyrimidine and its derivatives have special significance among the biologically active classes of compounds [19] which are known for a wide spectrum such as antimicrobial [20,21], anti-oxidant [17], lysine-specific demethylase-1 (LSD1) inhibitor [22], anti-inflammatory [21], antitubercular [23], adenosine receptor antagonist [24], antitumour [25], and antimalarial agent [26]. The organic compound 4-aminobenzoic acid is a member of the Vitamin B complex and has been known as an antibacterial agent [27].
With a view of the significant importance of the parent compounds, AP and PABA, these compounds have been selected for the detailed study of the phase diagram, formation of IMC, eutectics and their systematic studies for thermal behaviour, thermal properties, and structural changes. The synthesized intermolecular compound (APPABA) has been characterised using differential scanning calorimetry (DSC), FTIR, NMR, X-ray diffraction, UV-vis absorption and fluorescence emission properties. The single crystal of novel intermolecular compound has been grown and the crystal of IMC has been studied for the crystal structure and atomic packing. The IMC has also been thoroughly investigated for the biological activity against non-pathogenic as well as pathogenic bacteria.
2. Results and Discussion
2.1. Phase Diagram Study
The phase diagram between 2-aminopyrimidine (AP) and 4-aminobenzoic acid (PABA), are represented in Figure 1 in terms of the composition-temperature curve where the mole fraction of the parent component (AP) is plotted on X-axis and their respective melting temperature on Y-axis. The phase diagram infers that on the addition of AP in PABA, i.e as the mole fraction of PABA decreases, the melting temperature of PABA in the mixture decreases and continues to decrease till the first lowest melting temperature,167 ºC, at point E1 which is the first eutectic point at 0.25 mole fraction of AP. From this point, the further increase in the mole fraction of AP causes the increase in melting temperature of the mixture and reaches the maximum melting temperature (156 ºC) at point A, which indicates the formation of a new and stable intermolecular compound. Point A is a congruent melting point where the compositions of solid and melt are the same. The further increase in the mole fraction of AP again causes a decrease in the melting temperature of the mixture, which reaches the second minimum point (120 ºC) at E2, which is the second eutectic of the system at 0.90 mole fraction of AP. It is clearly obvious that the resulting intermolecular compound plays the role of one of the parent components of both eutectics.
At E1 and E2 the respective eutectic reaction may be represented as:
E1, L ⇌ + SPABA + SIMC
E2, L ⇌ + SIMC + SAP
The above equations represent the reaction occurring at the eutectic points (E1 and E2), where the homogeneous liquid phase is in equilibrium with two solid phases, and the points E1 and E2 are invariant points having zero degrees of freedom. The experimental solid–liquid equilibrium data and liquid mole fractions XAP for the AP―PABA system have been provided in Supplementary (Table S1).
2.2. Spectral Studies
2.2.1. FTIR Absorption Studies
The FTIR studies infer the formation of the intermolecular compound and give information regarding the functional groups that are involved in the interaction between the parent components. In the case of 2-aminopyrimidine (AP), the peaks observed at 3353 cm−1 and 3171 cm−1 are due to the asymmetric and symmetric stretching vibration of the primary amine group (―NH2) attached to the aromatic ring. The peak observed at 1041 cm−1is due to aliphatic C―N stretching vibrations while the peaks observed at 1132 cm−1 and 1179 cm−1 are due to aromatic C―N stretching vibrations and NH2 out of plane bending vibrations at 999 cm−1. In the case of 4-aminobenzoic acid (PABA), the peaks observed at 3382 cm−1 and 3364 cm−1 are due to the asymmetric and symmetric stretch of N―H. The peak due to the free ―OH group is observed at 3461 cm−1. The characteristic carbonyl (C=O) peak is observed at 1660 cm−1. The peak observed at 1292 cm−1 is due to C―N stretch while the peaks observed at 1422 cm−1 and 964 cm−1 are due to O―H bending vibrations. The CH2 bending vibration observed at 843cm−1 corresponds to the 1-4 substitution.
The FTIR spectrum of the intermolecular compound (APPABA) infers some certain differences from that of the FTIR spectra of the parent components (Figure 2). There have been significant changes in the stretching frequency of NH2 of AP and OH of PABA in the intermolecular compound. Interestingly, the NH2 stretching vibrations of PABA could not be observed in the intermolecular compound as well as the downshifting in the wave number of the carbonyl group of PABA from 1660 cm−1 to 1634 cm−1 could also be observed. All these changes, in the vibration frequencies of functional groups, suggest their involvement in hydrogen bonding among the parent compounds to yield the new intermolecular compound.
2.2.2. NMR Studies
NMR Spectra of 2-Aminopyrimidine (AP)
The proton NMR spectrum of 2-aminopyrimidine shows three major signals. The signal of amino protons (―NH2) appears as a singlet at 6.53 ppm. The signal for Ha proton appears as a triplet at 6.48 ppm while the signal for Hb proton appears as a doublet at 8.20 ppm. The carbon NMR spectrum of 2-aminopyrimidine shows three signals, the signal at 164.05 ppm is due to C1 carbon, the C2 and C4 are equivalent carbons, and their signal appears at 158.06 ppm while the signal for C3 carbon appears at 110.29 ppm. The 1H and 13C NMR spectra are shown in Figure S2 (supporting information).
NMR Spectra of 4-Aminobenzoic Acid (PABA)
The proton NMR spectrum of PABA shows four signals. The signal due to carboxylic proton appears at 11.95 ppm while the amino protons appear at 5.87 ppm. The signals appear at 7.62 ppm and 6.54 ppm are due to aromatic ring protons. The carbon NMR spectrum of PABA shows five signals. The signal due to carbonyl carbon (C1) appears at 168.04 ppm whereas the signals for other carbon atoms appear at 117.37 ppm for C2, 131.57 ppm for C3, 112.73 ppm for C4 and 153.42 ppm for C5 carbon, respectively. The 1H and 13C NMR spectra are shown in Figure S3.
NMR Spectra of Intermolecular Compound (APPABA)
The proton NMR of the synthesized intermolecular compound (APPABA) shows five signals which are present in either of the parent compounds (AP and PABA) at 8.22 ppm, 7.62 ppm, 6.60 ppm, 6.55 ppm, and 5.84 ppm. However, the signal due to the carboxylic proton present in PABA (11.95 ppm) as well as signal due to amino proton present in AP (6.53 ppm) were found completely missing in the synthesized intermolecular compound, which infers that there might be some intermolecular hydrogen bonding interactions involved via these functional groups among parent compounds. The 1H and 13C NMR spectra of APPABA are given in Figure S4.
2.3. X-Ray Diffraction Studies
2.3.1. Powder X-Ray Diffraction
The powder X-ray diffraction (PXRD) pattern of parents, AP and PABA, eutectics and IMC have been depicted in Figure 3. The Braggs peaks of AP, PABA and intermolecular compound (APPABA) have been respectively assigned by using the #, $ and @ symbols. In the PXRD pattern of intermolecular compound (APPABA), some distinct new peaks have been observed which could not be assigned for any of the parent compounds and thereby suggest the IMC is a new entity. However, in the case of eutectics (E1 and E2), the PXRD pattern of eutectic (E1) is a blend of the peaks of PABA and APPABA while the PXRD pattern of eutectic (E2) is the blend of AP and APPABA. These observations obtained from the PXRD pattern of eutectics (E1 and E2) suggest that eutectics are not a new entity rather they are a simple mechanical mixture of either of the parent compound and intermolecular compound.
2.3.2. Single Crystal Growth and Single Crystal Diffraction
The single crystals of the newly synthesized compound APPABA have been grown from the mixed solvent using the slow evaporation technique. The photograph of one of the grown APPABA crystals having dimensions 3 cm (length) and 1 cm (width) is depicted in Figure 4. A small piece was cut from the large sized crystal to perform the single crystal X-ray diffraction and crystal analysis. The solved crystal structure of APPABA and its ORTEP diagram (Figure 5) reveals that the synthesized APPABA compound is a co-crystal of its parent compounds, 4-aminobenzoic acid (molecule-A) and 2-aminopyrimidine (molecule-B). The APPABA has crystallized in monoclinic P21/n space group with both molecules in the asymmetric unit and two molecules in the unit cell. The important crystallographic parameters and other information are tabulated in Table 1. Molecule A and molecule B are joined together via hydrogen bonding between the carboxylic group of molecule A with the amine group and ring nitrogen atom of molecule B, i.e., O=C―O―H-----N and OH―C=O-----H―N―H. The packing diagram of co-crystal APPABA is given in Figure 6. While viewing along the c-axis, the growth pattern of the co-crystal reveals the zig-zag type structure (Figure 7).
2.3.3. Hirshfield Surface Analysis
The Hirshfeld surfaces for APPABA are presented in Figure 8. The dnorm surfaces for both clusters are mapped over a dnorm range of -0.5 to 1.5 Å. Also, the surfaces are presented as transparent for the visualization of the aromatic as well as the puckered ring moieties around which they were computed. The weak non-covalent interactions discussed in the X-ray crystallography section are summarized effectively as the deep red circular depressions in the dnorm surfaces, indicating strong non-covalent interactions. The dominant C∙∙∙H, O∙∙∙H, N∙∙∙H and C∙∙∙O interactions in APPABA exist in Hirshfeld surface plots as the red shaded area. Also, the small area and light colour on the surface represent weaker and longer contacts.
Also, in the fingerprint plots of the intermolecular compound, APABA, the complementary regions can be visualized where one molecule acts as a donor (de > di) and the other as an acceptor (de< di). In IMC, the C∙∙∙H interaction appears in the region 1.6 Å < (de + di) < 2.4 Å with 22.7% contribution as butterfly-shaped pattern, O∙∙∙H intermolecular interaction appears between 1.1 < (de + di) < 2.3 Å with 13.7% contribution as sharp pair of spikes, N∙∙∙H intermolecular interaction appears between 1.0 Å < (de + di) < 2.4 Å with 19.2% contribution as pair of spikes connected at ends and C∙∙∙O intermolecular interaction appears at mid portion of fingerprint plot in between 1.8 Å < (de + di) < 2.0 Å with 0.3% contribution in full fingerprint 2D plots.
2.4. Thermochemistry and Thermodynamic Studies
2.4.1. Differential Scanning Calorimetry and Thermal Studies:
The thermal behaviour and properties of the synthesized intermolecular compound and eutectics have been studied to get an idea about the thermal stability, phase transitions as well as the nature of interaction existing between the parent compounds. The Differential Scanning Calorimetry (DSC) curves depicted in Figure 9 show the melting peaks for both the eutectics and sharp melting for intermolecular compound likewise the parent compounds (AP and PABA). The sharp and single melting peak of APPAB suggests its pure nature. The experimental heat of fusion values obtained from the DSC curves along with the theoretically calculated heat of fusion values, using mixture law [28], are reported in Table 2. The heat of mixing values has been estimated which helps in understanding the association behaviour of molecules in the eutectic melt. Based on the heat of mixing values, three types of structures are possible [29]. However, the studies of interfacial energy, Jackson’s roughness parameter and grain boundary are important as these parameters significantly influence crystal growth and crystal morphology. The interfacial energies were calculated by using the formula [30]:
where, NA is the Avogadro number, VM is the molar volume, and parameter C is constant, and it lies between 0.30 and 0.35. The value of C used for calculation was 0.35. The Jackson’s roughness parameter were studies using the following relation:
where ξ is a crystallographic factor which is generally equal or less than one, for present calculation it is taken as 1. The interfacial energy and roughness parameter are tabulated in Table 3.
2.4.2. Excess Thermodynamic Function
The excess thermodynamic functions signify the deviation from the ideal behaviour, in terms of excess free energy (gE), excess enthalpy (hE) and excess entropy (sE). These excess thermodynamic parameters were studied using the methods reported earlier [30] and the calculated values thus obtained are tabulated in Table 4.
2.5. Optical Studies
2.5.1. UV-Vis Absorption Studies
To study the optical property, the UV-vis absorption spectra of intermolecular compound (APPABA) and parent compounds (AP and PABA) are recorded at room temperature in methanol solution in the wavelength range 190-1200 nm and the spectra has been shown in Figure 10a. The absorption spectra of AP, show two bands one band at 225 nm and other band at 295 nm due to π→π* and n→π* transitions, respectively. The other parent compound, PABA, also shows two absorption bands (208 nm and 277 nm). The band at 208 nm is ascribed to π→π* while the band at 277 nm is ascribed to n→π* (primary amino group) transitions. The UV-vis spectra of intermolecular compound (APPABA) show three absorption bands (209 nm, 223 nm and 282 nm). It is evident from Figure 10a that the absorption band in intermolecular compound occurs at 209 nm and 223 nm is of higher intensity as compared to both the parent compounds. The band observed at maximum wavelength in intermolecular compound is found to be red shifted and hypsochromic as compared to PABA while it is blue shifted and hyperchromic as compared to AP. These changes in the absorption spectra infer the formation of an intermolecular compound (APPABA).
2.5.2. Emission Studies
To study the fluorescence emission property and comparative fluorescence of the synthesized APPABA to that of parent compounds (AP and PABA), the same solution of each sample under identical conditions are used however each sample was excited with their respective maximum absorption wavelength. The experimental observation (Figure 10b) reveals that one of the parent compounds, AP, does not show any notable fluorescence emission whereas the other parent compound, PABA, shows highly intense fluorescence emission. However, the intermolecular compound, APPABA when excited with its maximum wavelength (λmax, 282 nm) exhibits strong fluorescence emission than one of its parent compounds (AP) but less fluorescence emission than another parent compound (PABA) at 340 nm with a Stoke shift of 58 nm.
2.6. Antibacterial Studies
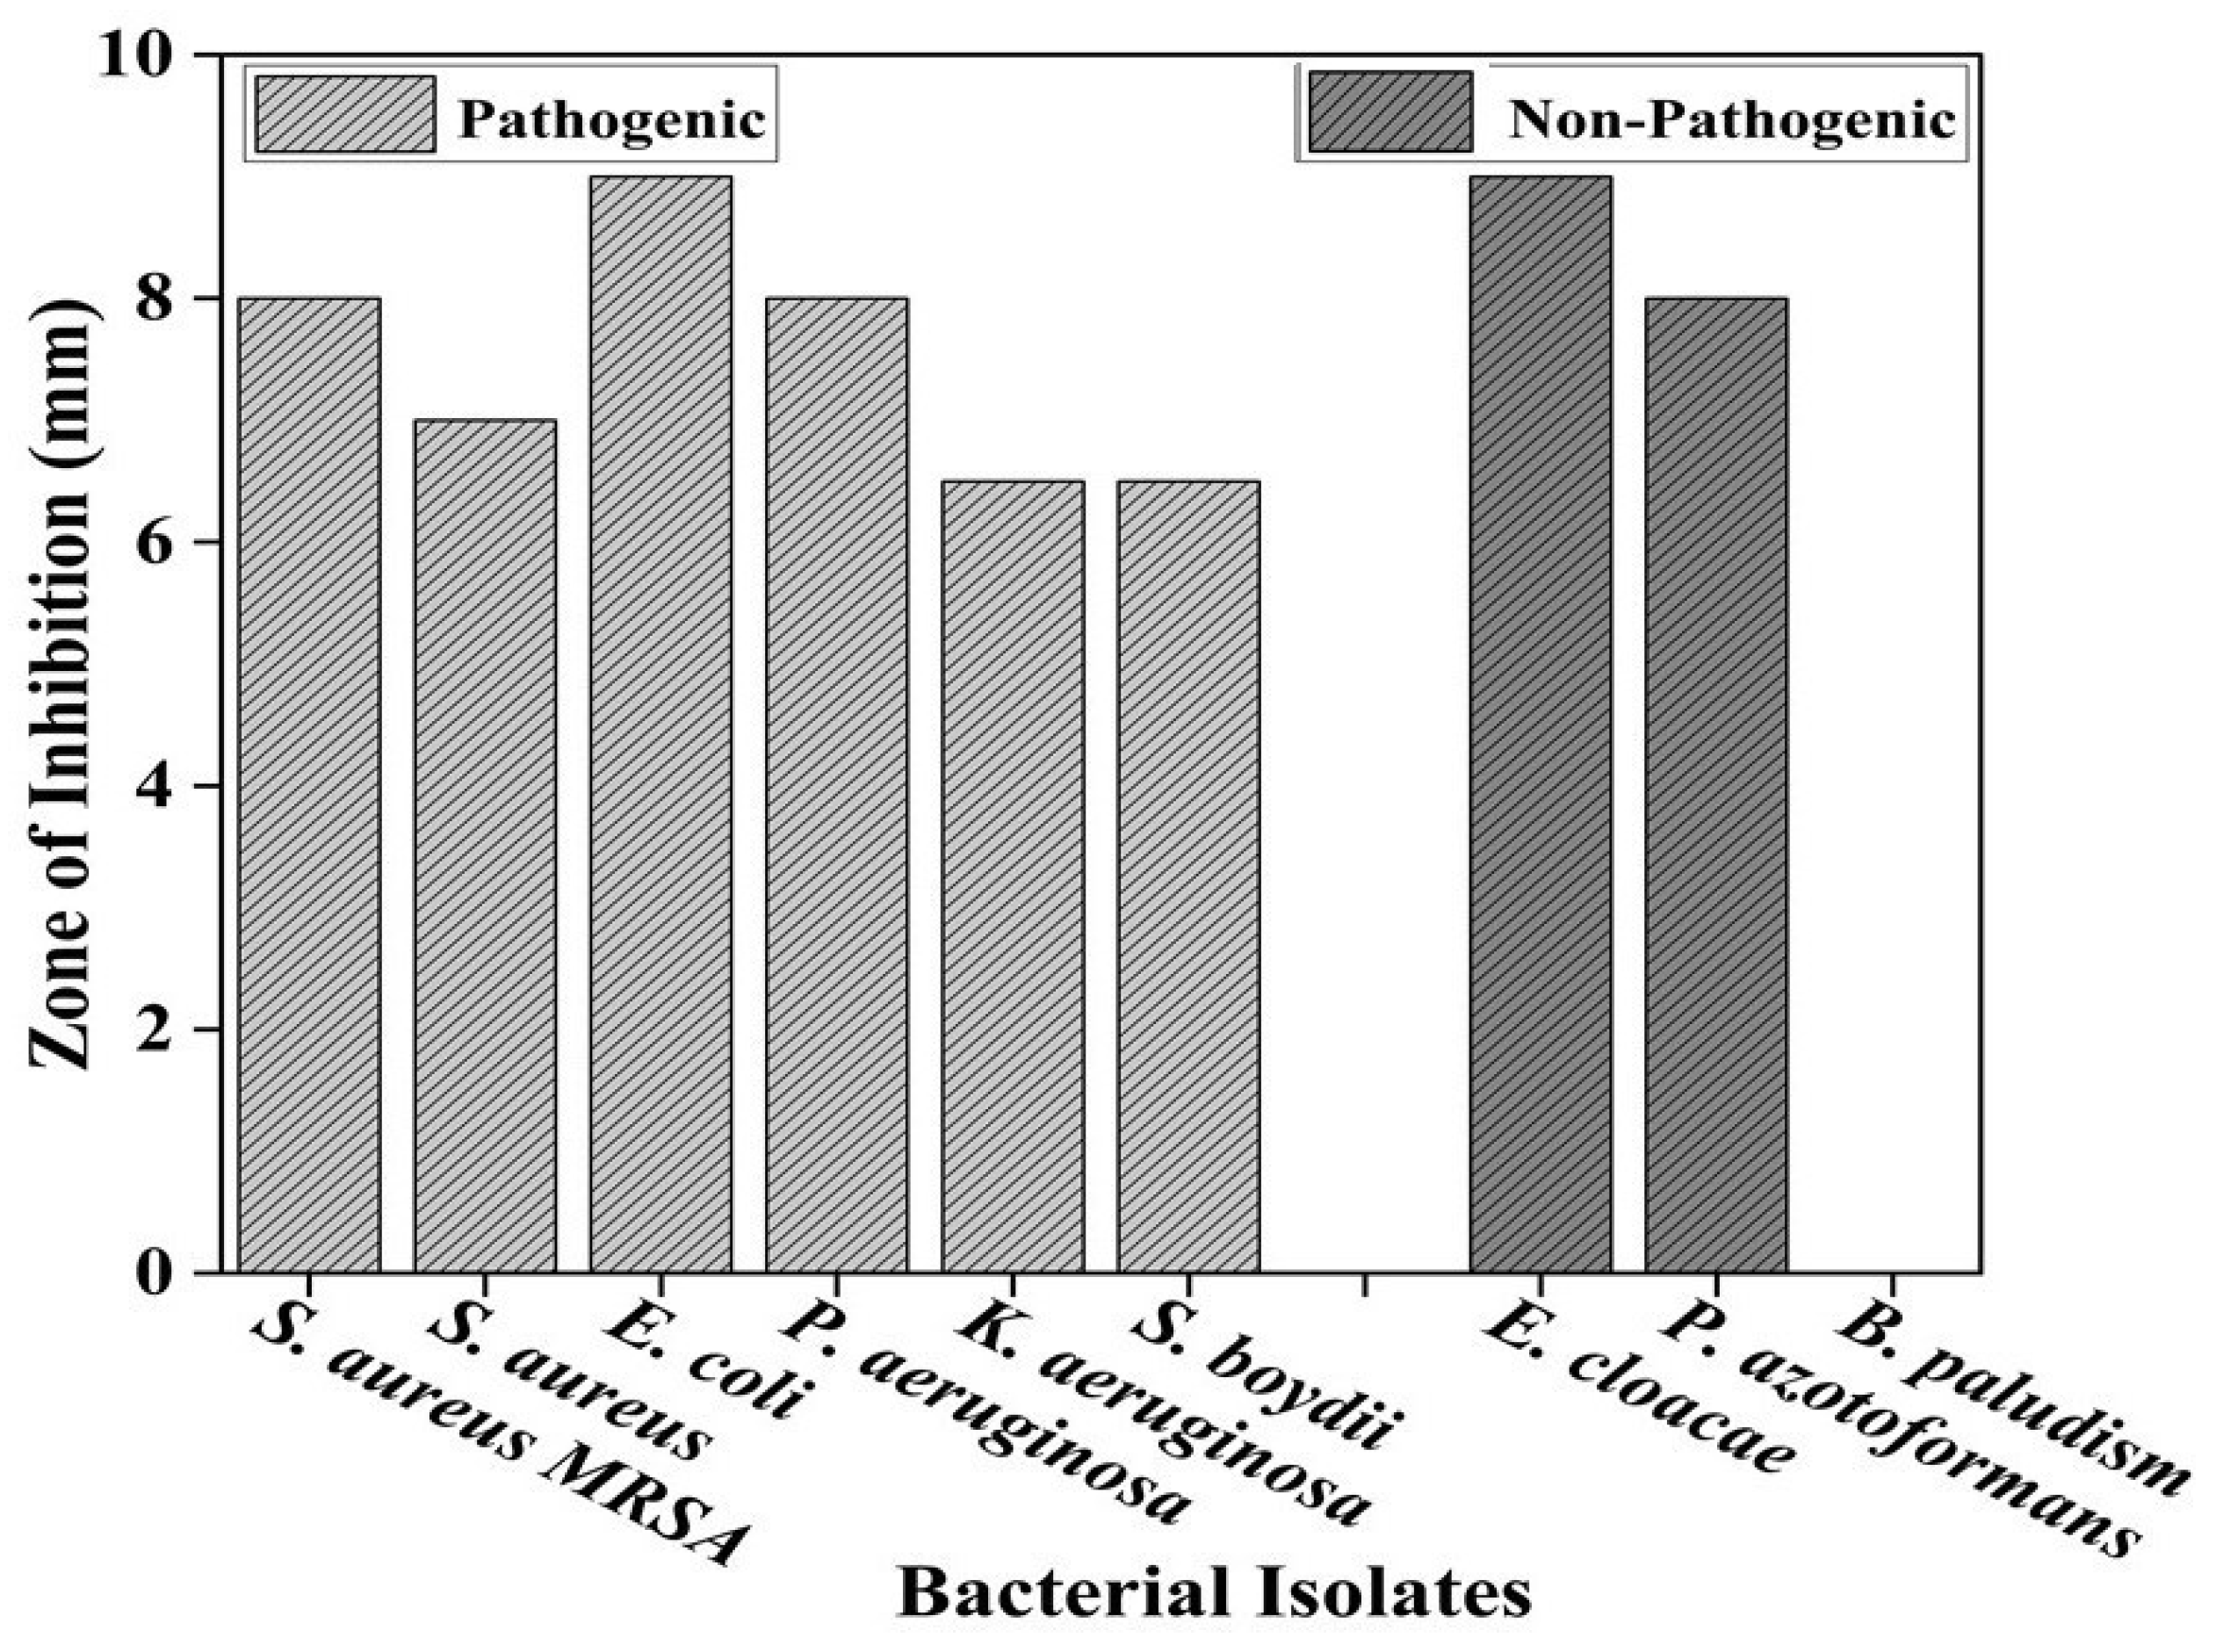
The inhibitory activity of synthesized intermolecular compound, APPABA, (0.005mg/ml in DMSO) against different bacterial isolates cultured on yeast extract mannitol agar (YEMA) media was observed in terms of the diameter of the inhibition zone formed around the disc by diffusion of APPABA. The zone of clearance formed by APPABA around the disc indicated positive antibacterial activity. Among the various pathogenic bacterial isolates tested, the inhibition zone formed by APPABA was maximum against E.coli (9 mm) followed by methicillin resistant bacterial strain viz. Staphylococcus aureus MRSA (8 mm), Pseudomonas aeruginosa (8 mm), S. aureus, (7 mm), Klebsiella aeruginosa, (6.5 mm) and S. boydii, (6.5 mm). These results are shown in (Figure 11a and Figure 13).
The compound APPABA also exhibited good antibacterial activity against the non-pathogenic bacterial isolates showing maximum zone of inhibition around Enterobacter cloacae (9 mm) followed by Pseudomonas azotoformans (8 mm). The compound was however ineffective against Burkholderia paludism (Figure 11b and Figure 13). The parent compound AP and PABA screened for antibacterial activity showed negative results as no inhibition zone was observed against the tested bacteria Pseudomonas aeruginosa. Even on increasing the incubation period from 24 to 48 hrs no zone of inhibition was observed against the bacterial lawn for the parent compounds. At the same time, the zone of inhibition formed by the synthesised compound APPABA increased from 14 mm to 25 mm on extending the incubation period from 24 hrs to 48 hrs as depicted in (Figure 12).
Figure 12.
Screening antibacterial activity of parent and synthesized compounds against P. aeruginosa at different time intervals.
Figure 12.
Screening antibacterial activity of parent and synthesized compounds against P. aeruginosa at different time intervals.
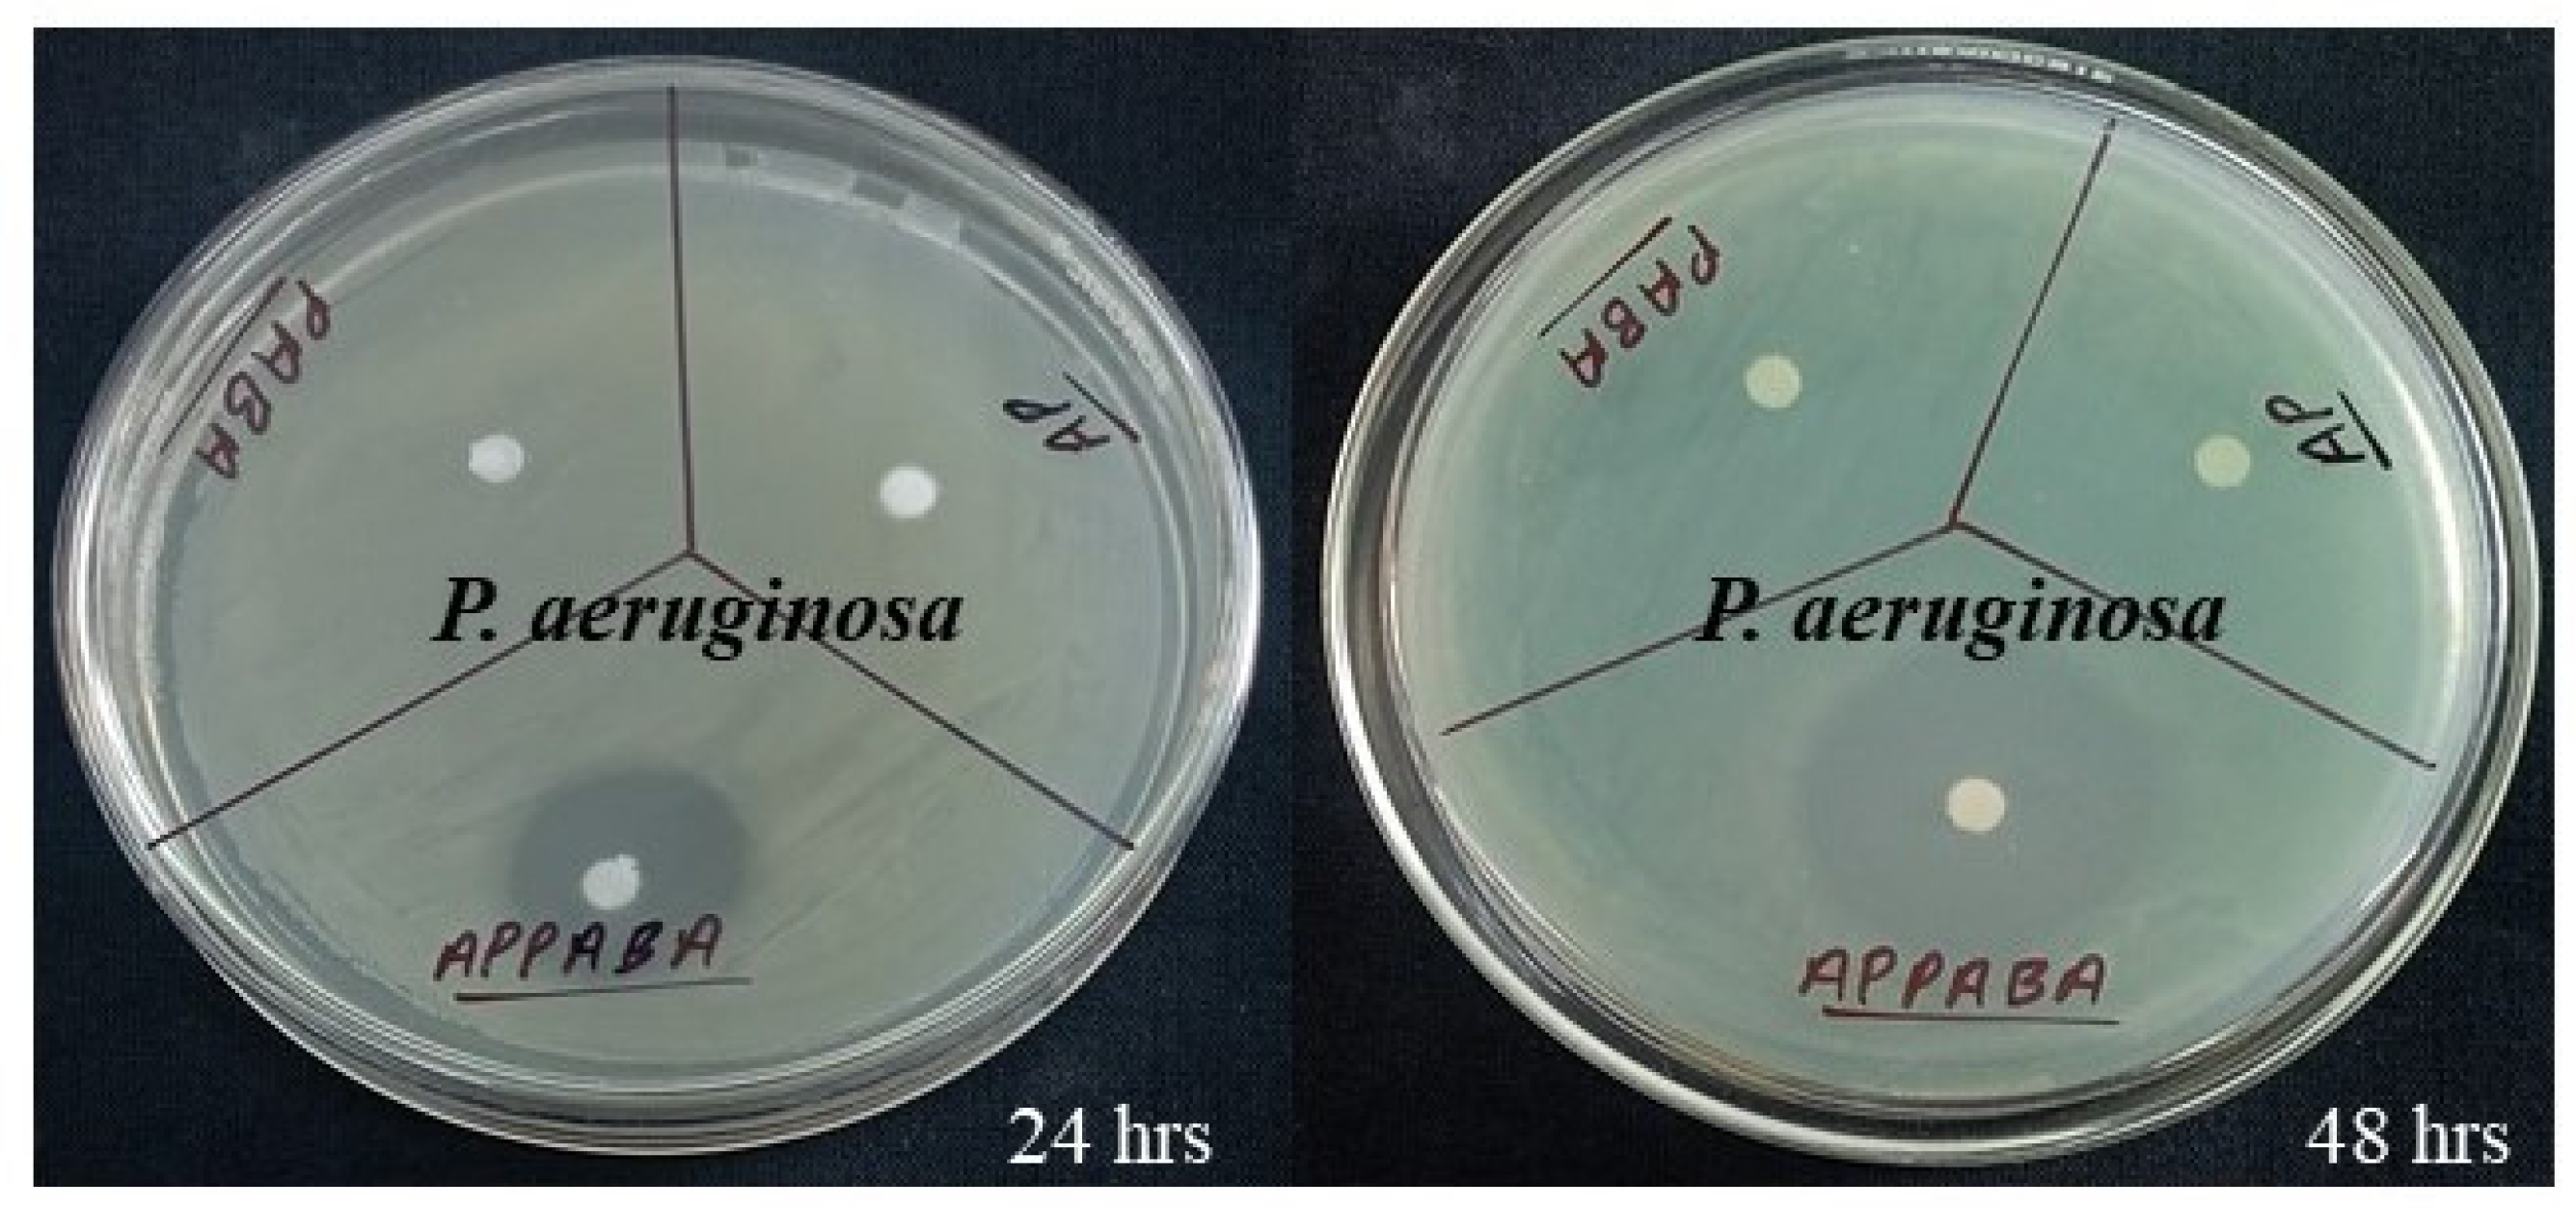
Figure 13.
Bar graph showing zone of inhibition against different pathogenic and non-pathogenic bacterial isolates.
Figure 13.
Bar graph showing zone of inhibition against different pathogenic and non-pathogenic bacterial isolates.
3. Materials and Methods
3.1. Materials and Purification
The parent compounds, 2-aminopyrimidine (AP) and 4-aminobenzoic acid (PABA), used in the present study were procured from Sigma-Aldrich, Germany and Alfa Aesar by Thermo Fisher Scientific, India, respectively. The purity of both the parent compounds was checked by their melting points and NMR studies and these were found in agreement with the values reported in the literature [31].
3.2. Phase Diagram Study
The phase diagrams represent the melting temperature-composition curve [32]. To establish the phase diagram of AP―PABA binary system, the mixtures of the AP and PABA compounds from 0 to 1 mole fractions were prepared by weighing their appropriate amount using the physical balance (Denver SI-234) of accuracy ± 0.0001 g. These mixtures were taken in different dried test tubes and the mouth of each test tube was sealed. Then each sealed test tube was taken individually in a pre-heated silicon oil bath and the mixtures were melted and homogenized by repeating the process of melting/mixing followed by chilling in ice cold water for 4 times. The test tube, containing the homogenized mixture, was broken and the solid mixture was ground using mortar and pestle, and the melting point of each compositional mixture was recorded using the Toshniwal melting point apparatus attached with a thermometer which can read measurements with an accuracy of 0.5 degrees Celsius. The melting points of IMC and eutectics were further confirmed by differential scanning calorimeter. The phase diagram of PA―PABA was plotted by taking the mole fractions of PA on the X-axis and their corresponding melting temperatures on the Y-axes.
3.3. Thermal Study
To determine the experimental values of the heat of fusion values and to study the various thermal properties of AP―PABA system, the pre-calibrated differential scanning calorimeter (DSC) (Mettler DSC-4000 system) using indium and zinc samples was used. Melting temperature and thermal behaviour of parent compounds, eutectics and IMC (APPABA) were studied by taking 4-6 mg of samples and keeping a heating rate of 10°C/min under the constant flow (20 mL/min) of nitrogen gas. The values of heat of fusion were found to be reproducible within ±0.01 kJ/mol.
3.4. Spectral Study
To elucidate the structure of the synthesized IMC, the FTIR and NMR spectral techniques have been employed. The FTIR of the parent compounds and IMC were recorded using a Perkin Elmer spectrophotometer by dispersing and pelletizing the powder samples in KBr. However, the proton and carbon spectra of the synthesized intermolecular compound along with parent compounds were recorded using JNM-ECZ500R/S1 500 MHz Spectrometer in DMSO-d6 solvent.
3.5. Powder X-Ray Diffraction Study
The X-ray diffraction analysis of the parent compounds, their eutectics and intermolecular compound were recorded using Rigaku Powder Diffractometer having 18-kW rotating copper anode and graphite monochromator. The samples were recorded at a scanning rate of 3°/min.
3.6. Single Crystal Growth and X-Ray Diffraction Study
The single crystals of the novel APPABA intermolecular compound were grown in a mixed solvent, ethanol/water (3:2 ratios), adopting the slow solvent evaporation method; however, the temperature of the solution was maintained in the temperature-controlled water bath. The appeared tiny crystals were allowed to grow for 13 days. The single crystal X-ray data of crystal was collected using Bruker single crystal X-ray diffractometer and the refinement was done by using Olex 2_1.2 program suite[33]. The structure was solved by using SHELXT [34] and refined by SHELXL [35]. The crystal packing diagrams were generated by using the Mercury 4.0 program[36]. The CIF structure file has been deposited in the CCDC database and the allotted CCDC is 2235290.
3.7. Optical Study
The UV-visible absorption spectra of IMC along with parent compounds were recorded by preparing the dilute solutions of uniform concentration (1 × 10⁻⁵ M) at room temperature (300 K) by employing UV/Vis/NIR (JASCO model V-670) spectrometer. To record the fluorescence properties of the respective solution of samples, at the same temperature, the Varian Cary Eclipse Fluorescence spectrometer was used. The influence of solvents’ polarity was also studied using the solvent of variable polarity and the same spectrometer and identical conditions.
3.8. Antibacterial Studies
The antibacterial potency of the synthesized IMC was examined based on screening for inhibitory activity against the pathogenic bacterial isolates: Escherichia coli, Pseudomonas aeruginosa, Staphylococcus aureus, Klebsiella aeruginosa, Shigella boydii ; non-pathogenic bacterial isolates: Enterobacter cloacae, Pseudomonas azotoformans, Burkholderia paludism and methicillin resistant Staphylococcus aureus MRSA following the Kirby–Bauer disc diffusion method35, at a concentration of 0.005 mg/ml in DMSO. The different bacterial strains were inoculated separately on yeast extracts mannitol agar (YEMA) media containing per litre of distilled water: yeast extract, 1.00 g; KH2PO4, 0.50 g; mannitol, 10.00 g; MgSO4.7H2O, 0.20 g; NaCl, 0.10 g; and agar, 15.00 g, adjusting pH 6.8–7.0. Plates were kept in an incubator at 28°C for 24 h followed by measuring the inhibition zone. The parent compounds (AP, PABA) were also screened for their inhibitory effects against Pseudomonas aeruginosa at different time intervals.
4. Conclusions
The novel organic intermolecular compound, APPABA, has been synthesized by adopting the solvent free solid-state green synthesis method. The compositional behaviour as a function of melting temperature has been studied by establishing the solid-liquid phase equilibrium diagram which has inferred the formation of 1:1 intermolecular compound (IMC) and two eutectics. The changes in the molecular structure in the synthesized IMC as compared to parent compounds have been studied using FTIR and NMR while powder X-ray diffraction studies infers the novelty and crystalline nature of the synthesized IMC compound. The single crystal X-ray diffraction study of grown crystal of IMC confirms its crystal structure of to be monoclinic having P21/n space group. The DSC studies confirms the purity and single-phase transition during its melting. Using the heat of fusion values obtained from DSC, various thermodynamic parameters and excess thermodynamic functions have been studied and reported for the first time. The optical studies infer that the new intermolecular compound (APPABA) is significantly fluorescent. In addition to these studies, the APPABA was tested for its biological applications which have exhibited strong antibacterial activities, while the parent compounds were unable to stop bacterial growth. The APPABA has exhibited strong antibacterial activity against pathogenic and non-pathogenic microbes, and it was a potent inhibitor of methicillin resistant Staphylococcus aureus MRSA strain indicating its applicability in the treatment of the emerging drug resistant bacterial strains. These studies and observations suggest that this newly synthesized biodegradable APPABA is one of the more effective functional materials for its future applicability as antibacterial agent addressing the challenges of drug resistance.
Data Availability Statement
Data will be made available on request.
Acknowledgements
Authors would like to thank the Head, Department of Chemistry, for providing infrastructural facility, Banaras Hindu University for financial assistance under IOE. The authors are thankful to Dr. Abhinav Kumar from Department of Chemistry, Faculty of Science, Lucknow University for Hirshfield surface analysis.
Conflicts of Interest
The authors declare that they have no known competing interest.
References
- Kaczmarek, B. Tannic Acid with Antiviral and Antibacterial Activity as A Promising Component of Biomaterials—A Minireview. Materials 2020, 13, 3224. [Google Scholar] [CrossRef]
- Chaudhary, S.; Rai, R.N.; Jyothi, D.; Singh, U.P. Solid State Synthesis, Thermal, Spectral, Optical, Crystal Structure and Atomic Packing Studies of 2-(3-Hydroxyphenyl)-2,3-Dihydroquinazolin-4(1H)-One. Materials Letters 2023, 341, 134253. [Google Scholar] [CrossRef]
- Levin-Reisman, I.; Ronin, I.; Gefen, O.; Braniss, I.; Shoresh, N.; Balaban, N.Q. Antibiotic Tolerance Facilitates the Evolution of Resistance. Science 2017, 355, 826–830. [Google Scholar] [CrossRef] [PubMed]
- Jiang, J.; Hou, Y.; Duan, M.; Wang, B.; Wu, Y.; Ding, X.; Zhao, Y. Design, Synthesis and Antibacterial Evaluation of Novel Oxazolidinone Derivatives Nitrogen-Containing Fused Heterocyclic Moiety. Bioorganic & Medicinal Chemistry Letters 2021, 32, 127660. [Google Scholar] [CrossRef]
- Mi, Y.; Zhang, J.; Han, X.; Tan, W.; Miao, Q.; Cui, J.; Li, Q.; Guo, Z. Modification of Carboxymethyl Inulin with Heterocyclic Compounds: Synthesis, Characterization, Antioxidant and Antifungal Activities. Int J Biol Macromol 2021, 181, 572–581. [Google Scholar] [CrossRef]
- Atukuri, D.; Gunjal, R.; Holagundi, N.; Korlahalli, B.; Gangannavar, S.; Akkasali, K. Contribution of -Heterocycles towards Anti-Tubercular Drug Discovery (2014–2019); Predicted and Reengineered Molecular Frameworks. Drug Development Research 2021, 82, 767–783. [Google Scholar] [CrossRef]
- Wang, W.; Xiong, L.; Li, Y.; Song, Z.; Sun, D.; Li, H.; Chen, L. Synthesis of Lathyrane Diterpenoid Nitrogen-Containing Heterocyclic Derivatives and Evaluation of Their Anti-Inflammatory Activities. Bioorg Med Chem 2022, 56, 116627. [Google Scholar] [CrossRef]
- Ngilirabanga, J.B.; Aucamp, M.; Samsodien, H. Mechanochemical Synthesis and Characterization of Zidovudine-Lamivudine Solid Dispersion (Binary Eutectic Mixture). Journal of Drug Delivery Science and Technology 2021, 64, 102639. [Google Scholar] [CrossRef]
- Santos, F.; Duarte, A.R.C. Therapeutic Deep Eutectic Systems for the Enhancement of Drug Bioavailability. In Deep Eutectic Solvents for Medicine, Gas Solubilization and Extraction of Natural Substances; Fourmentin, S., Costa Gomes, M., Lichtfouse, E., Eds.; Springer International Publishing: Cham, 2021; pp. 103–129. ISBN 978-3-030-53069-3. [Google Scholar]
- Nugrahani, I.; Parwati, R.D. Challenges and Progress in Nonsteroidal Anti-Inflammatory Drugs Co-Crystal Development. Molecules 2021, 26, 4185. [Google Scholar] [CrossRef]
- Radhakrishnan, A.; Palanisamy, V.; Sanphui, P. Organic Molecular Salts of Allopurinol with Improved Solubility. Materials Today: Proceedings 2021, 40, S210–S215. [Google Scholar] [CrossRef]
- Uma Maheswararao, G.; Jaya Krishna, D.; John, B. Melting and Solidification Behaviour of Some Organic Phase Change Materials Applicable to Low Temperature Heat Storage Applications. Int J Thermophys 2022, 43, 113. [Google Scholar] [CrossRef]
- Dai, J.; Ma, F.; Fu, Z.; Li, C.; Jia, M.; Shi, K.; Wen, Y.; Wang, W. Applicability Assessment of Stearic Acid/Palmitic Acid Binary Eutectic Phase Change Material in Cooling Pavement. Renewable Energy 2021, 175, 748–759. [Google Scholar] [CrossRef]
- Tian, W.; Lin, J.; Zhang, H.; Duan, X.; Sun, H.; Wang, H.; Wang, S. Enhanced Removals of Micropollutants in Binary Organic Systems by Biomass Derived Porous Carbon/Peroxymonosulfate. J Hazard Mater 2021, 408, 124459. [Google Scholar] [CrossRef] [PubMed]
- Heng, W.; He, X.; Song, Y.; Han, J.; Pang, Z.; Qian, S.; Zhang, J.; Gao, Y.; Wei, Y. Insights into Cocrystallization and Coamorphization Engineering Techniques in the Delivery of Traditional Chinese Medicine: Formation Mechanism, Solid-State Characterization, and Improved Pharmaceutical Properties. Crystal Growth and Design 2022, 22, 5110–5134. [Google Scholar] [CrossRef]
- Saikia, B.; Seidel-Morgenstern, A.; Lorenz, H. Multicomponent Materials to Improve Solubility: Eutectics of Drug Aminoglutethimide. Crystals 2022, 12, 40. [Google Scholar] [CrossRef]
- Singaravelan, K.; Chandramohan, A.; Madhankumar, S.; Enoch, M.V.; Vinitha, G. Structural Characterization, Computational and Biological Studies of a New Third Order NLO (1:1) Organic Adduct: 2-Aminopyrimidine: 3-Nitrophthalic Acid. Journal of Molecular Structure 2019, 1194, 57–65. [Google Scholar] [CrossRef]
- Filho, E.V.; Pina, J.W.S.; Antoniazi, M.K.; Loureiro, L.B.; Ribeiro, M.A.; Pinheiro, C.B.; Guimarães, C.J.; de Oliveira, F.C.E.; Pessoa, C.; Taranto, A.G.; et al. Synthesis, Docking, Machine Learning and Antiproliferative Activity of the 6-Ferrocene/Heterocycle-2-Aminopyrimidine and 5-Ferrocene-1H-Pyrazole Derivatives Obtained by Microwave-Assisted Atwal Reaction as Potential Anticancer Agents. Bioorg Med Chem Lett 2021, 48, 128240. [Google Scholar] [CrossRef]
- Thangarasu, S.; Siva, V.; Athimoolam, S.; Bahadur, S.A. Molecular Structure, Spectroscopic and Quantum Chemical Studies on Benzoic Acid and Succinic Acid Co-Crystals of 2-Aminopyrimidine. J. Theor. Comput. Chem. 2018, 17, 1850021. [Google Scholar] [CrossRef]
- Nagarajan, S.; Shanmugavelan, P.; Sathishkumar, M.; Selvi, R.; Ponnuswamy, A.; Harikrishnan, H.; Shanmugaiah, V.; Murugavel, S. An Eco-Friendly and Water Mediated Product Selective Synthesis of 2-Aminopyrimidines and Their in Vitro Anti-Bacterial Evaluation. Bioorg Med Chem Lett 2014, 24, 4999–5007. [Google Scholar] [CrossRef]
- Mohamed, M.S.; Awad, S.M.; Sayed, A.I. Synthesis of Certain Pyrimidine Derivatives as Antimicrobial Agents and Anti-Inflammatory Agents. Molecules 2010, 15, 1882–1890. [Google Scholar] [CrossRef]
- Wang, X.; Zhang, C.; Zhang, X.; Wang, J.; Zhao, L.; Zhao, D.; Cheng, M. Design, Synthesis and Biological Evaluation of 2-Aminopyrimidine-Based LSD1 Inhibitors. Bioorganic Chemistry 2022, 121, 105699. [Google Scholar] [CrossRef] [PubMed]
- Ballell, L.; Field, R.A.; Chung, G.A.C.; Young, R.J. New Thiopyrazolo [3,4-d]Pyrimidine Derivatives as Anti-Mycobacterial Agents. Bioorg Med Chem Lett 2007, 17, 1736–1740. [Google Scholar] [CrossRef] [PubMed]
- Val, C.; Rodríguez-García, C.; Prieto-Díaz, R.; Crespo, A.; Azuaje, J.; Carbajales, C.; Majellaro, M.; Díaz-Holguín, A.; Brea, J.M.; Loza, M.I.; et al. Optimization of 2-Amino-4,6-Diarylpyrimidine-5-Carbonitriles as Potent and Selective A1 Antagonists. J Med Chem 2022, 65, 2091–2106. [Google Scholar] [CrossRef]
- Zhang, B.; Zhang, Q.; Xiao, Z.; Sun, X.; Yang, Z.; Gu, Q.; Liu, Z.; Xie, T.; Jin, Q.; Zheng, P.; et al. Design, Synthesis and Biological Evaluation of Substituted 2-(Thiophen-2-Yl)-1,3,5-Triazine Derivatives as Potential Dual PI3Kα/mTOR Inhibitors. Bioorg Chem 2020, 95, 103525. [Google Scholar] [CrossRef]
- Large, J.M.; Birchall, K.; Bouloc, N.S.; Merritt, A.T.; Smiljanic-Hurley, E.; Tsagris, D.J.; Wheldon, M.C.; Ansell, K.H.; Coombs, P.J.; Kettleborough, C.A.; et al. Potent Inhibitors of Malarial P. Falciparum Protein Kinase G: Improving the Cell Activity of a Series of Imidazopyridines. Bioorg Med Chem Lett 2019, 29, 509–514. [Google Scholar] [CrossRef]
- Michael, R.; Richards, E.; Xing, D.K.L. The Effect of p-Aminobenzoic Acid on the Uptake of Thymidine and Uracil by Escherichia Coli. International Journal of Pharmaceutics 1995, 116, 217–221. [Google Scholar] [CrossRef]
- Rai, U.S.; Mandal, K.D.; Singh, N.P. Thermochemical Studies on Organic Eutectics and Molecular Complexes. Journal of Thermal Analysis 1989, 35, 1687–1697. [Google Scholar] [CrossRef]
- Singh, N.; Singh, N.B.; Rai, U.S.; Singh, O.P. Structure of Eutectic Melts; Binary Organic Systems. Thermochimica Acta 1985, 95, 291–293. [Google Scholar] [CrossRef]
- Neupane, U.; Rai, R.N. Synthesis, Spectral Characterization, Thermal and Optical Studies of Novel Complexes: 4-(Dimethylamino)Benzylidene-4-Acetamideaniline and 4-(Dimethylamino)Benzylidene-4-Nitroaniline. J Fluoresc 2017, 27, 2263–2277. [Google Scholar] [CrossRef]
- Lange, Dean, J. A. Lange’s Handbook of Chemistry. New York: McGrawHill, 1985.
- Chaudhary, S.; Rai, R.; Sahoo, K.; Kumar, M. Forecast of Phase Diagram for the Synthesis of a Complex for the Detection of Cr6+ Ions. ACS Omega 2022, 7, 7460–7471. [Google Scholar] [CrossRef]
- Dolomanov, O.V.; Bourhis, L.J.; Gildea, R.J.; Howard, J. a. K.; Puschmann, H. OLEX2: A Complete Structure Solution, Refinement and Analysis Program. J Appl Cryst 2009, 42, 339–341. [Google Scholar] [CrossRef]
- Sheldrick, G.M. SHELXT – Integrated Space-Group and Crystal-Structure Determination. Acta Cryst A 2015, 71, 3–8. [Google Scholar] [CrossRef]
- Sheldrick, G.M. Crystal Structure Refinement with SHELXL. Acta Cryst C 2015, 71, 3–8. [Google Scholar] [CrossRef]
- Macrae, C.F.; Sovago, I.; Cottrell, S.J.; Galek, P.T.A.; McCabe, P.; Pidcock, E.; Platings, M.; Shields, G.P.; Stevens, J.S.; Towler, M.; et al. Mercury 4.0: From Visualization to Analysis, Design and Prediction. J Appl Cryst 2020, 53, 226–235. [Google Scholar] [CrossRef]
Figure 1.
Phase diagram of AP―PABA system.
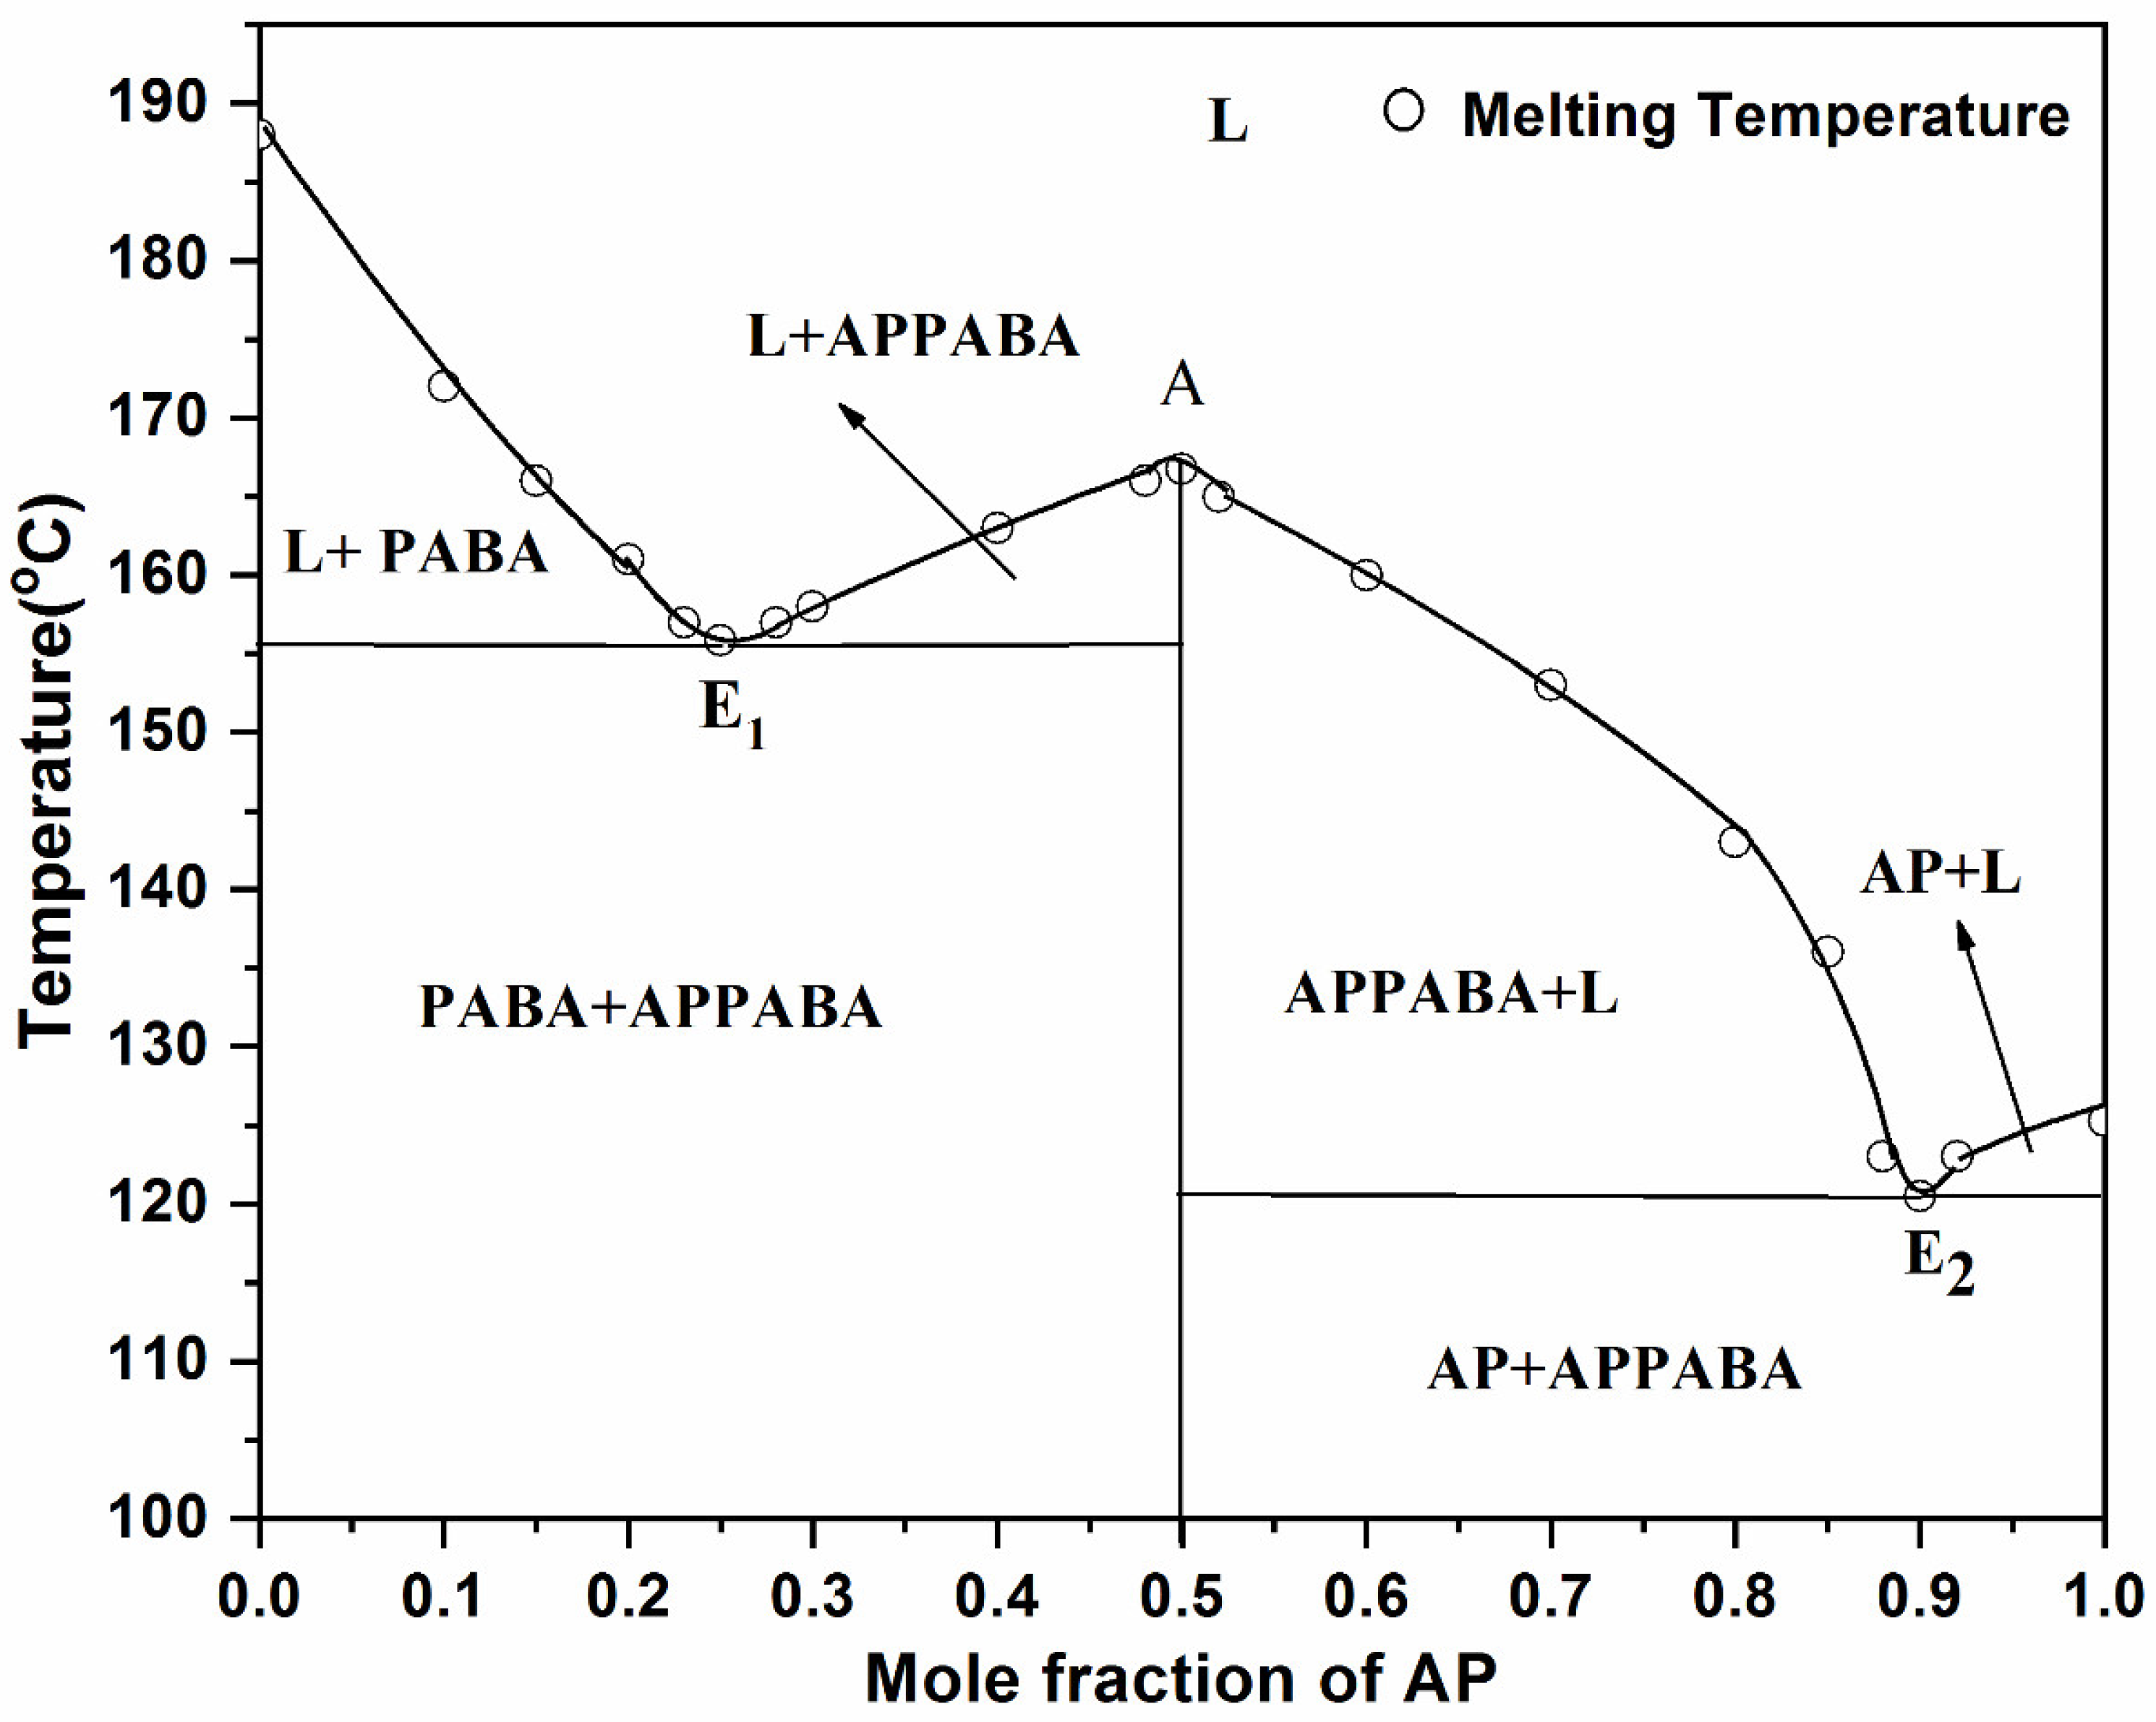
Figure 2.
FTIR spectra of AP, PABA and APPABA compound.
Figure 3.
PXRD pattern of AP, PABA, eutectics (E1 and E2) and APPABA intermolecular compound.
Figure 4.
Photograph of grown single crystal of APPABA intermolecular compound.
Figure 5.
Molecular structure of intermolecular compound (APPABA).
Figure 6.
Packing diagram for intermolecular compound (APPABA).
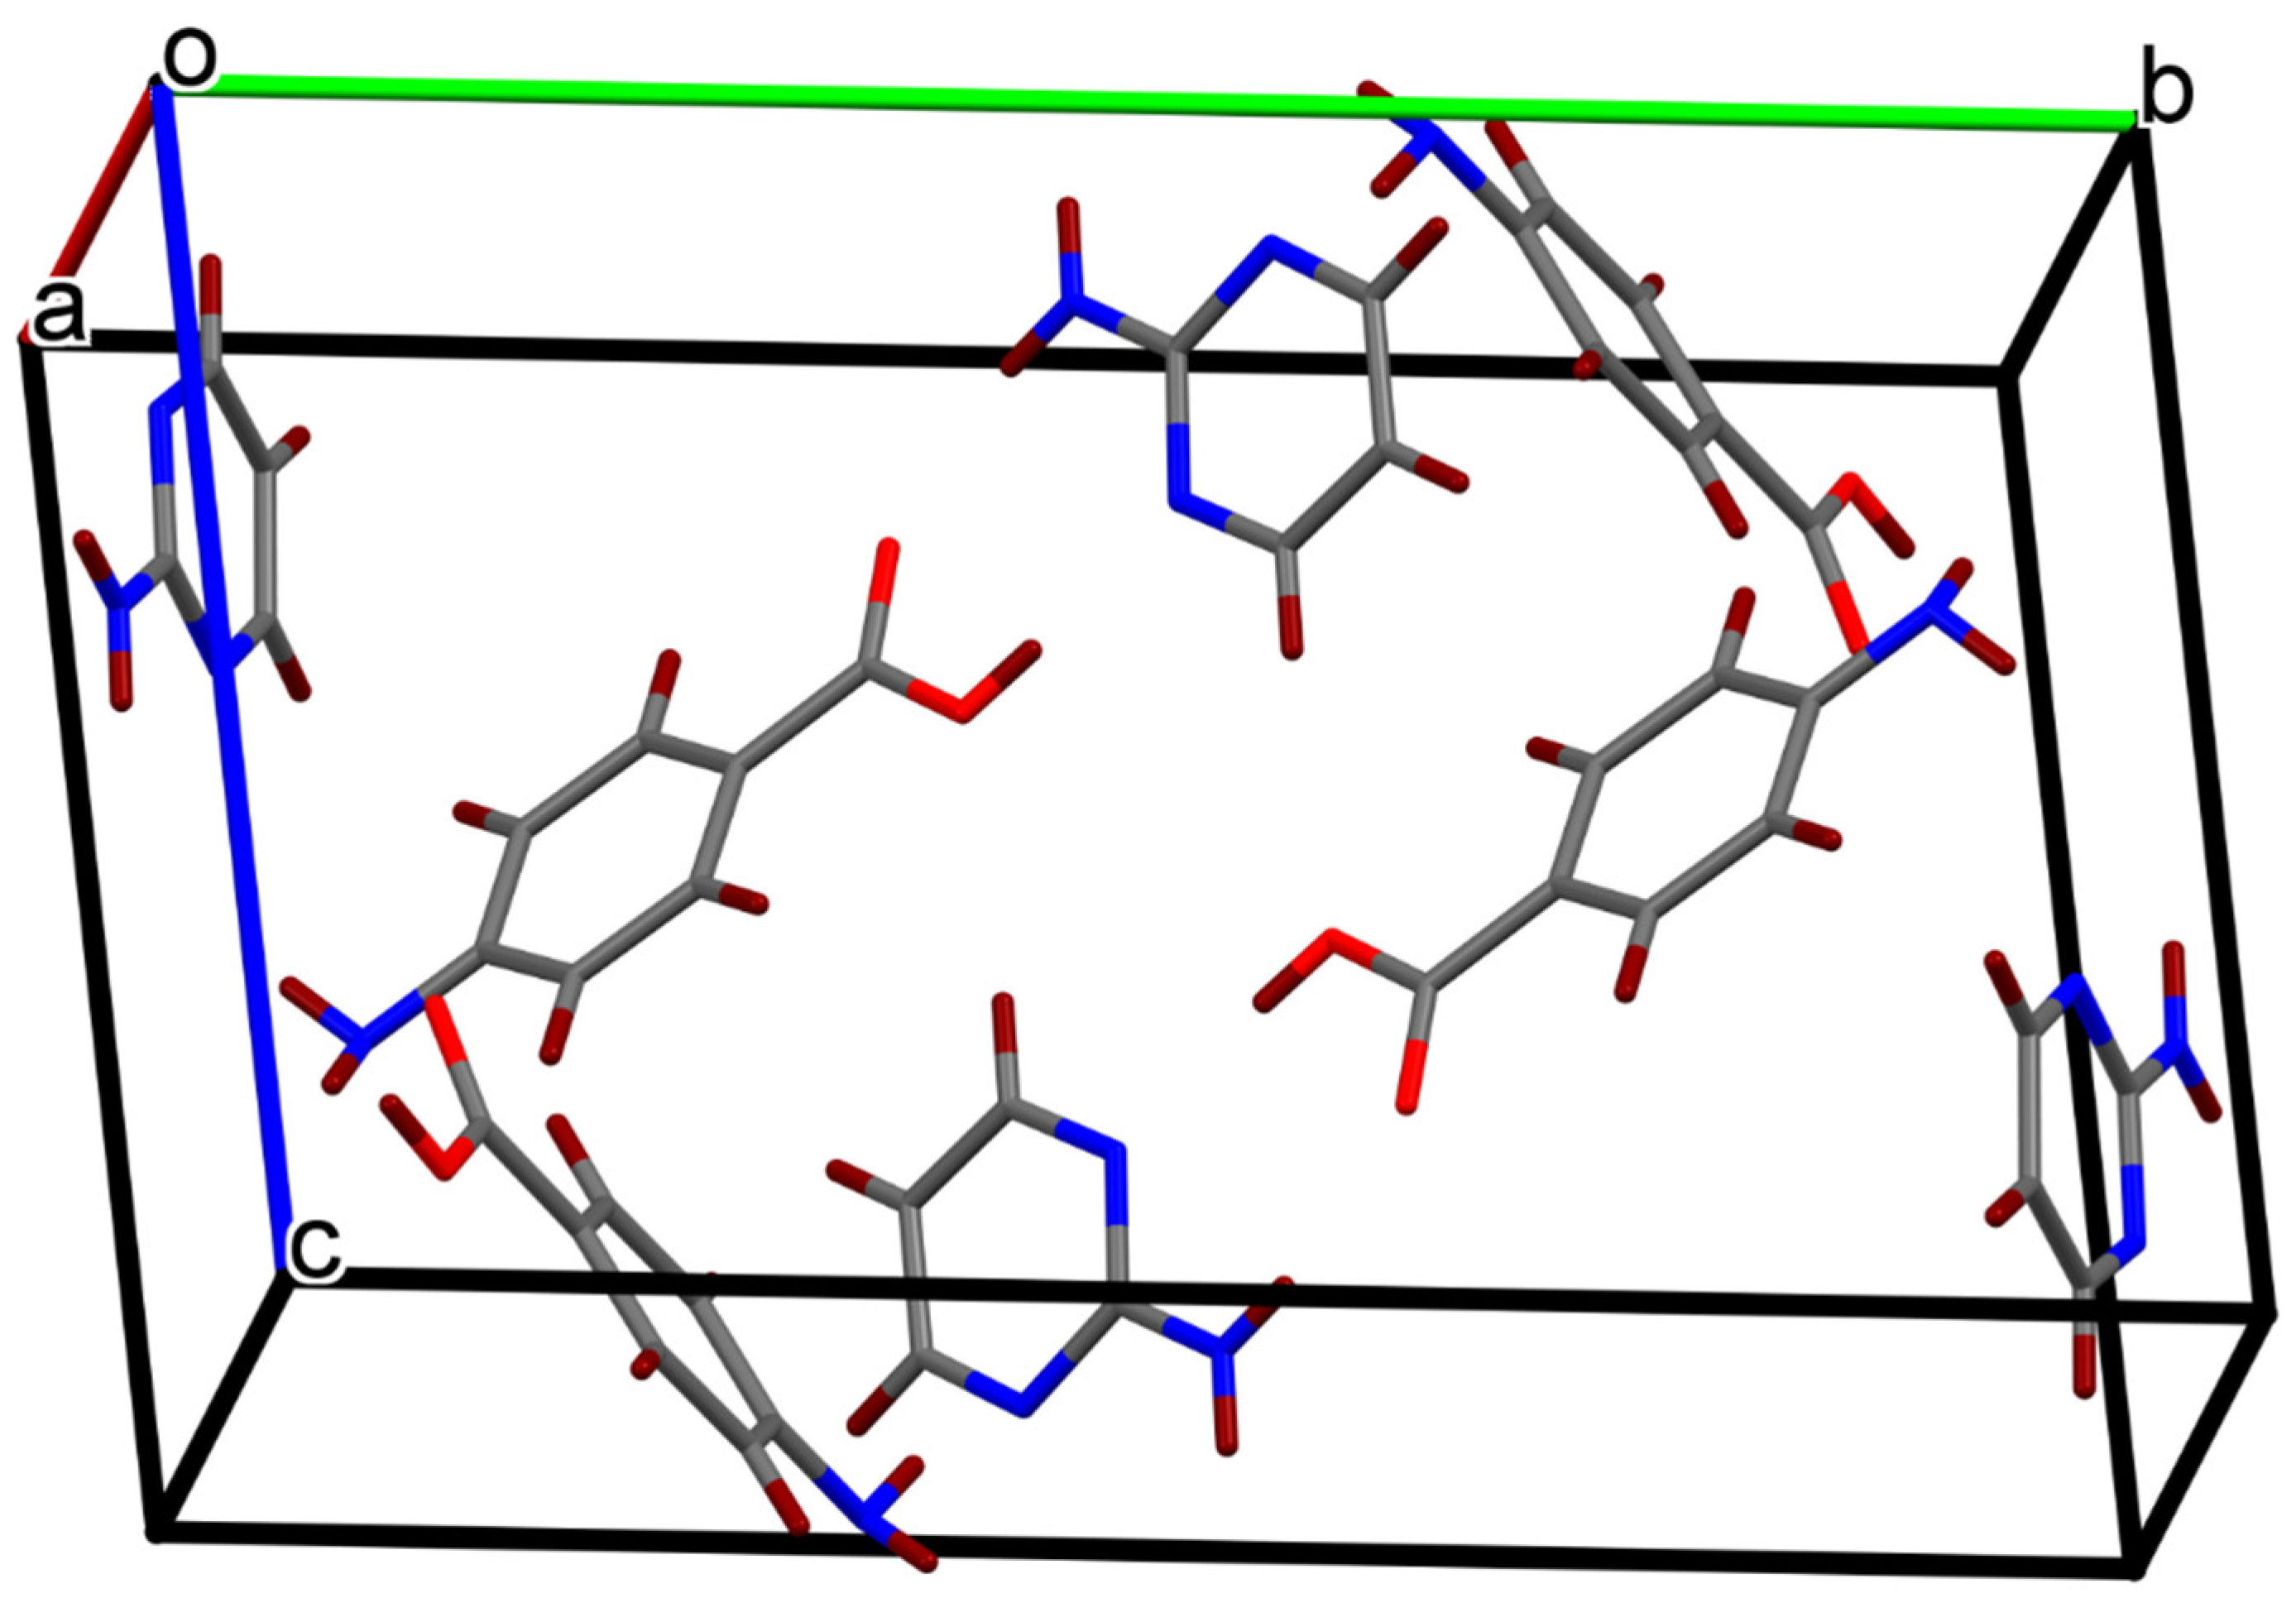
Figure 7.
Zig-zag structure due to hydrogen bonding in the crystal along the c-axis.
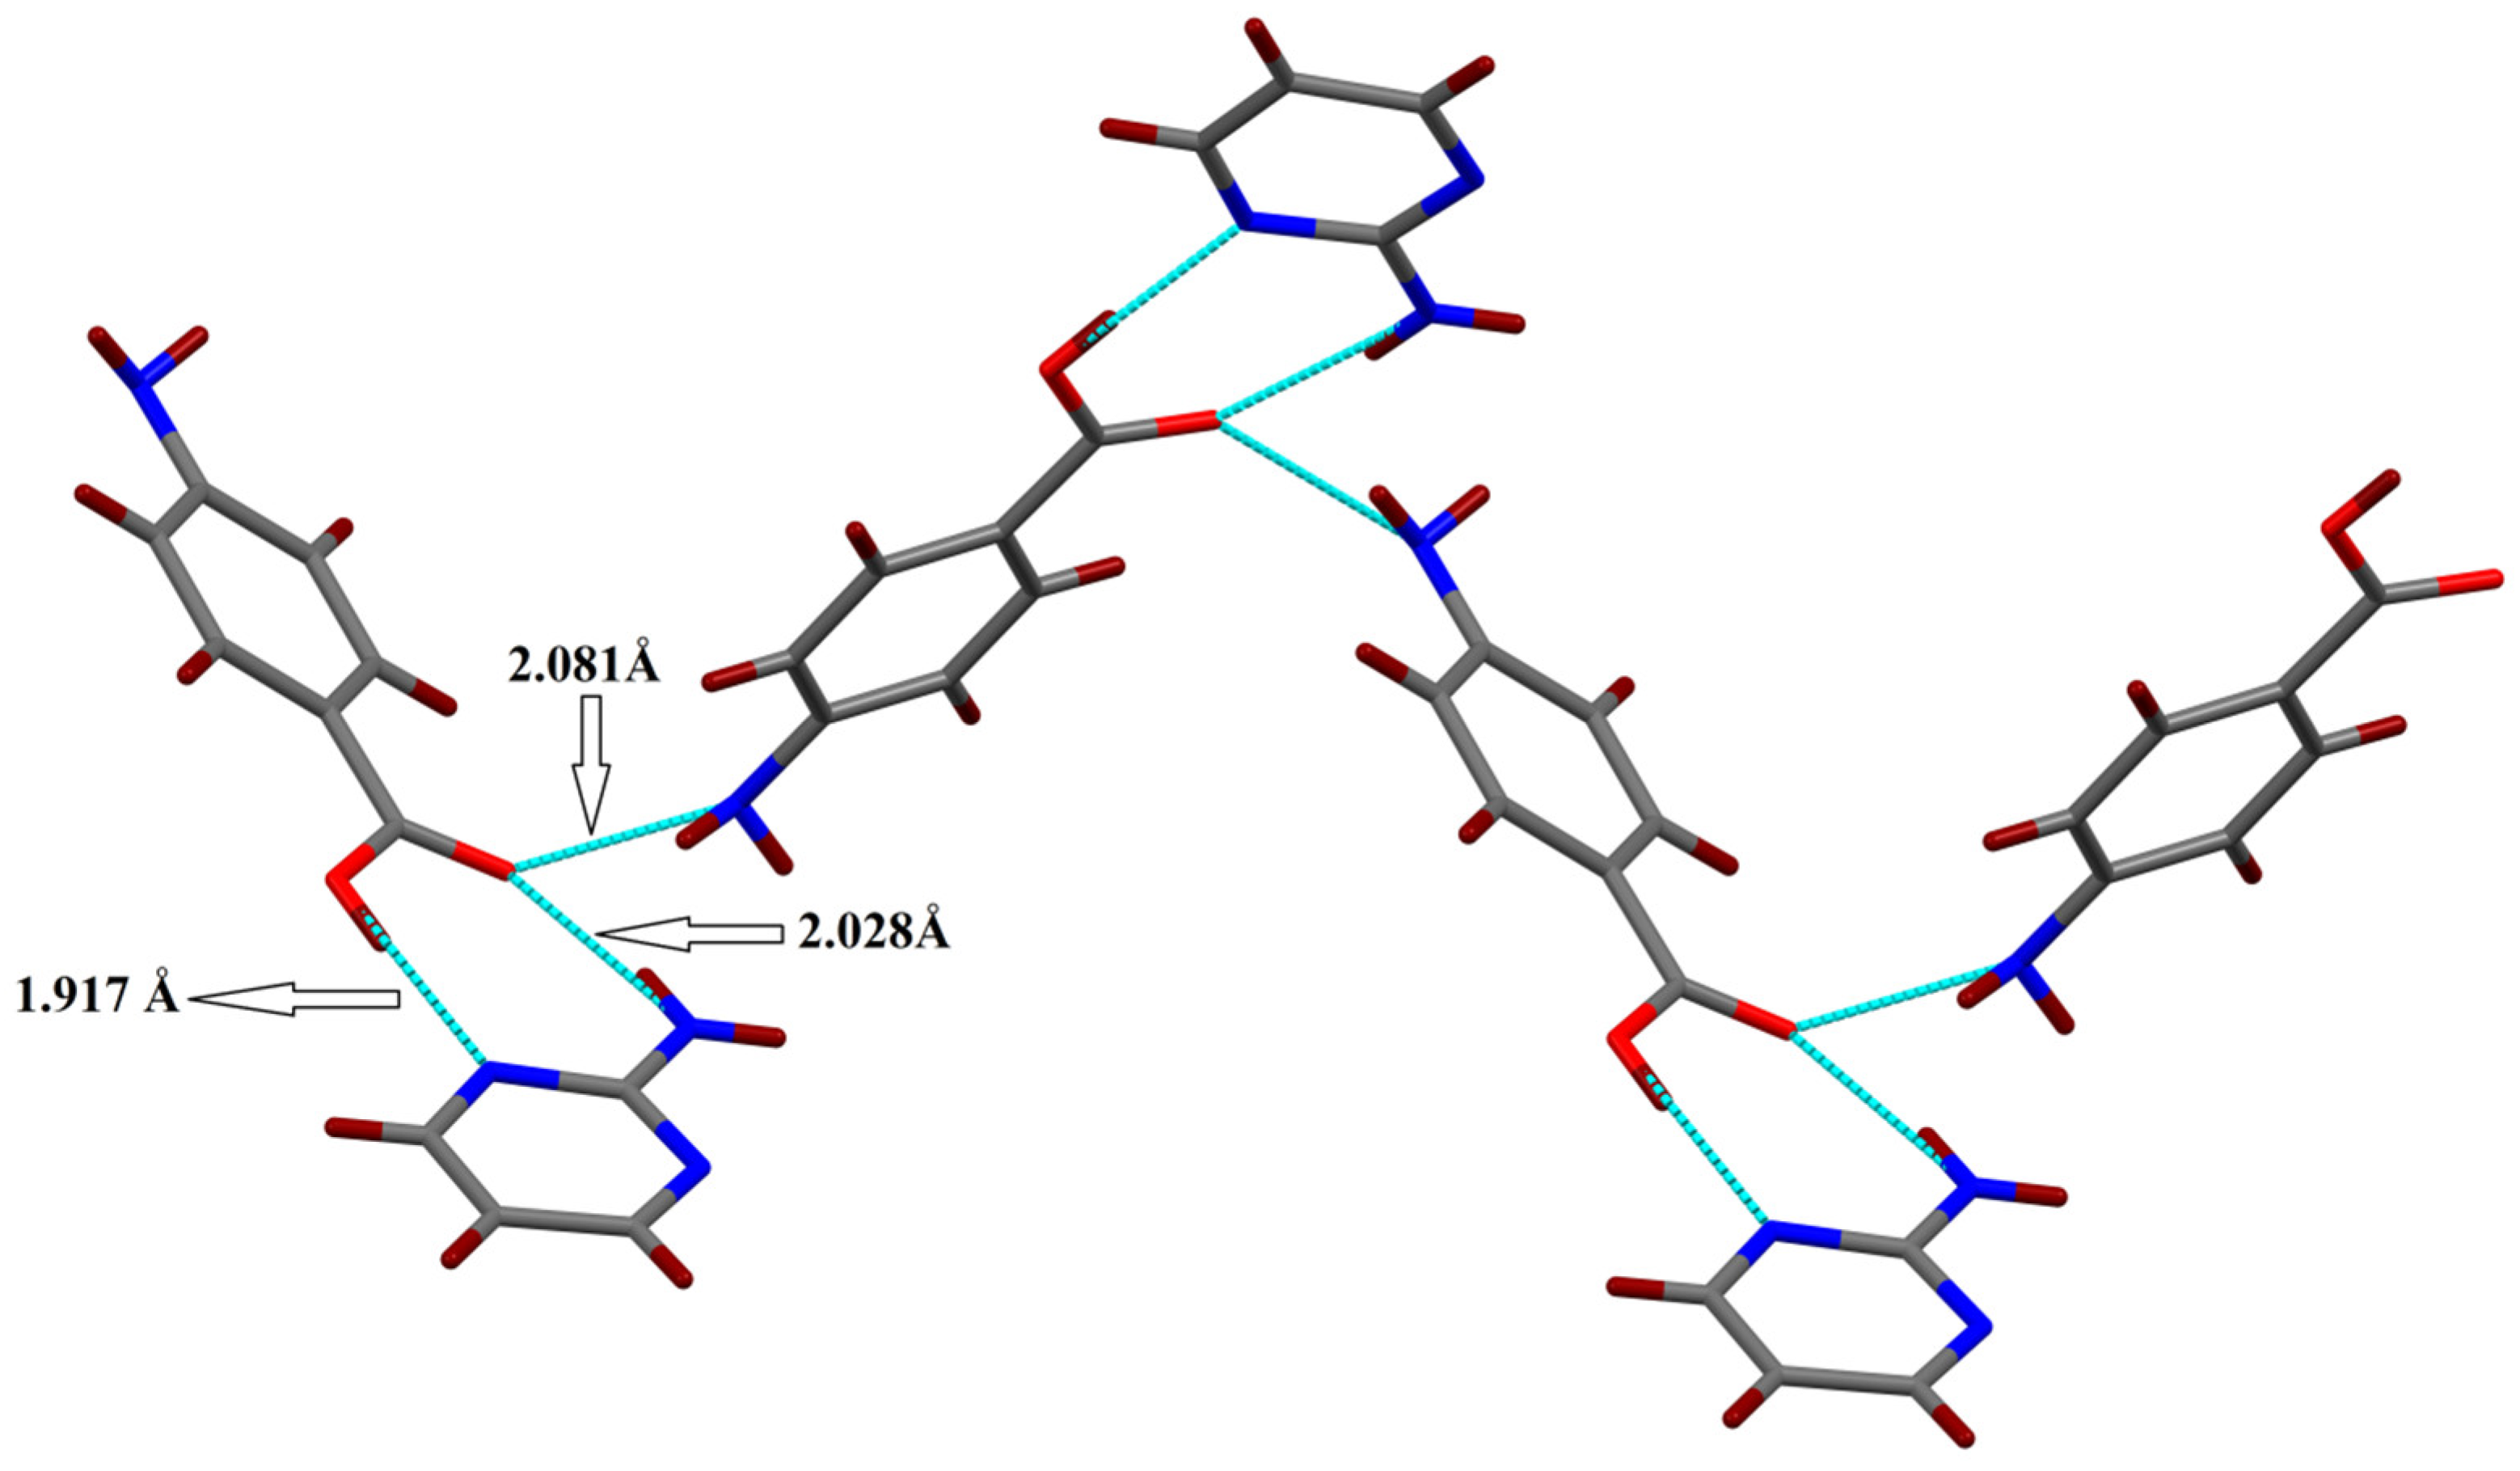
Figure 8.
Hirshfield field surfaces (dnorm, shape index and curvedness, respectively) of APPABA intermolecular compound.
Figure 8.
Hirshfield field surfaces (dnorm, shape index and curvedness, respectively) of APPABA intermolecular compound.
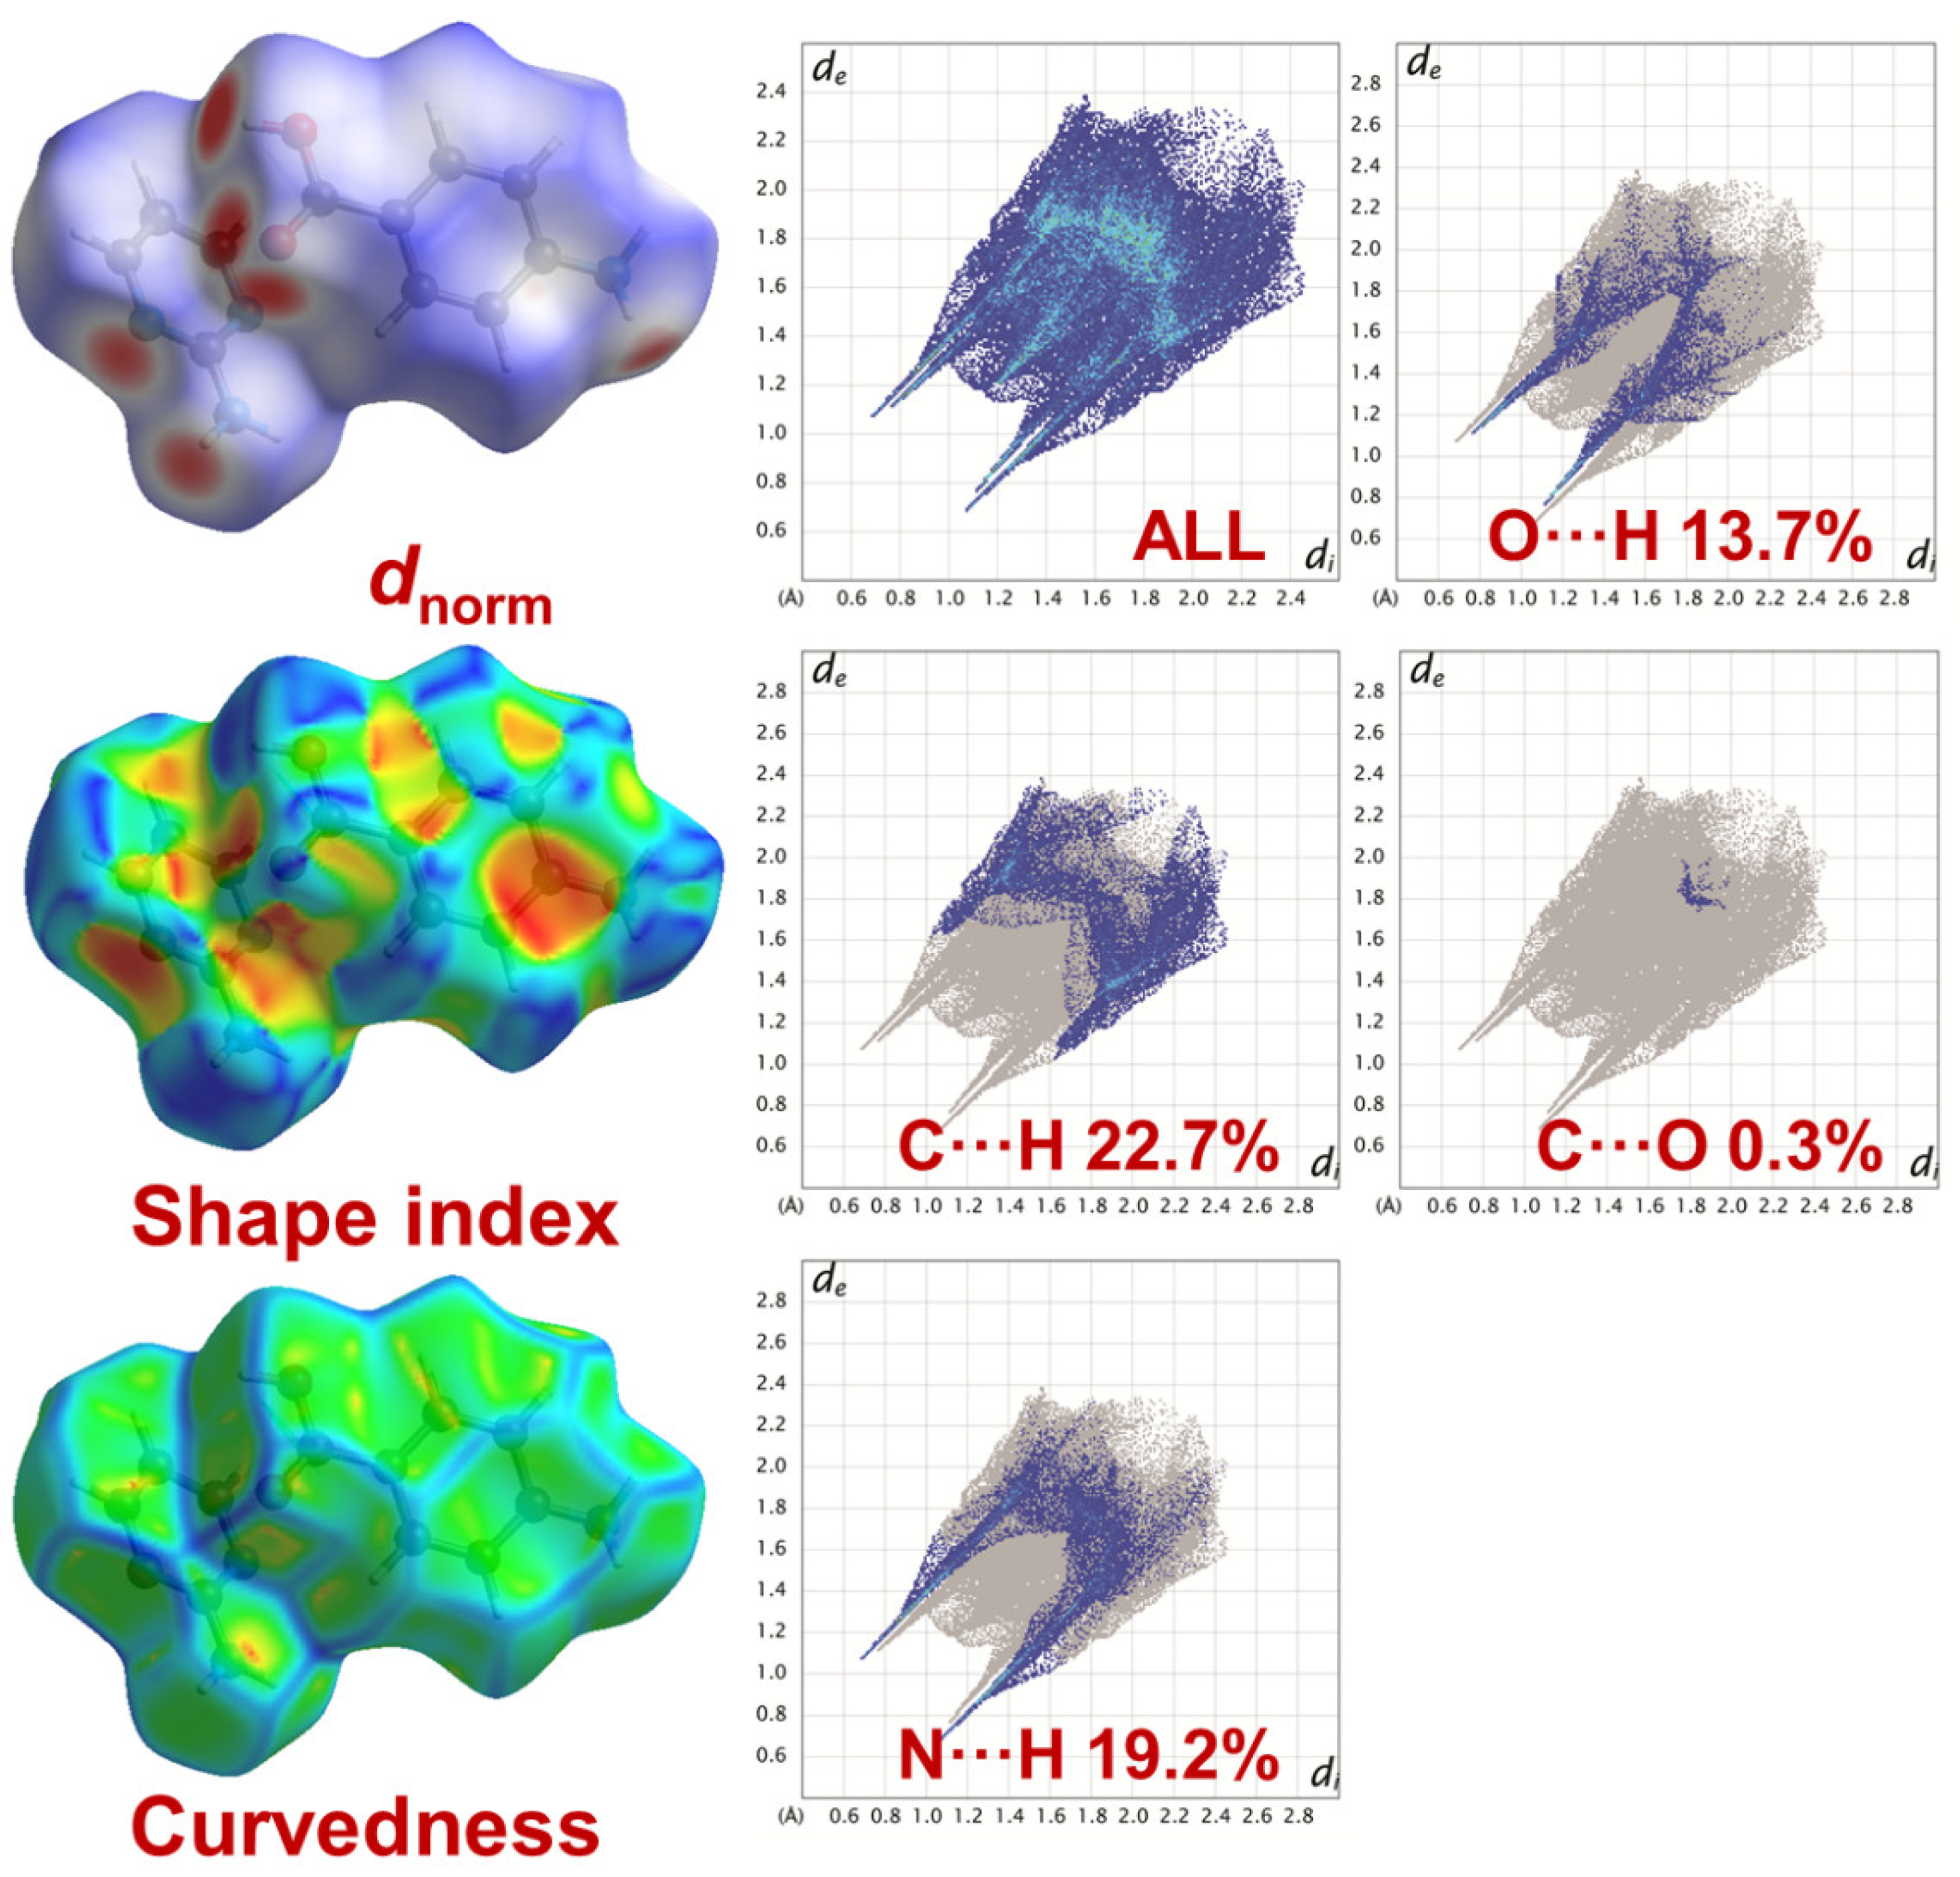
Figure 9.
DSC thermogram of AP, PABA, eutectics (E1 and E2) and APPABA compound.
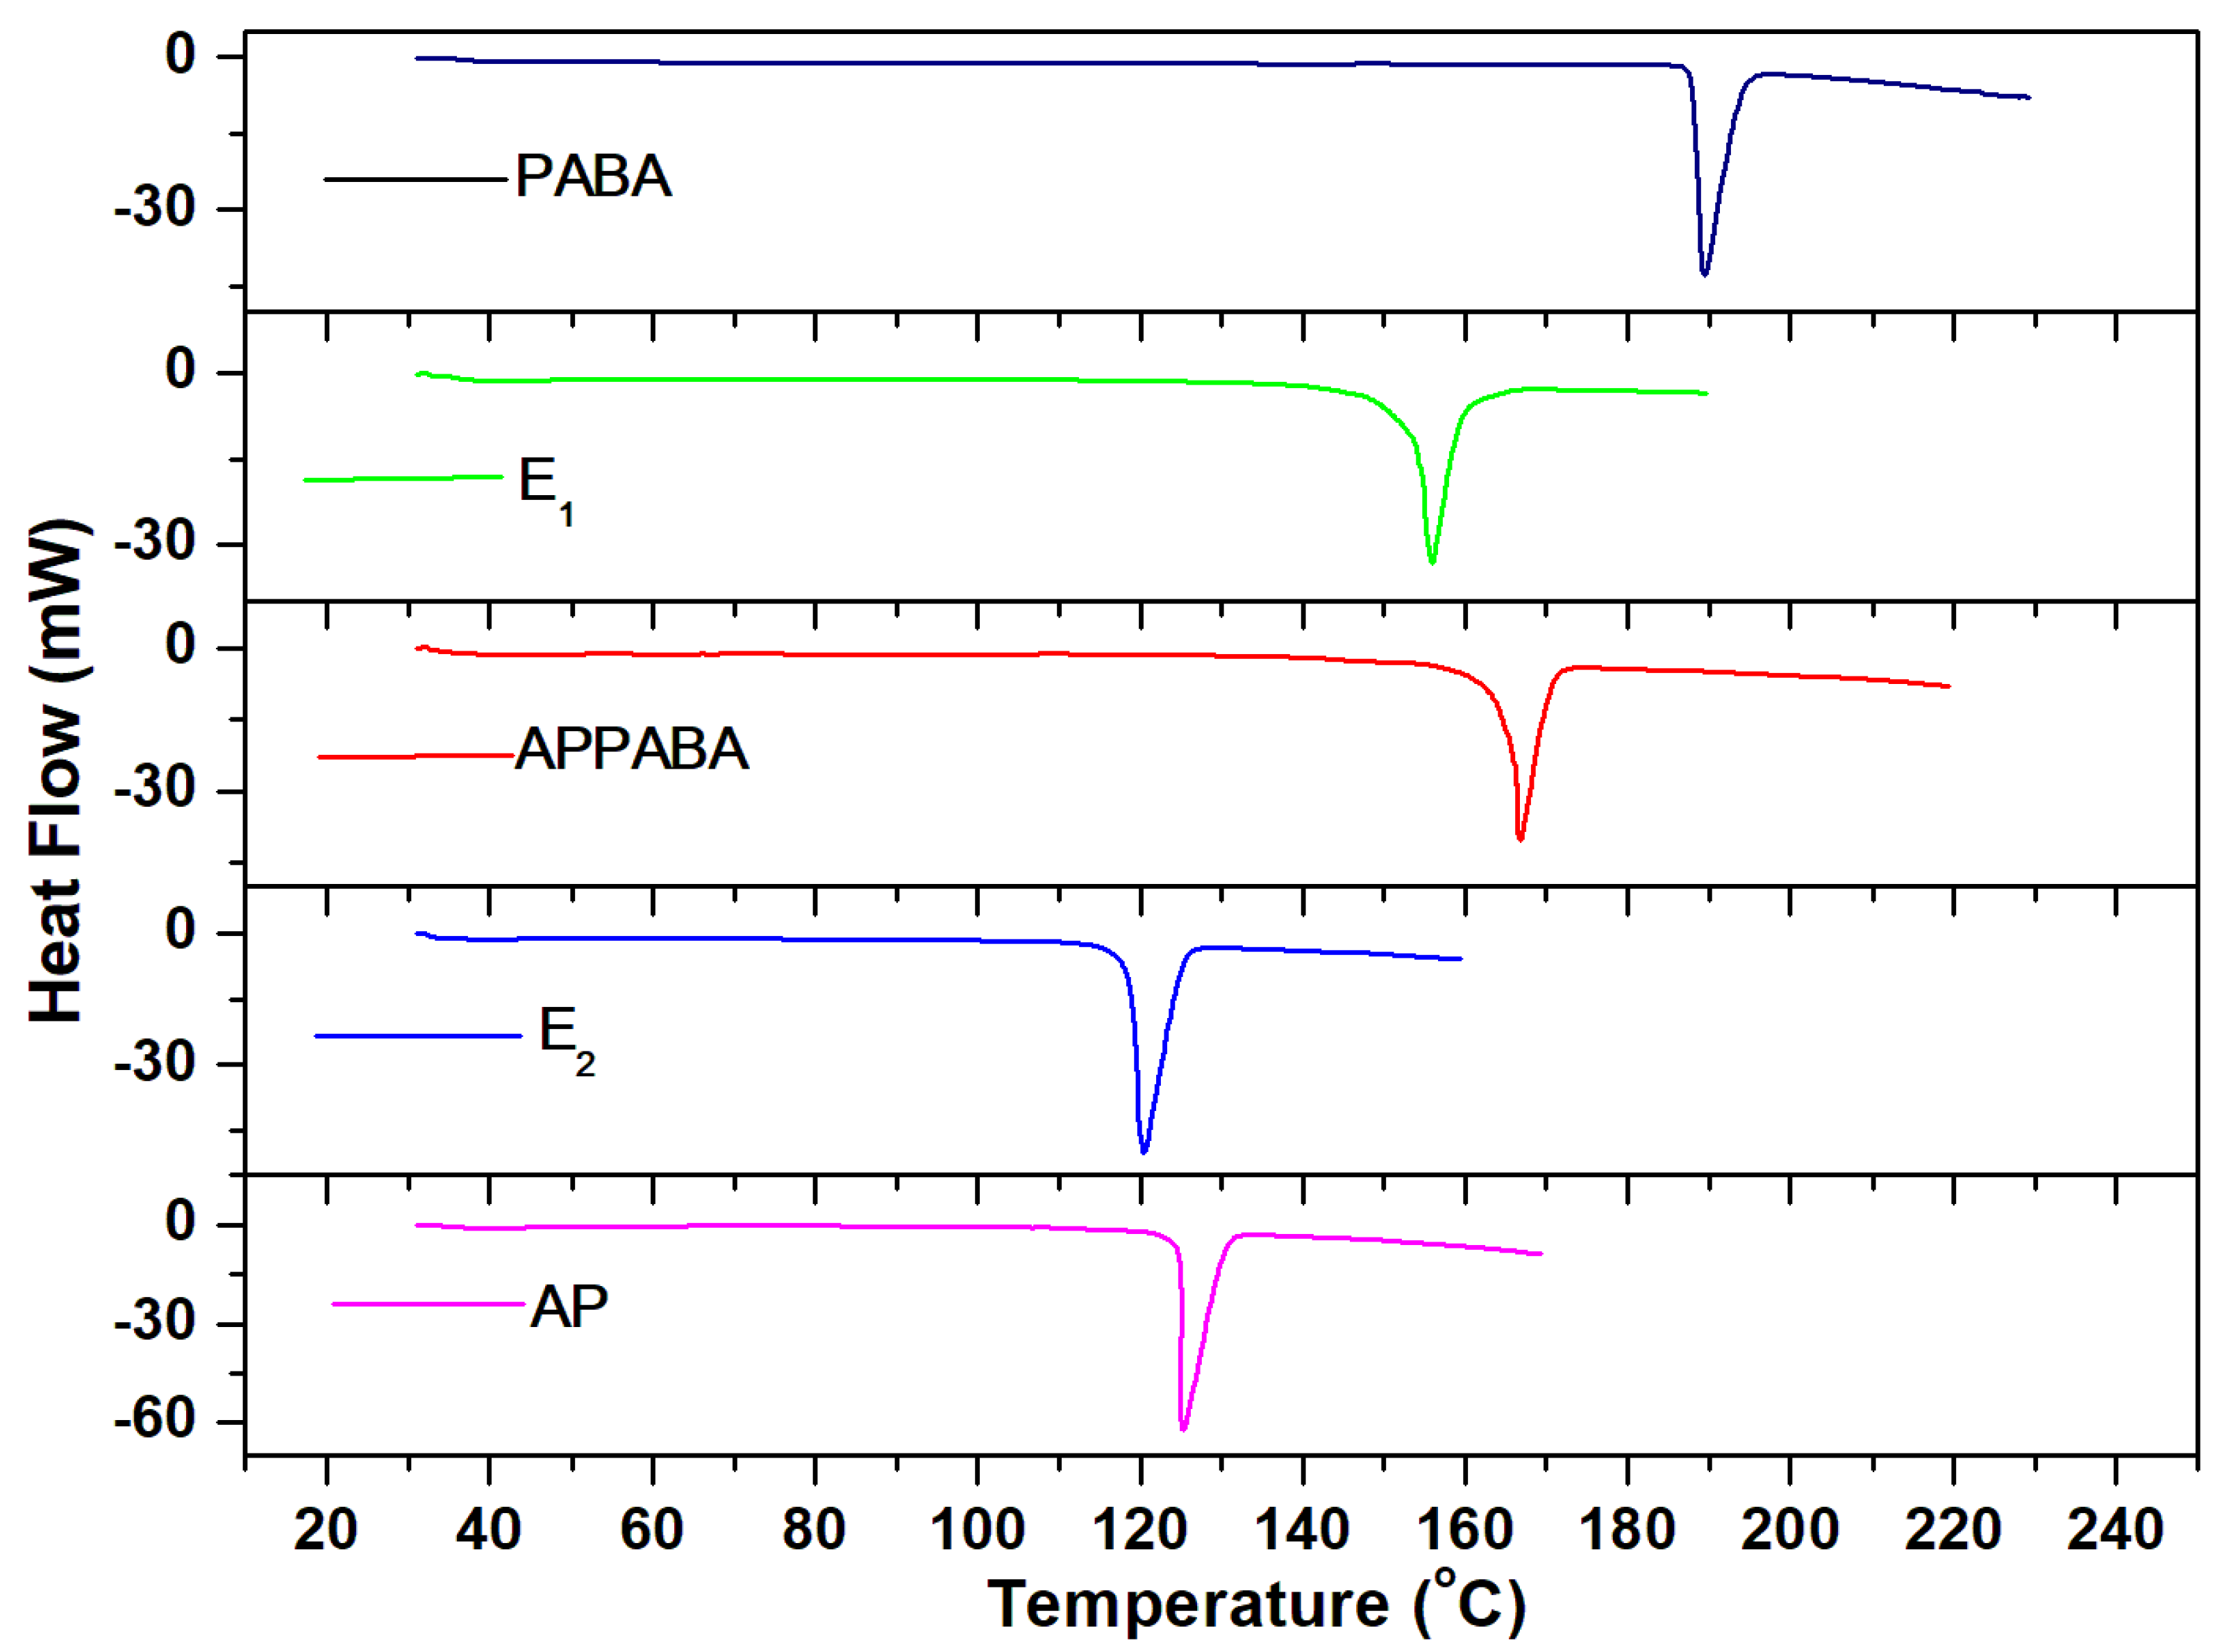
Figure 10.
(a) UV-vis absorption and (b) emission spectra of AP, PABA and intermolecular compound APPABA.
Figure 10.
(a) UV-vis absorption and (b) emission spectra of AP, PABA and intermolecular compound APPABA.
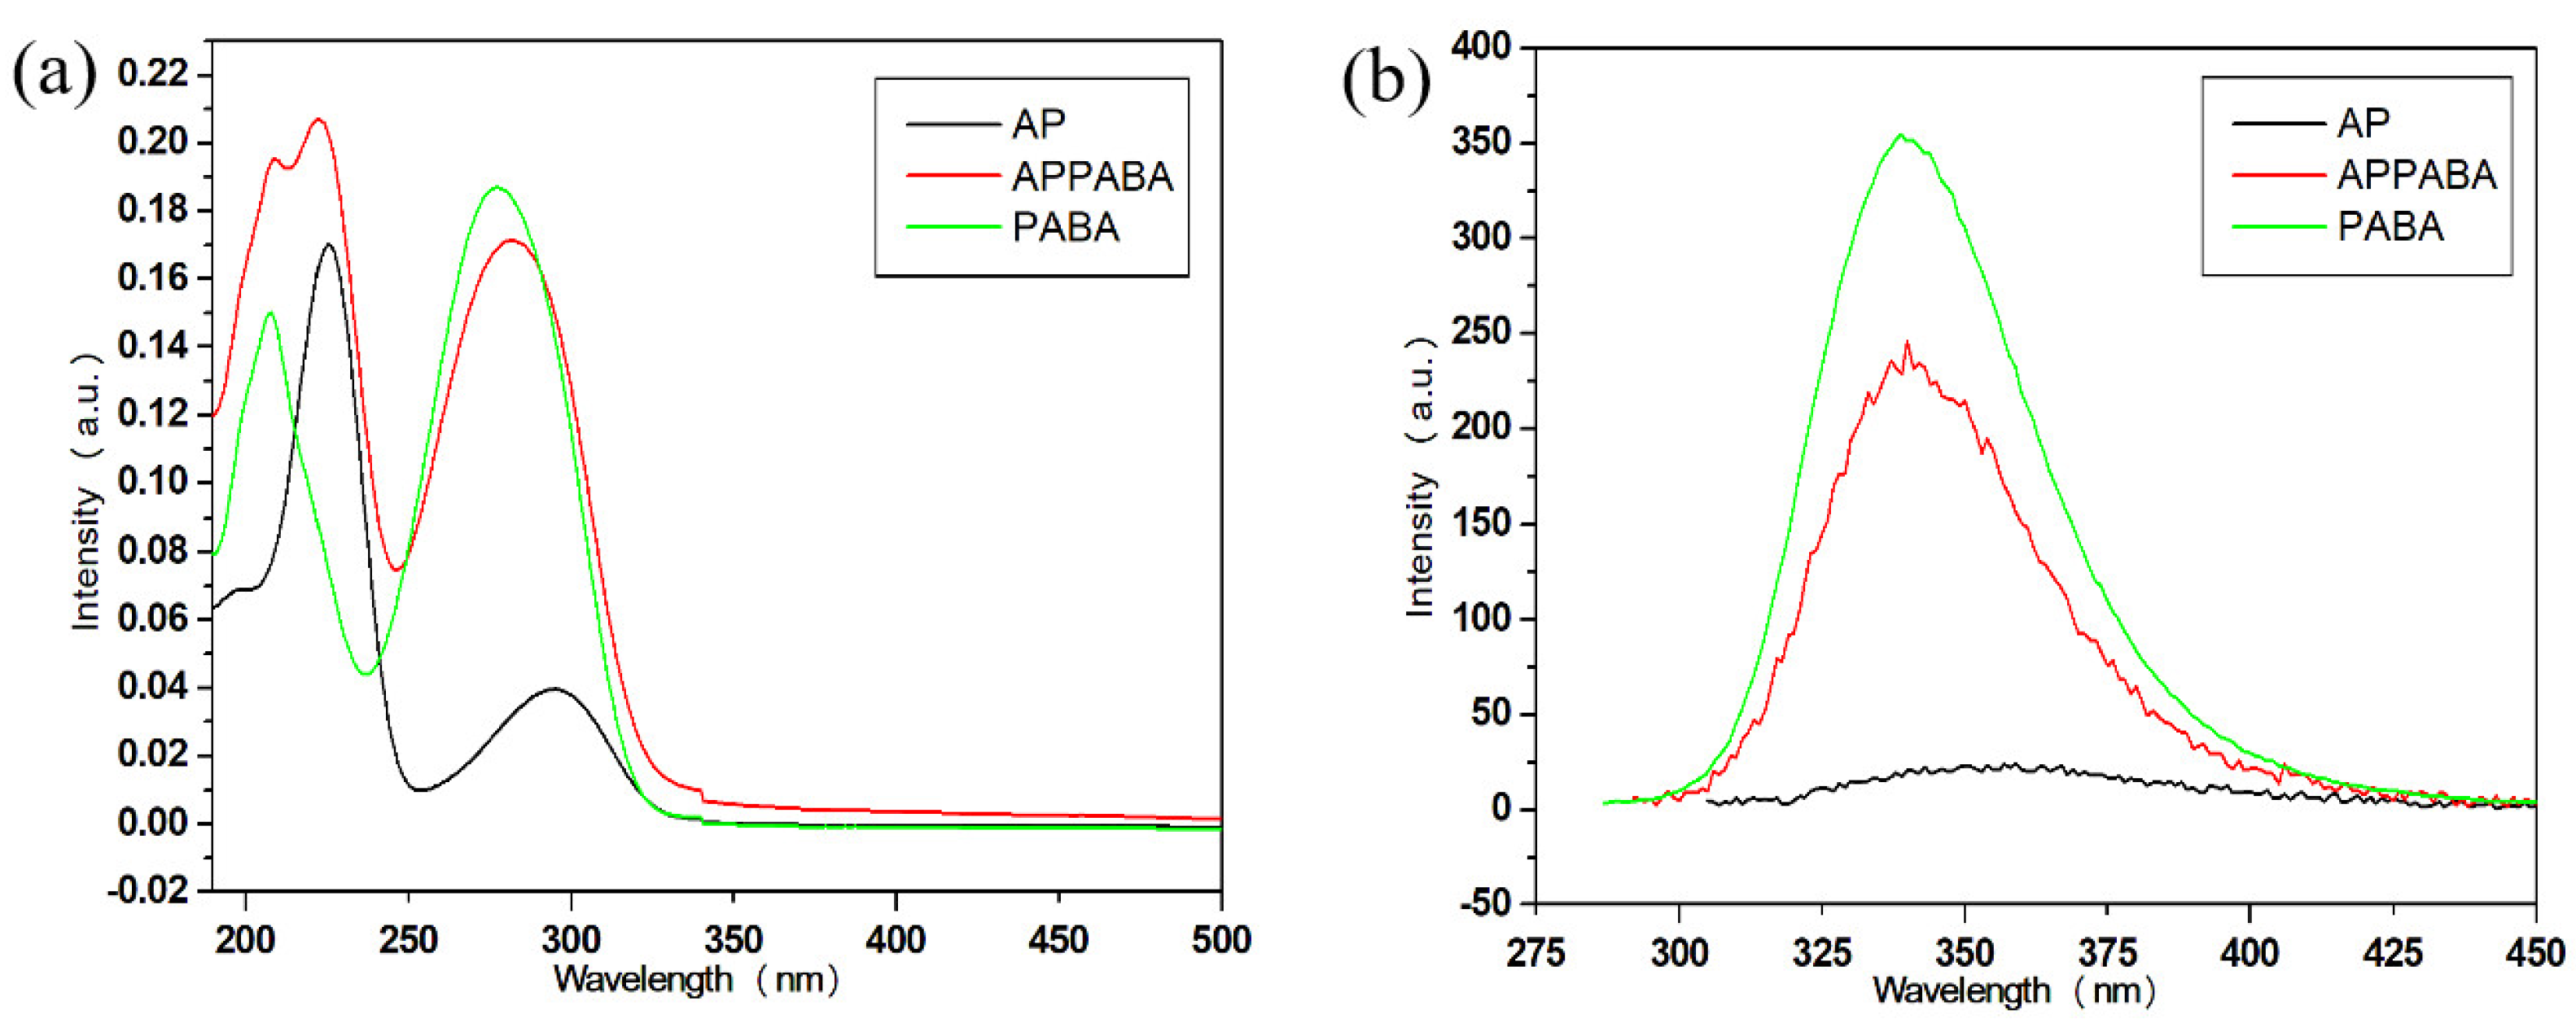
Figure 11.
Screening of APPABA for its antibacterial activity through zone of inhibition formed against different bacterial isolates (a) Pathogenic bacteria (b) non-pathogenic bacteria.
Figure 11.
Screening of APPABA for its antibacterial activity through zone of inhibition formed against different bacterial isolates (a) Pathogenic bacteria (b) non-pathogenic bacteria.
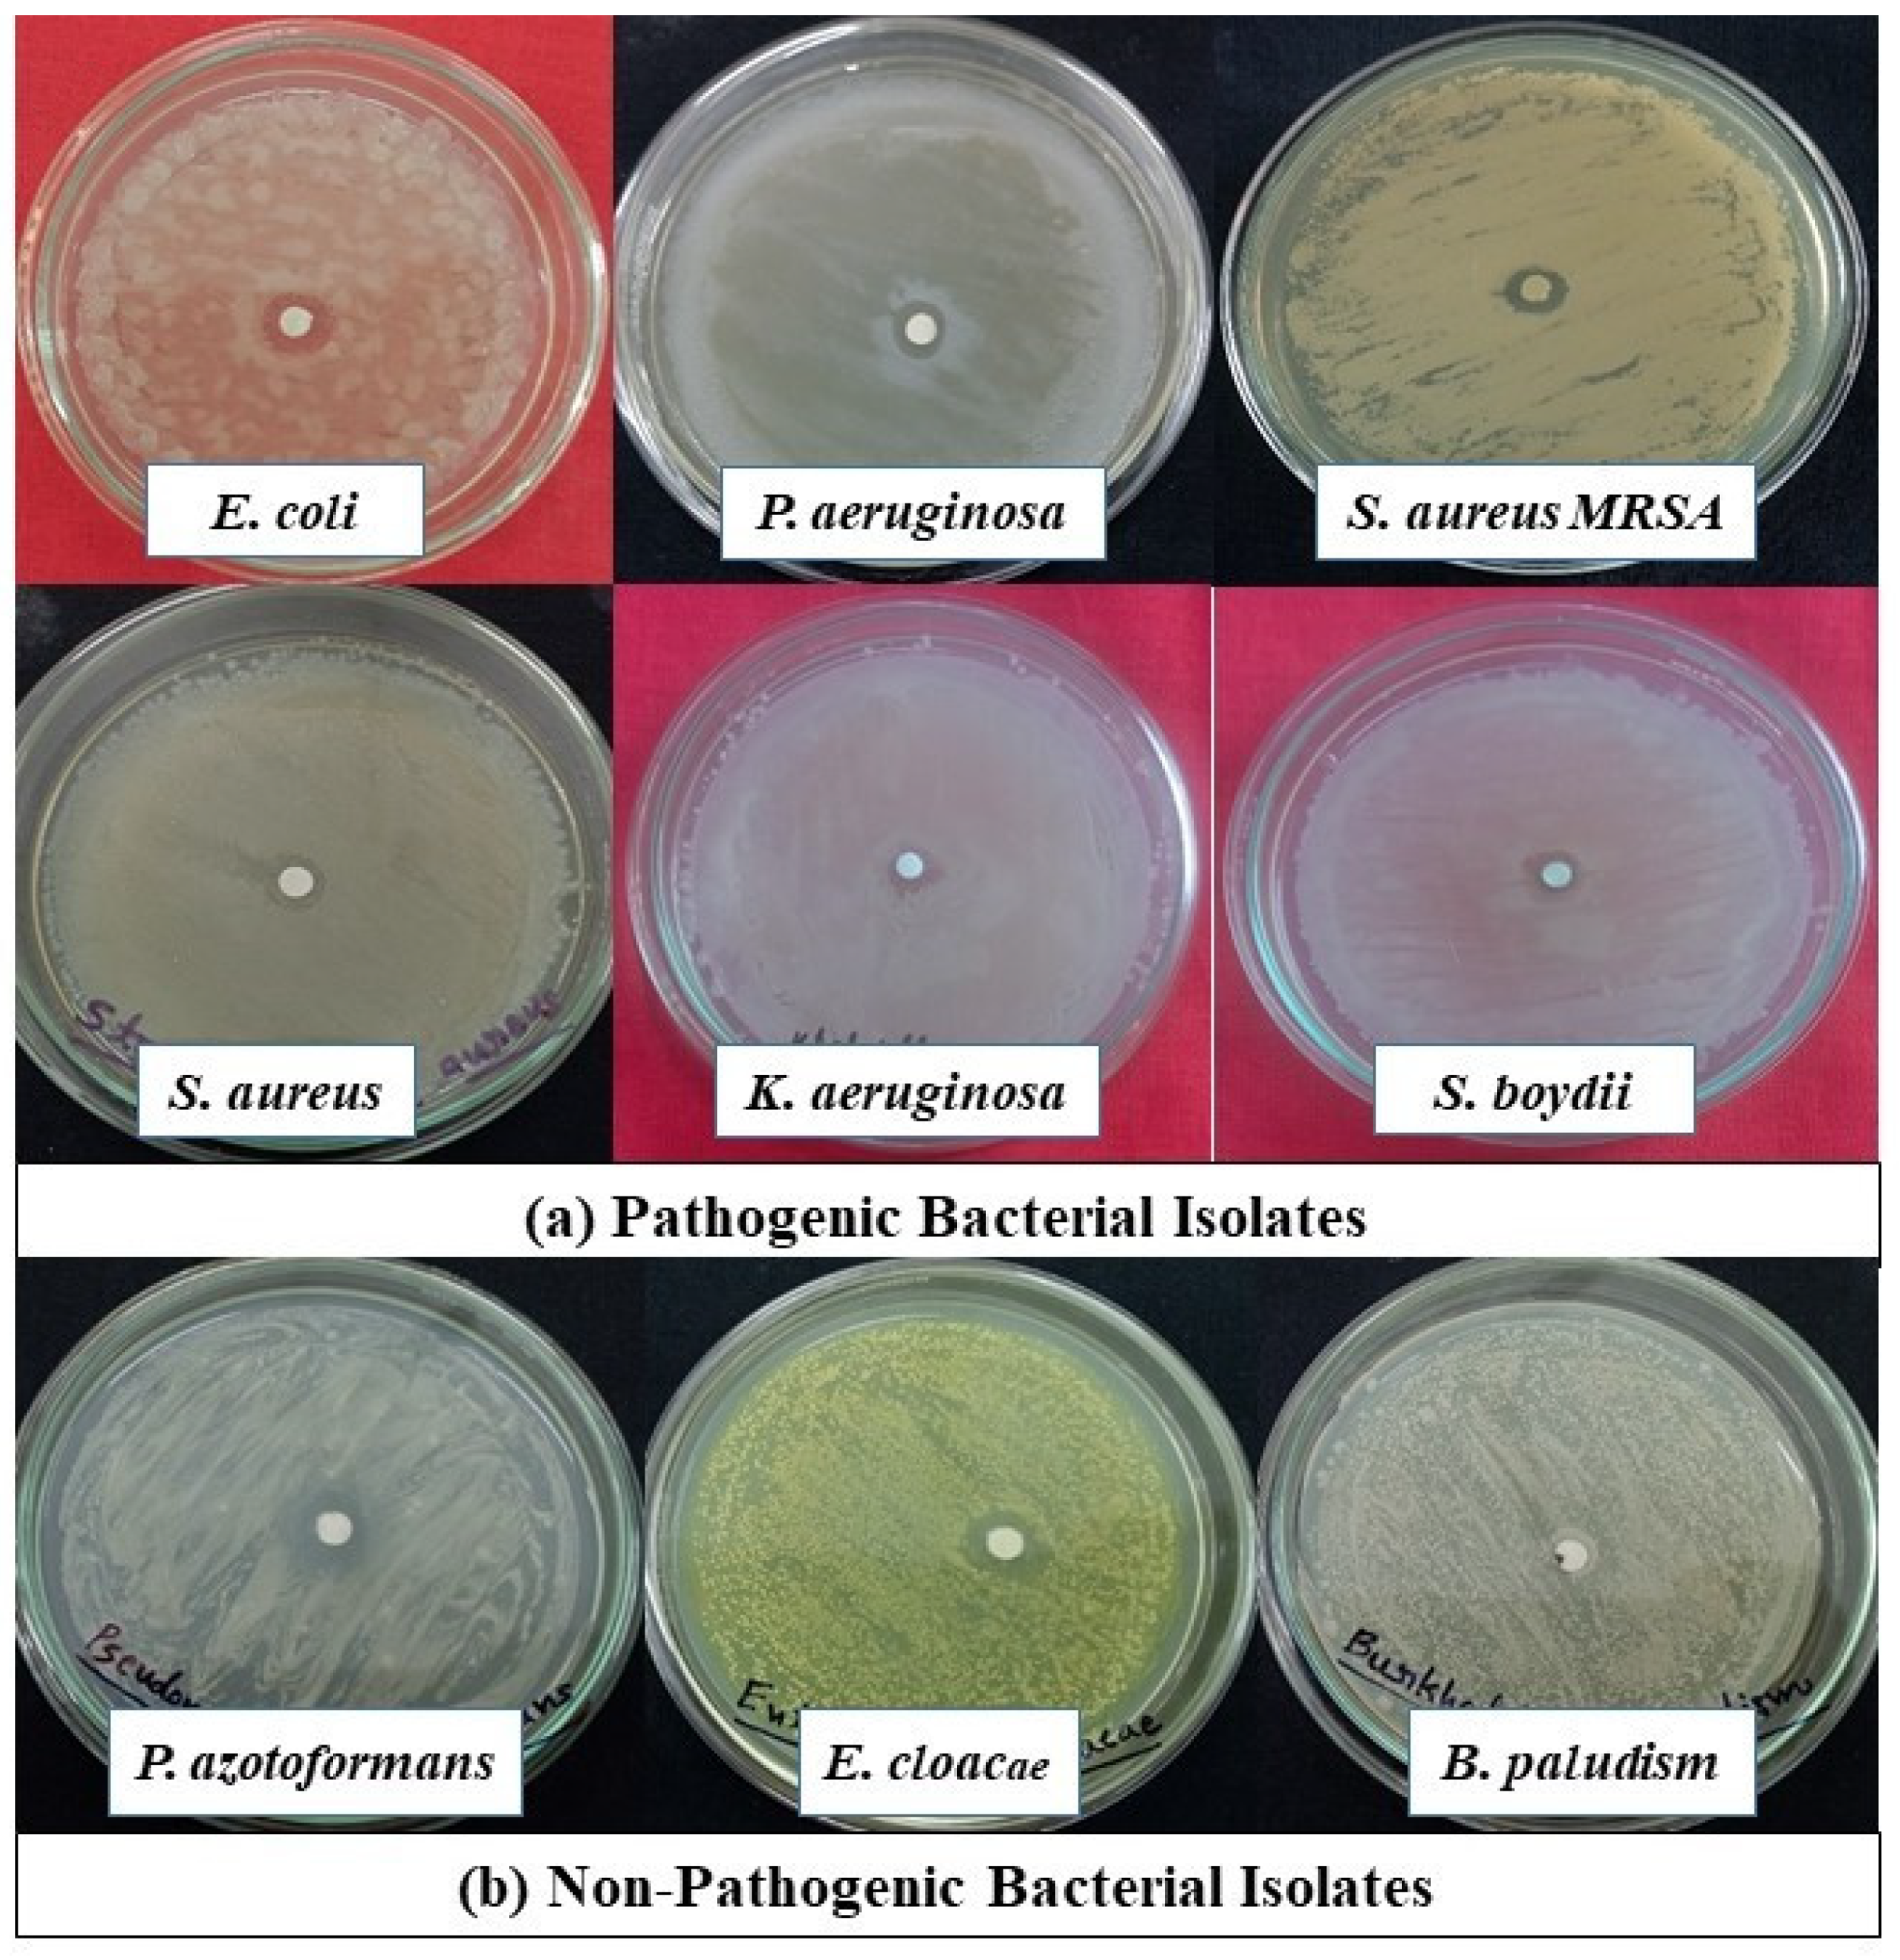

Table 1.
Crystal data and structure refinement of APPABA intermolecular compound.
| APPABA | |
|---|---|
| Empirical formula | C22H24N8O4 |
| T/K | 296 |
| Crystal System | Monoclinic |
| Space Group | P21/n |
| a/Å | 5.2428(2) |
| b/Å | 17.9260(5) |
| c/Å | 11.8917(4) |
| α/º | 90 |
| β/° | 92.5750(10) |
| γ/° | 90 |
| V/Å3 | 2416.5(2) |
| Z | 2 |
| μ(Mo–Kα)/mm−1 | 0.099 |
|
Reflections Collected/unique |
18736/2754 |
| R (int) | 0.0381 |
| Final R indices [I>2σ(I)] | R1 = 0.0440 wR2 = 0.1143 |
| R indices (all data) | R1 = 0.0554 wR2 = 0.1214 |
| GOF on F2 | 1.060 |
| CCDC No. | 2235290 |
Table 2.
Melting temperature, heat of fusion, heat of mixing and entropy of fusion of AP―PABA system.
Table 2.
Melting temperature, heat of fusion, heat of mixing and entropy of fusion of AP―PABA system.
| Component | Melting Temperature (K) | Heat of fusion (kJ mol─1) | Heat of Mixing (kJ mol─1) | Entropy of fusion (kJ mol─1 K─1) |
|---|---|---|---|---|
|
AP―PABA system AP PABA Eutectic-1 (exp.) (cal.) Eutectic-2 (exp.) (cal.) APPABA (1:1) |
398.41 462.58 429.00 393.62 439.88 |
18.32 20.73 26.95 27.38 22.06 26.17 34.03 |
-0.43 -4.11 |
0.0460 0.0448 0.0628 0.0560 0.0774 |
Table 3.
Roughness parameter (α), interfacial energy (σ) and grain boundary energy (γ) of AP, PABA, eutectics and (1:1) APPABA intermolecular compound.
Table 3.
Roughness parameter (α), interfacial energy (σ) and grain boundary energy (γ) of AP, PABA, eutectics and (1:1) APPABA intermolecular compound.
| Component | α | σ (erg cm─2) | γ (erg cm─2) |
|---|---|---|---|
|
AP―PABA system AP PABA Eutectic-1 Eutectic-2 APPABA (1:1) |
5.53 8.38 7.55 6.73 9.35 |
38.91 39.92 39.67 39.82 39.42 |
77.83 79.85 79.34 79.65 78.84 |
Table 4.
Excess thermodynamic functions for the eutectics of AP―PABA system.
| Component | gE (kJ mol─1) | hE (kJ mol─1) | sE (J mol─1K─1) |
|---|---|---|---|
|
AP―PABA system Eutectic-1 Eutectic-2 |
0.36 1.22 |
6.73 4.02 |
0.0149 0.0071 |
Disclaimer/Publisher’s Note: The statements, opinions and data contained in all publications are solely those of the individual author(s) and contributor(s) and not of MDPI and/or the editor(s). MDPI and/or the editor(s) disclaim responsibility for any injury to people or property resulting from any ideas, methods, instructions or products referred to in the content. |
© 2025 by the authors. Licensee MDPI, Basel, Switzerland. This article is an open access article distributed under the terms and conditions of the Creative Commons Attribution (CC BY) license (http://creativecommons.org/licenses/by/4.0/).
Copyright: This open access article is published under a Creative Commons CC BY 4.0 license, which permit the free download, distribution, and reuse, provided that the author and preprint are cited in any reuse.


