Preprint
Article

This version is not peer-reviewed.

Mobile Mapping Approach to Apply Innovative Approaches for Real Estate Assets Management: A Case Study

A peer-reviewed article of this preprint also exists.

Submitted:

20 February 2025

Posted:

25 February 2025

You are already at the latest version

Abstract

Technological development has strongly impacted all processes related to the design, construction, and management of real estate assets. In fact, the introduction of design procedures using a BIM approach has required the application of three-dimensional survey technologies, and in particular the use of LiDAR instruments, both in its static (TLS – Terrestrial Laser Scanner) and dynamic (iMMS – indoor Mobile Mapping System) implementations. Operators and developers of LiDAR technologies, for the implementation of scan-to-BIM procedures, initially placed special care and attention on the 3D sensing accuracies obtainable from such tools. The incorporation of RGB colorimetric data into these instruments has progressively expanded LiDAR-based applications from essential topographic surveying to geospatial applications, where the emphasis is no longer on accurate three-dimensional reconstruction of buildings, but on the capability to create three-dimensional images based visualizations, as Virtual Tours, which allow to recognize the assets located in every area of the buildings. Although much has been written about obtaining the best possible accuracies for extensive asset surveying of large-scale building complexes using iMMS systems, it is now essential to develop and define suitable procedures controlling such kinds of surveying, targeted at specifically geospatial applications. We especially address the design, field acquisition, quality control, and mass data management techniques that might be used in such complex environments. This work attempts to contribute in this sense by defining the technical specifications for the implementation of geospatial mapping of vast asset survey activities involving significant building sites utilizing iMMS instrumentation. Three-dimensional models can also facilitate virtual tours, enable local measurements inside rooms, and particularly support the subsequent integration of self-locating pictures based technologies, that can efficiently perform field updates of surveyed databases.

Keywords: 
;  ;  ;  ;  ;  ;  ;  

1. Introduction

The construction and real estate sectors are undergoing a significant transformation due to the implementation of the BIM approach, and it increasingly being required by various global standards. Indeed, BIM technology possesses significant potential to enhance automation within the Architecture, Engineering, and Construction (AEC) sector and is progressively becoming a standard in numerous nations [1,2,3,4,5,6,7,8,9,10,11].
Based on the assumption that the BIM model is available when working on construction sites and particularly when managing large building assets, a number of technologies have been developed through dedicated software platforms that enable the stacking and asset management phases of even extensive building assets. Specifically, some application platforms allow the recognition of assets in the field while concurrently geo-locating them by using images acquired by mobile cameras. Consequently, appropriate software platforms facilitate centralized asset management through the population of management databases, enable sophisticated functionalities that permit field operators to autonomously find out where they are within the building and identify and “tag” objects and elements in the field, thus allowing real-time compilation and updating of what is happening in the field, rather than merely managing the collection of such valuable information and data in real time with the operations center.
The breakthrough has made three-dimensional indoor mobile mapping instruments equipped with high-resolution cameras, highly competitive in capturing the three-dimensional geometry of extensive real estate assets, offering sustainable time and cost advantages over the static laser scanning method.
Through camera integration, iMMS systems provide in the same time the recognition and geo-location of assets, the production of maps of the site and enable three-dimensional measurements throughout buildings. Web-based virtual tour navigation within the buildings can also be set up, and the production of a three-dimensional point cloud of site can be obtained.
The article presents, in paragraph 1, “State of the art of systems for Indoor Mobile Mapping (iMMS)” the evolution of iMMS technologies over time, the state of the art of indoor mobile sensing technologies and possible future developments, highlighting the characteristics, merits and limitations of dynamic sensing instrumentation, particularly for use in geospatial-type applications.
Section 2, “Building asset facility management,” introduces the concept of building asset management and what technologies are currently being used for such purposes, and how mobile mapping devices can help for this topic.
Section 3, “A case study in Milan - Italy,” describes the characteristics of a successful case study, at the Municipality of Milan, Italy, in which iMMS technologies have been used to perform an asset census of the entire housing property stock of the Municipality itself. A large real estate asset manager wanted to proceed with a project of speditive geometric survey and stacking/inventory/updating of the assets in that housing portfolio. The needs that this real estate asset manager needed to address are described. How the survey specifications have been defined, which differ from the specifications usually employed for topographic building surveys, are described.
Section 4 specifically the iMMS technology applied to perform the asset survey by introducing how the data were processed. The technical choices adopted, both in terms of sensors, instruments and surveying procedures, are analyzed in detail.
Paragraph 5 goes into detail about the procedures applied at the City of Milan surveying project, in the organization of surveying activities and the procedures adopted in order for the work to be carried out in quality.
Paragraph 6 describes in detail the way in the survey was carried out in order to allow the technicians to navigate through virtual tours within the three-dimensional-photographic model in order to recognize the assets of the buildings in the images.
Paragraph 7, “archiving of surveyed data and management of survey results, describes the flow of data and how the survey was archived by the developer of the works.
Section 8, “Survey results,” shows some examples of the survey issues that emerged and some examples of outliers found during survey activities.
Paragraph 9, “Conclusion,” presents in summary some comments and considerations that arose from the project and how this activity fits harmoniously with recent technological developments. Future developments and studies are presented.
1. State of the Art of Systems for Indoor Mobile Mapping (iMMS)
The increasing demand for three-dimensional surveys to extract BIM models of existing buildings has been accompanied by the increasing widespread use of terrestrial laser scanners (TLSs) [12,13,14,15,16,17,18]. In all those cases where restoration or renovation of an existing building is to be carried out, if the project is to be realized with BIM approach, it is in fact necessary to make a three-dimensional survey and then an extraction from the point cloud model of a parametric model. The laser scanner survey operation and subsequent modeling of pipes, pipelines, and tanks have rapidly become standard in industrial settings, particularly in oil and gas facilities, where the operation, known as “scan to BIM,” has found rapid application and success [19] [20]. The regular and standard geometries of the service networks of these facilities have rapidly demonstrated the high effectiveness and productivity of automatic or semi-automatic geometry recognition in particular on oil&gas environments using point clouds acquired by static laser scanners [21,22,23].
In contrast, in the field of construction and real estate, these tools are significantly less effective. Consequently, the modeling operations, specifically the scan to BIM process, are primarily based on the operator’s manual actions, resulting in significant costs and time. Nevertheless, operational issues remain to be resolved and effectively managed, such as through the use of artificial intelligence algorithms. The scan to BIM in real estate and construction is primarily based on the creation of catalogs of known geometries, which the operator has to recognize and apply to the point cloud model of reality, rather than on processes that allow the automatic extraction of geometries from the point cloud [24,25,26].
The scan to BIM process is challenging to implement for many projects with restricted budgets. Because of this challenge, the laser scanner is frequently employed in surveying applications on existing buildings, resulting in the production of 2D representations of floor plans and elevations. The point cloud is used just to extract point cloud profiles, and the restitution of the floor plans, profiles, sections, and elevations to CAD is performed manually by operators. Consequently the BIM model is subsequently generated by starting from the floor plans and manually adding the heights measured by the laser scanner model into the modeling software. Further difficulties that have limited the laser scanner’s widespread adoption are attributable to the fact that in order to merge the three-dimensional scans obtained from various stationing positions with the laser scanner, each scan must observe at least three targets that are common to the adjacent scans. The processing times required to obtain the complete point cloud model are lengthy, with an estimated duration of approximately three times the time required to scan the point cloud in the field.
Initially, this issue was one of the main challenges that data-processing software developers and TLS instrument manufacturers attempted to solve in order to speed up the alignment processes between scans. The operation of locating and recognizing targets or markers that are also present in the adjacent scan, as well as the field placement of printed targets or spheres covered with reflective materials, is in fact a time-consuming procedure. On the other hand, the effectiveness of automatic alignment algorithms between scans might not produce accurate and stable results. [27,28,29,30,31]. For this reason, the utilization of targets for merging scans is still prevalent in outstanding applications, as it ensures the quality and accuracy of the registration process between scans.
Consequently, if it is imperative for engineering reasons to implement a BIM model, it is necessary to run a survey through TLS instrumentation, resulting in the incurred costs of this operation. In the circumstance that the BIM model is only functional for facilitating the implementation of digital procedures that improve the efficiency of building management, as is the case in our scenario, these expenses are currently totally unrealistic.
The introduction of mobile surveying technologies has been a significant contributor to the reduction of surveying costs in this context. It was around the year 2000 that the scientific community became interested in the development of mobile mapping systems [32,33,34].
The market saw the emergence of surveying systems that were based on mobile mapping technology between the years 2000 and 2005. These instruments were equipped with a LiDAR sensor, a camera, an inertial IMU system, a DMI, and GNSS [35]. These tools, mounted on vehicles, provide efficient surveying of extensive open areas, especially metropolitan centers and infrastructure. Nevertheless, outdoor mobile mapping systems have not influenced the construction and civil engineering sectors, as their operation requires being able to get the instrument’s position using GNSS methods, either in real-time kinematic (RTK) mode or through post-processing. On the contrary, buildings and residential construction are environments where GNSS signals can often not be trackable, an important issue that has typically restricted the use of outdoor mobile sensing instruments in these operating environments [36,37,38,39,40].
Since the 1990s, academics, particularly in the field of robotics, have started the development and testing of algorithms for self-localizing robots in confined environments, in particular warehouses. Algorithms known by the acronym SLAM, which stands for Simultaneous Localization and Mapping (proposed and defined by Smith in 1986), [41] permit to an instrument equipped with appropriate sensors to autonomously determine its position within a building or a three-dimensional environment (initially applications involved automatic positioning within automated warehouses), simply by observing its own position with respect to a 3D panorama of fixed elements in space, such as the walls, floors, pillars [42,43,44]. By analyzing the changes in its position relative to a static environment, the instrument applies SLAM algorithms to estimate its trajectory in order to accomplish self-localization within that environment. Consequently, the device can indirectly survey the geometry of the surroundings. The SLAM positioning and 3D survey was initially introduced in robotics, where a robot can understand its own position and orientation in the space, thanks to the measurements of Lidar and IMU sensors, starting from an unknown location [45]. Commercial SLAM solutions for professional operators began to emerge in the 2010s. These systems mostly uses multi-beam LiDAR sensors from the automotive sector, coupled by IMU sensors of variable accuracy [46,47,48].
At the moment, these instruments offers efficient indoor surveys throughout buildings, urban areas, tunnels, and mines, with extremely fast timelines and local accuracies on the order of about 5 mm / 2 cm. There are also numerous applications in environmental, spatial, cultural heritage and even BIM modeling, [49,50] permitting in fact to utilize the point cloud generated by these systems for BIM modeling [51], with a focus on LoD (Level of Development) classes that are compatible with the accuracies of these systems. The main limitation of such solutions lies primarily in the local measurement accuracy, which is on the order of centimeters, and in the geometric drifts to which such systems can be subject for medium/large-scale surveys. In order to reduce the effects of such geometric drifts, numerous slam-based tools are forced to impose that in the field detection phases, the starting point of the detection coincides with the endpoint of the surveying [52].
Nonetheless, these technologies have the significant advantage of facilitating the rapid assessment of large locations, producing survey accuracies frequently aligned with the specifications of a real estate rehabilitation project, typically within 1 – 2 cm locally and several centimeters in the global survey. SLAM technology provides a great simplification of field measuring processes while simultaneously reducing their costs. Due to the fact that the centimeter-level accuracy of the global model in geospatial projects is not needed, the setup of control points or control scans can be abandoned in such applications [53,54]. A important advantage of the iMMS SLAM-based techniques is its capacity to operate in mixed environments, that includes outdoor as well as indoor conditions, with the only main constraint being the need for adequate three-dimensional geometry in the surveyed areas [55,56]. This limitation precludes open areas lacking of geometrical features, such as broad spaces or places characterized by highly regular geometries, like regular concrete road tunnels. Moreover SALM requires that the surveyed geometry remains stable, and consequently, measurements in densely vegetated areas with high winds moving the leaves should be avoided.
The data processing approach of static laser scanners is substantially different from the process of producing the point cloud from such instruments. The point cloud that is generated in a post-processing phase by the SLAM algorithm for systems that rely on it does not precisely match the data acquired by the LiDAR sensor. In reality, the operator’s trajectory during the surveying processes is estimated through the combination of the raw data acquired by the lidar sensor with the data from the IMU. Such an operation is performed in post-processing, and various system manufacturers and research teams have developed proprietary solutions to improve and optimize the estimation of the instrument’s trajectory [57,58].
It is obvious that the quality of the point cloud model generated is directly correlated to the accuracy of the trajectory estimation provided by the instrument. After the trajectory is estimated, the software generates the point cloud at the required resolution, taking into account any geometric constraints that typically consist of control points. Consequently, it appears contradictory to surveyors that are familiar using TLS devices, that for example remaining stationary with the iMMS device during the acquisition, for instance in a specific area of a building, significantly increases the data to be processed, but this does not contribute to the increase in the density of the point cloud model that the system will generate at the conclusion of the data post-processing.
Finally we can say that the introduction of the SLAM solution immediately represented a valuable aid in making the surveying operations of large real estate complexes faster and more sustainable [59,60,61]. For the first slam-based systems, the most significant limitation was the high noise of the three-dimensional data and the substantial geometric drifts affecting the trajectory estimated by the algorithm. For these reasons, SLAM devices have been utilized primarily in applications where the main goal was not to achieve high accuracy in three-dimensional survey. Experiences such as Microsoft’s indoor localization competition [62,63] or IPIN (International Conference on Indoor Navigation and Positioning) [64,65] have made significant and interesting contributions to the development of SLAM algorithms [66,67,68,69,70].
To use such systems for the contextual identification of building geometries and the geolocation of objects and their attributes, which is the focus of this contribution, it is essential to concurrently capture images of the navigated environments with the geometries. Initially, systems capable of obtaining geometries and simultaneously high-quality images were restricted to equipment mounted on mobile trolleys, such as Viametris iMS3D [71]. The main advantage of such instruments was clearly to alleviate the operator from carrying heavy instruments and provide high-resolution images. On the other hand to manage high resolution images necessitated a powerful enough data processing unit and consequently, an adequate battery pack. The combined effect of the two components resulted in considerable heaviness of the PC and batteries, necessitating the usage of trolleys (Figure 1) for the all staff movement. This clearly restricted the use of such solutions in complex locations such as multilevel building sites and industrial facilities, as well as restricting them from moving in areas with stairs, steps, and irregular surfaces.
Without going into the specifics of obsolete platforms, modern developments have changed these systems into solutions that are more manageable for operators. Examples of such instruments include the Gexcel Heron Twin Color (Figure 2a) [75,76], Viametris MS-96 (Figure 2b) [77], and NAVVIS [78] (Figure 3a) and Leica BLK2Go [79,80] (Figure 3b) which, despite employing different solutions, are distinguished by increased carry versatility, permitting the system to be carried on the operator’s shoulders, thus enabling access to environments such as buildings and construction sites.
These solutions facilitate the acquisition of images synchronized with photographic images, which allows the creation of three-dimensional models in color and particularly allowing for navigation through a Virtual Tour approach, where users can explore the spherical images captured by the system. This enables the recognition of objects and elements within the scanned sites, while enabling their localization, the measurement of interior geometries, and the acquisition of three-dimensional data necessary to the BIM modeling of the buildings.
Figure 3. (a) VLX2 by NAVVIS [78] (b) BLK2GO by Leica [80]
Preprints 150090 g003
Portable systems can now be used in an affordable and logistically feasible way for the 3D mapping of complexes in the geospatial domain, extending beyond strictly topographical contexts [81].

2. Building Asset Facility Management

As stated in the introduction, the purpose of this article is to investigate how mobile mapping technologies may facilitate the use of new technologies for locating, identifying, and cataloging assets inside buildings . This is especially relevant for the management of large real estate portfolios.

2.1. A general Introduction to Building Asset Management

Facility management is becoming increasingly important in the building restoration and maintenance business due to its capacity to streamline processes and considerably reduce management costs. A field survey of assets for large real estate properties, serves mainly to update and enrich the information assets that, in technical ambitus, accompanies the database already available within the management information system of the company that manages the buildings.
Numerous experiences have shown that the survey of assets must allow:
  • Increase the amount of data available, while correcting any errors and inaccuracies in the information system;
  • Providing the property manager with valuable support, overseeing the financial aspects and resources designated to facility operations, and evaluating and managing expenses associated with building maintenance, repairs, renovations, and utilities to ensure the efficient allocation of resources;
  • Overseeing and authorizing contracts and service providers for a variety of services, including sanitation, cleaning, and security;
  • Conducting routine inspections, changes, and maintenance to guarantee the facility’s daily operations;
  • Improving the administration of flat relocations;
  • Overseeing the appropriate care of essential services, including heating and water;
  • Ensuring that facilities comply with government regulations, health and security standards, and energy efficiency standards;
  • Supervising teams of employees or third-party laborers who are responsible for security, maintenance, and cleaning;
  • Supervising the implementation of improvements and enhancements;
  • Facilitate the design activities of exceptional maintenance work and optimize the sizing of contracts for the acquisition of works, goods, and services;
  • Possess the indicators required for the development of comprehensive analyses regarding asset management performance and potential development scenarios.
At the moment, the collecting of primary site geometry and the cataloguing and inventory of a vast number of different data has been done mostly using various software applications based on the use of digital devices as cameras or notepads to collect the data on the field. Employing a tablet with a floor plan in the background, usually in PDF format, surveyors walk through buildings and geolocate information on dedicated software (Figure 4).
Consequently, there exist several applications that facilitate and regulate such activities. For instance, Acca’s applications [83] are very prevalent in Italy, where of this case study is realized; however, there are various other software applications, frequently originating from the construction sector mainly responding to the terminology of “building asset management software,” as Asset Panda [84] , Faciliteasy [85], Asolvi [86] UpKeep [87], to name as examples some of the most popular applications. Such platforms include capabilities such as inventory management, inspection, maintenance management, and scheduling and planning of maintenance activities. Nearly all these programs provide field apps for data acquisition in situ.
An operator, visiting the building according to the PDF floor plans of the various levels, may match each location (e.g., room, lobby, hallway, etc.) with the collection of assets and items located within that specific area. Consequently, it is possible to execute the stacking and inventorying of sensors and assets inside the building (such as temperature sensors, fire sensors, intrusion sensors, etc.), rather than cataloguing the location and attributes of lighting, doors, locks, switches, plugs, and speakers. Such programs frequently incorporate advanced functionalities for site document management, cost analysis, and maintenance and asset management operations. These programs automatically can run if the building plans and/or the corresponding BIM model are available. Collection of data activities for populating building asset databases are conducted manually by operators and typically don’t allow dimensional measurements, such as the dimension of doors or the height of a parapet or electric button from the ground.

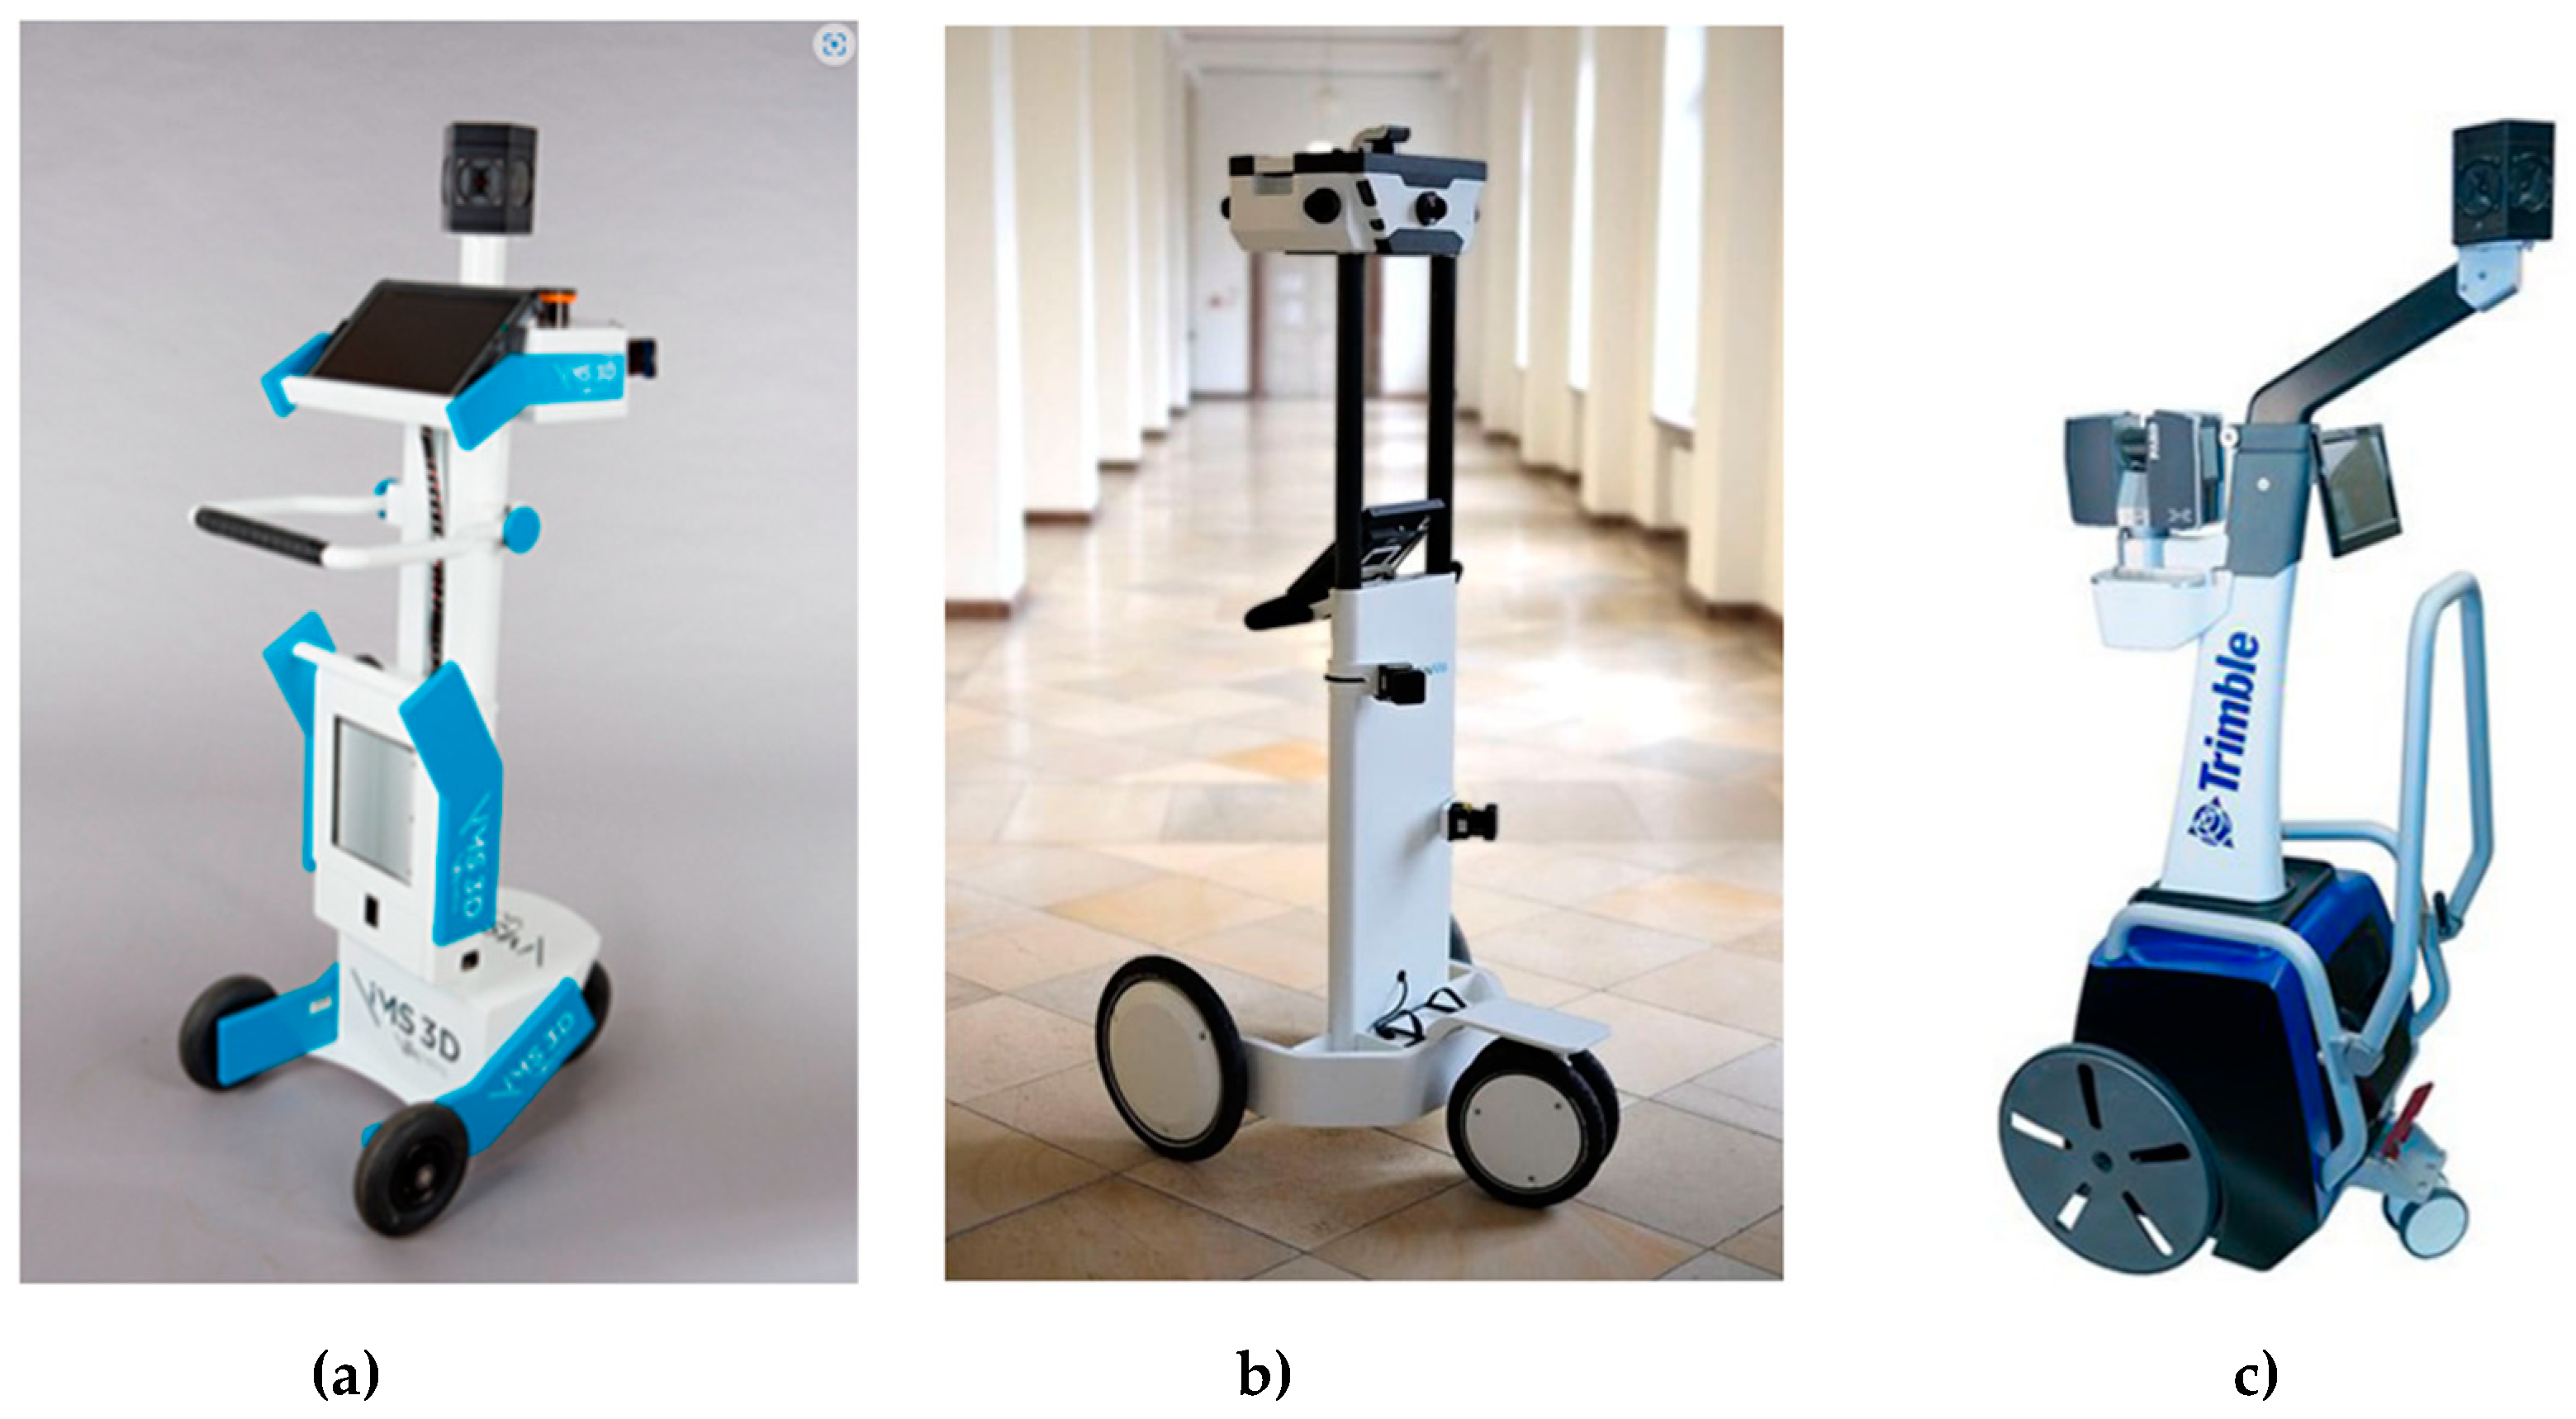
2.2. iMMS Platforms for Asset Management Applications: General Principles

The software-based systems discussed in the paragraph 2.1., particularly based on a tablet for uploading maps of visited areas, evidently contain certain disadvantages. Building plans must be available, object recognition must be conducted in the field by the operator without a photographic record of the current condition, and 3D measurements cannot be taken; furthermore, 3D measurements of the entire or partial environments traversed cannot be extracted. The advent of mobile mapping devices integrated with high-quality cameras has consequently expanded the possible uses of iMMS systems. iMMS instruments, initially developed as self-locating devices and subsequently employed for rapid surveys in indoor environments, can now efficiently record assets in various contexts, consequently supporting geospatial applications (Figure 5).
Moreover, alongside the three-dimensional survey of the sites, the imaging features enables the recognition of assets within buildings and three-dimensional measurements. In addition, if not yet present, it is possible to obtain floor plans or elevations of buildings.
Figure 6. A BluePrint of a University of Brescia building, realized using a mobile mapping device.
Preprints 150090 g006
So, SLAM surveying allows at the same time to be employed for classical surveying activities, while photographic acquisitions can be used for the recognition and positioning of assets within buildings, but also as evidentiary documentation of the actual state of a building. By positioning, in this case, we do not mean in detail just the spatial coordinate where such an asset is located, but rather knowledge of the environment where the assets are located. For example, knowing the location of a fire extinguisher placed inside a building means also being able to indicate in which room, of which building, and on what floor of that building that fire extinguisher is located. This example is illustrative that the way to carry out a classic survey with iMMS instrumentation aimed at topographic mapping of a building, is radically different from the way to proceed for an asset survey activity. Different objectives are followed by different methods and procedures, which will be appropriately described in the following sections. The survey by dynamic instrumentation, therefore, allows the production of different deliverables.
The deliverables that can be obtained from iMMS instruments are analyzed in the following paragraphs, describing the challenges and methods for extracting these products and general operational advice depending on activities focused on asset management rather than accurate 3D topographic surveying. Particularly depending on the deliverables to be extracted from a survey with dynamic instrumentation, the choice of iMMS instrumentation to be used in surveying activities is also derived. The following paragraphs are intended to help and define guidelines of the choice of mobile surveying systems depending on the deliverables that are intended to be extracted in an asset management activity

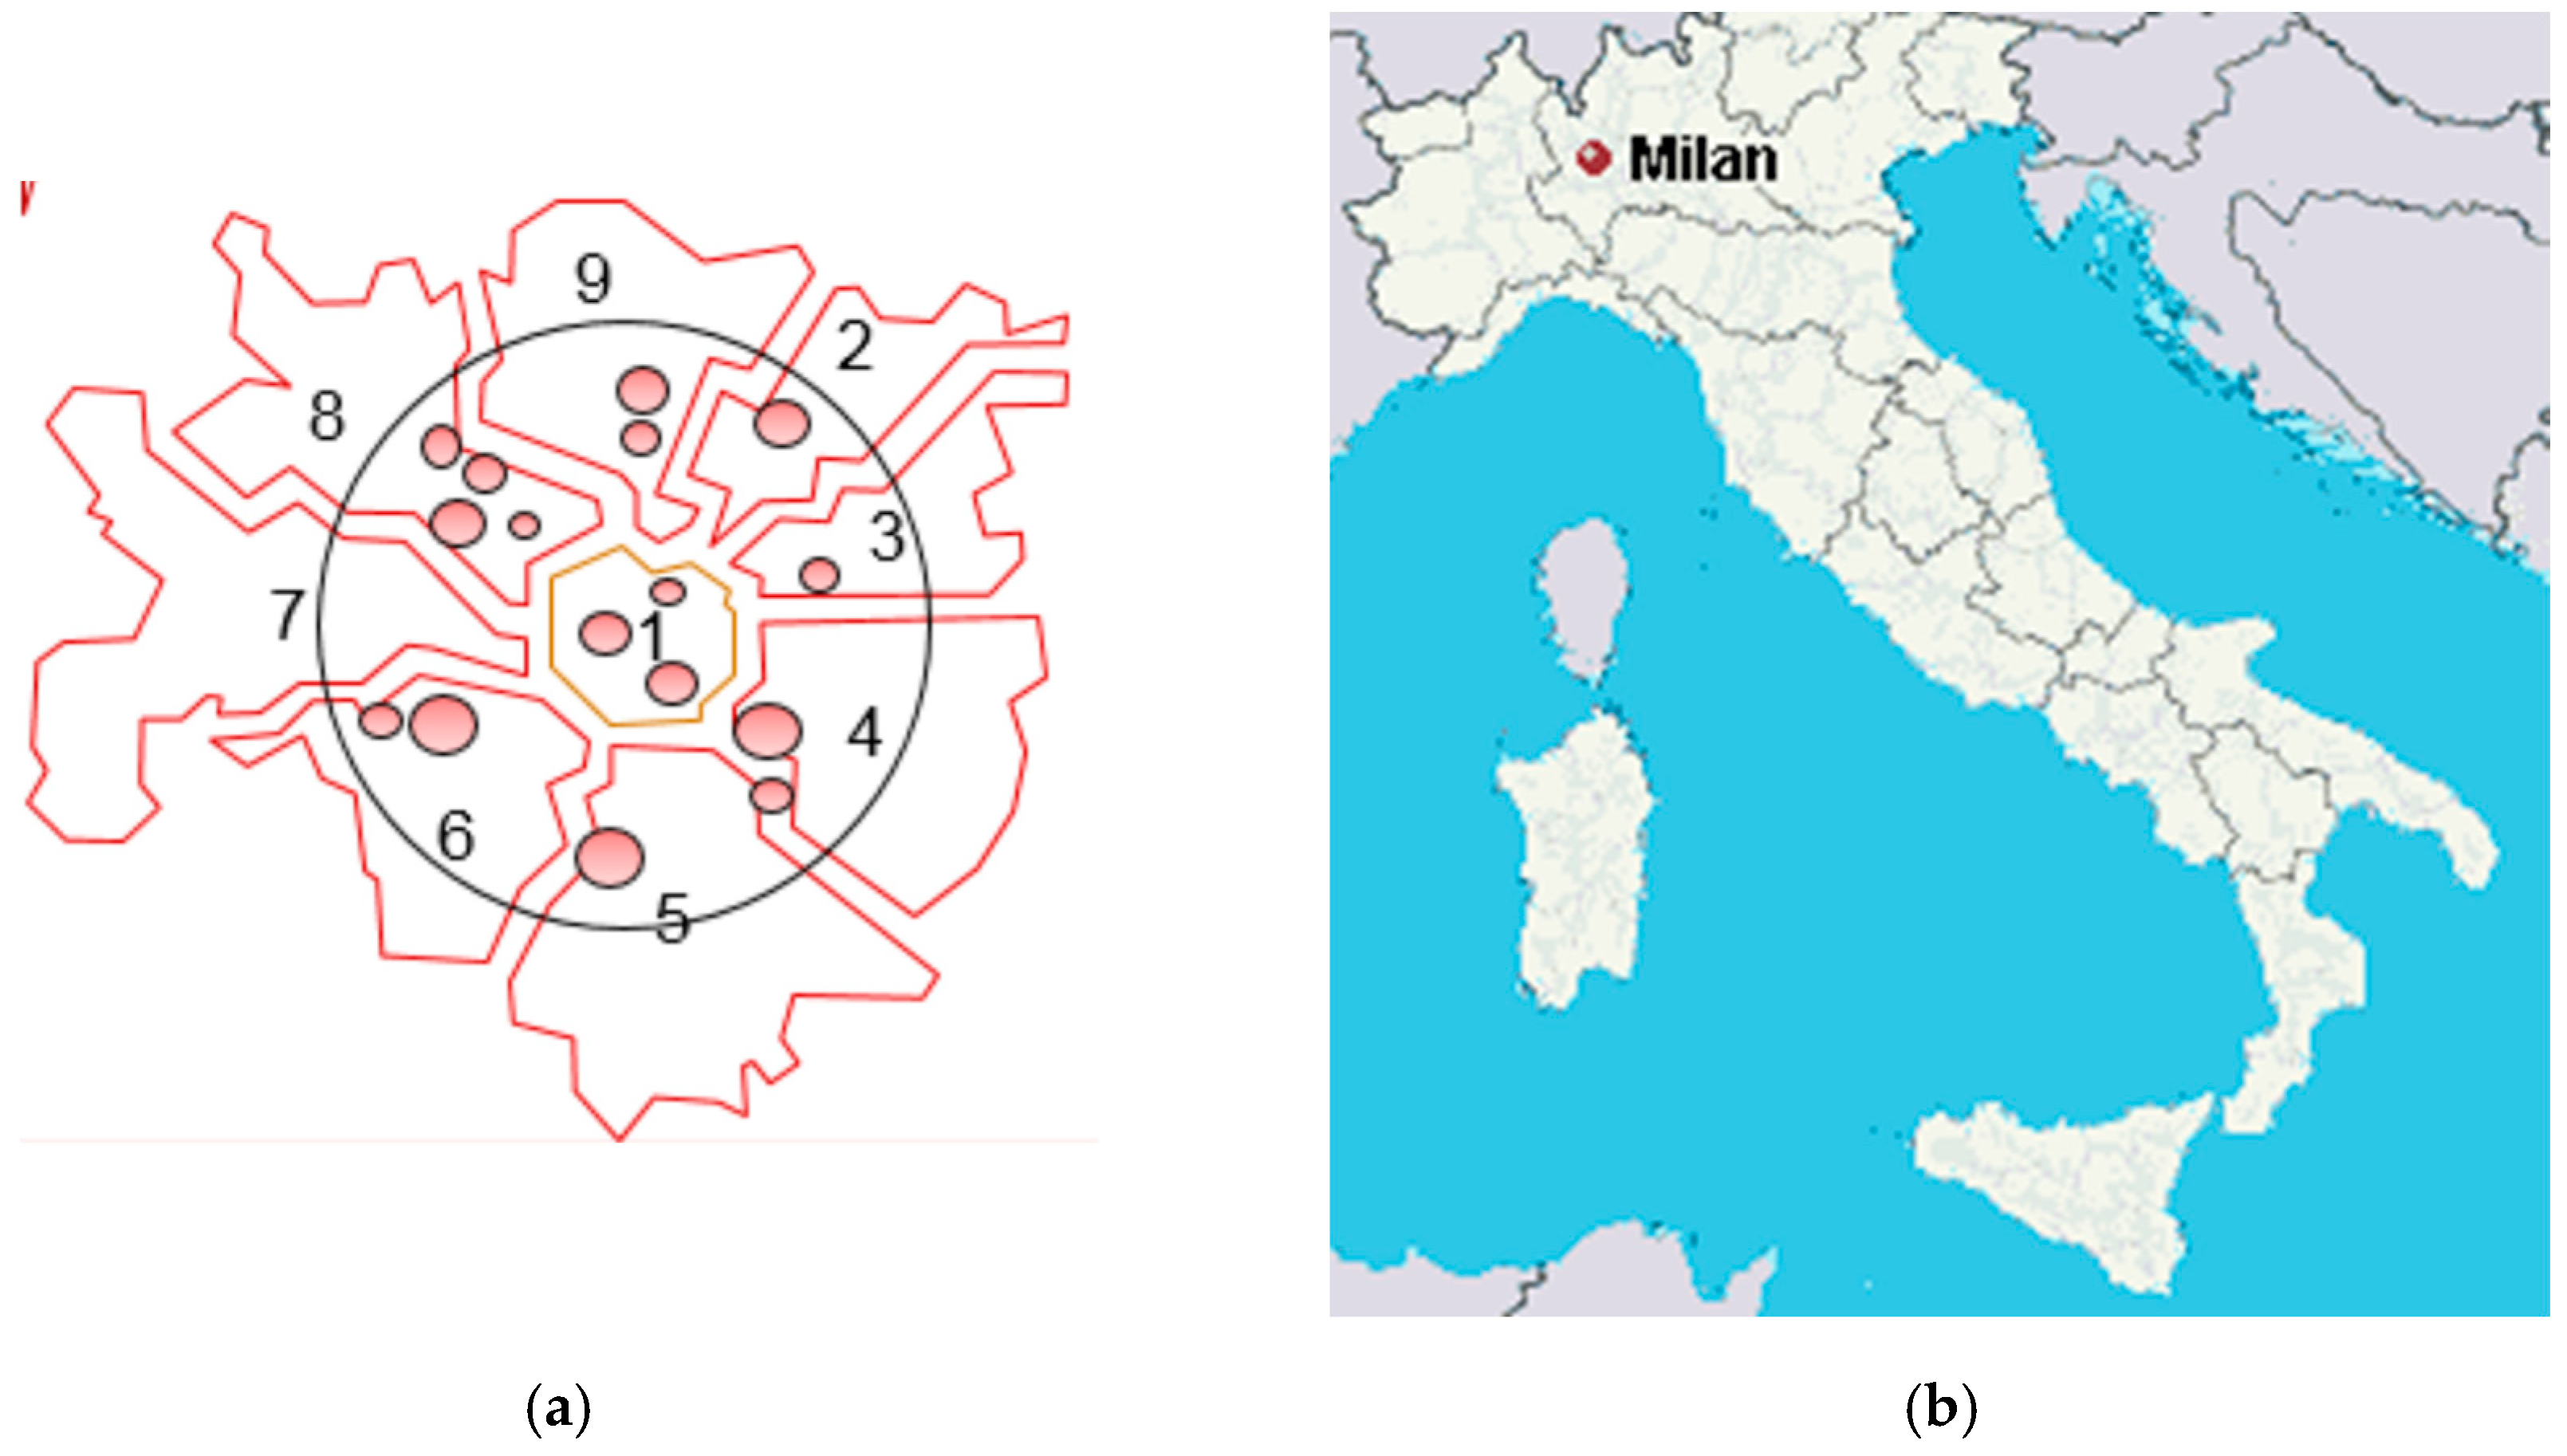
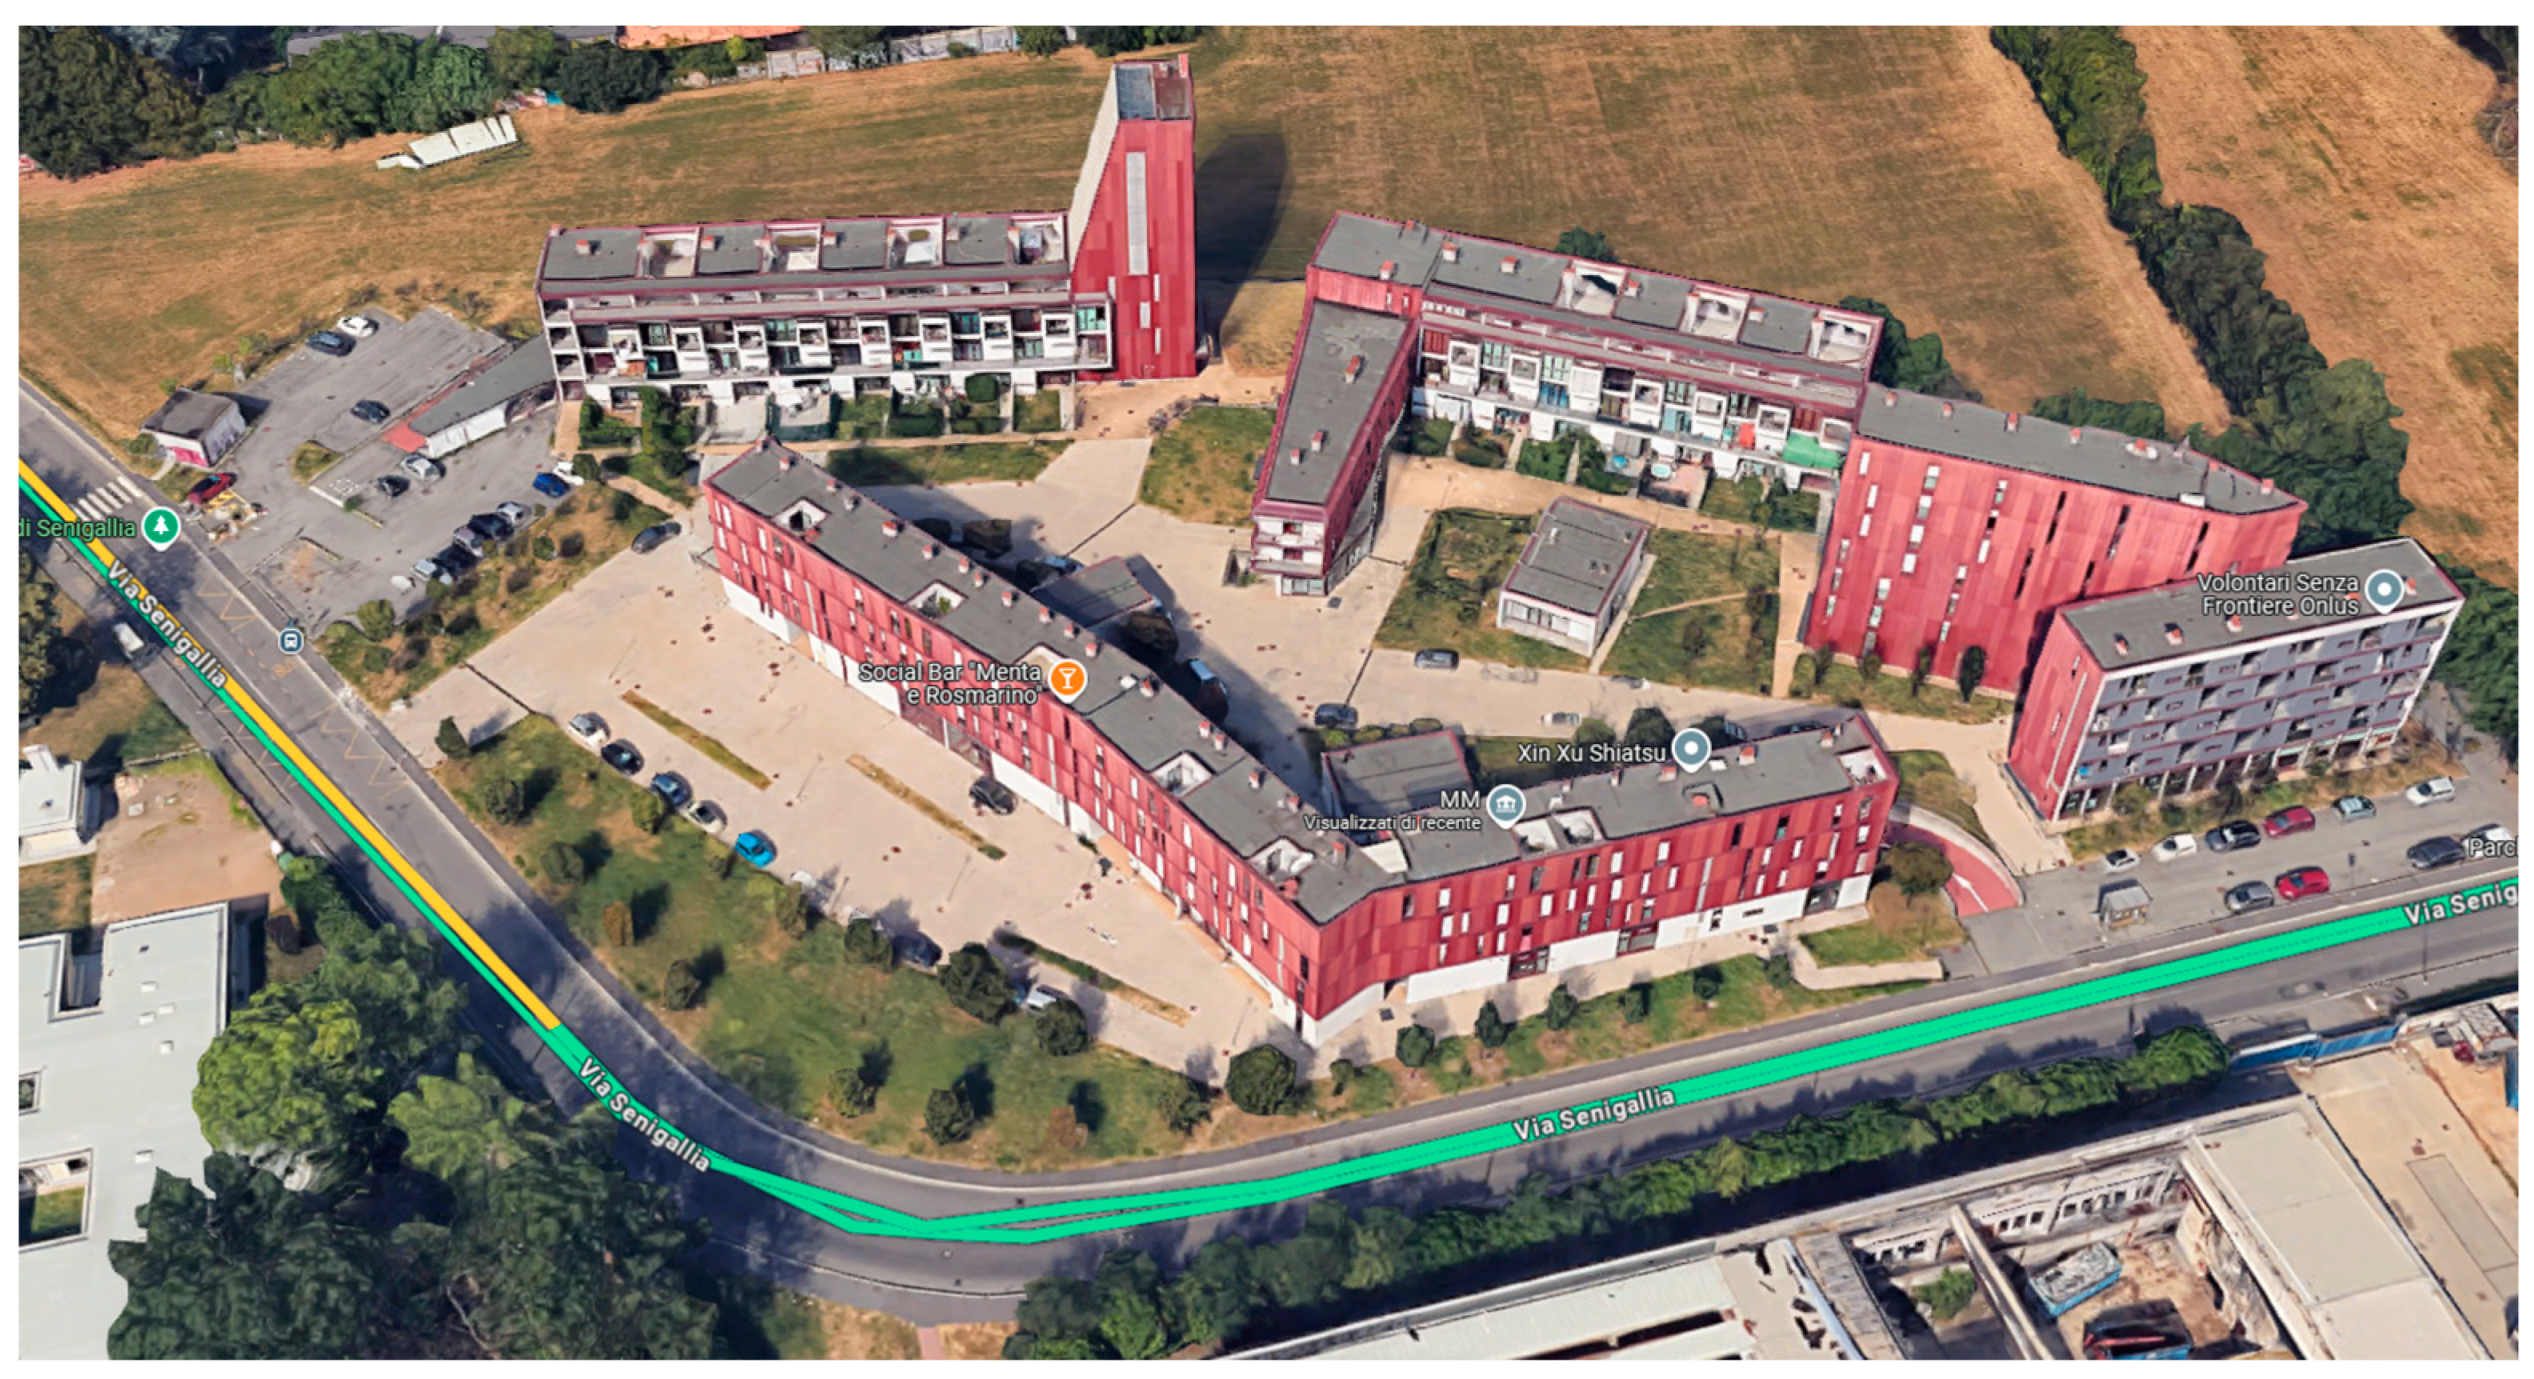
3. A case study in Milan - Italy

3.1. Introduction

The methodology employed in Milan, northern Italy, is remarkable in relation to the state of the art technologies applied. The case that was examined and that allowed for the study, analysis, and definition of operational procedures for an extensive survey of assets associated with large building heritages using an iMMS approach is that of the Municipality of Milan in northern Italy. The project relates to the Municipality of Milan, which in 2015 delegated the management of its public housing assets to the company Metropolitana Milanese (hereafter MM) [88]. The housing inventory of the City of Milan comprises around 1,100 structures, organized into over 300 complexes. These buildings contain almost 30,000 housing units, around 1,300 of which serve non-residential purposes, referred to as “miscellaneous uses,” including stores, workshops, and offices. Furthermore, there are around 9,500 units, including garages and parking spaces, resulting in a total of nearly 40,000 units under management. This statistic comprises around 1,500 housing units situated in adjacent municipalities or beyond the City of Milan. The public housing inventory maintained by the Municipality of Milan exhibits a clear historical stratification, fundamentally associated with the cyclical pattern of housing initiatives aimed at assisting the economically disadvantaged elements of the population during the previous century. The development of this housing stock can be delineated into three primary phases. During the initial years following World War II, in the mid-1960s, and in the mid-1980s. Subsequent to these three phases, the municipal authority progressively withdrew from the construction of housing for the economically disadvantaged population. The chronological organization of building initiatives led to the development of a markedly diverse inventory. MM resolved to undertake a project aimed at closing the knowledge gap within a substantial segment of the managed heritage sector. For these structures, concerning shared areas both internally and externally, as well as technological facilities, a decision was made to conduct a field survey campaign in preparation for further targeted census efforts. The project activities are overseen by MM’s “Housing Division,” responsible for managing the public housing inventory owned by the City of Milan, from which all contracts, including the one in question, pertaining to maintenance activities on the buildings are processed. The project encompasses 498 structures, arranged into 142 complexes, distributed over 9 regions of responsibility.
Figure 7. (a) The buildings of project, managed by MM inside Milan are organized in 9 main areas. (b) Milan is the main industrial city of Italy, located in the North part of the country (Courtesy of MM).
Preprints 150090 g007
A building complex is a collection of one or more buildings that are subject to a centralized governance structure, Figure 8. The position and site address of the single central gatehouse is frequently the primary distinguishing code of a complex, as the buildings within it usually share the same boundaries, which is frequently delineated by a gate or walkway that clearly delineates the complex’s area of authority.
Typically, the administration of routine and extraordinary maintenance contracts for the buildings in a complex is conducted in an aggregated approach. In addition, buildings within a complex typically share essential services, including the heating plant, a connection of technical services such as water distribution or electricity, and garbage collection spaces, rather than access to the parking areas and/or garages of individual apartment owners or residents. The data acquired in the field during the surveying process are intended first and foremost to update and enrich the information assets that, in the technical domain, accompany the database already available within the management information system in use at MM. The asset survey should allow the adhering to:
  • Increasing the amount of data available and fixing any errors and inaccuracies in the information system.
  • Providing valuable support to MM for the monitoring of the financial aspects and resources assigned to facility operations, evaluating and managing expenses associated with building maintenance, repairs, renovations, and utilities to ensure the efficient allocation of resources.
  • Supervising and empowering contracts and service providers for a variety of services, such as sanitation, cleaning, and security;
  • Handling periodic checks, adjustments, and maintenance to guarantee the facility’s daily operations;
  • Improving the administration of apartment relocations;
  • Overseeing the appropriate management of essential services, including heating and water;
  • Ensuring that facilities comply with government regulations, health and security and safety standards, and energy efficiency benchmarks;
  • Supervising teams of employees or third-party workers who are responsible for security, maintenance, and cleaning;
  • Supervising developments and improvements;
  • Supporting the planning activities of extraordinary maintenance works and optimising the organizing of contracts for the acquisition of works, products, and services;
  • Possessing the indicators required for the development of detailed analyses regarding asset management performance and potential development scenarios.
Based on the previously mentioned general goals MM determined that the survey should proceed with the implementation of the most innovative technologies, which would enable the following results to be ensured in detail:
  • To be able to obtain a state of affairs for the common areas of all surveyed buildings, which would enable the extraction of expeditious plans of these environments with local centimeter accuracies;
  • To enable the taking of local three-dimensional measurements and the subsequent association of assets within the buildings with each area. Mainly for the purpose of cost containment, it is unnecessary to guarantee global centimeter-level accuracies in the surveying of the complete complexes and buildings. Additional requirements included the ability to navigate the items in a topologically and unambiguous way, as well as the accuracy of measurement and geolocation.
  • Acquire photographic and geometric documentation that enables the identification of assets and items in the buildings and the integration and updating of data already present in the company’s information system;
  • Enable the storage of photographic and three-dimensional documentation of the buildings in formats that are not restricted by proprietary software for relative visualization in the near future;
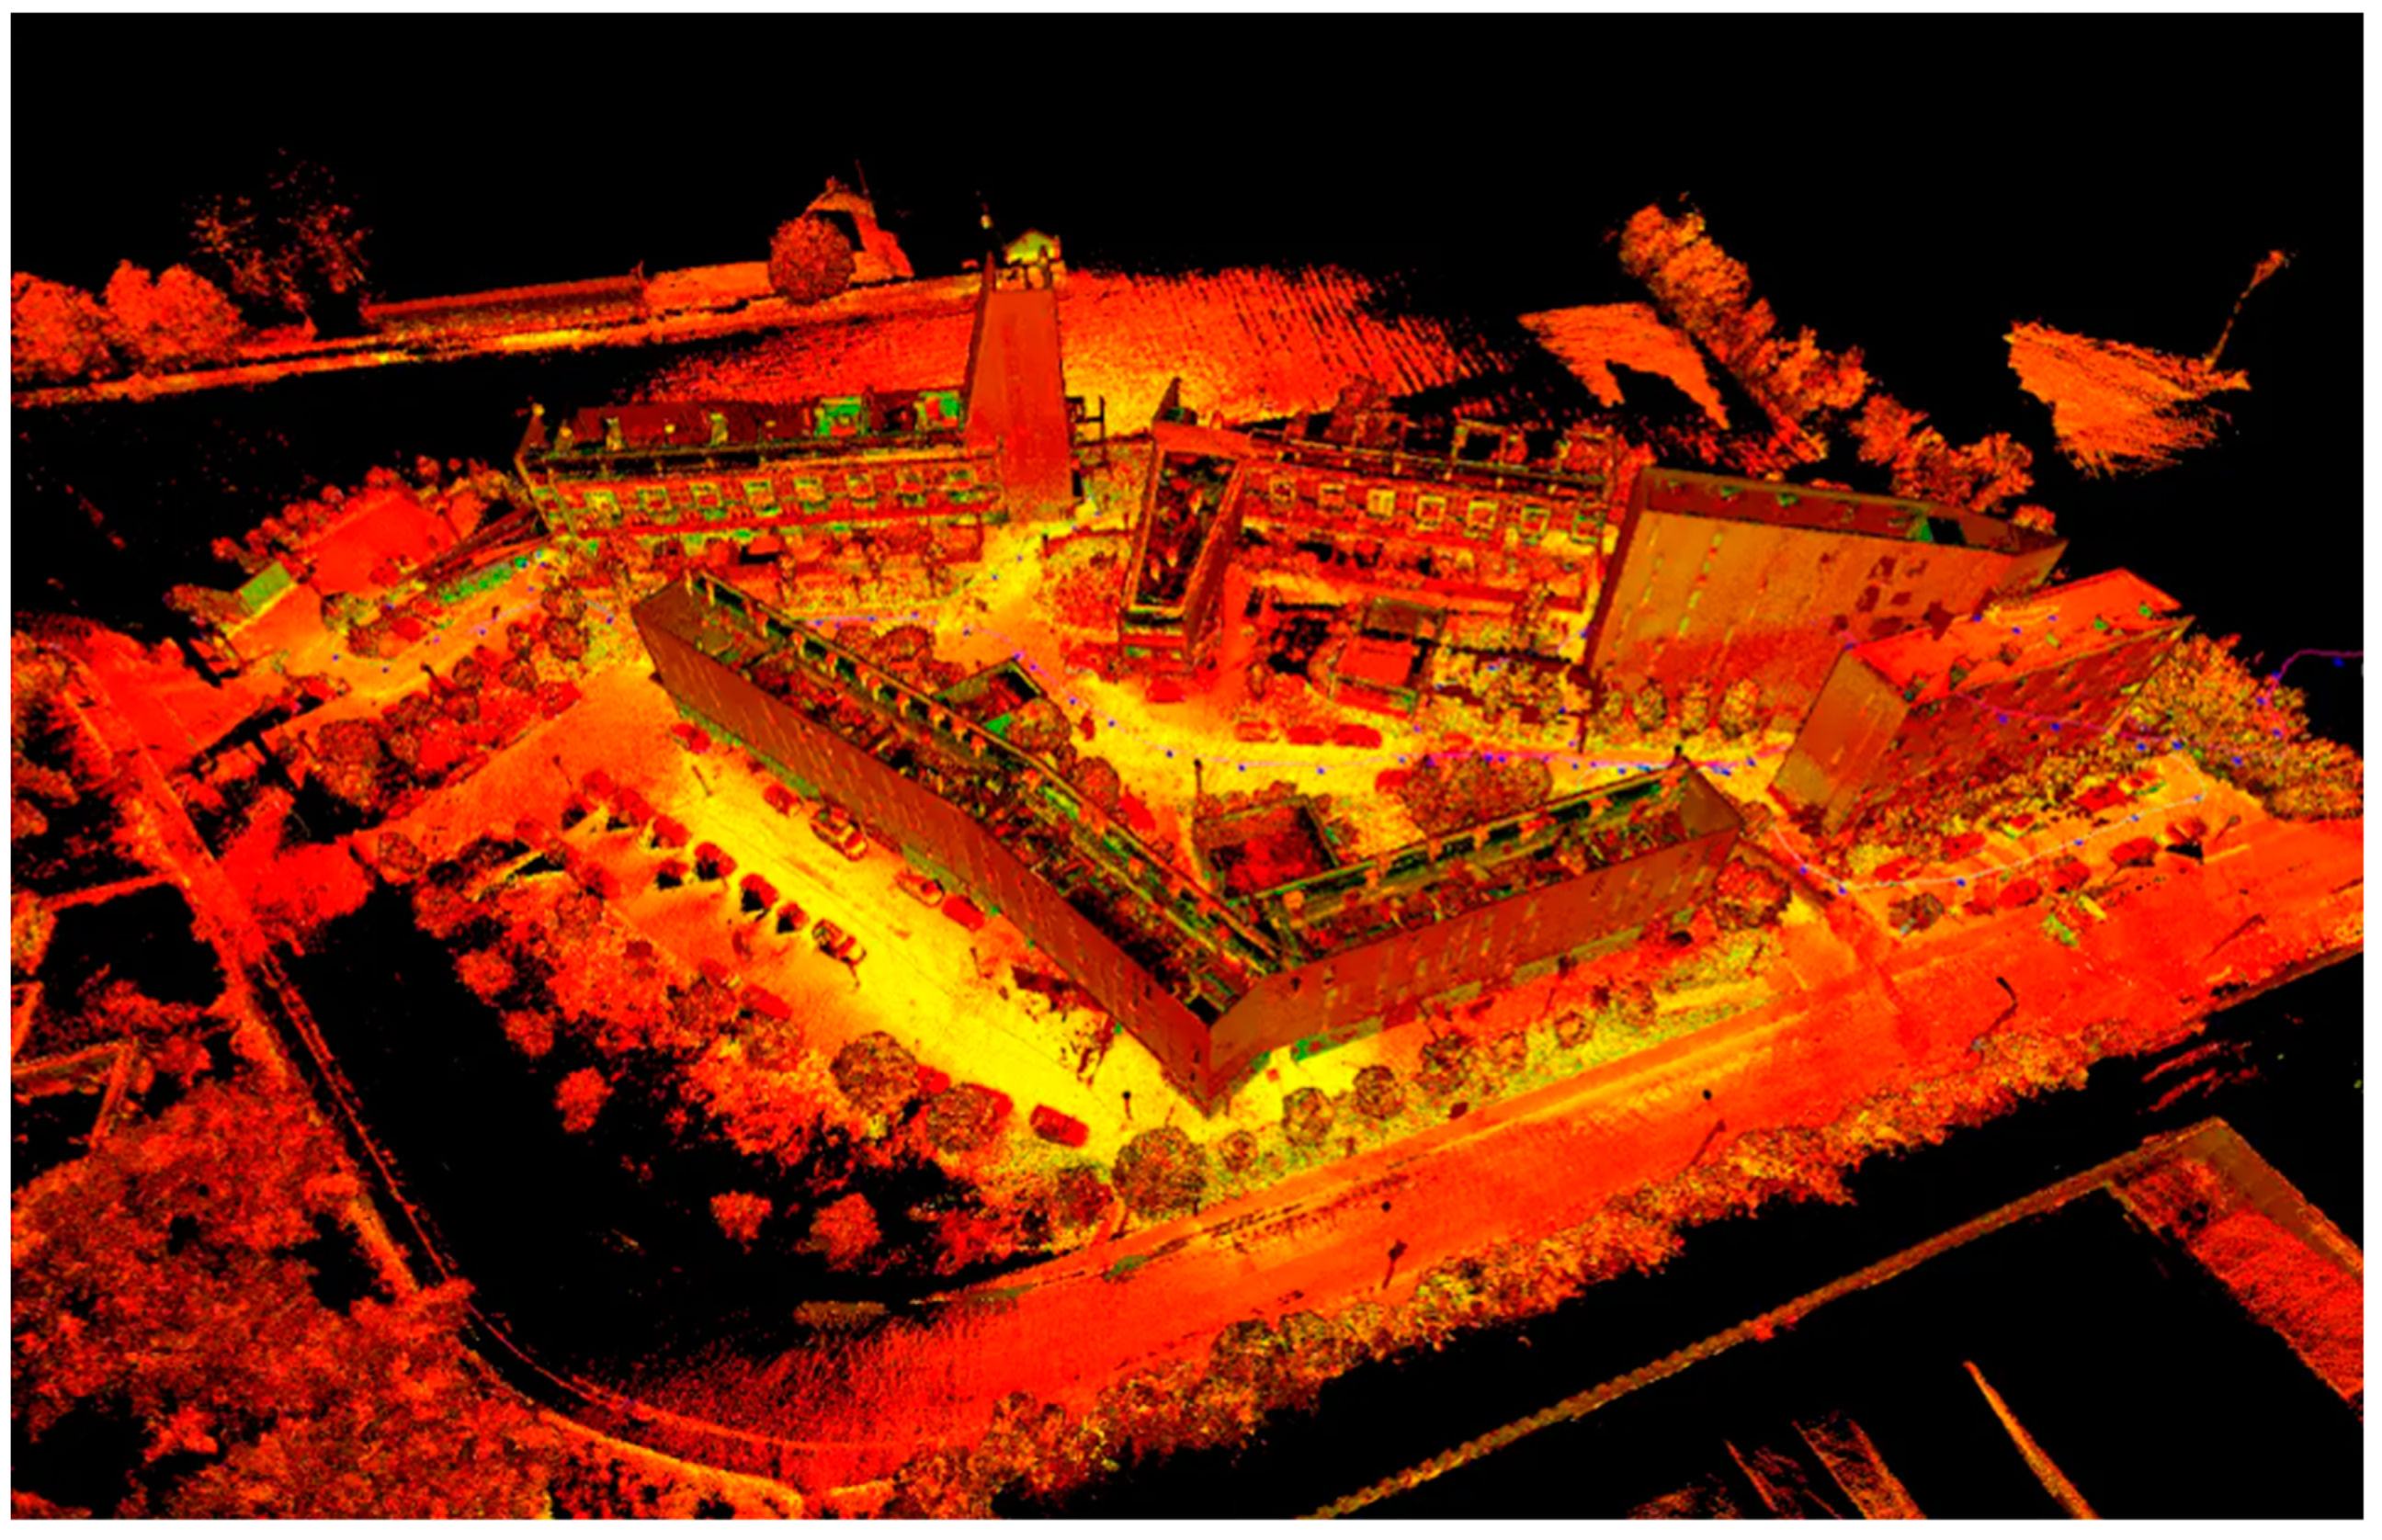
  • Enable the acquisition of a three-dimensional point cloud model of the buildings to facilitate the future use of automatic self-location applications. Define an online platform for the exchange of three-dimensional and photographic data.

3.2. Project Technical Specifications

Taking into account the provided details, a list of survey criteria was created to be accomplished:
  • To identify all necessary assets and categorize them into several classifications such as rooms, staircases, public areas, external pathways, and technical rooms;
  • To facilitate centimeter-level local measurements;
  • To disseminate the survey results on the cloud as a virtual tour, enabling MM technical staff to identify the assets and populate the database;
  • Point Clouds and RGB data must be stored on a server without utilizing proprietary formats, but using open formats as E57, JPG, TIFF, or LAS;
  • A quality assurance mechanism must be established to facilitate real-time quality monitoring of the survey.
  • To provide a 3D point cloud model in the way to allow to run innovative autolocalization systems based on the matching between point cloud and images taken from a camera carried by the operators

3.3. Characteristics of the Instrument and of the Surveying Methodology for the 3D Survey of the Buildings

To carry out the building’s 3D Capture activity and complete the task outlined in the previous paragraphs, it was decided to use an indoor mapping system based on SLAM technology and multibeam Lidar sensors, capable of providing a 3D model of surroundings with synchronized and calibrated high resolution panoramic images. Nevertheless, the selection process was focused on systems that possessed high-quality photographic acquisition capabilities. This was necessary to facilitate the identification of assets and items in the common areas of the structures through the examination of the spherical images captured by the systems.

4. Instrument Used in Milan and Specific Mapping Approach Solution Applied to the Case Study

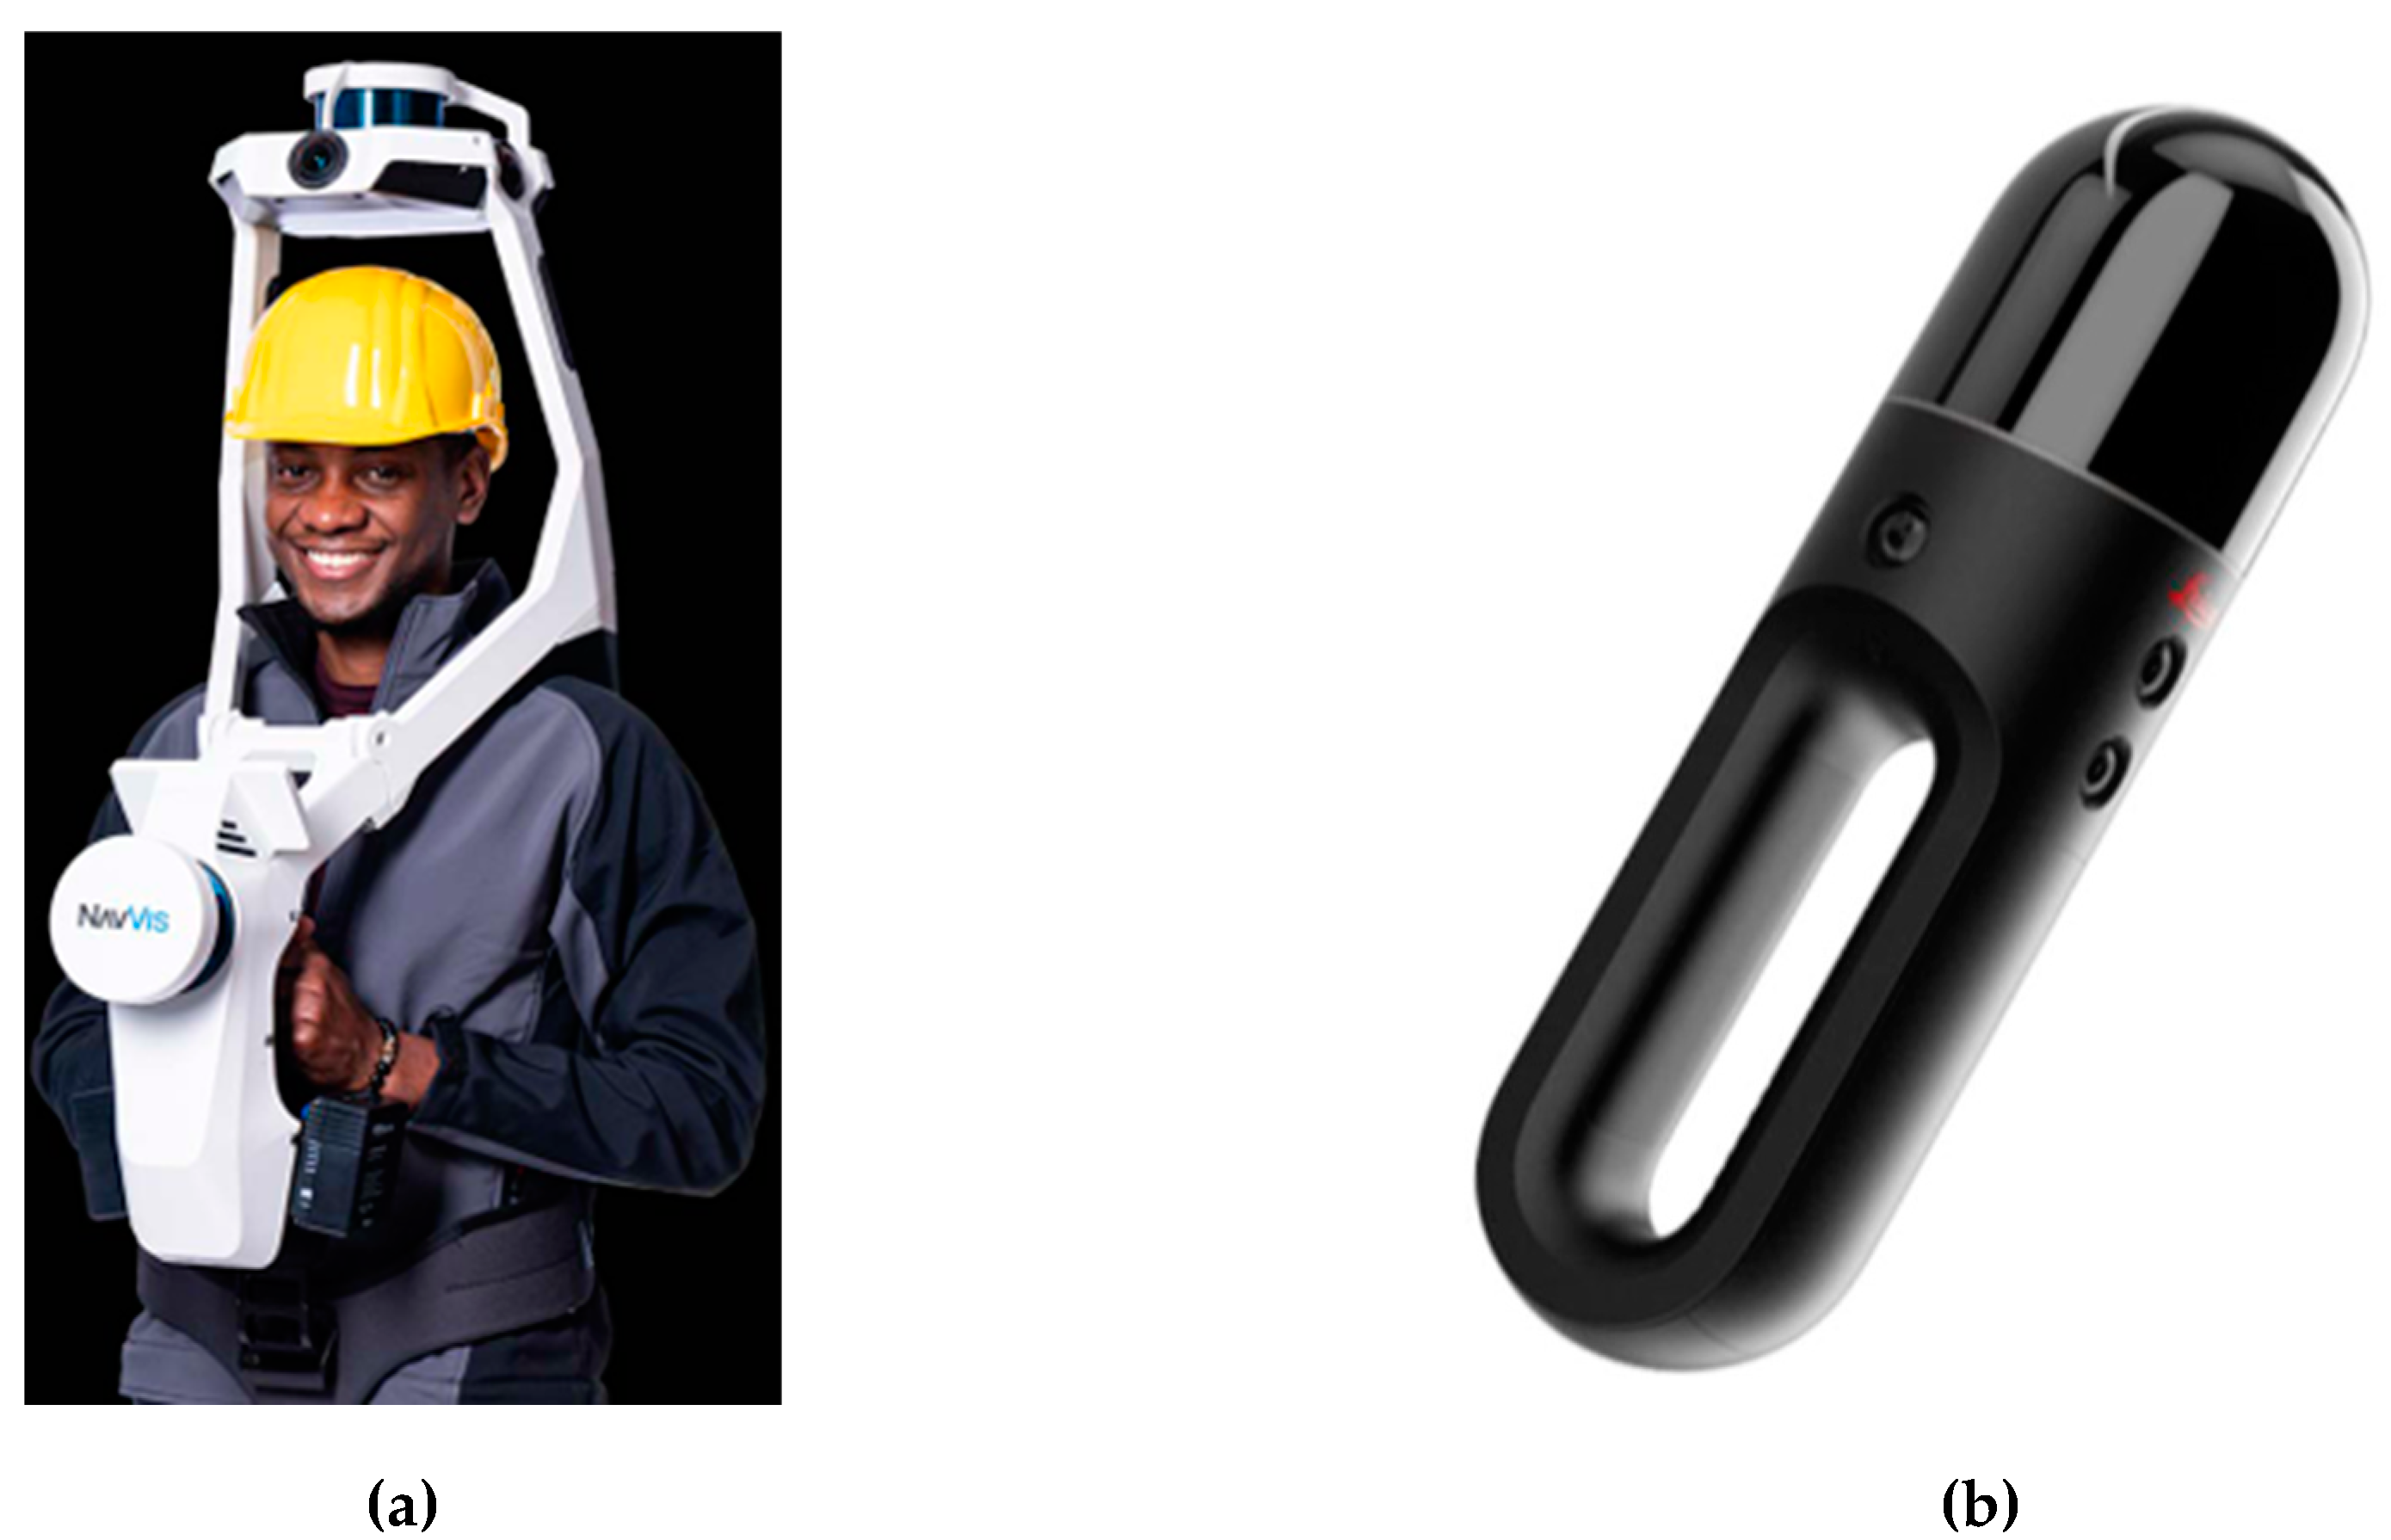
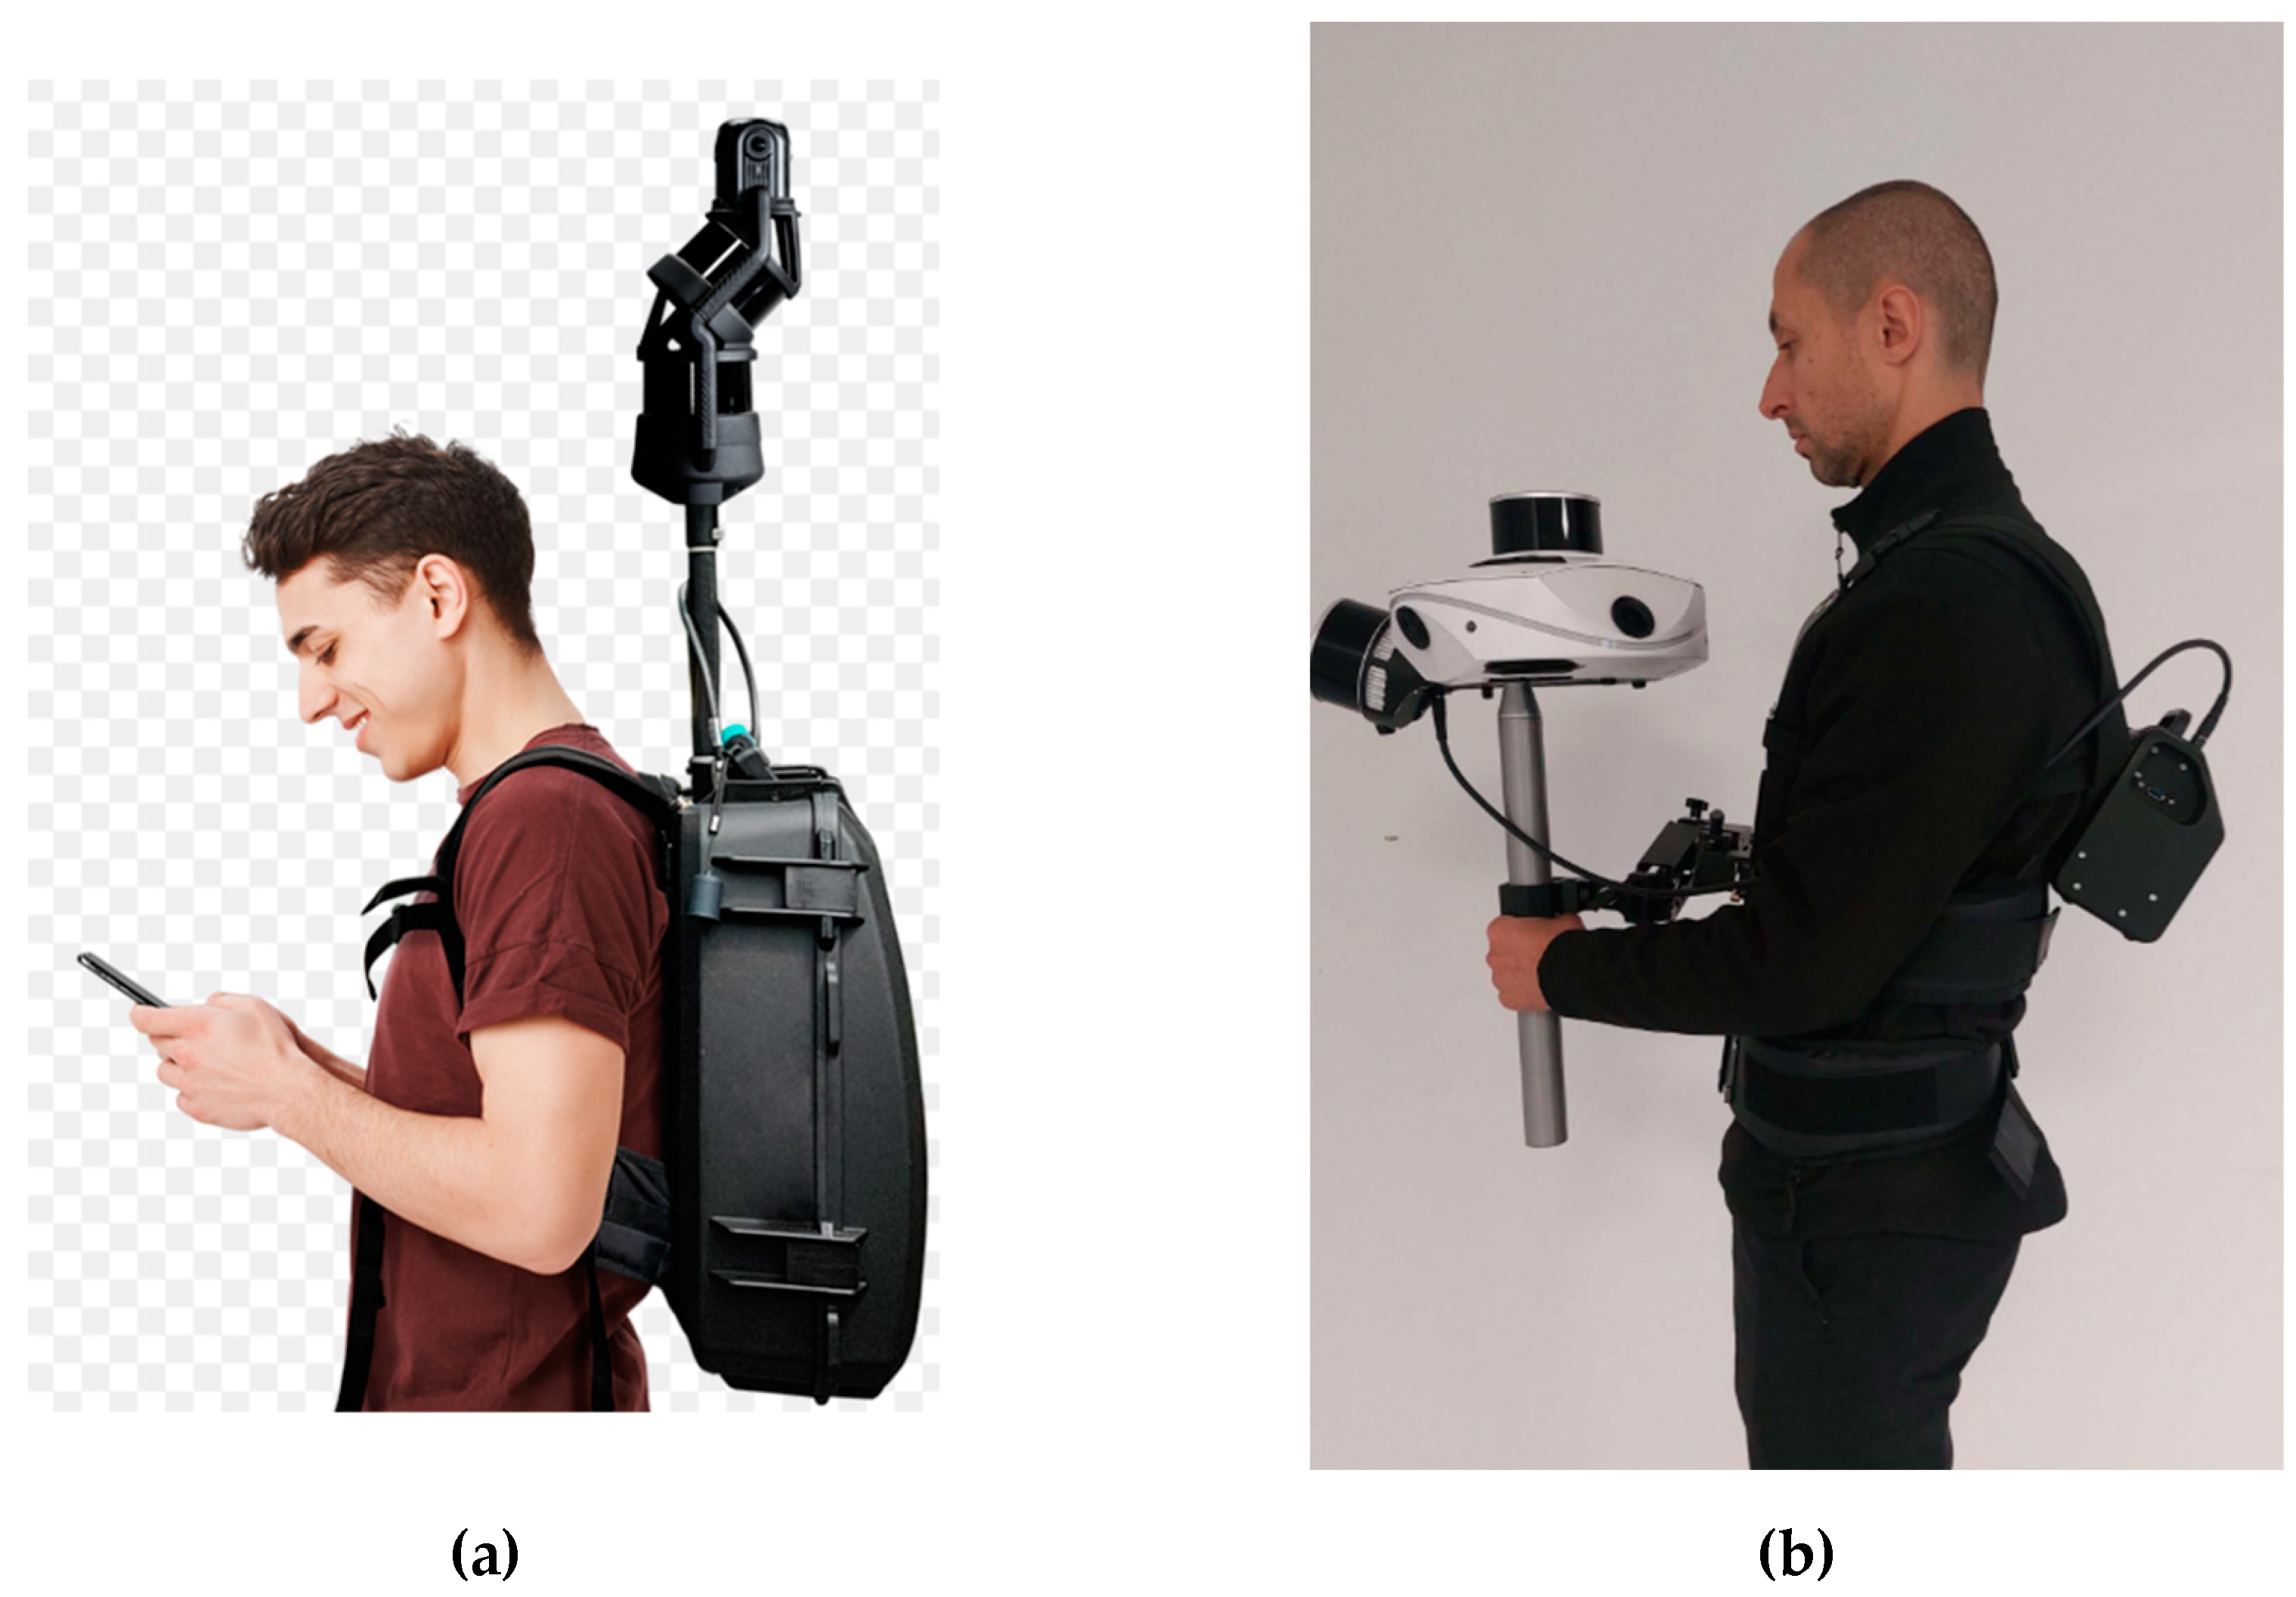
4.1. Heron Backpack – Mobile Mapping System

The Heron MS Twin Colour mapping system, produced by Gexcel, has been utilized in the project [89]. The producer offers various versions of the instrument. The main version adopted in the project (2021-2022 version) includes a smart controller that incorporates the device’s intelligence and a compact battery pack. The capture head is composed by an IMU, two lidar sensors (Velodyne 16-line multibeam) [47] [90], and a panoramic camera composed by 2 lens, which can concurrently acquire RGB video at 24 Hz with 4K resolution (for point cloud colorization) or high-quality 5K RGB photos upon request (to support 360° virtual tours).
Figure 9. (a) The capture head of the Heron device; (b) Velodyne VLP-16 rotative LiDAR sensor
Preprints 150090 g009
At the conclusion of the survey operations, the acquired data, which consist of LiDAR measurements, IMU measurements and panoramic images, are processed for individual trajectories. This activity is carried out through the Heron Desktop application [91] supplied with the instrument, which allows processing the raw data acquired and applying a patented SLAM algorithm allows estimating the instrument trajectory. The procedure utilizes IMU data to ascertain the sensor’s approximate location and spatial orientation. This is further enhanced by a registration process employing the renowned Iterative Closest Point (ICP) technique to align each point cloud (a singular 360° scan) with its predecessors. The processing workflow follows three main steps: odometer, local maps and global optimization.
Figure 10. Data processing workflow: (1) Odometer: The LiDAR point clouds are sequentially aligned to compute the geometric SLAM trajectory; (2) Local Map: The trajectory is organized into segments, and the associated point clouds are aggregated in the so called local maps; (3) Global Optimization: The local maps are interconnected through a bundle adjustment process to minimise residual drifts.
Preprints 150090 g010
The odometer step consists of calculating an initial estimate of the trajectory, followed by the instrument during the survey.
The initial trajectory estimate is obtained using a geometric SLAM algorithm, and this result is simultaneously compared with the IMU estimate to provide a co-evaluation of both: convergence between the two methods is indicated by green coloring.
The second step, local maps, is a way of segmenting the point cloud, previously represented as a continuous acquisition, into data chunks generated by dividing the acquisition trajectory into chunks of defined length.
The local map representation creates rigid groups of points that can be aligned during the global optimization phase. “3D local maps,” subdivides the surveyed point clouds into sectors (Figure 11) such as were static scans acquired, at a generation distance defined according to the geometries of the surveyed environments.
The aim of this final operation is to refine the estimated trajectory, allowing some flexibility in the alignment of individual data chunks within it to compensate for sensor drift. For surveys that consisted of multiple acquisitions, manual connections between local maps were used to connect the roof, the exterior and the ground floor together, and then the entire network of connections between local maps was optimized, a process that reduces the error between local maps through iterations that find the best fit between point clouds. Figure 12 shows views of the 3D network of connections between local maps during the global optimization process.
Each colored dot represents a local map, i.e., a point cloud, a part of the acquisition that can be freely adjusted in position during the optimization process (the dot is placed at the center of mass of the local map). Each blue line represents an iterative best-fit constraint between two overlapping local maps. The entire global optimization results in an optimized estimate of the survey trajectories. In the case of low overlap and point matching, no connections between local maps are added. This approach avoids the restriction, often present in SLAM tools, that the survey start position must coincide with the survey end position [92,93,94,95].
If, as designed in the survey phase, the survey paths have limited areas of overlap between trajectories, the algorithms present in Heron Desktop allow the trajectories to be merged. This makes it possible to generate a single point cloud, with associated spherical images, for the entire complex. This activity requires good experience and expertise on the part of the operators. The final point cloud with the corresponding spherical images are part of the final delivery of the survey. The mobile mapping device and the Heron Desktop processing software can also use point cloud data acquired by other instruments to support the acquisition or processing phase. This is done by loading the external point cloud into the memory of the system during real-time acquisition or into the software during post-processing. The sensors have a nominal accuracy of ± 3 cm, attributable to the nominal accuracy of the Velodyne VLP 16 sensors adopted [96]. Enhanced local accuracy can be achieved via Hesai 32-line sensors (Figure 13) [97], which have a nominal range precision of 5 mm (1 σ) and a accuracy of ± 1 cm. These sensors have been recently introduced in the Heron device by the manufacturer Gexcel.
The methods that have been implemented to guarantee adherence to MM requirements are outlined below. According to the project’s significant innovation, the technical specifications were delineated through execution of a prototype project conducted prior to the commencement of the survey operations, on a complex of buildings. This facilitated the development of methods for field surveying, data processing, and the evaluation of ongoing activities.

4.2. Accuracy of the Survey with iMMS for Geospatial Applications

It is essential to clearly establish that the level of accuracy required in the project, is defined in the way to prevent errors in item recognition and misallocation of assets to inappropriate areas of the building. Basically, the SLAM survey is aimed at enabling the recognition of the geometries of the different sections or components of a building with the goal of locating within it the assets present, which should be reachable through a virtual tour with transitions between congruent spherical views, and geometrically located within the relative room (height of a switch relative to the floor level, width of a door, distance between the edge of a window and the adjacent edge of the room). So a virtual tour that also has a global three-dimensional geometric representation, but whose accuracy characteristics are not the primary objective, which if pursued would require a rigorous topographical approach that is unmanageable due to the cost and investment of asset mapping projects. In general, the accuracy of a SLAM survey with an asset management objective must first ensure the local congruence of the three-dimensional representation.
Indeed, if some areas of buildings are present in three-dimensional views acquired by surveyors at different instants, or following intersecting survey paths, these detections must be congruent. So special attention must be paid in the local relative accuracy between different acquisitions, rather, as is customary in classical topographic surveys, in global topographic accuracy. In fact the global accuracy of the model of a large area diminished as a result of the SLAM based real-time method’s tendency to drift along long paths. That is why the final point cloud of the environment is established through an off-line post-processing procedure that is executed using the Heron Desktop software, which employs a comprehensive SLAM approach. The 3D map is generated by utilizing all the measurements collected throughout the survey.
Figure 15. Example of a 3D point cloud model of a complex of buildings in Milan.
Preprints 150090 g015
This involves a global registration of all the scans, which minimizes misalignment errors among the clouds and closes any loops in the trajectory. Unfortunately a good global accuracy, to be guaranteed, as before stated, requires topographic framing operations and time-consuming data processing, which are incompatible with the costs of an expeditious survey. For the reasons, the local relative accuracy required between overlapping acquisitions, can also be very high, i.e., of the order of 2 to 5 cm, while the global accuracy have been limited to an order of 10 to 20 cm, i.e., of the order of magnitude of a SLAM survey in the absence of topographic geometric constraints. Anyway we have to remember that the performance of the SLAM algorithms can be significantly impacted by the geometric characteristics of the surveillance area and by the presence of closed loops on the surveying trajectories.

4.3. Possible Improvements of the Global Accuracy

In order to keep the deviations cited in paragraph 4.2 under control, the post-processing software of the data acquired with Heron, i.e., the Heron Desktop software, allows, before generating the point cloud, to insert control points or control scans (i.e., georeferenced point clouds that are part of portions of static scans). However, such an approach would have required defining a control topographic network for each building complex, going more than double the survey costs. One approach that is generally employed in SLAM systems to contain the drifts of surveying trajectory estimation is the mentioned one of performing closed-loop survey geometries. This fact would have been a sensitive constraint for building surveying activities, forcing, for example, surveying the stairs of a building, up and down, i.e., 2 times.

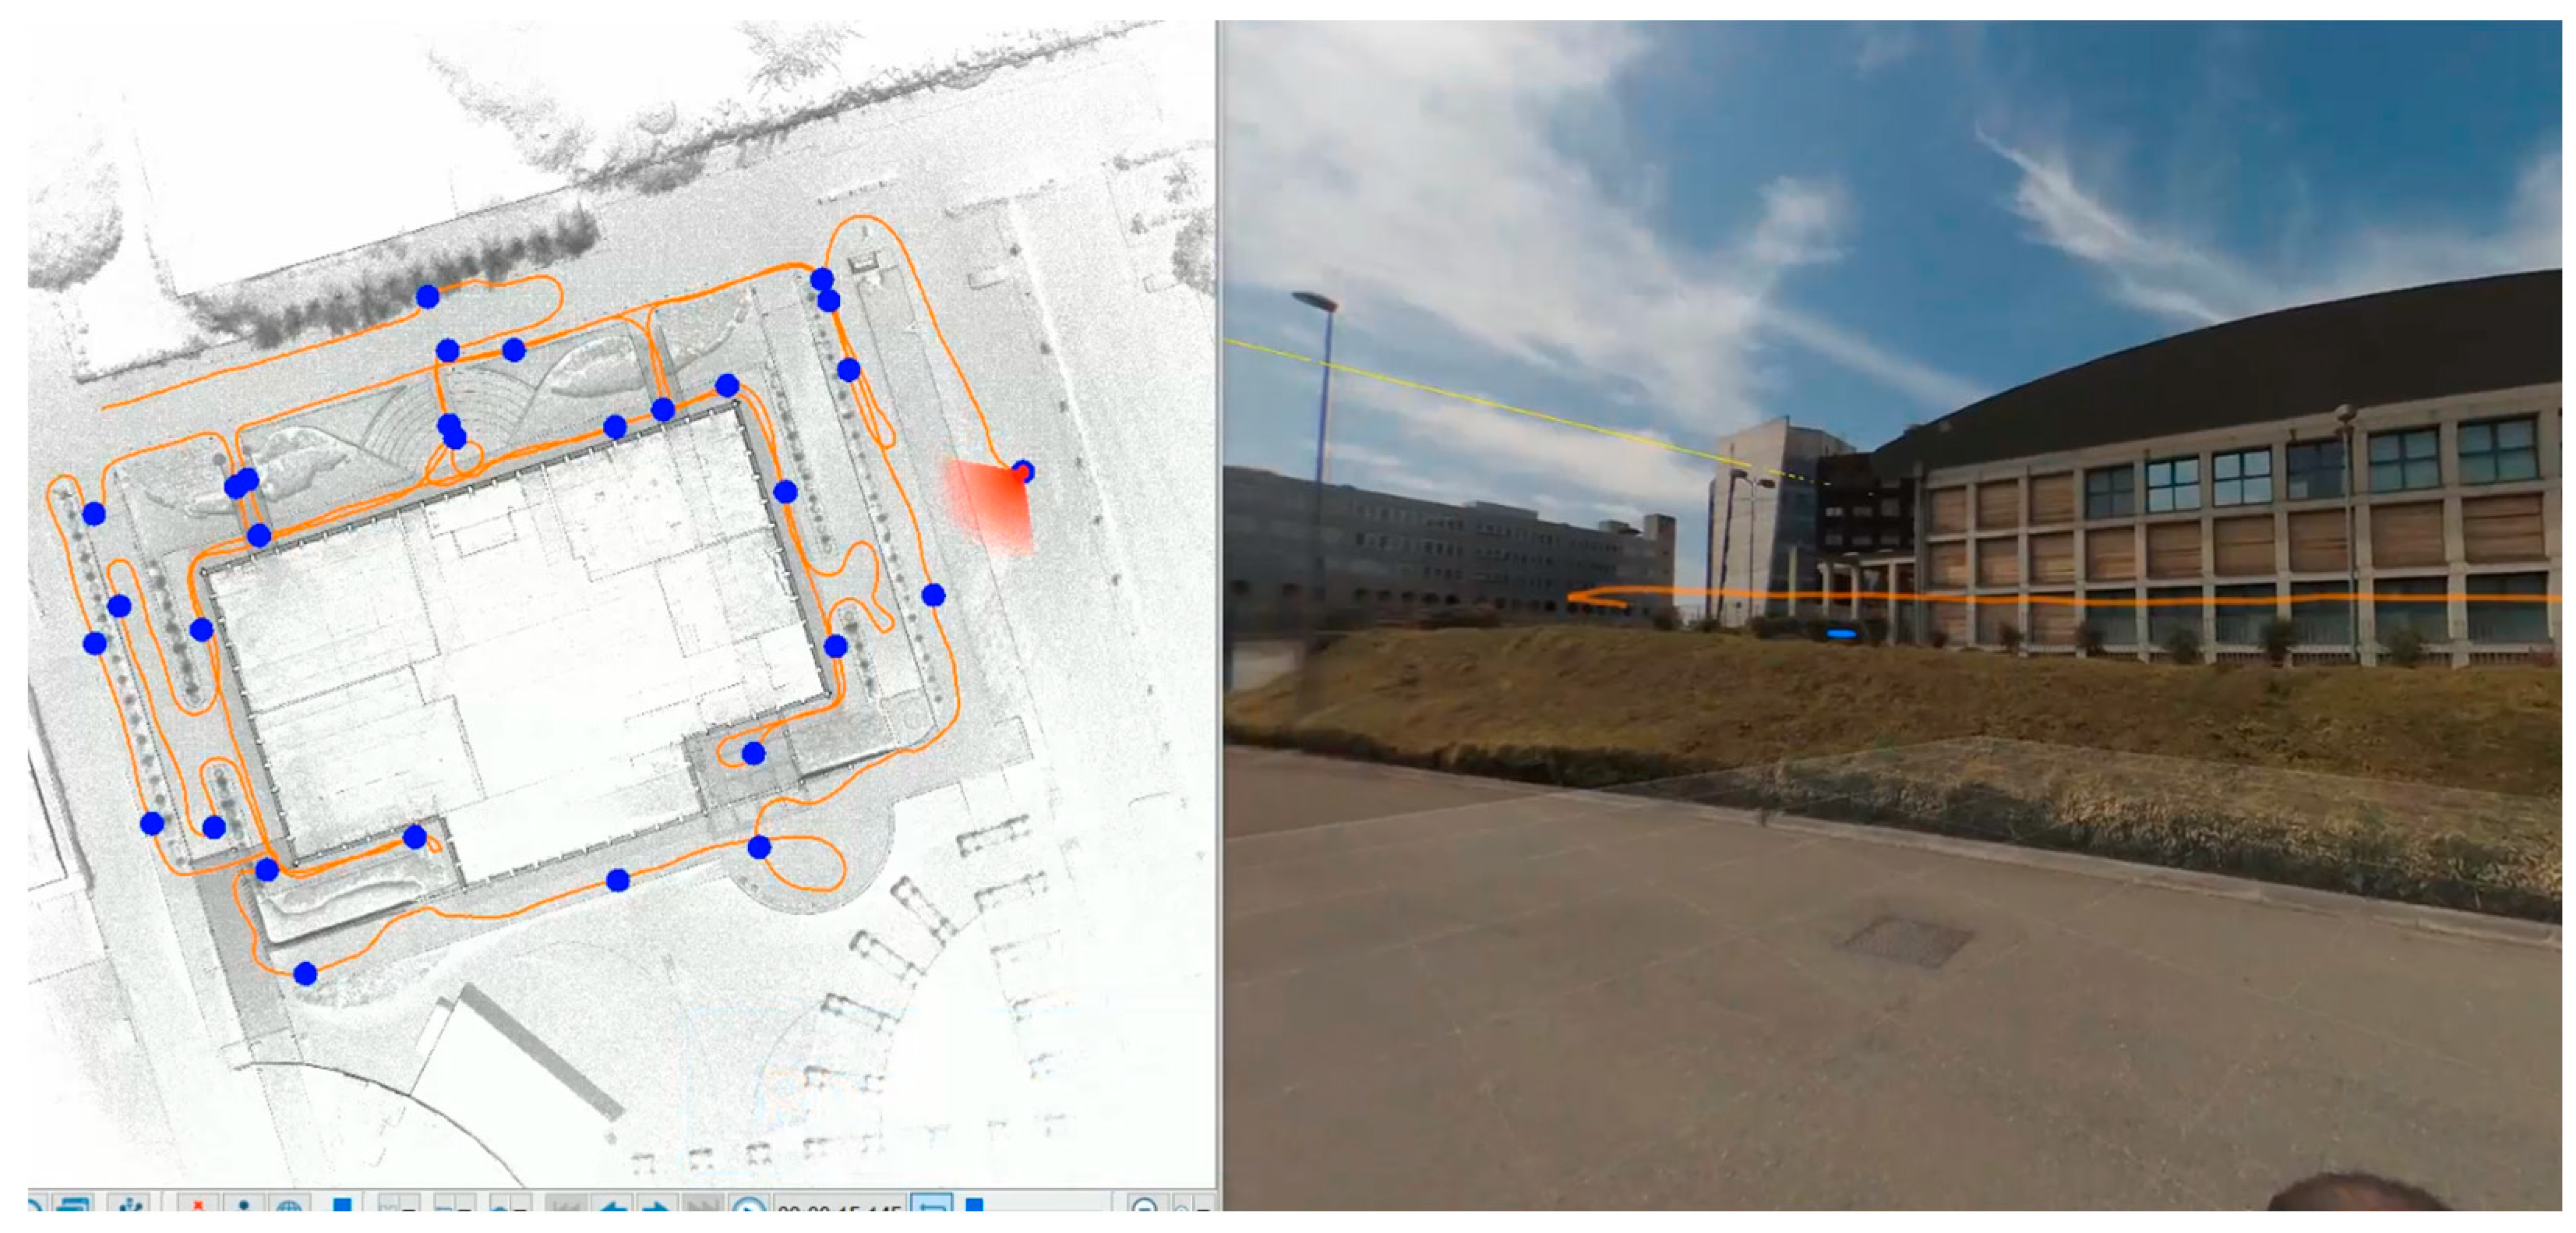
4.4. Surveying Trajectory Organization

In a survey with Heron SLAM instrumentation, trajectory crossing is frequently suggested for improving the robustness and accuracy of the resulting three-dimensional point cloud model, as shown in Figure 16.
In fact, the post-processing algorithm in the Heron Desktop software, provided in conjunction with Heron for post-processing with SLAM algorithm, allows the link between surveys performed with crossed trajectories to be strengthened through a patented approach called the Virtual Scans approach. For the geospatial applications addressed here, if the goal is the recognition of assets from images and their relative localization with respect to the surveyed environments, each overlapping of trajectories is a source of potential difficulties in object recognition, for double imaging of the same element and a source of the possibility of difficulties in navigation and object recognition/positioning. In fact, if within a virtual tour there is no continuity in spherical views, it is possible both to get lost in navigation and to fail to perform the operation of unambiguous recognition and location of assets. So in these activities, crossing of trajectories should theoretically be avoided as much as possible. However, thanks to Heron Desktop’s patented algorithm, trajectory crossing allows for a hardening between geometries and spherical views and thus automatically allows for congruence between spherical views and three-dimensional models acquired from different paths that occasionally cross. Where interferences/overlaps between trajectories are planned, it is necessary for the union of the surveyed model to perform a fusion of the overlapping detection paths, thus reducing to a minimum the gaps between the trajectories and therefore between the pixels of the acquired images.

4.5. Quality and Use of Pictures

In surveys with geospatial goals, the photographic component of the survey plays a critically important role, as it is from this information that operators can recognize assets and populate the asset management DB. Indeed, MM technicians must be able to navigate via virtual tours through the routes and recognize the details required to populate the rich DB. An important component that determined the choice of the Heron system, therefore, was the quality of the image and its resolution, appropriately tailored to the needs of the project. Considering that the surveys take place mostly inside the buildings and in any case very close to the body of the building, it was considered sufficient that the resolution of the RGB images be greater than or on the order of 5K, and much importance was given to the overall quality of the images, which should not be blurred, dark or over/under exposed. Indeed, the quality of an image is often confused with its mere resolution. Therefore, the characteristics of the images had to be such that the technicians could recognize, from the photos, the items, the assets present in the mapped areas, and in particular the attributes associated with them. In the case of the Milan project, the company that won the contract was required to have iMMS systems equipped with lighting to ensure image quality even for measurements taken in the evening hours or in low-light conditions. For more specific details, such as names in intercoms, rather than the technical identification plates of machinery in building thermal power plants, the possibility of associating as an integrative document the photograph acquired with an external device (smart phone, PDA, tablet) and associated as an attribute to the surveyed asset is provided. Obviously, a mobile system with higher photographic resolutions would have made it possible to avoid such procedures. A system capable of acquiring very high resolution images, however, would require the mobile system to have simultaneously large computing, data management and storage capabilities capable of handling the high resolution acquired in the field. However, this implies (as already stated in paragraph 2) that as a result the instrument has high power consumption and therefore requires having a good-sized battery pack on board. All this leads to larger system footprint and greater weight of the instrumentation, details that make it less flexible and easy to use the instrument in articulated and complex spaces with numerous scales as the case of the Milan project requires.

4.6. Resolution and “Density” of the Images

Since, as mentioned, the HERON mobile mapping system allows images to be acquired at 24Hz frequency and 4K resolution rather than images at 5K resolution on demand. At the Milan Project it has been defined for each type of asset the mode of photographic acquisition to be performed. Recall that project’s goal is in fact to allow its technicians to navigate within the survey through a simple photo-to-photo approach, allowing even three-dimensional measurements to be made by operating directly on the spherical photos. In the technical specifications, therefore, it was detailed for surveying which items 4K photographic acquisition was deemed sufficient and for which items minimum 5K resolution was required. This was in order to minimize the weight of the survey files. In order to avoid splitting in image views, it is possible to filter the number of spherical images, so as to define a minimum spatial distance, below which spherical views are not displayed, so as to avoid excessive spatial overlap between adjacent spherical views. For Heron instrumentation such a function is present in the Reconstructor software (Figure 17) employed to export the spherical views associated with the point cloud.
Therefore, for the surveys in Milan, a 5k high-resolution photo acquisition was defined, with a relative distance between spherical image acquisitions of no less than 5 meters. In the case where on the contrary, images were acquired automatically and in low resolution by the system, during post-processing the images closer than 5 meters were removed, since 4K continuous resolution acquires a too large number of images. Thus, the goal was to manage a data acquisition limited to the needs of the project, as it is necessary to take into account that the management and recording of computer-heavy data is a major source of cost, both from the point of view of slowing down and burdening data processing, and in terms of storing and saving such data over time.

4.7. Anonymization

A critical factor related to 3D surveys even with synchronized photographic cameras is the fact that operating in environments open to the public or in the presence of the guests of such facilities ( residents, company employees, patients or staff of hospitals,...) the photographs go to document and observe faces of people, license plates of cars and other sensitive elements that numerous international and/or national regulations denied the right to be able to keep. Importantly, the ban does not only cover the dissemination of images of such person/objects, but also the preservation of such images. It is therefore necessary to activate processes in near real time, so that as soon as possible, during or at the conclusion of mapping operations, the images are processed in order to anonymize the sensitive elements present in the photographic sockets. In the case of the Milan project, this procedure has not been implemented since the images acquired are only functional for asset recognition and in no way shared or disseminated outside the operational chain of the project. However, effective software such as the platform is available that allows automatic anonymization of images acquired in the field, involving the anonymization of license plates, faces, bodies of people and vehicles.
Figure 18. Example of the results of an image anonymization realized by the Celantur Image and Video Anonymization software [98]
Preprints 150090 g018

5. Milan Project: Technical Specifications and Procedures to Enable the Work to Be of Quality

5.1. Organization of a Preventive Pilot Project

Given the complexity of the entire pipeline of work involving field surveying, processing of the surveyed data with iMMS, delivery of results to MM technicians, recognition of items, general testing of activities, sharing of data in the cloud, and storage of data, it is considered mandatory that for projects of this size, a preliminary phase of work should be carried out to allow for verification of the processes and technologies proposed. In particular, we detail what was carried out in the Milan project, but which we believe should be a general rule to be adopted in such types of activities:
  • Pilot Complex: prior to the start of work, a Pilot Complex has been defined in which data processing, testing technologies and processes are tested, together with the software platforms and hardware tools proposed;
  • Survey methods and procedures: the result of the agreed activities in the Pilot Complex is the definition of the survey methods and procedures.

5.2 Detection Modes and Procedures

Surveys using the SLAM approach are very sensitive of surveying dead times. As the operator moves along buildings of the complex, he contextually capture the reality around him. In order to optimize the field work activity, it is essential that the operator previously knows the path to follow, minimizing dead time. As many complexes are composed of several buildings as high as 6-7 levels, with paths connecting parking areas at ground level as well as underground, with entrances at multiple levels, defining the optimal route to be taken to map all spaces adequately is a program that has to be carried in advance, before starting the surveying process. In addition, access to buildings must be preceded by communication to residents, scheduling the opening of doors to carry out accesses and passages with the instrument, as well as entering areas and technical rooms usually precluded from access. The surveying activity must also not interfere with any active routine or extraordinary maintenance operations at the buildings as well as coordinate activities with the facility’s operations manager, who is in possession of the keys of all the areas and has detailed knowledge of the organization of spaces in the building complex.
Specifically from the organizational point of view for each of the complexes to be surveyed, the following procedures were defined and executed:
  • Survey and preparation of the corresponding section of the Operational Report;
  • Survey for data acquisition using innovative mobile mapping tools and preparation of the corresponding section of the Operational Report;
  • Processing of SLAM data and their structuring;
  • Final delivery of the survey by the Contractor and acceptance of the work.
  • Uploading of data to the cloud
  • Activity of recognizing assets in the data (images) loaded into the cloud

5.3. Site Inspection and Preparation of the Site and Operational Reports

To this purpose, it is evident that extensive professional surveying of large numbers of buildings, where time-use efficiencies of the instrument are critical for cost management, cannot afford to have the surveying activity scheduled in the field, without a prior inspection, by the surveyor. Therefore, it is necessary to organize survey activities, carried out by specialized operators, who give clear and detailed instructions to the surveyor about the routes to be followed for the survey, how to carry out the survey with respect to the difficulties of accessing the different spaces of the buildings and in order to avoid undesired crossing of trajectories. Namely, optimizing surveying paths and the timing of mapping in the field. It is also obvious that a survey performed with the correct paths, with respect to the subsequent post-processing data processing stage, significantly reduces computation time and the possibility of errors in trajectory computation and generation of the final point cloud.
One detail that may be underestimated in surveying large-scale real estate assets is the importance of this prior organization of which makes the files to be processed unnecessarily heavy.
  • Dynamic survey instrumentation has extreme productivity but simultaneously has high instrumentation and data processing costs. Therefore, the operator must be able to walk through building spaces quickly, without downtime, to decrease the incidence of instrumental costs in surveying large building complexes.
  • Mobile mapping systems acquire a large amount of data, in the form of three-dimensional data acquired by LiDAR sensors and images. While photographic data is usually acquired “on demand,” three-dimensional data is acquired continuously. So, an operator stopping any movement to decide where to proceed or to open a closed door causes a recording of unnecessary three-dimensional data;
  • Three-dimensional geometric surveying with iMMS, for geometric surveying purposes, redundancy of surveying in buildings is considered a merit that strengthens and makes the detected point cloud model more accurate. So, for such applications, the choice and definition of trajectories can also be field-defined, as a double pass in the same areas only results in a minimal loss of time but hardens the survey geometry. As described in previous paragraphs, in surveys with the purpose of stacking assets, managing multiple trajectories is not necessary and introduce just unnecessary computation time. So it is a good idea for the operator who is about to perform expeditious surveys to already have a plan or document that already shows him the optimal paths to follow minimizing survey time and unnecessary trajectory overlaps;
  • The demand for high productivity, also requires the surveyor to know the location in the building complex of certain elements that require special survey care, for example, such as the building’s thermal power plant, waste management room(s), any other technical rooms;
  • To enable simplifying and speeding up survey and post-processing activities, survey paths should be organized by short paths that have a sector in common with one or more survey trajectories of the same complex so that the Heron Desktop post-processing software provided with Heron can proceed to merge the surveyed models.
As mentioned in the previous paragraphs, it is also a good practice for the operator to already, during the survey, mark the association between photographic sockets and the naming of the spaces that are being surveyed (complex/building/stairs/level/corridor/room). In order to be able to carry out this operation, it is necessary that it is already aware in a general form of the conformation of the building complex to be surveyed. It is, of course, necessary that the iMMS system used be set up for such a tagging function. These needs, for extensive surveying operations, make an efficient operational organization essential. One possible solution, proven efficient in the Milan project, is the inclusion of a procedure whereby each building complex is associated with an initial survey with the drafting of a survey report and the drafting, at the conclusion of the survey, of an operational report The reports have as their ultimate goal that of planning and documenting the execution of survey activities in the field and of documenting any problems at the very act in which they arise, with a view to dealing with them in the immediate term.
Obviously as the object and complexes to be surveyed change, the forms and organization of these reports will vary contextually.

5.4. Operational Report

The operational report shows the results of the planning on the complex to be surveyed. The Contractor shall produce summary plans to support the surveyors’ activities and in particular:
  • Indicate the routes/trajectories to be followed in the survey phases, verifying in advance that these routes are accessible and arranging for the opening of usually closed can or gates. The routes are designed so as to make the survey as efficient as possible;
  • Indicate the location of technical and/or service rooms to be surveyed;
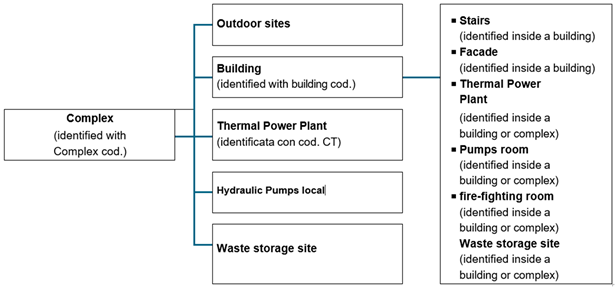
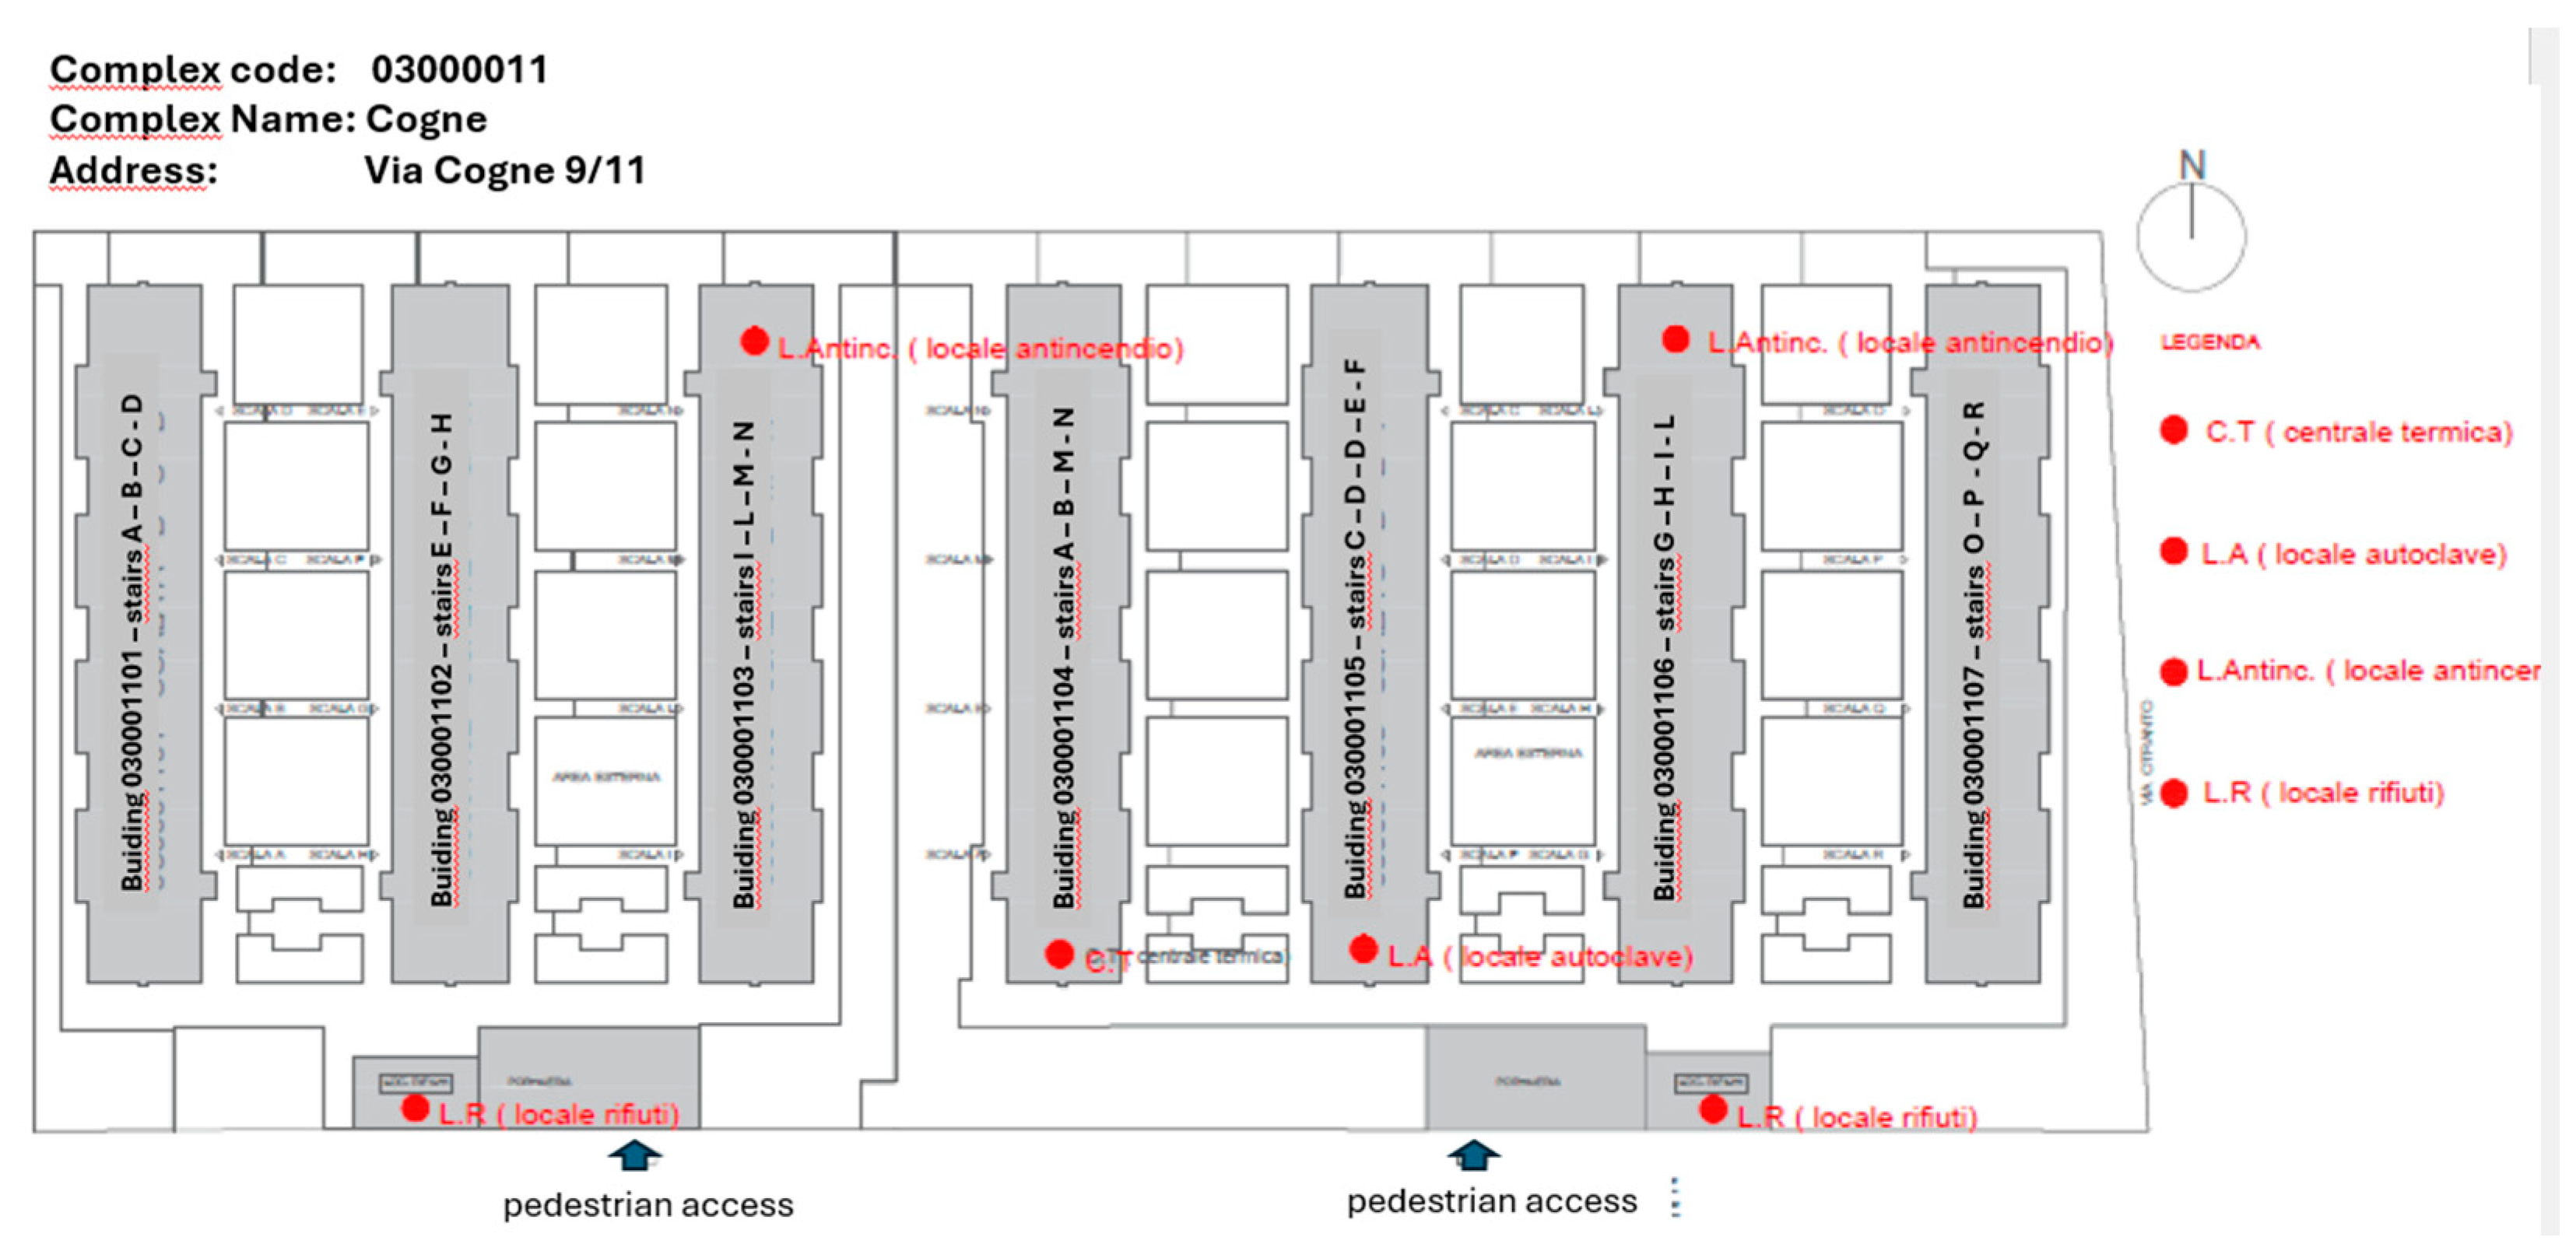
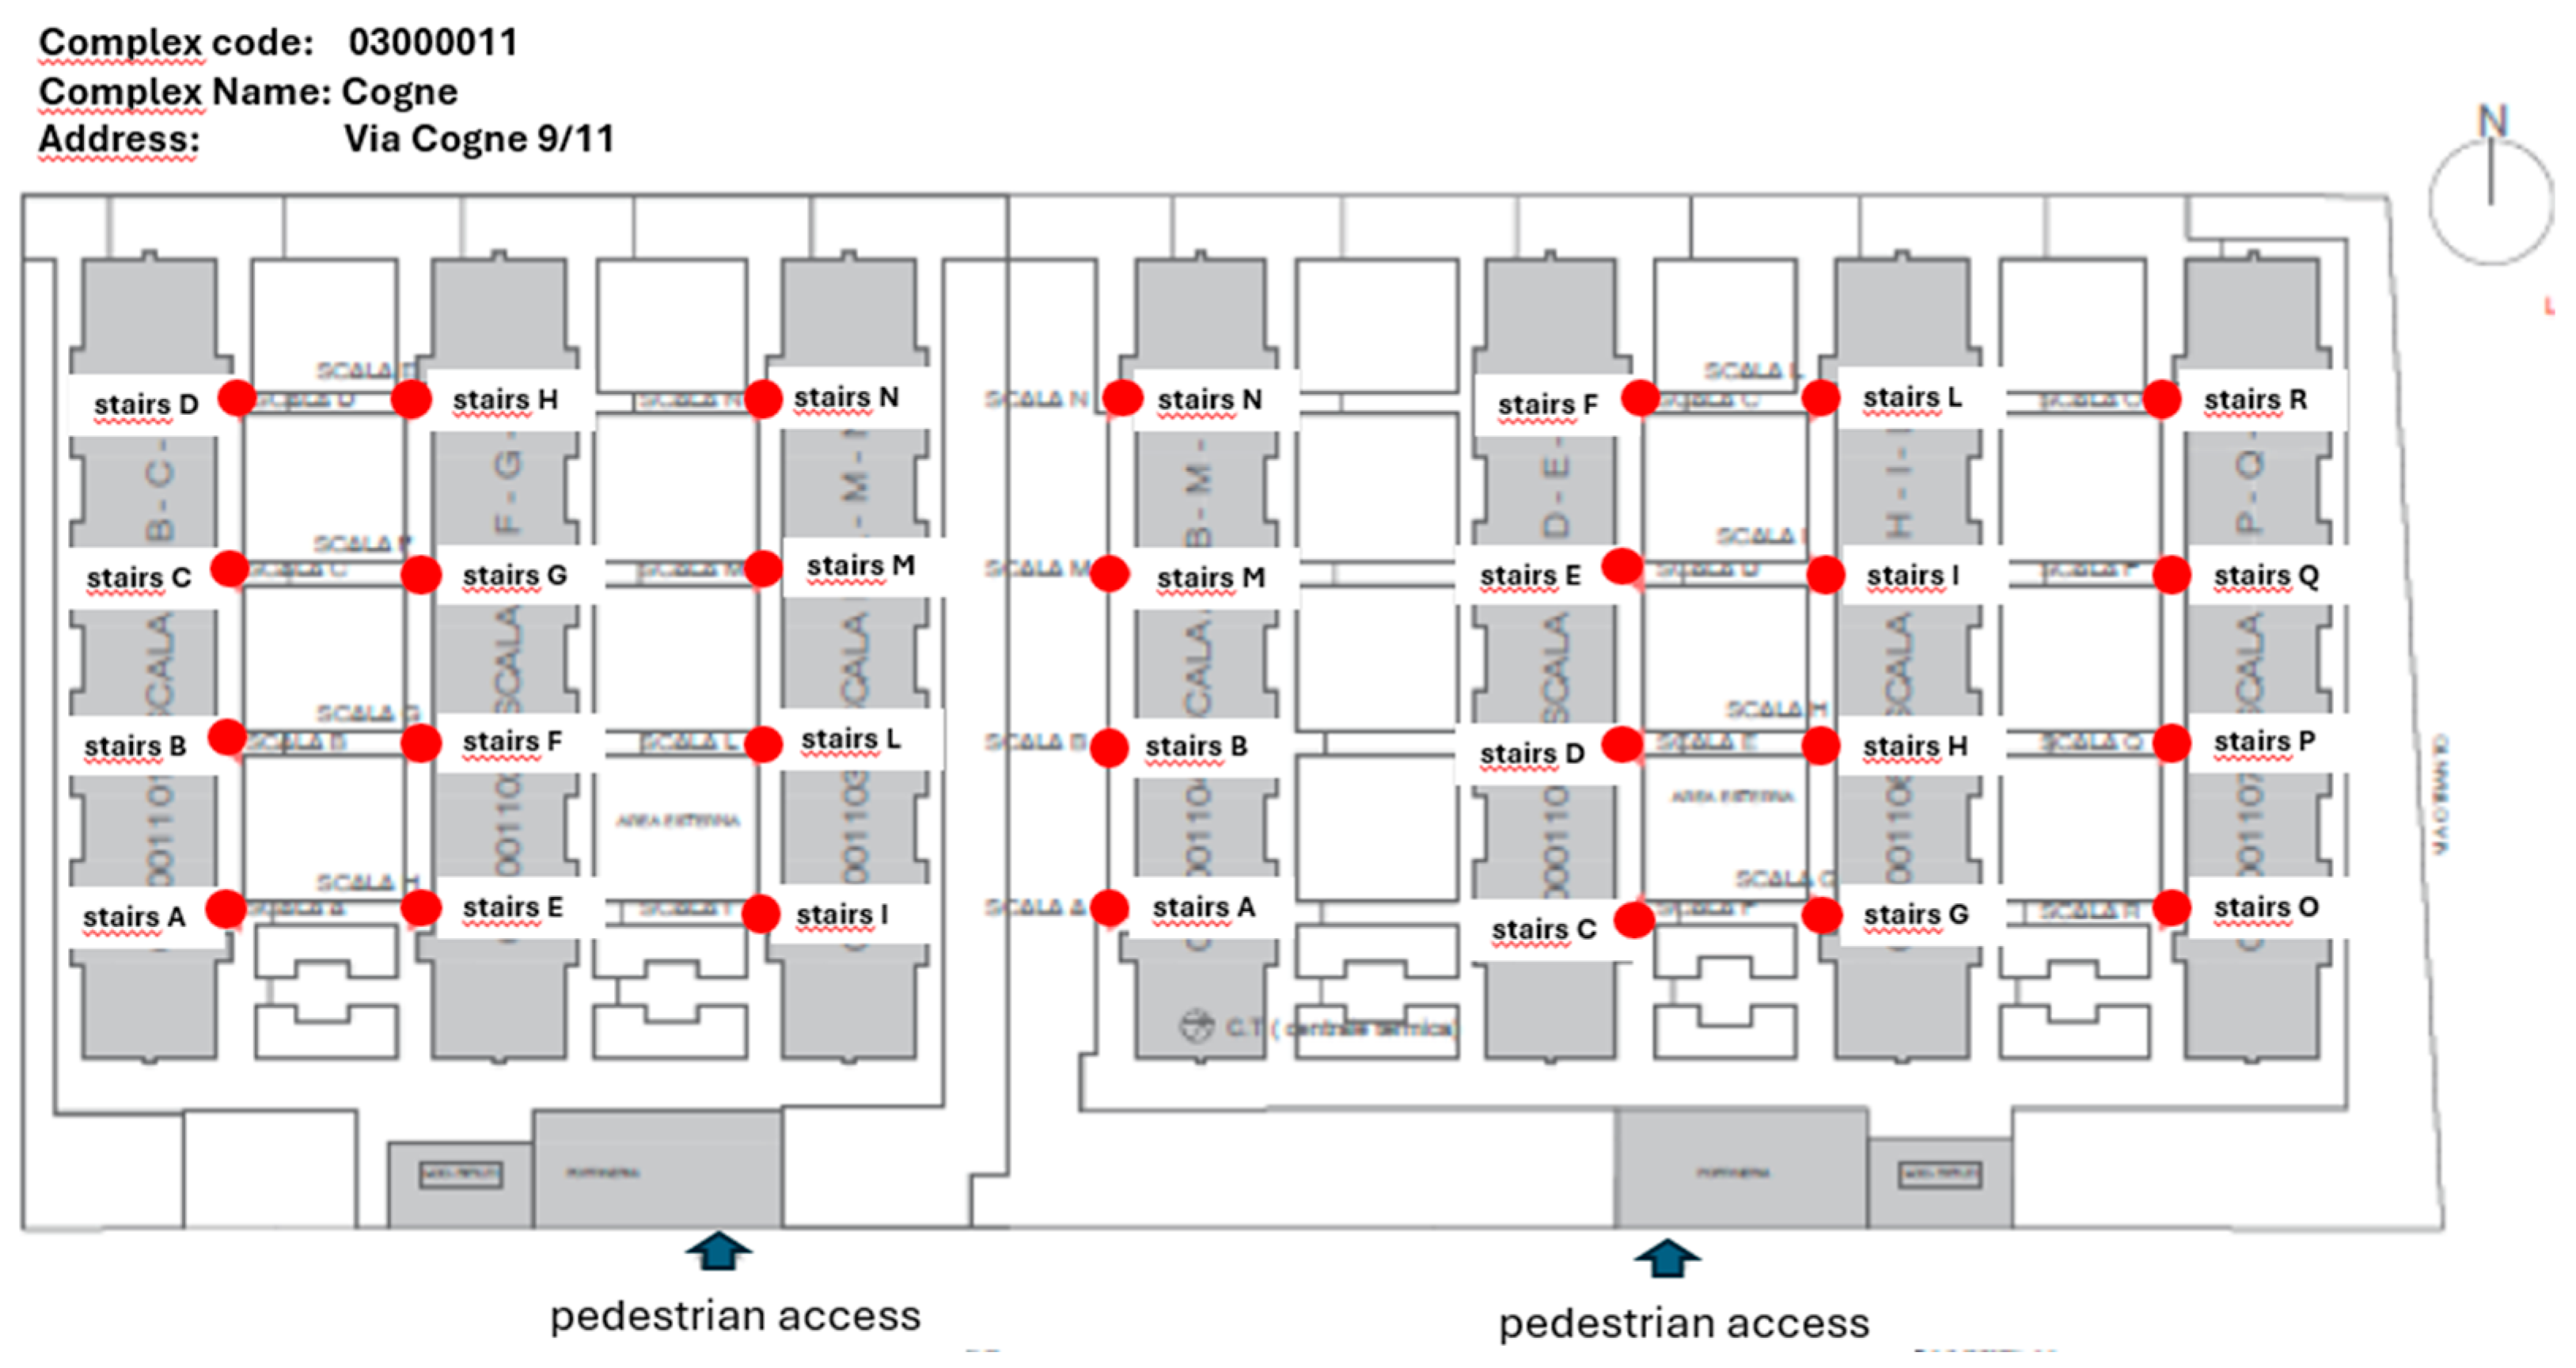
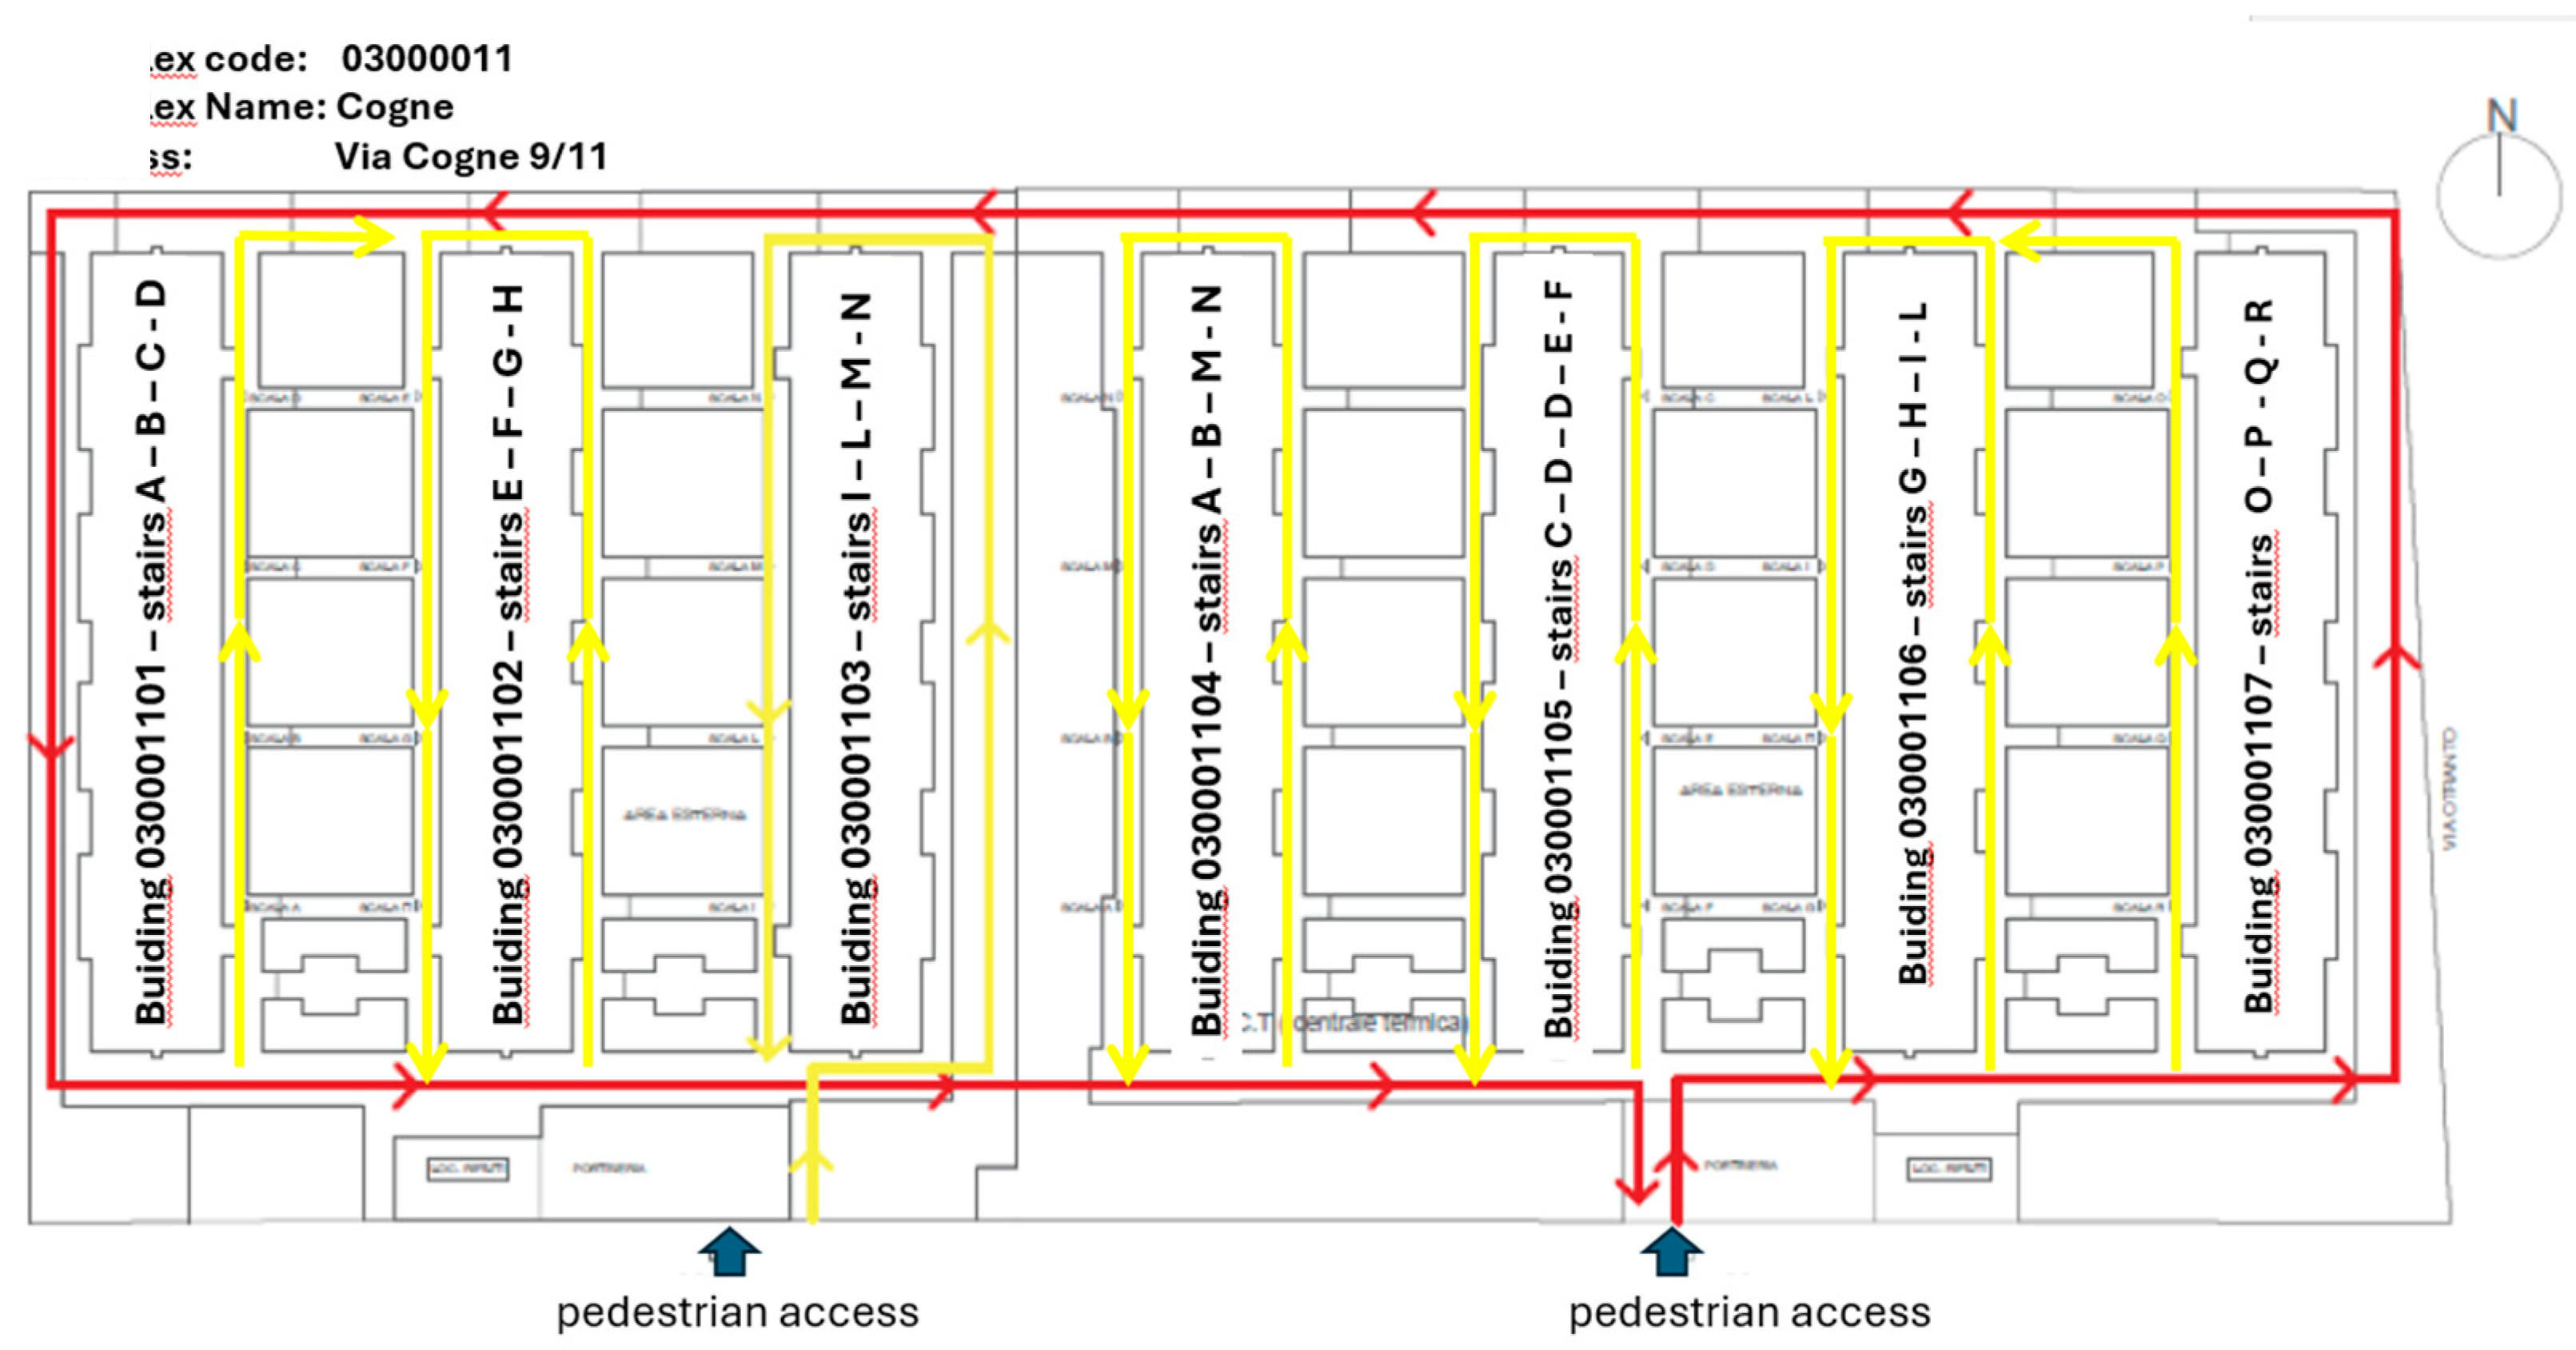
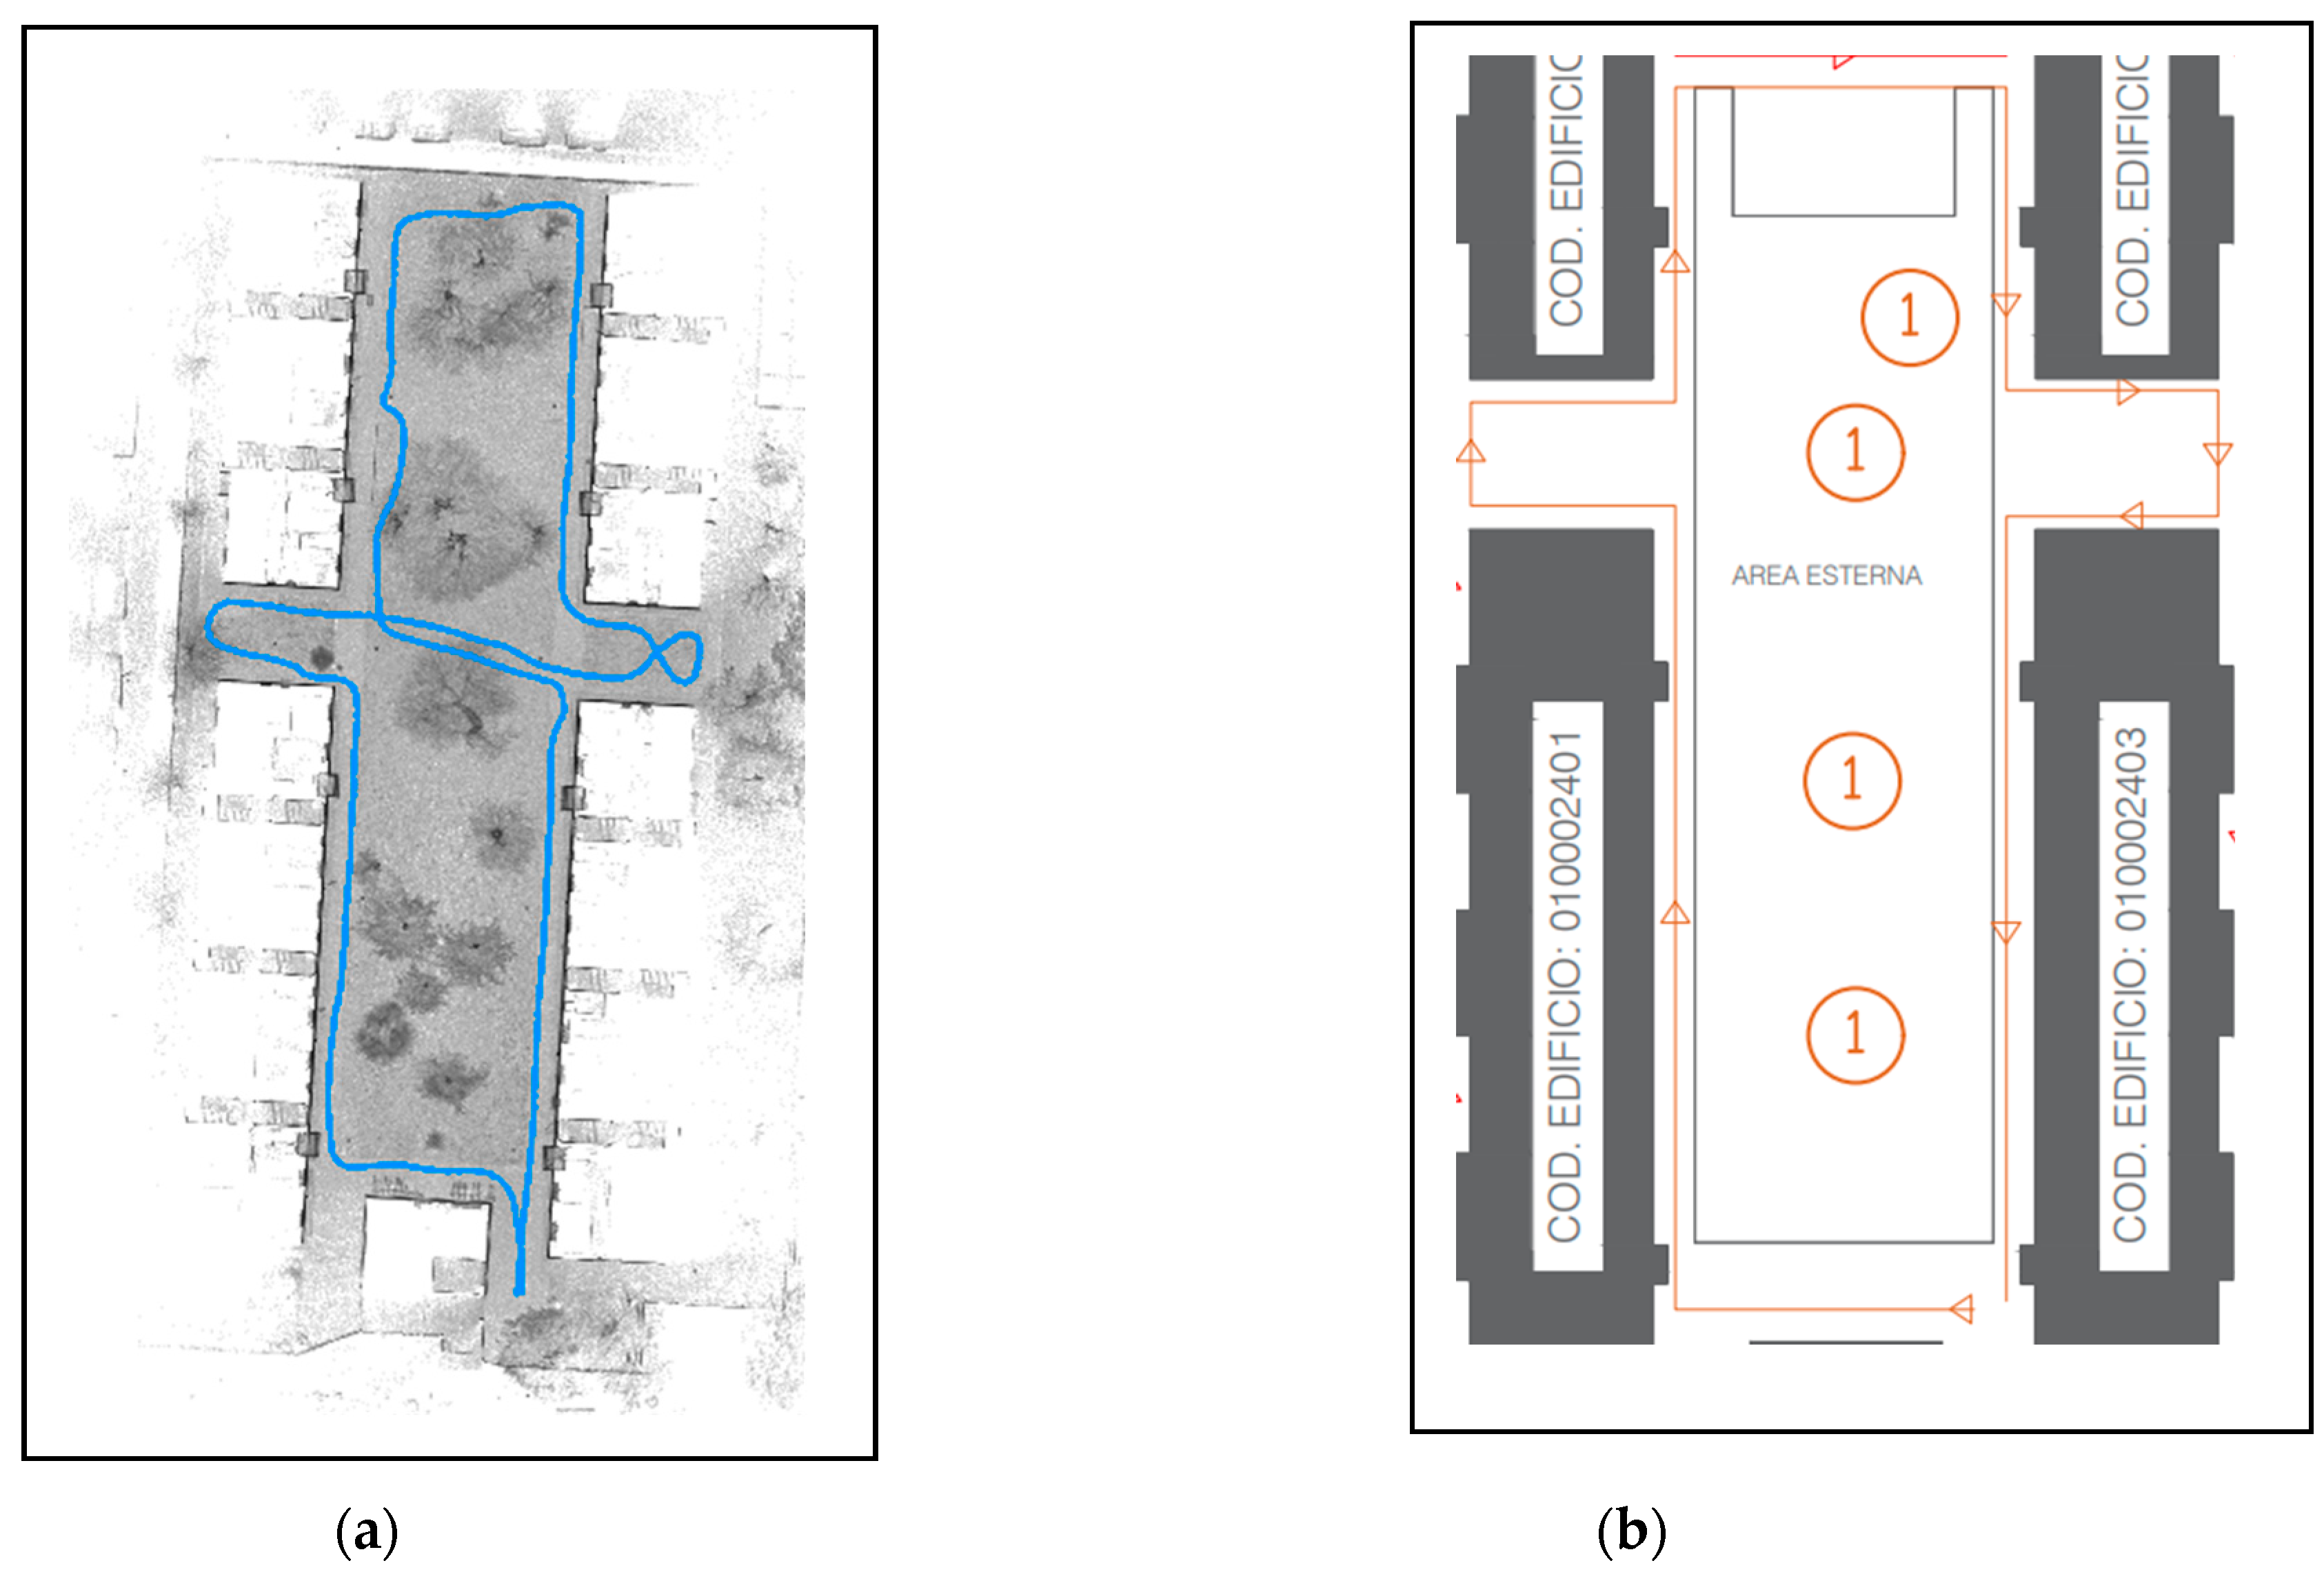
  • Associate each area surveyed with its name/identification code, as mentioned above, which uniquely identifies it. Indeed, the surveyor must be able to know without doubt the name or codes of the spaces he or she is traversing in order to associate that code with the spherical image acquired. In the case of the Milan project, the areas to be surveyed are divided into 3 main classes, namely the survey of building stairs, the survey of areas outside buildings, and the survey of technical and/or service rooms. Below (Figure 19) is an example of how it was required to provide a plan of the location of the technical rooms in a building complex, an example (Figure 20) of the location of and code for the stairs, an example of how the exterior areas are to be surveyed (Figure 21), so obviously to connect the entrance of the stairs to the survey paths of the exterior areas.

5.5. Survey Report

Based on the surveys and the work schedule, the field mapping activity is documented out with a Survey Report (Figure 22 b) being produced. This document indicates the personnel who performed the survey activities and reports any problems that occurred and could have interfered with the survey activity.

5.6. Topological Structuring of the Spaces to Be Surveyed

In the Milan Project has be requested to associate each recognized asset of the building with its location, not only in terms of coordinates, but rather in terms of its location within each area of the building (common area, corridor, hallway, floor landing, basement, outdoor space, and so on). This requirement differentiates the survey from the classical specifications of a classical topographic and/or BIM-oriented survey, mainly focused to obtain an accurate point cloud model so to be able to run an appropriate scan to BIM process. The structure of the spaces of the complexes is quite simple and consists of surveying the staircases of the buildings, areas outside the buildings, technical rooms and services. It should be noted that individual apartments, occupied by renters, as well as appurtenances related to them, are excluded from the surveys.
Table 2. This table represent the tree structure of how the areas of a typical complex of building is organized in the DB
Preprints 150090 i001
Associating each spherical image with the appropriate building sector, in the post-processing phase, turned out to be a very challenging task in practice. In fact, if the association between spherical photograph and surveyed building space is performed in real time by the surveyor, this task is expeditious and accurate. But such an operation performed in post-processing is particularly onerous. However, the Heron instrument, like similar instruments of the same type, currently has limited tagging capabilities during the surveying activity, so the association between image and space was performed, where possible, had to be realized in the post-processing phases.

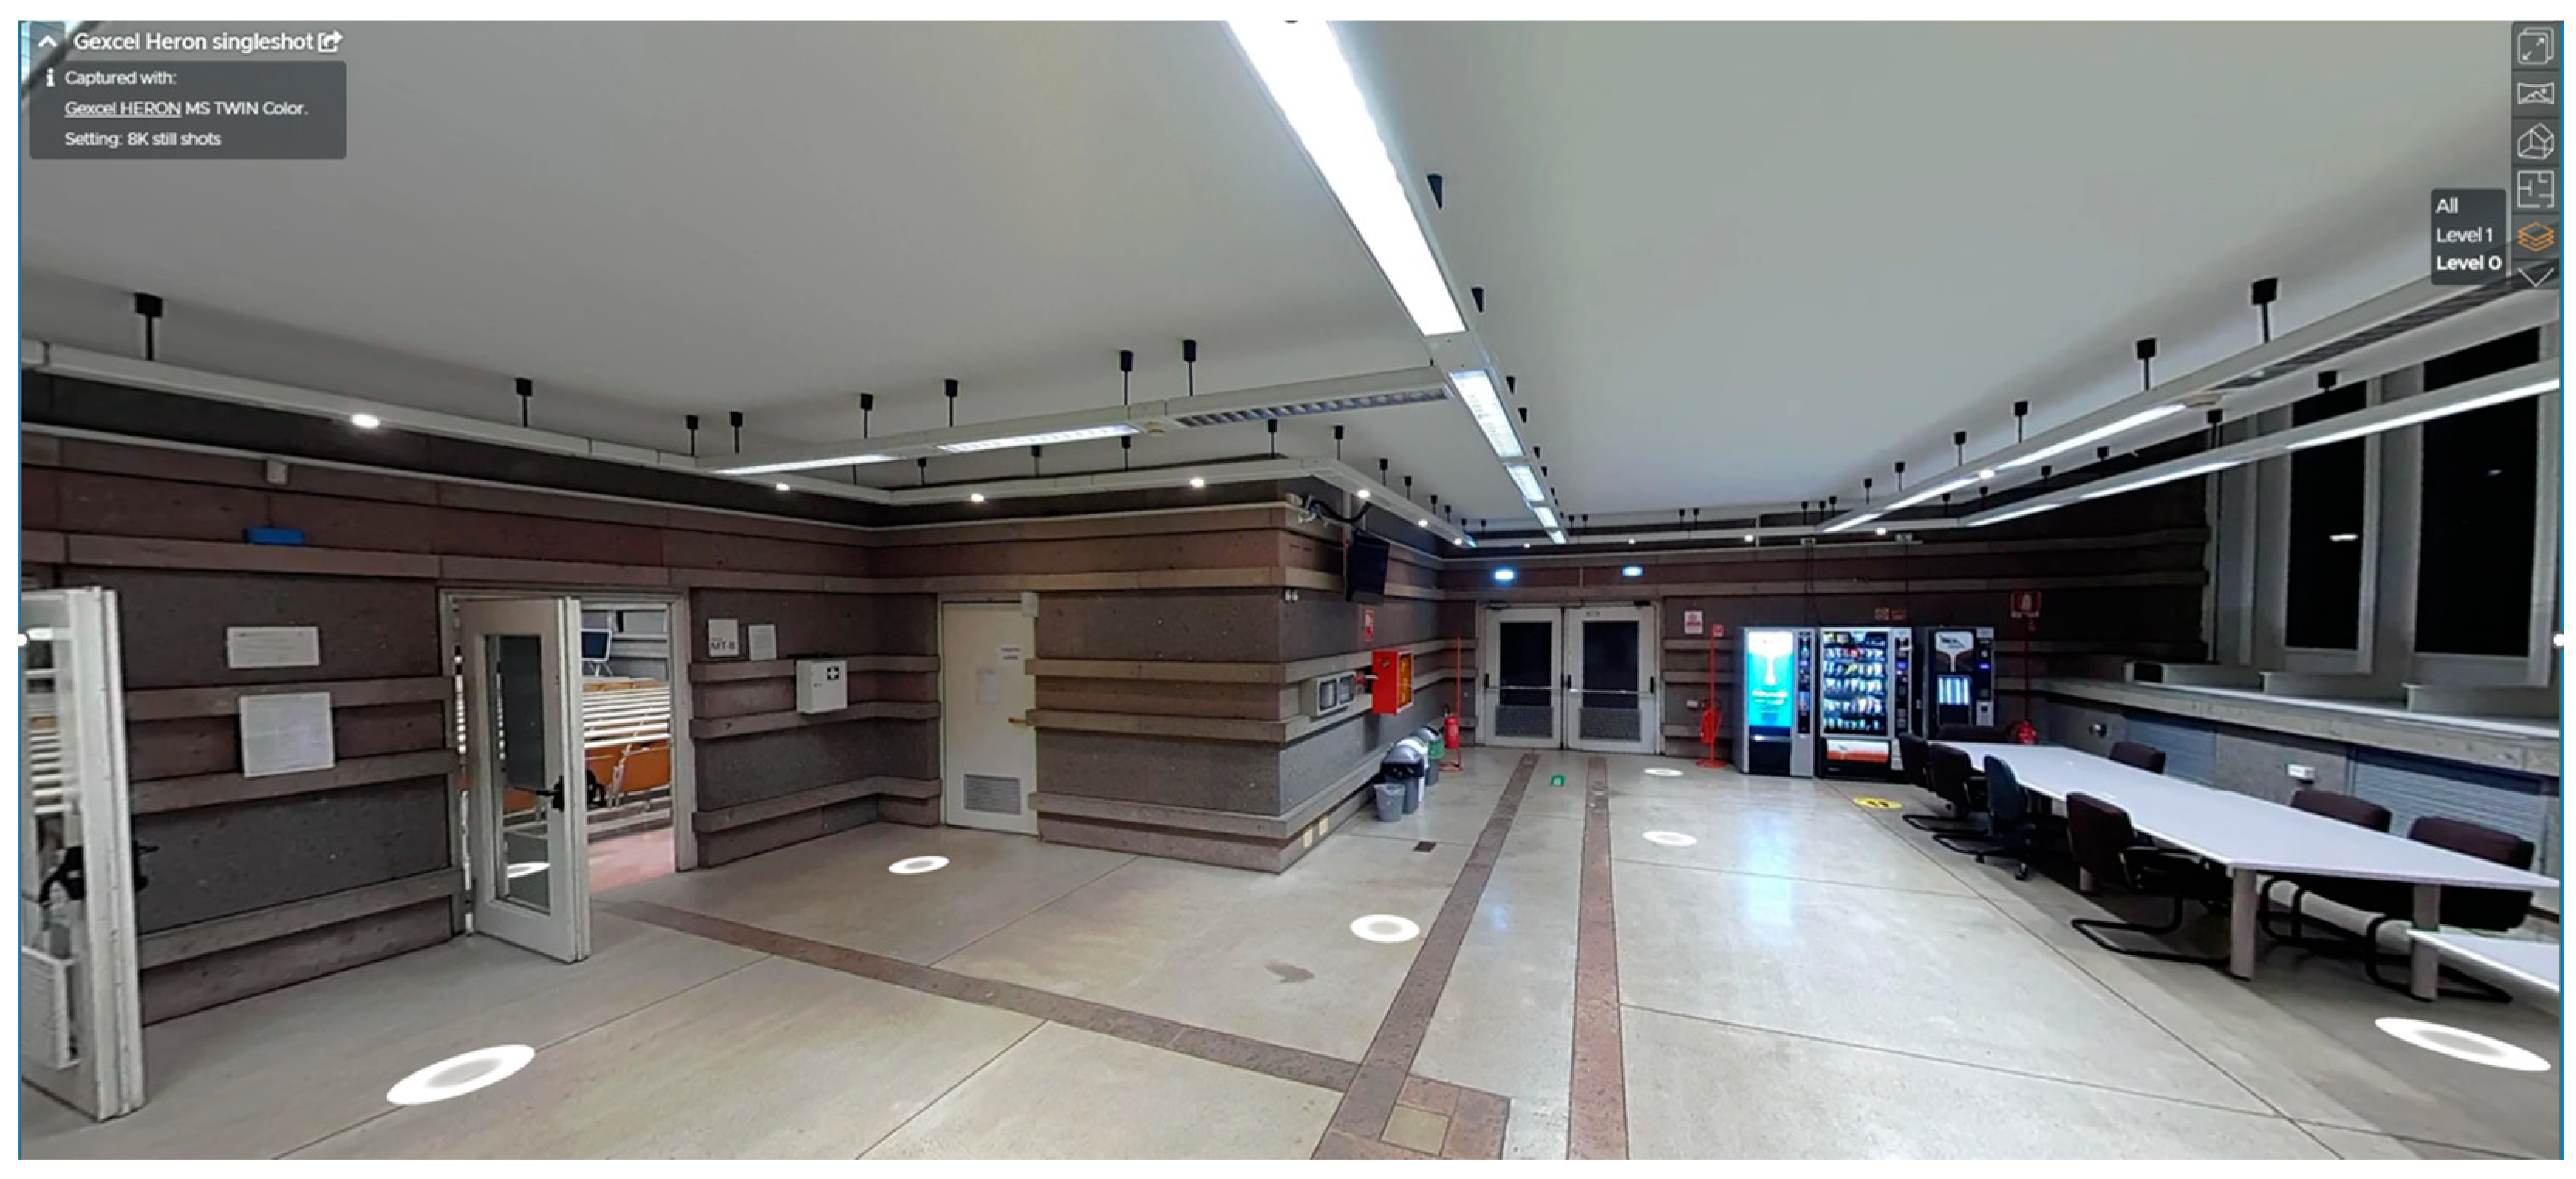
5.7. Virtual Photographic Tours Functional for the Geospatial Project

Essential to asset management activities is the capability of iMMS surveying to facilitate local three-dimensional measurements and associate the assets within buildings with each respective area. As previously stated, it is unnecessary for cost containment to achieve global centimeter-level accuracy in topographic surveys of large complexes and buildings. Additionally, a level of geolocation accuracy is usually required to ensure that the building can be correctly navigated enabling the unique and topologically unambiguous identification of assets. This need is expressed within the requirements of a maximum deviation between points and/or pixels of contiguous spherical scans or images that are part of the same survey trajectory rather than from different trajectories where the data somehow overlap. The maximum allowable difference between neighboring data can be defined empirically on a case-by-case basis, contingent upon the assets intended to recognise in the images and subsequently geolocalized in the model and moved in the database. In conclusion, it is essential to guarantee the model’s navigability and the corresponding alignment accuracies between images, rather than focusing on global accuracy.
The surveyed data should therefore allow surveyors to create virtual tours within the surveyed site to perform the action of asset recognition, the purpose of the project. A specific feature within the Reconstructor data post-processing software, delivered by the Heron instrument manufacturer with the instrument, facilitates the possibility of Virtual Tours of the surveys (Figure 23). While navigation with such a tool is efficient, collaborative navigation within web-based platforms is typically favored for this purpose.

5.8. Survey Deliverables

The surveying process will be producing the following deliverables:

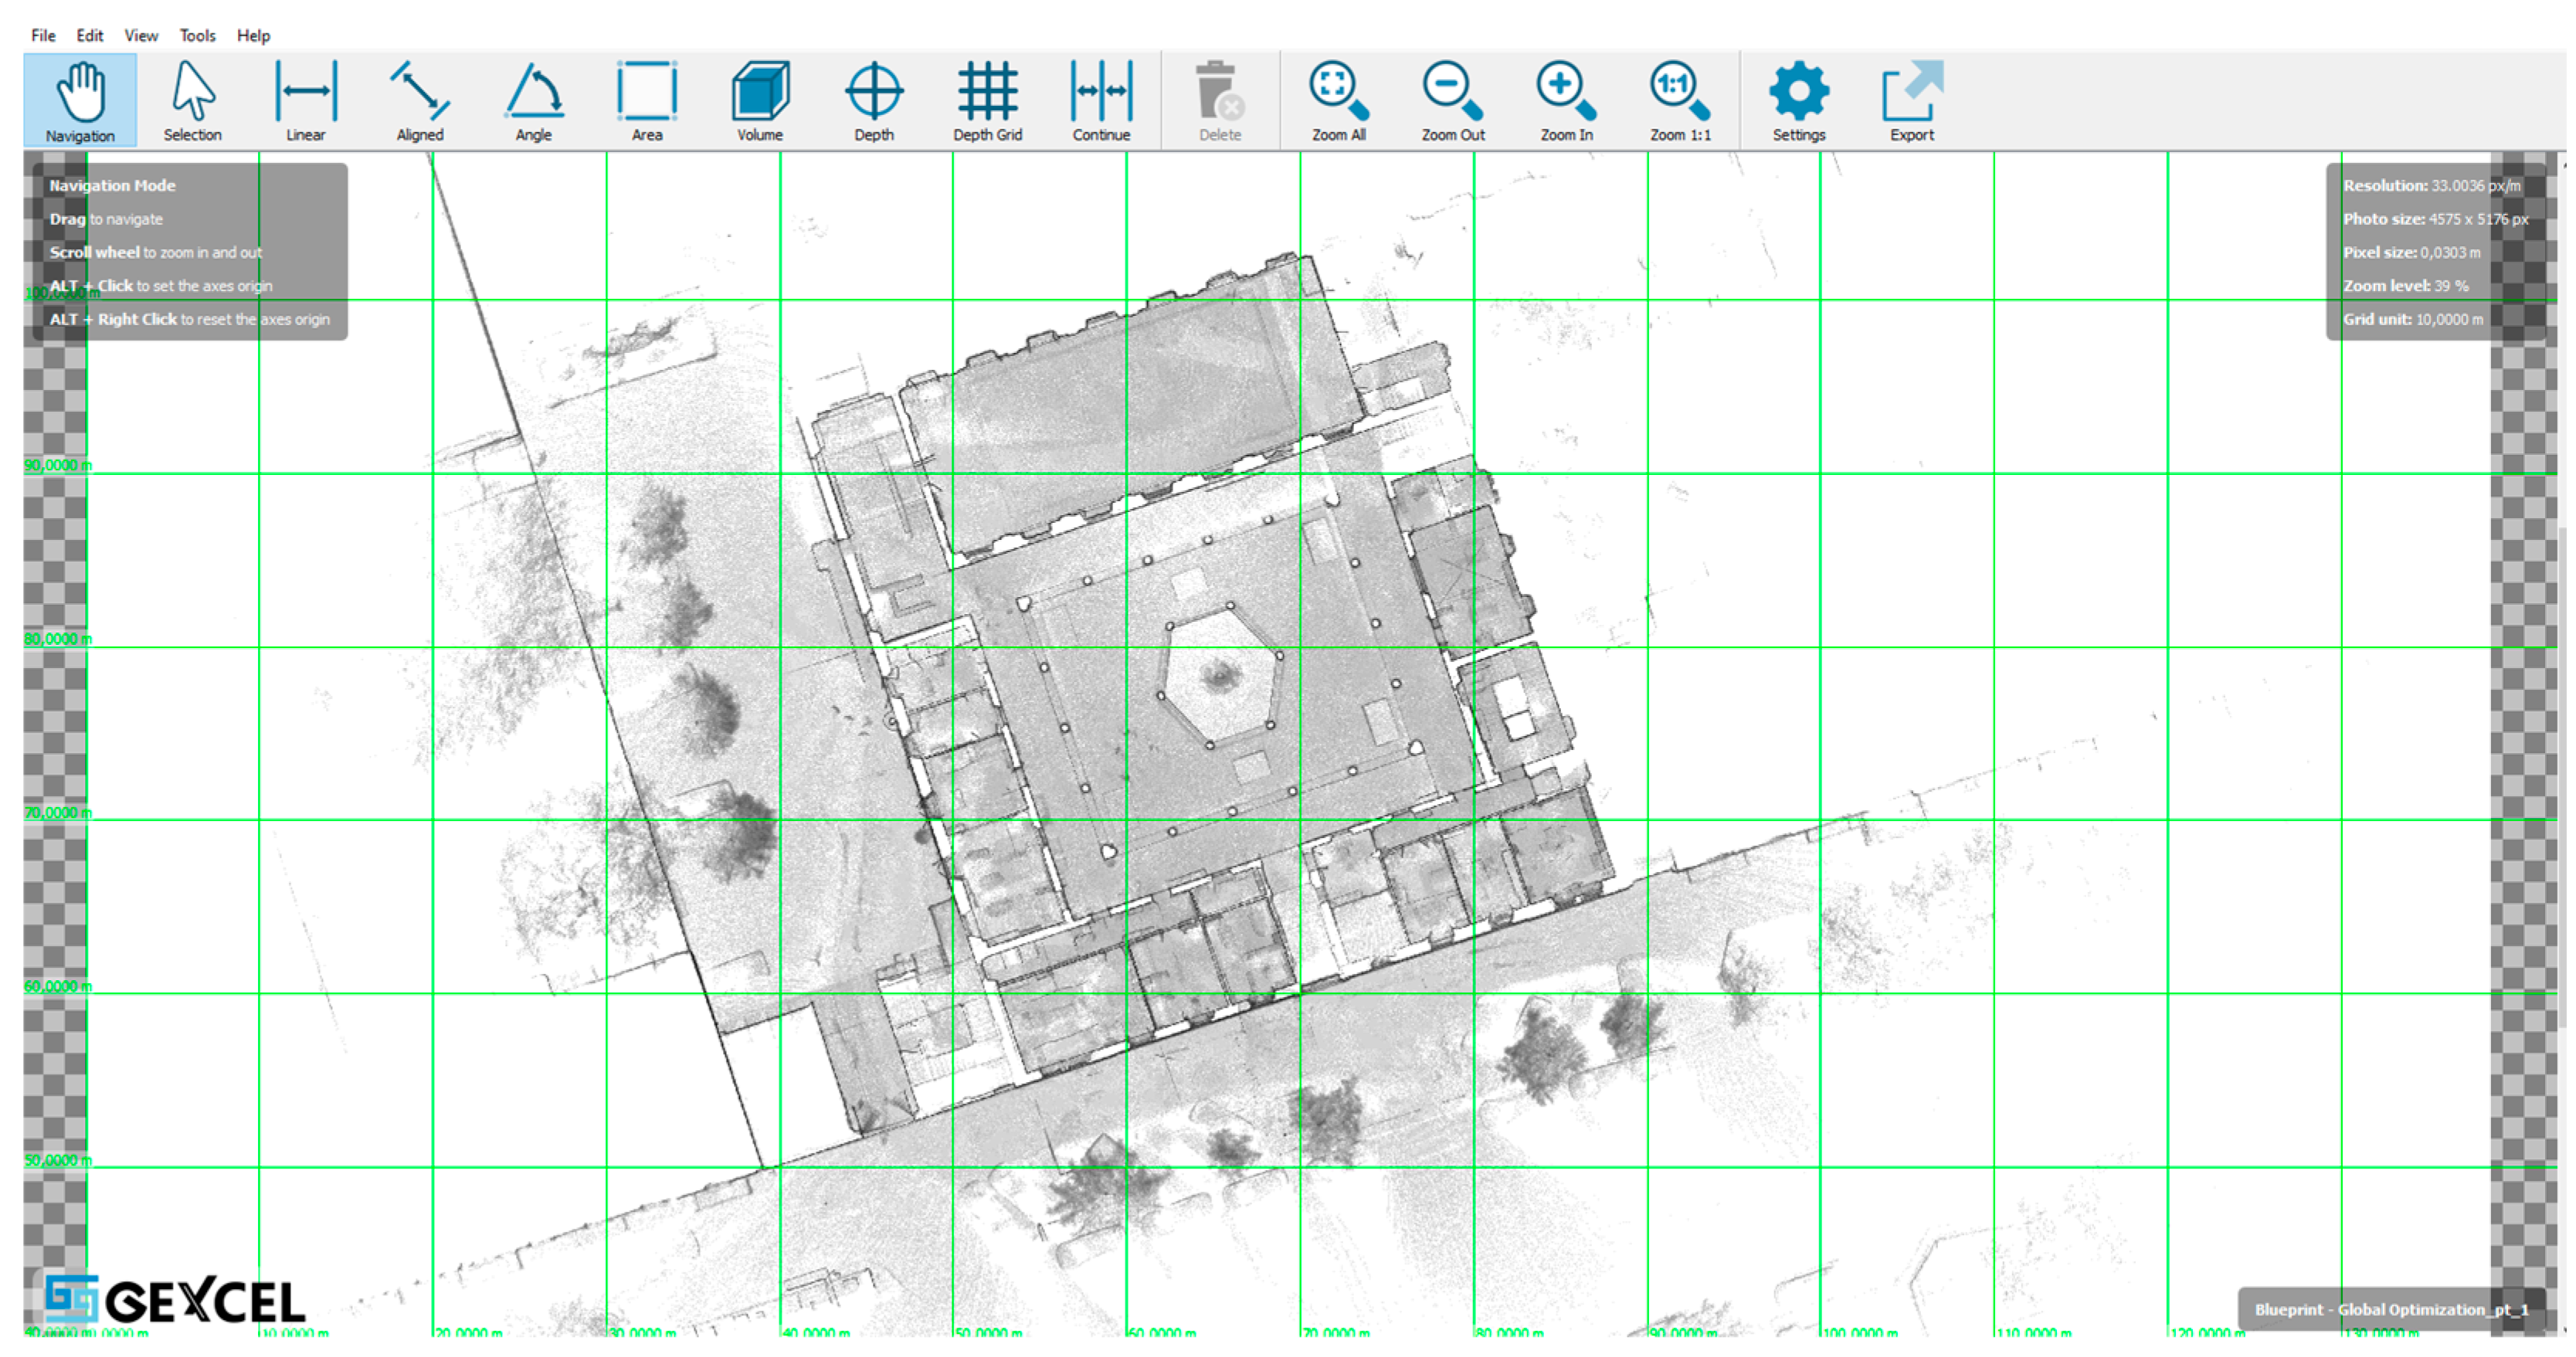
5.8.1. BluePrints Images of Surveyed Areas

By traversing the areas of the buildings, the mobile mapping system realizes a three-dimensional survey of the locations. The 3D model, although rich in information, is difficult for non-specialized personnel to be directly consulted. For this reason, in the Milan survey, it was also possible to produce BluePrint plans of the mapped areas, making an orthophoto of the point cloud. Such orthophotos are made in a scaled JPG image format, which can be opened either in graphic CAD software rather than in image management programs. A free app is also provided, running on any Windows platform, which allows the BluePrint to be viewed (Figure 24), and distances, areas, and elevation differences to be measured with a simple interface that allows even operators who are not experts in CAD or 3D management platforms to take measurements in the surveyed areas.

5.8.2. Point Cloud with the Associated Spherical Images

For each complex, the survey provides a point cloud model with spherical images. The raw data acquired by Heron are post-processed with the SLAM algorithm in the Heron Desktop software, that produce a point cloud model in PLY format. The point cloud model and the images are later movable to the point cloud software, Reconstructor®, that takes care of the model geo referencing, editing procedures and final registration, if needed, with point cloud coming from static scanners or from other HERON surveying. The project structure of Reconstructor is named .RECPRJ. Directly from the Reconstructor platform it is possible to extract point cloud and co-registered spherical images in E57 format so to be directly moved to third parties applications.

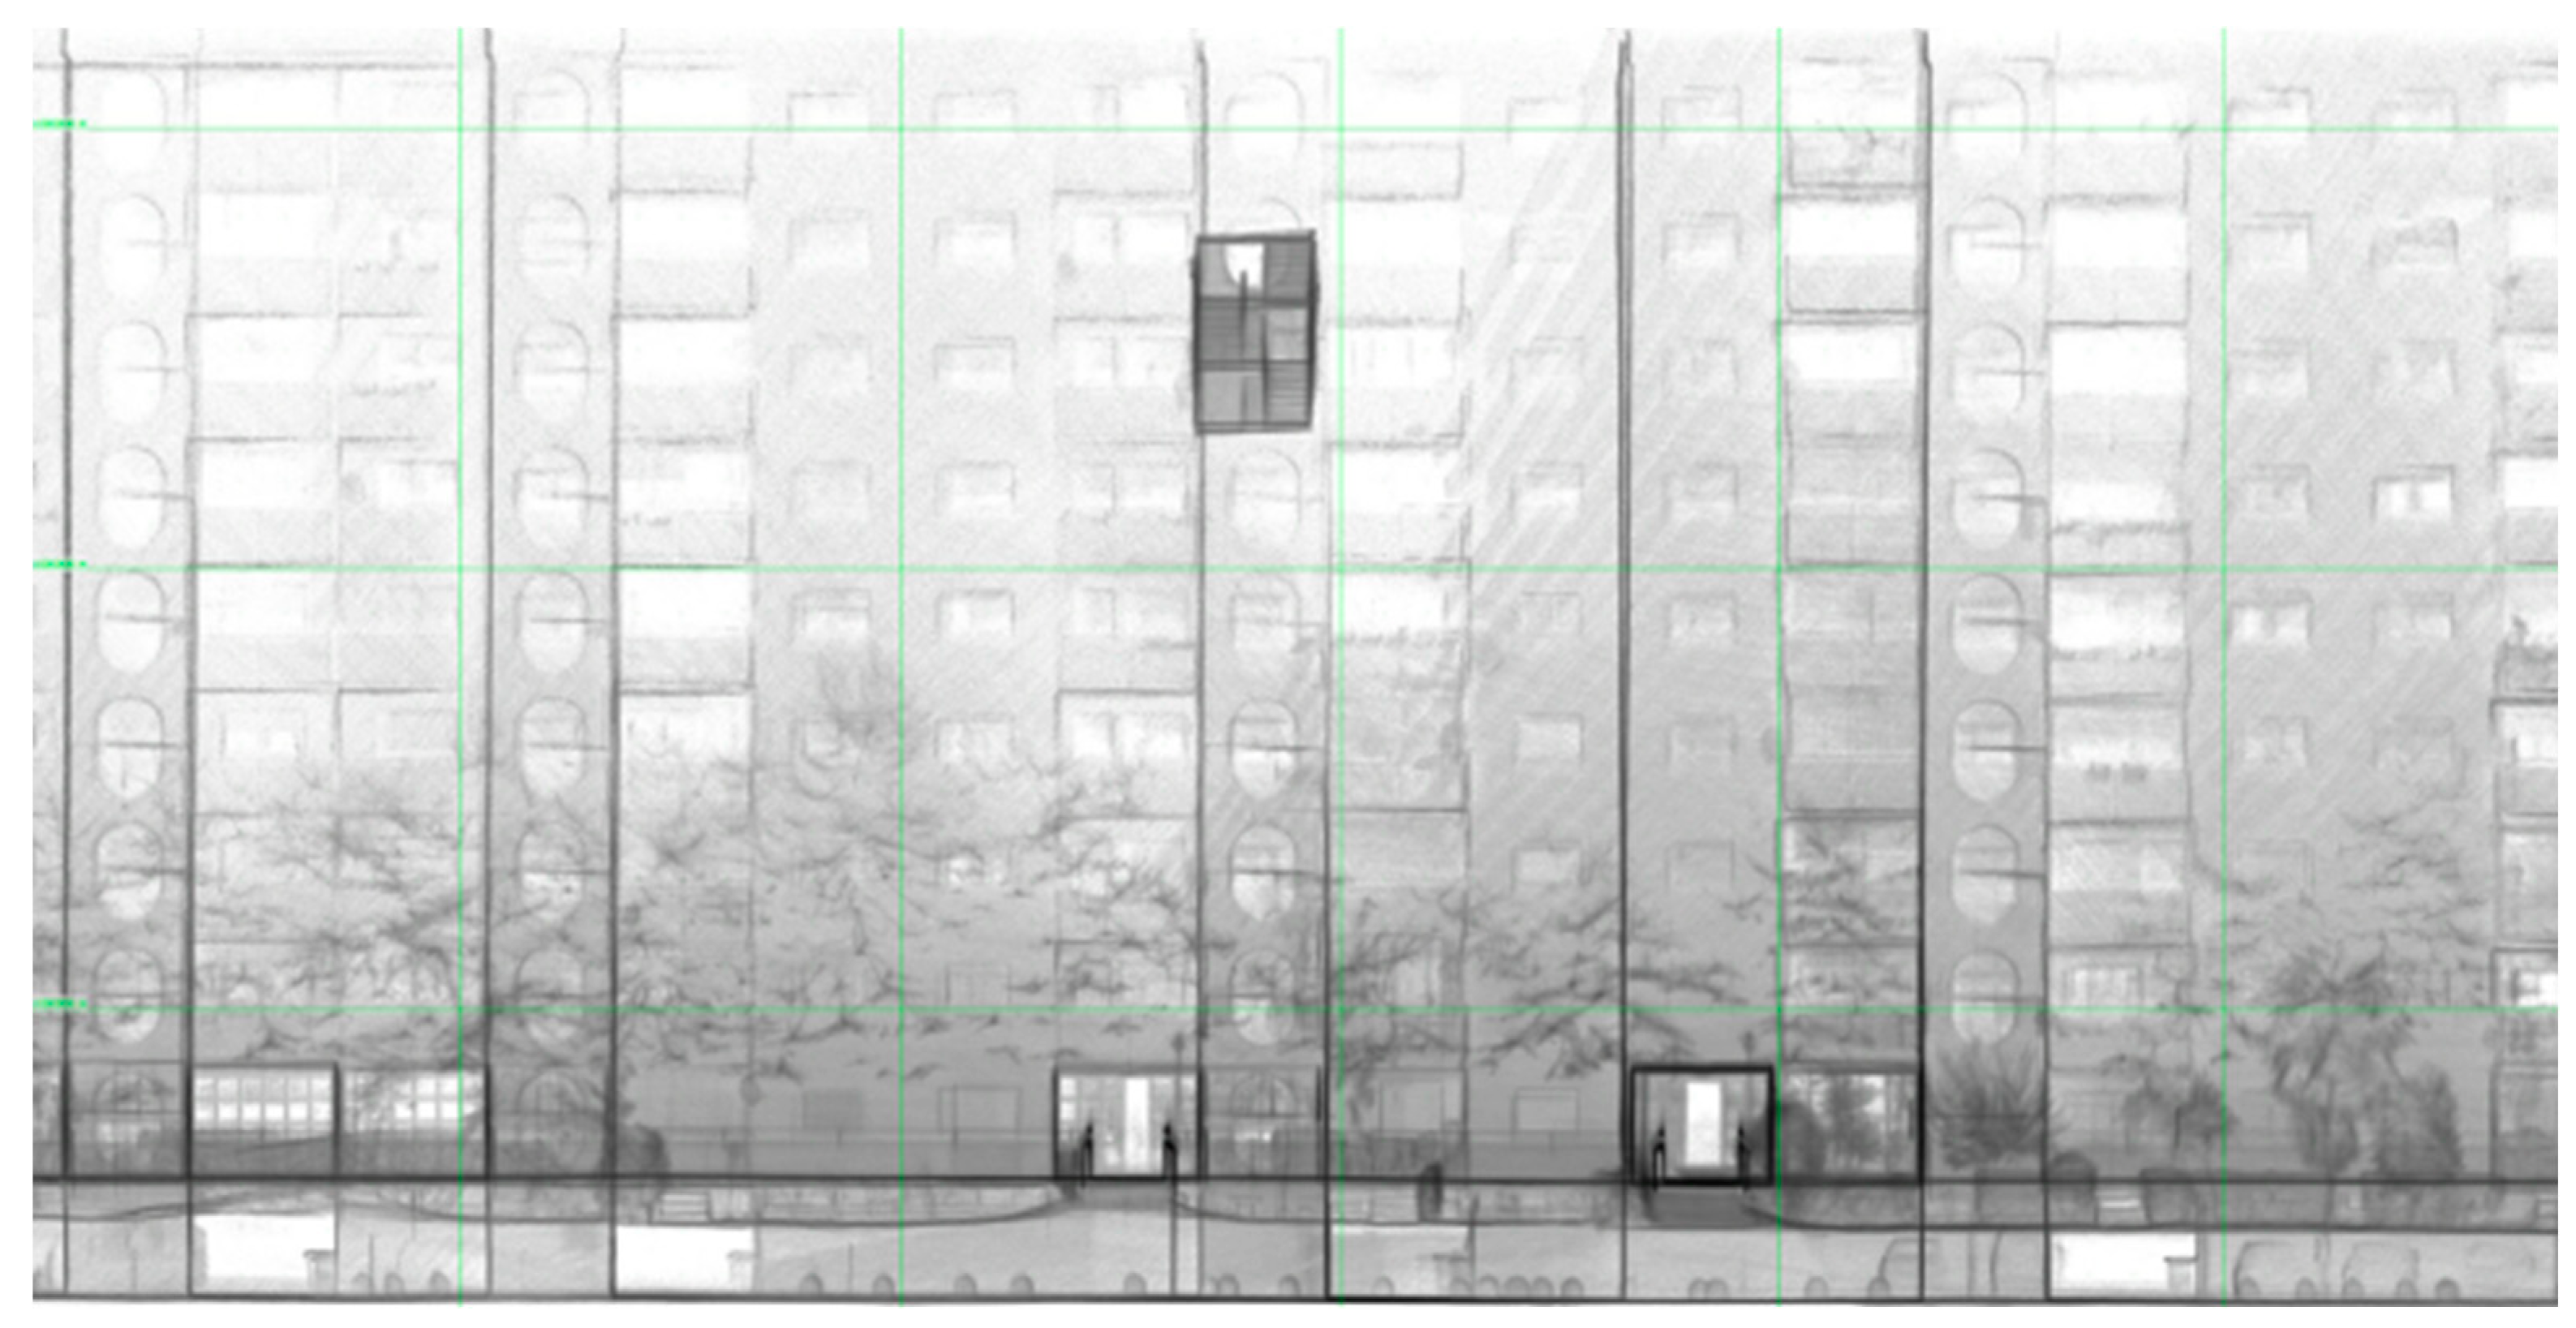
5.8.3. Building Facades Orthophoto Pictures

In addition, but this aspect is beyond the scope of this article, in the Milan Project has been requested that expeditive orthophotos of the point cloud of the buildings’ facades, at the scale 1:200, taken by terrestrial laser scanner, be provided (Figure 25). The term expeditious indicates that the scans were to be performed without topographical support, allowing for occlusions in the orthophoto or non-detection of the facade in all cases where there were logistical difficulties or difficulties in viewing the facades themselves.

5.9. Confidentiality of Data

A crucial aspect, increasingly required in many fields, is the establishment of data confidentiality protocols. Leaving aside issues of quality and privacy of the company’s data management infrastructure, with respect to survey activities and instrumentation characteristics, a few key points should be highlighted.
(a) First, Lidar-based systems, even more sensitively if equipped with a camera, are able to acquire a digital twin of the surveyed environments with extreme care and detail. Already the raw data, before its processing, itself contains sensitive and detailed information. Therefore, if the surveying activity is performed not by the owner of the instrument but by an external service firm, it may be that confidentiality rules impose that the data not only be handed over to the client immediately after the completion of measurement operations, but that such data not be stored in memories of the instrument so that it can be retrieved even if physically erased from such physical storage supports. As such, instruments with data storage on removable physical storage media (such as memory cards or USB sticks) might be required.
(b) Second, the spread of cloud-based data processing services, where the data processing software is not provided to the surveyor but rather takes the form of an online data processing service may involve uploading the raw data to an online portal. Once data processing is completed, the result is shared with the surveyor. Again, before proceeding with the activation of such procedures it should be verified with the site owner whether such online data sharing, however limited to the raw data processing operation, may be permissible under the management and confidentiality protocols of the client. Particularly in industrial or sensitive sites. such procedures may not be allowed. In the case of the Milan project, the problem of sending data for cloud processing did not arise because the chosen instrumentation provides, along with the instrument, the appropriate software for on premise data processing.

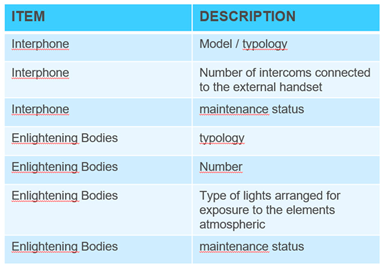
5.10. DB Structure to Be Populated

MM has a structured DB that contains a list of approximately 211 items and assets in the common areas of its buildings, each with different attributes to be surveyed and documented. The main purpose of the Milan Project was to populate and update that DB. This process must be performed by MM technicians who, by observing the images acquired in the field, must associate each area of the building with the assets present in that area. The recognition, at the moment, has to be done in a direct way and machine learning algorithms, although present in the literature, have not yet been implemented and tested for these activities. The survey must be realized so that these assets can be recognized in the pictures captured by the mobile mapping system and localized in the correct spaces (for example: complex/building/stair/level of the stairs). It is therefore obvious that the quality of the images must enable such recognition.
Table 3. This table is an example of the DB structure by which the assets of the Milan project are managed
Preprints 150090 i002
The complexity of asserts recognition lies in the fact that a range of collateral information, often very specific, is required for each item. For example for the item “architectural barriers,” several attributes and data have to be documented as:
  • Presence of elements that prevent, restrict or make it difficult to move or use services, especially for people with limited motor or sense capacity
  • Check if entrance halls, hallways and distribution spaces in general have adequate width for the passage of wheelchair users
  • If the main shared spaces are equipped with furniture elements arranged in such a way as to allow easy mobility and usability for wheelchair users;
  • If indoor floors are made of non-slip materials and free of obstacles;
  • If are present elements that prevent, restrict or make it difficult to move or access to services, especially for people with limited mobility capacity or sensory capacity;
  • If are present solutions to overcome the existence of architectural barriers
As can be seen, the characteristics of the attributes to each item can also be very complex, and hard to process by automatic systems, although it is assumed that soon the implementation of artificial intelligence procedures will be capable of providing important support for such recognition.

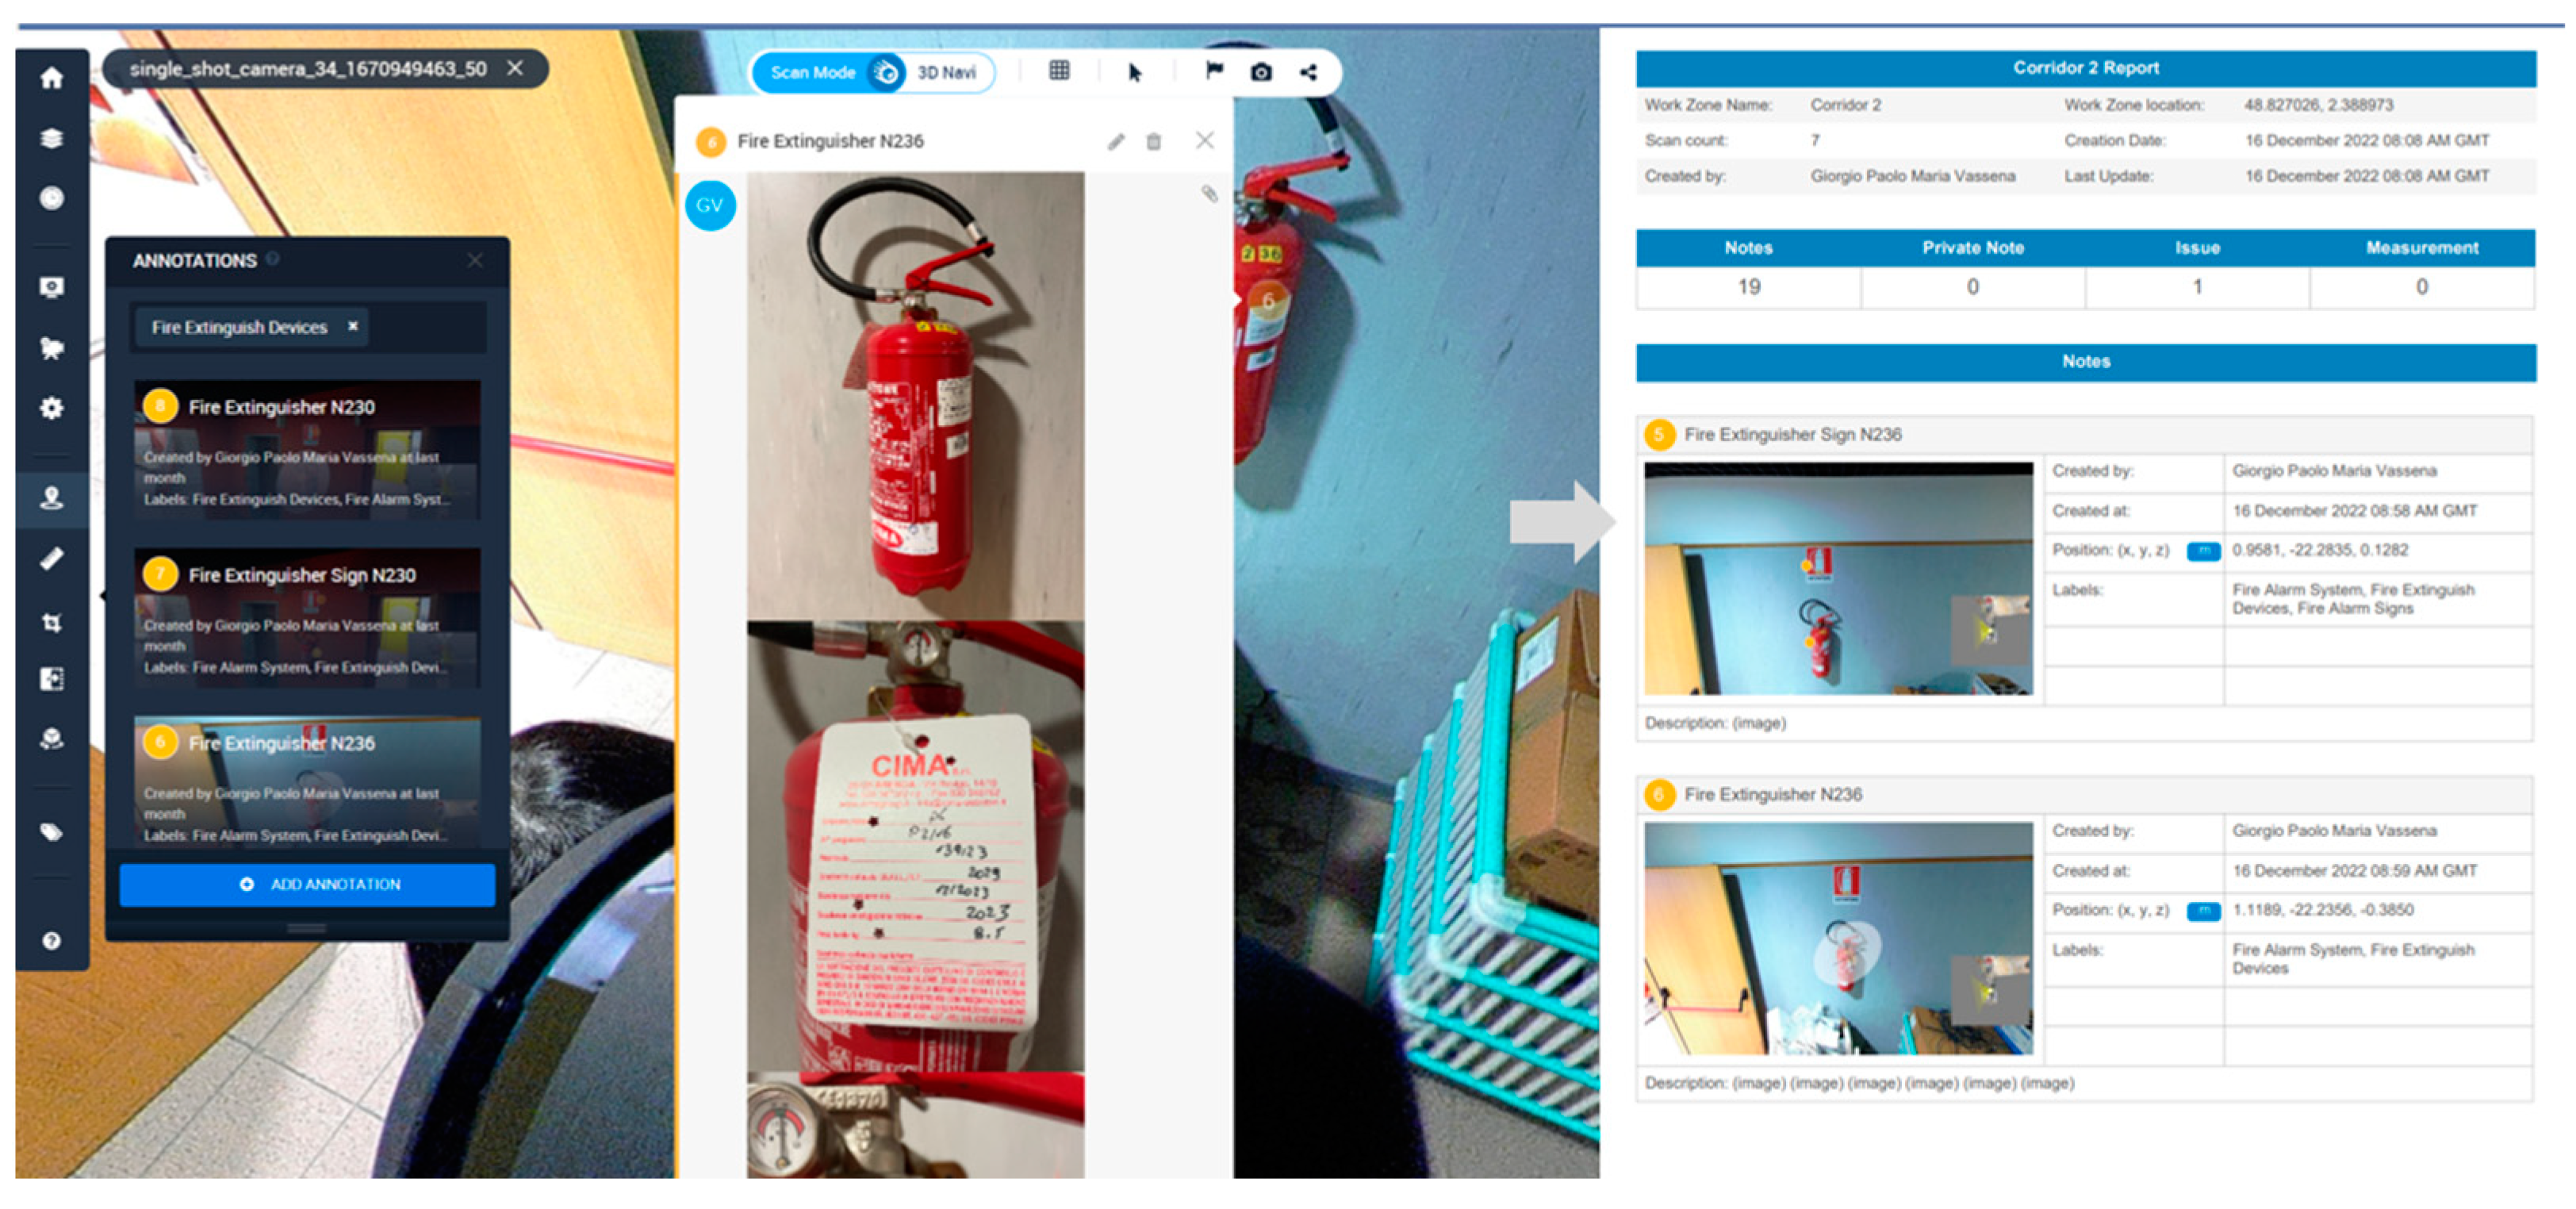
6. Assets Recognition from Images and Populating the DB

6.1. Mobile System Survey Trajectories

In order to enable the technicians to recognize in the different images the assets to be recognized, it is necessary to ensure the possibility of virtual touring within the survey by the technicians themselves. It is therefore first necessary that for each building complex all trajectories are joined together in order to create a unique point cloud model for the entire building complex. This requires that all survey trajectories must have an overlap zone with other survey trajectories. In the design of surveying paths, it is therefore necessary that in order to avoid unnecessary redundant detections in the same areas, it should be avoided as much as possible that surveyors pass through the same areas multiple times. On the other hand, a minimum overlap between surveyed areas must be ensured so that they can be joined in order to create a single model for the entire building complex. As mentioned earlier, this approach, is not optimal in terms of obtaining the maximum overall accuracy of the three-dimensional model, but it allows simultaneously to have a single model and at the same time minimize the size of the surveyed datum and minimizes the areas of criticality due to the presence of duplicate data in the three-dimensional navigation. An example of this type of path design is visualized in Figure 21, where the path of the area outside the building complex (in red color), finds minimal overlaps with the paths for the surveys of the exterior part of individual buildings (paths in yellow color). The union of the paths for surveying the exterior parts of the buildings (Figure 21 in yellow color), will join the surveys of the individual staircases of the individual buildings (Figure X), due to the fact that the path for surveying the staircases stipulates that the acquisition begins in the area outside the building, thus intersecting the paths for surveying the exterior of the buildings (Figure 21 - yellow paths).

6.2. Trajectory Detection Specifications

Therefore, it is necessary to ensure that in the case where the surveying trajectories cross each other, that the deviation between the spherical photos is less than or of the order of magnitude of the smaller objects to be detected, in order to allow their unambiguous identification in the images. Since the smallest elements to be subjected to stacking turn out to be the electrical network sockets and switches, a value empirically estimated at 4 cm was set as the limit of geometric deviation between three-dimensional models corresponding to the corresponding spherical views. One method of avoiding multiple spherical photos in the same survey area, taken from the same or multiple survey trajectories, is to set up a filter that deletes from the final result the images closer than 5 meters. From the problems that occur from having multiple images acquired in the same area, it follows the good practice to minimize the areas of overlap between surveys with mobile systems. Particularly critical, therefore, are trajectories that, inside buildings or outside connect, through trajectory crossings or overlapping of the same, common parts such as garages, stairs, interior corridors, and paths outside buildings. This indication in strictly geospatial applications, clashes with the mode of operation is used by SLAM instrumentation, and in particular by the Heron instrument employed here, which specify that in order to obtain the highest possible global accuracy from geometric surveying, it is necessary for trajectories to cross frequently and for the areas of overlap detected by the different surveying passes to be numerous. It should be remembered that such a procedure is indicated in order to have a very accurate final three-dimensional model of the building complex, a fact, however, that is beyond the requirements of the project.

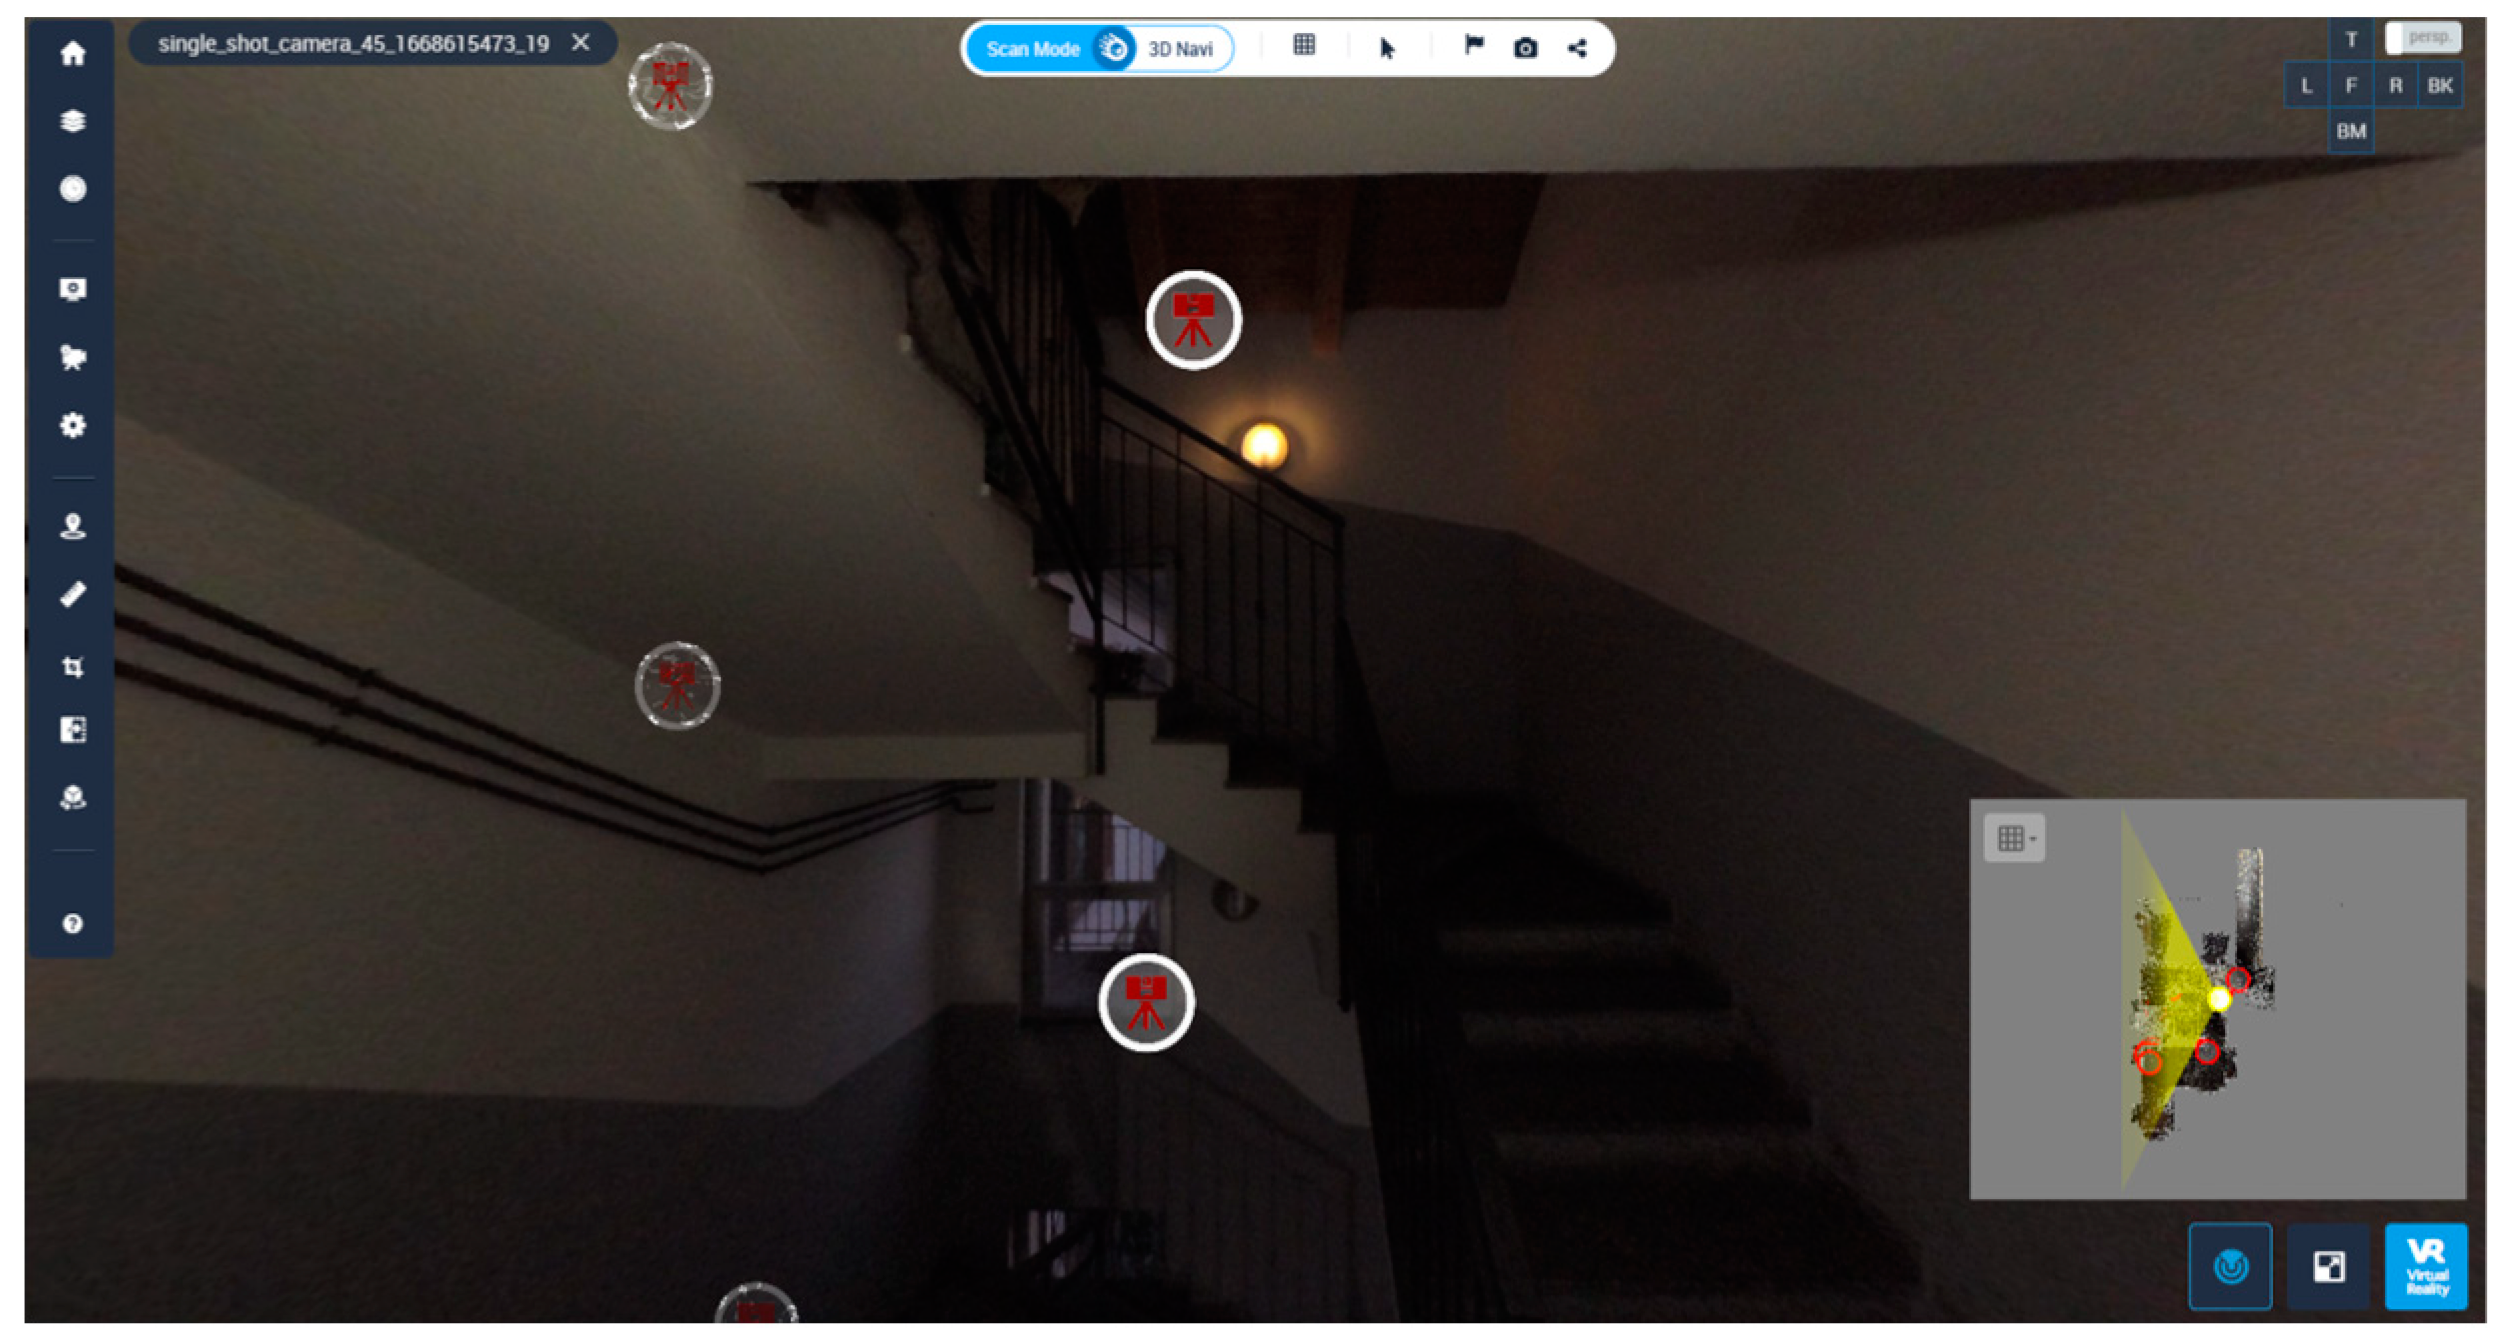
6.3. Model Navigation modes by Virtual Tour

In order to ensure a Virtual Tour of the entire complex, i.e., that navigation with continuity within the building complex is guaranteed, it is necessary that all survey trajectories made with Heron be joined and connected to each other. Continuity of navigation does not require that the trajectories be geometrically accurate, but it does require that at points of overlap or transition between trajectories, the transition is made with continuity and without discrepancies.

6.4. Trajectory Detection Specifications

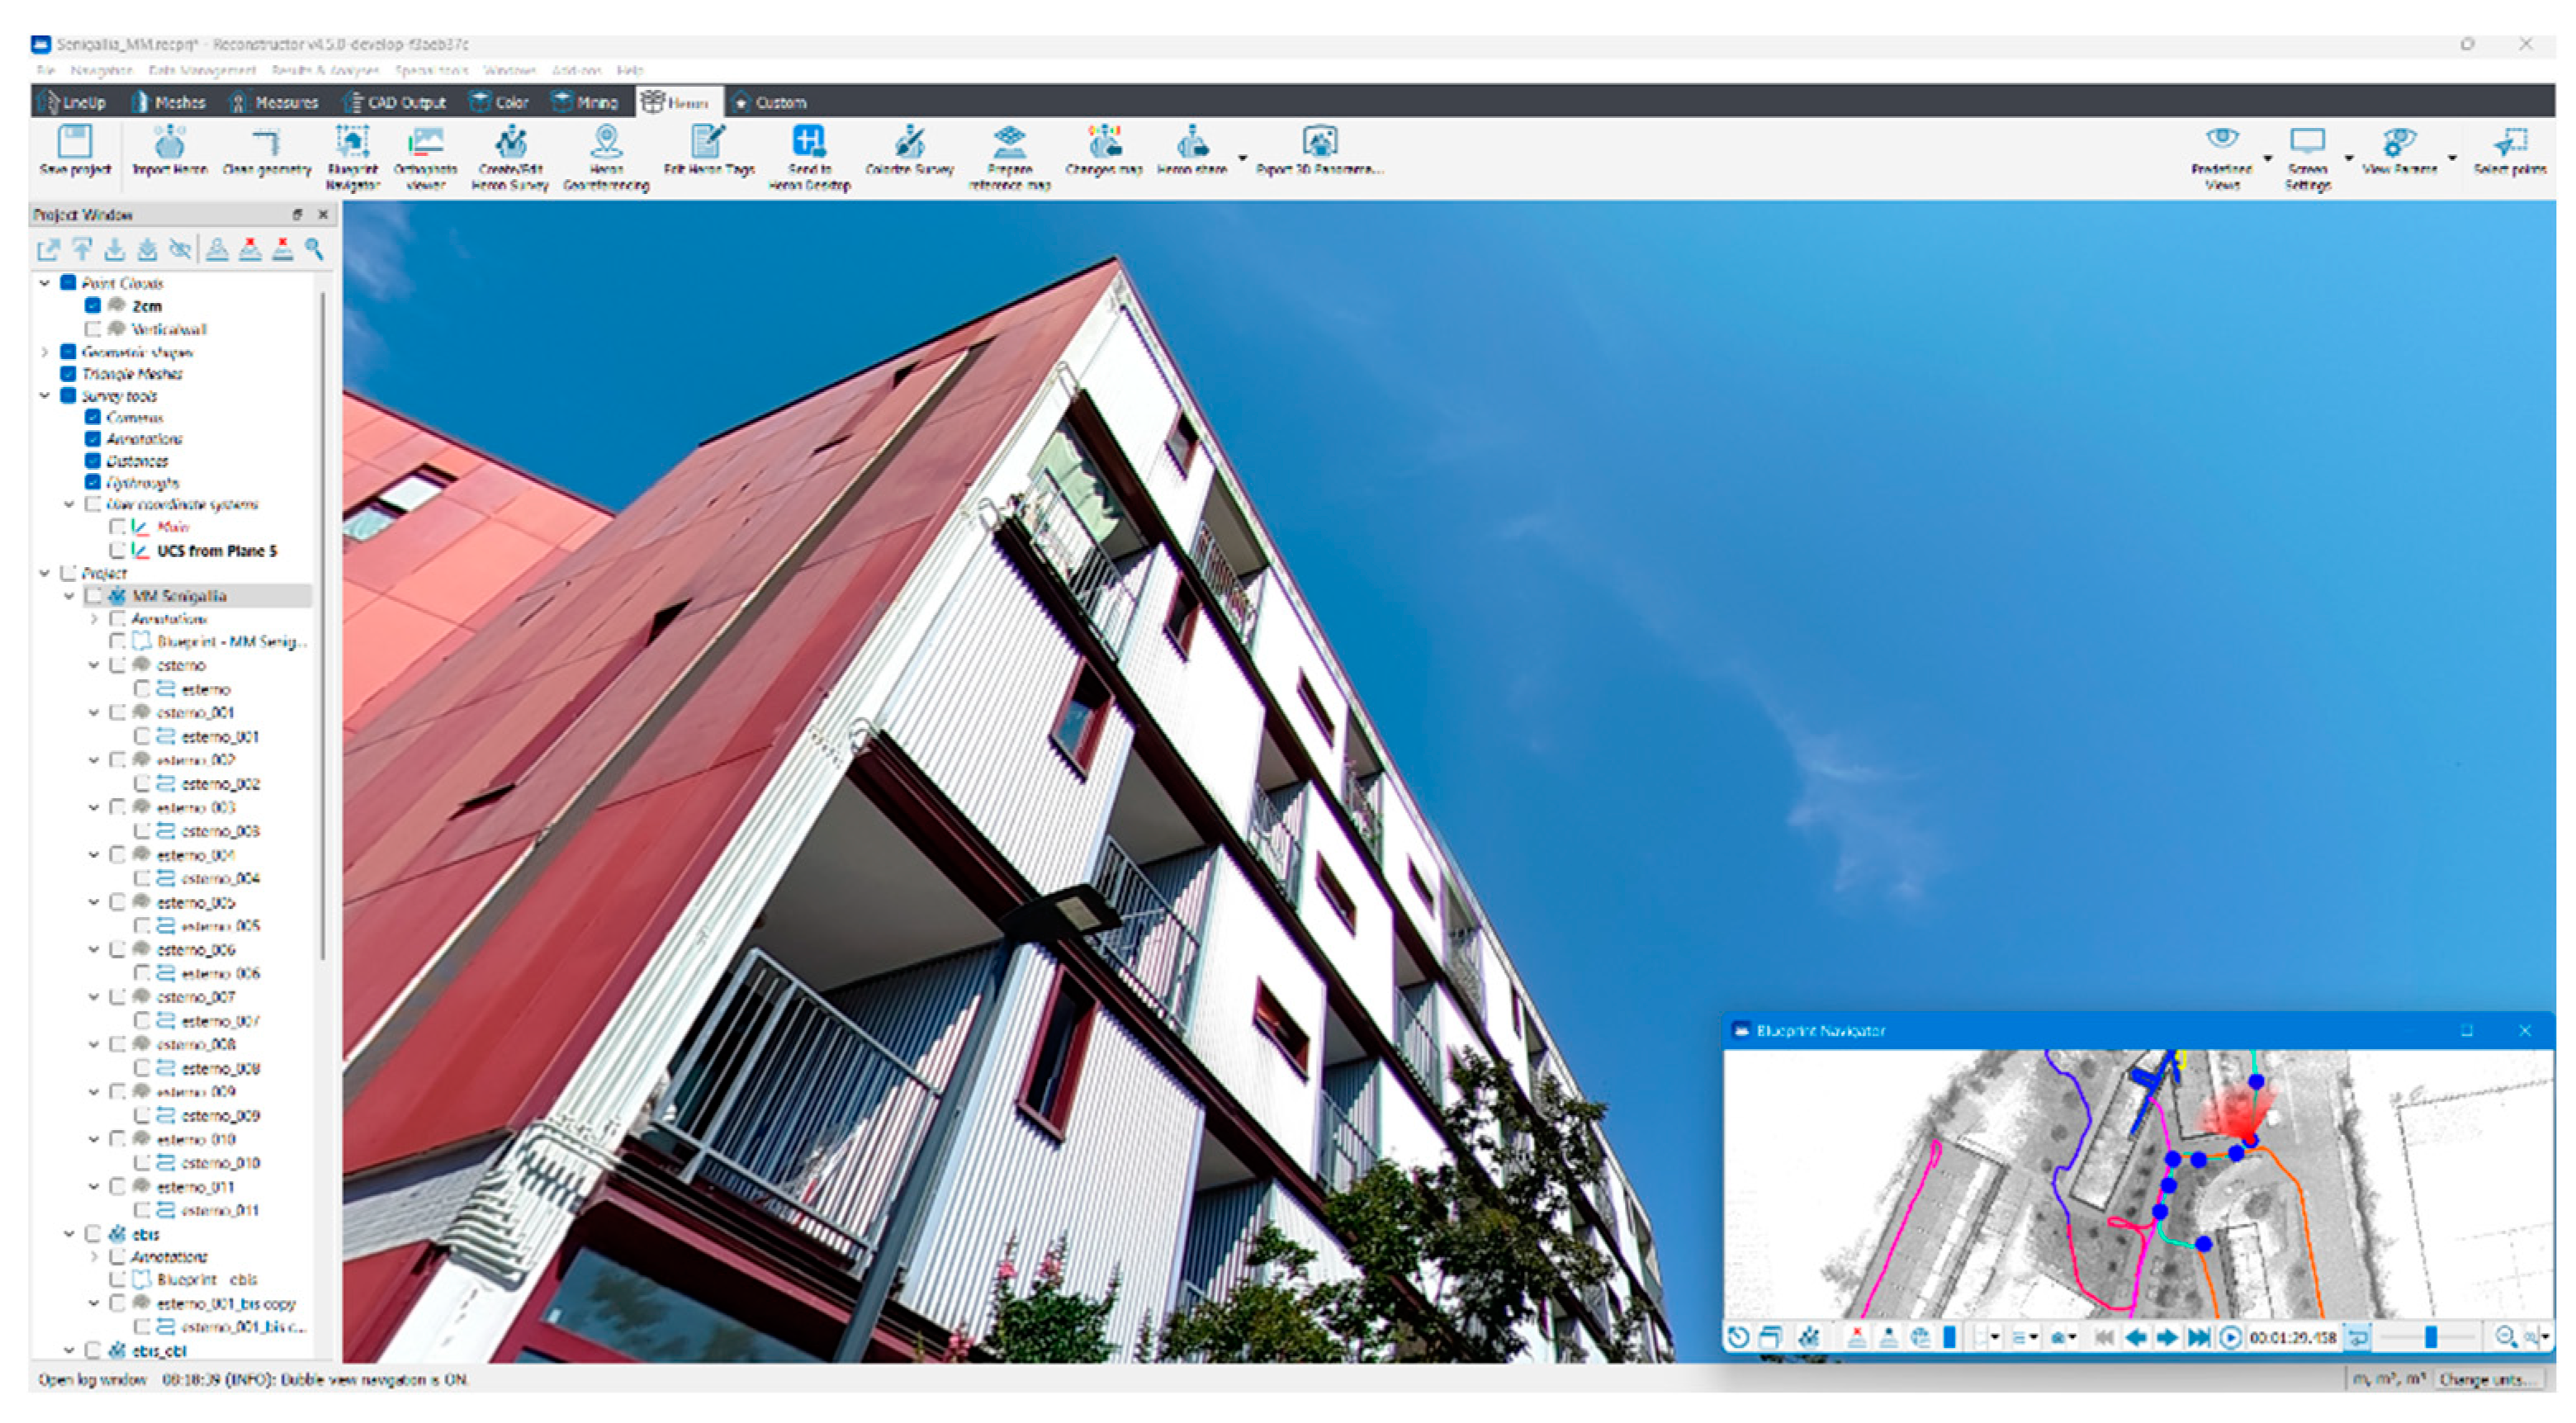
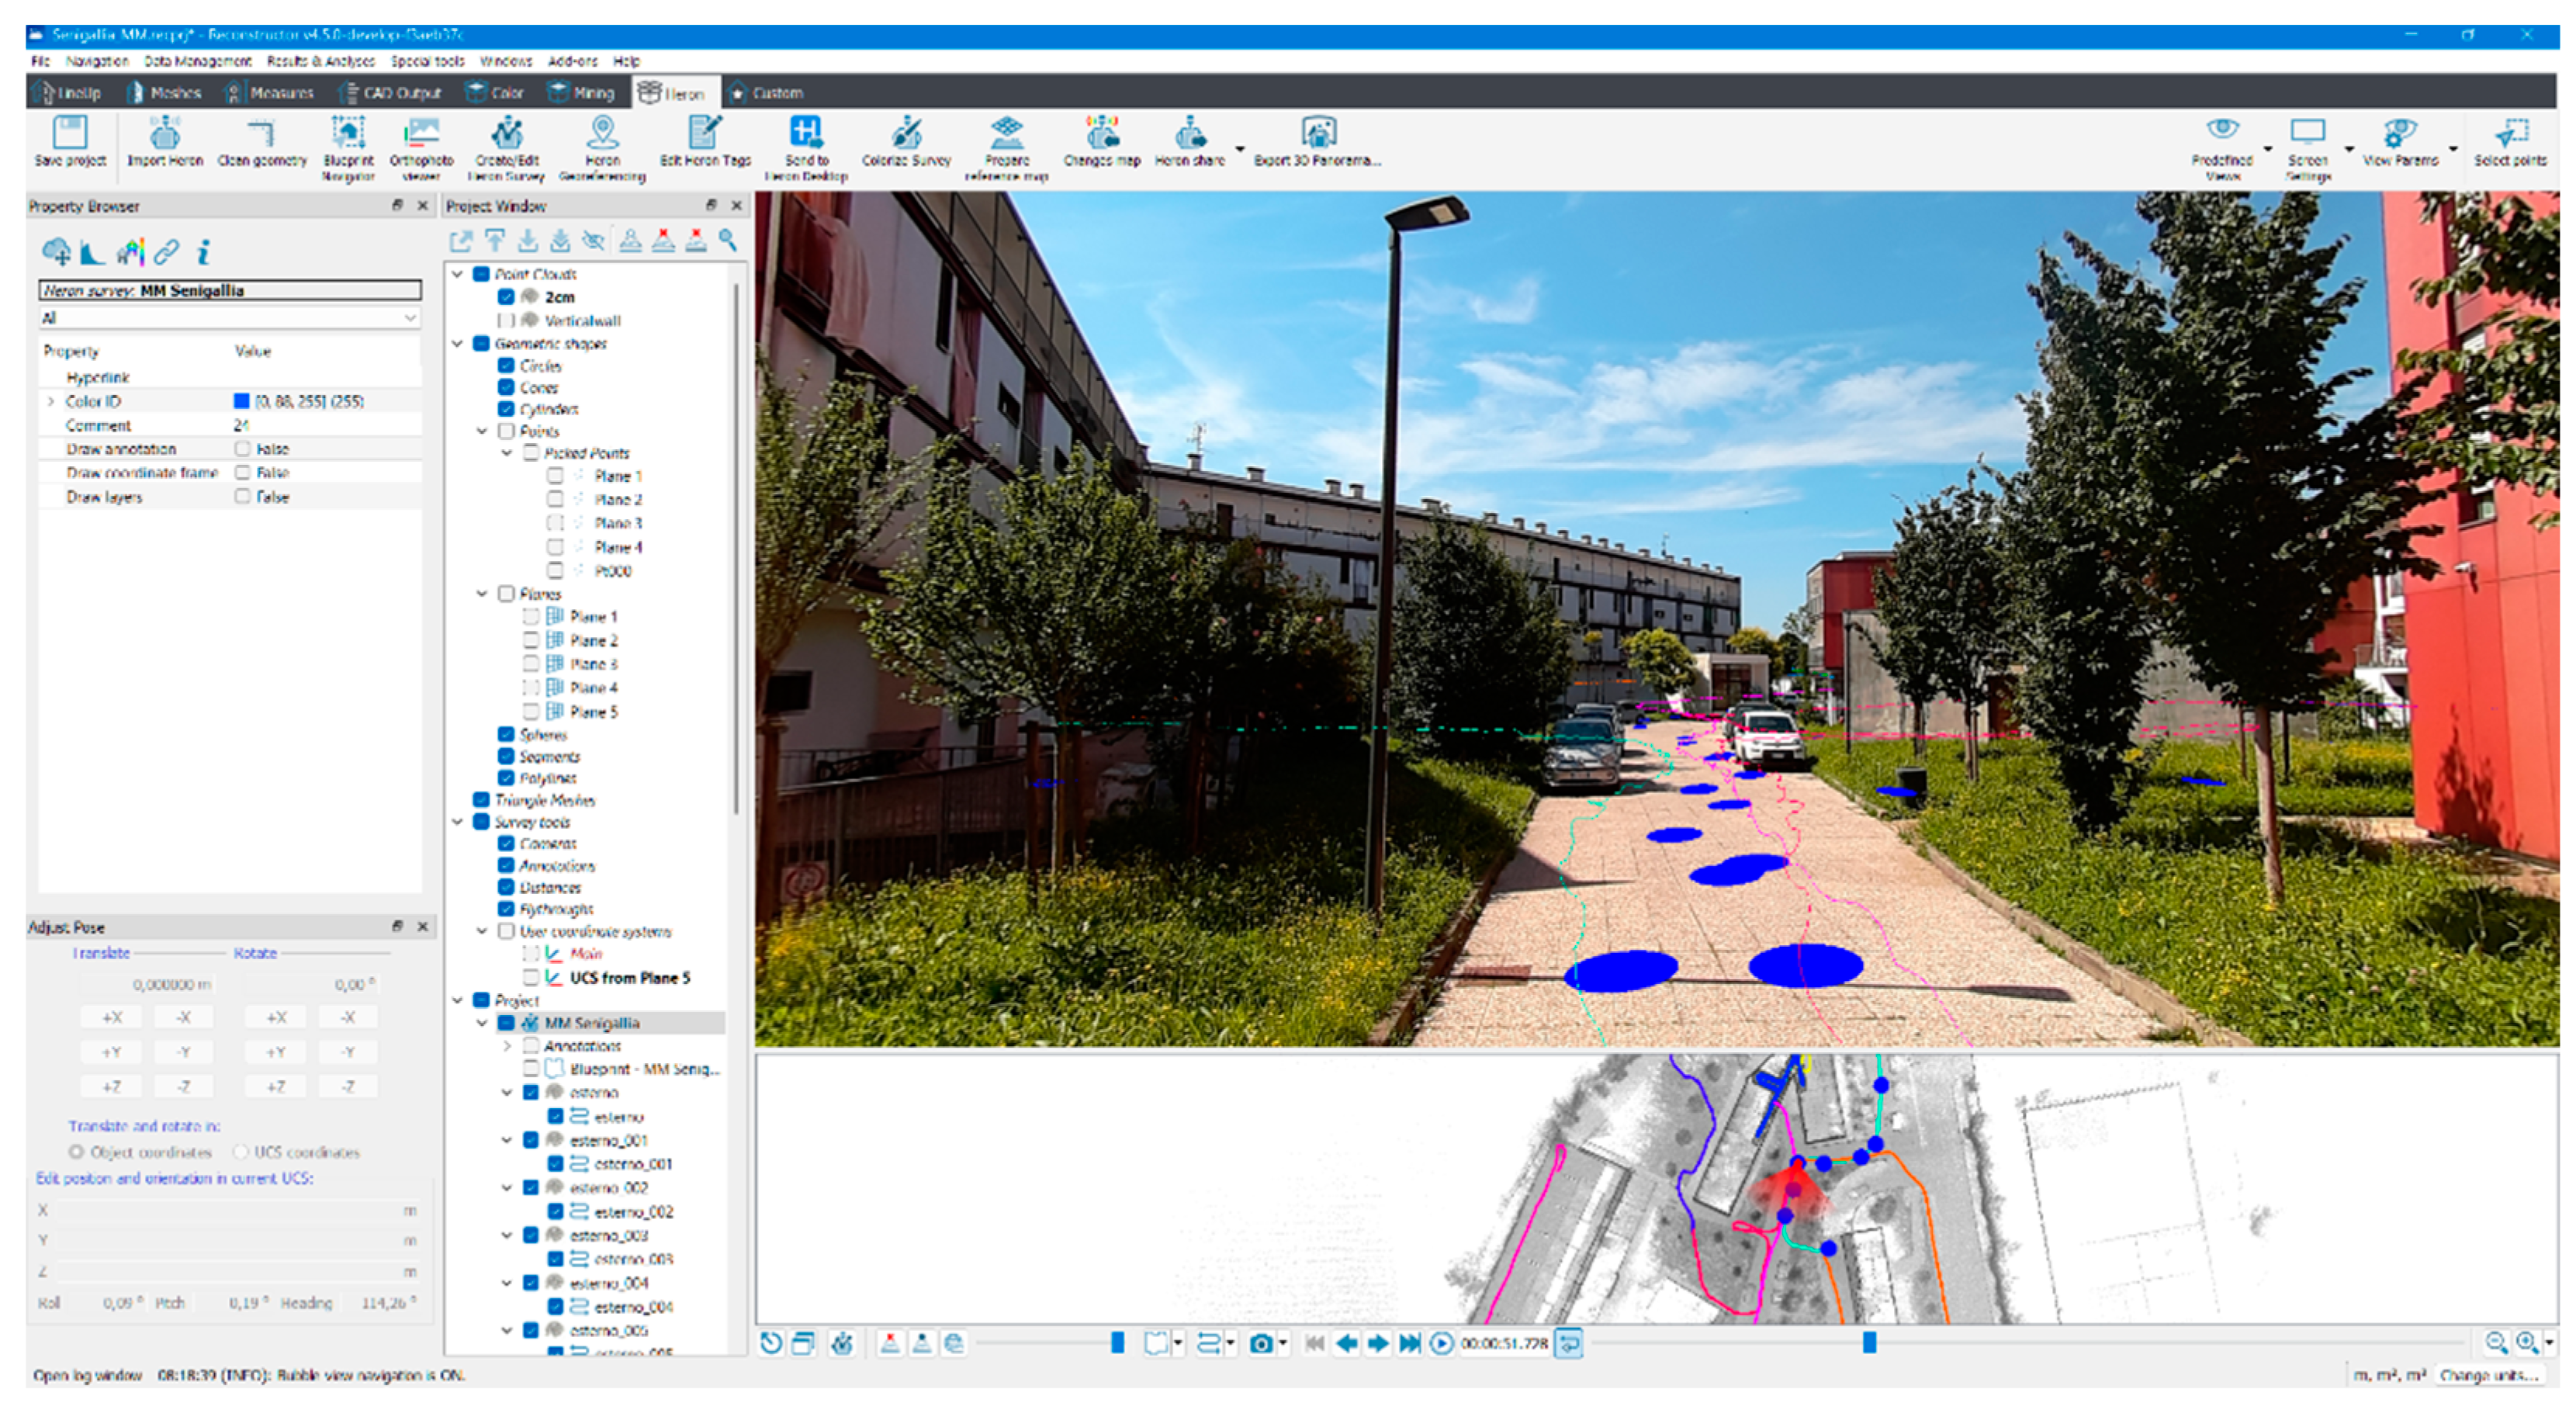
6.4.1. Virtual Tour with Software Reconstructor

The Reconstructor point cloud management software, supplied with the Heron system, contains a tool for navigating the Heron survey, allowing one to move along acquisition trajectories, moving from one spherical view to the next (Figure 26). Such a tool, which operates on a single Personal Computer, is excellent for observing survey quality, making three-dimensional measurements, and producing the previously introduced BluePrints. Such a platform does not require exporting the model to an interchange format, as this tool is within the software itself, and therefore the data can be maintained in Gexcel’s proprietary project format. This navigation, however, does not permit annotations and does not support sharing the navigation among different users, as it is not web based. It is on the other hand excellent on the contrary for fast verification by test engineers of the quality of the alignment of three-dimensional data (thus also photographic data) from different trajectories. The three-dimensional data surveyed by mobile systems presents significant sharing issues, particularly due to the computer heavy nature of the surveyed point cloud. For this motivation, different solutions were sought in the Milan Project that could facilitate the sharing of the surveyed data among different users.

6.4.2. Virtual Tour by WebBased platforms

To this purpose, in the Milan project it was planned that the data would be shared over the network, so that operators could perform recognition activities by navigating within the spherical views. Numerous web based platforms are available to visualize three-dimensional data collected with LiDAR instrumentation, and among them, platforms that provided Virtual Tour style navigation that would allow easy and intuitive navigation between different spherical views have been analyzed. At the time of starting with the project activities, the only platform that simultaneously web based Virtual Tour style navigation and at the same time an agile action of structuring the views in a tree structure, and an easy annotation activity, was the Cintoo platform. The use of such a platform also allows tags to be attached to the recognized elements. (Figure 27 and Figure 28).
In this way, when an element with its characteristics is recognized, it is highlighted in the model, and therefore all operators working on the project will be made aware of which items and objects have already been recognized and recorded in the DB. At the time of writing this paper, other platforms with similar features have been presented in the market, such as Atis Cloud [100] and Benaco (Figure 29) [101,102].

6.5. Virtual Tour Approach

The approach followed to recognize items and their associated attributes in spherical photographs can be managed in two ways:
  • The first, which is essential, is for the images to be navigable in a Virtual Tour style mode. The operator recognize the assets in the image and has to annotate separately the location where the assets recognized is present. This approach is very manual based, and the operator has always to be aware of the position of the image inside the complex of buildings, during his travel along the trajectories.
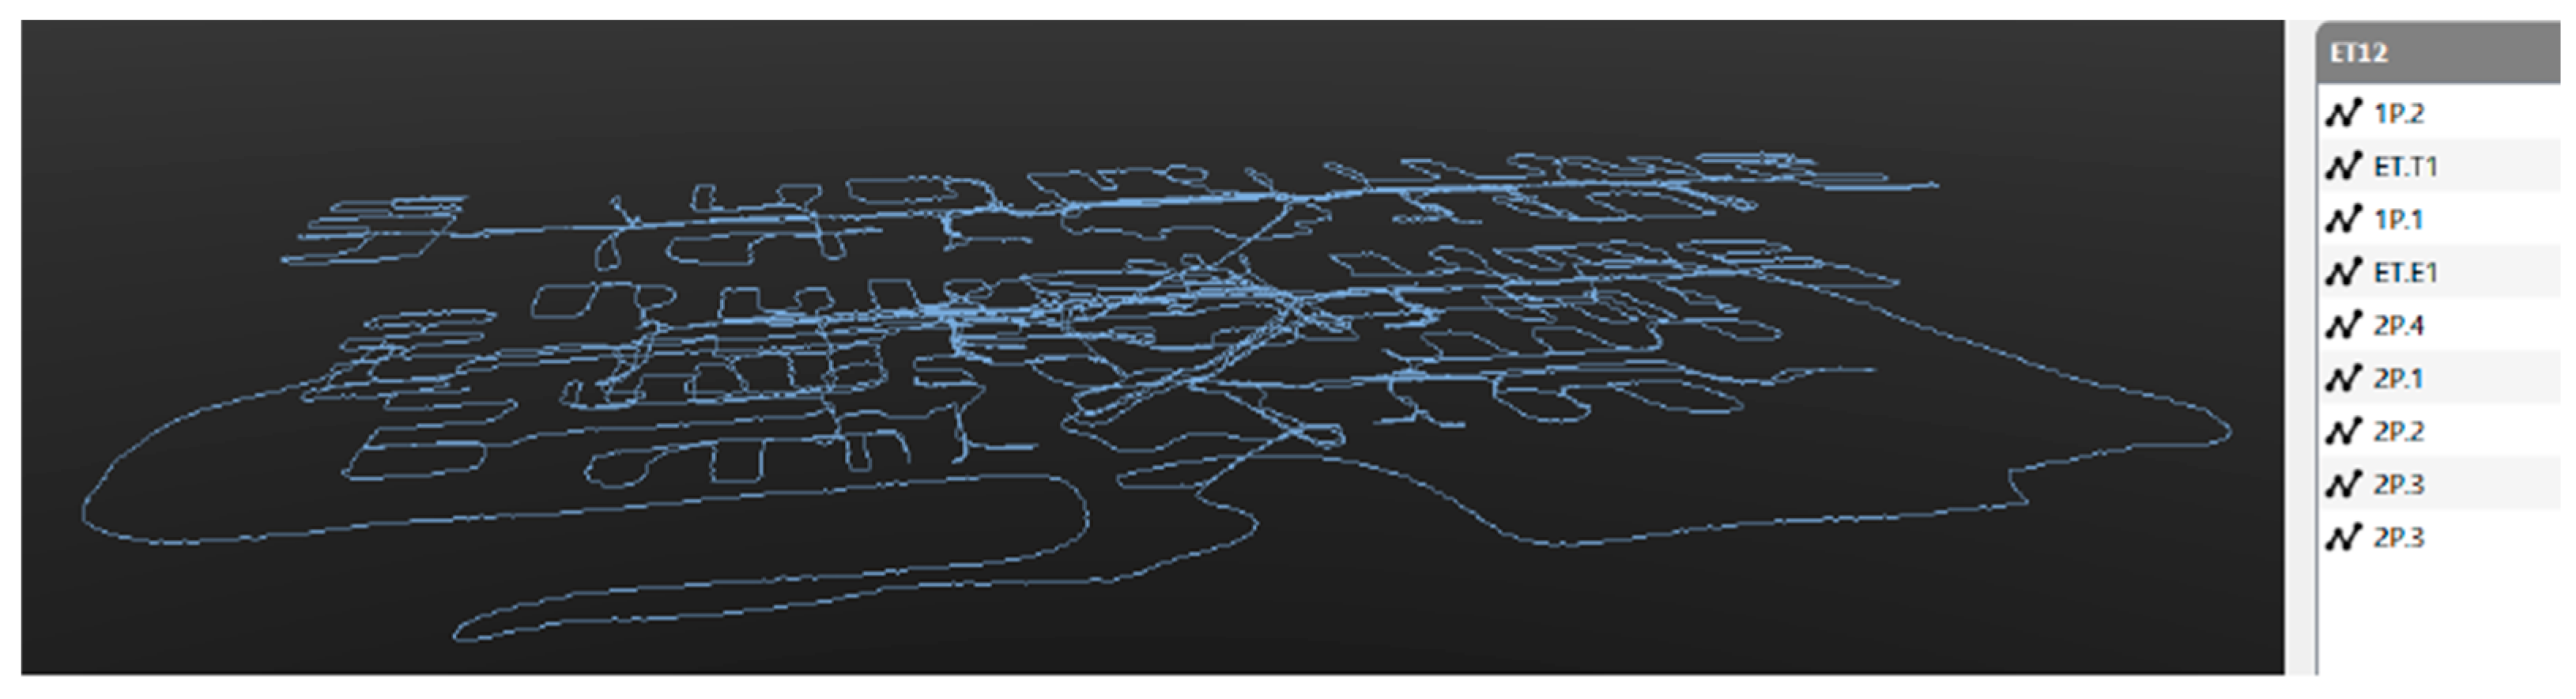
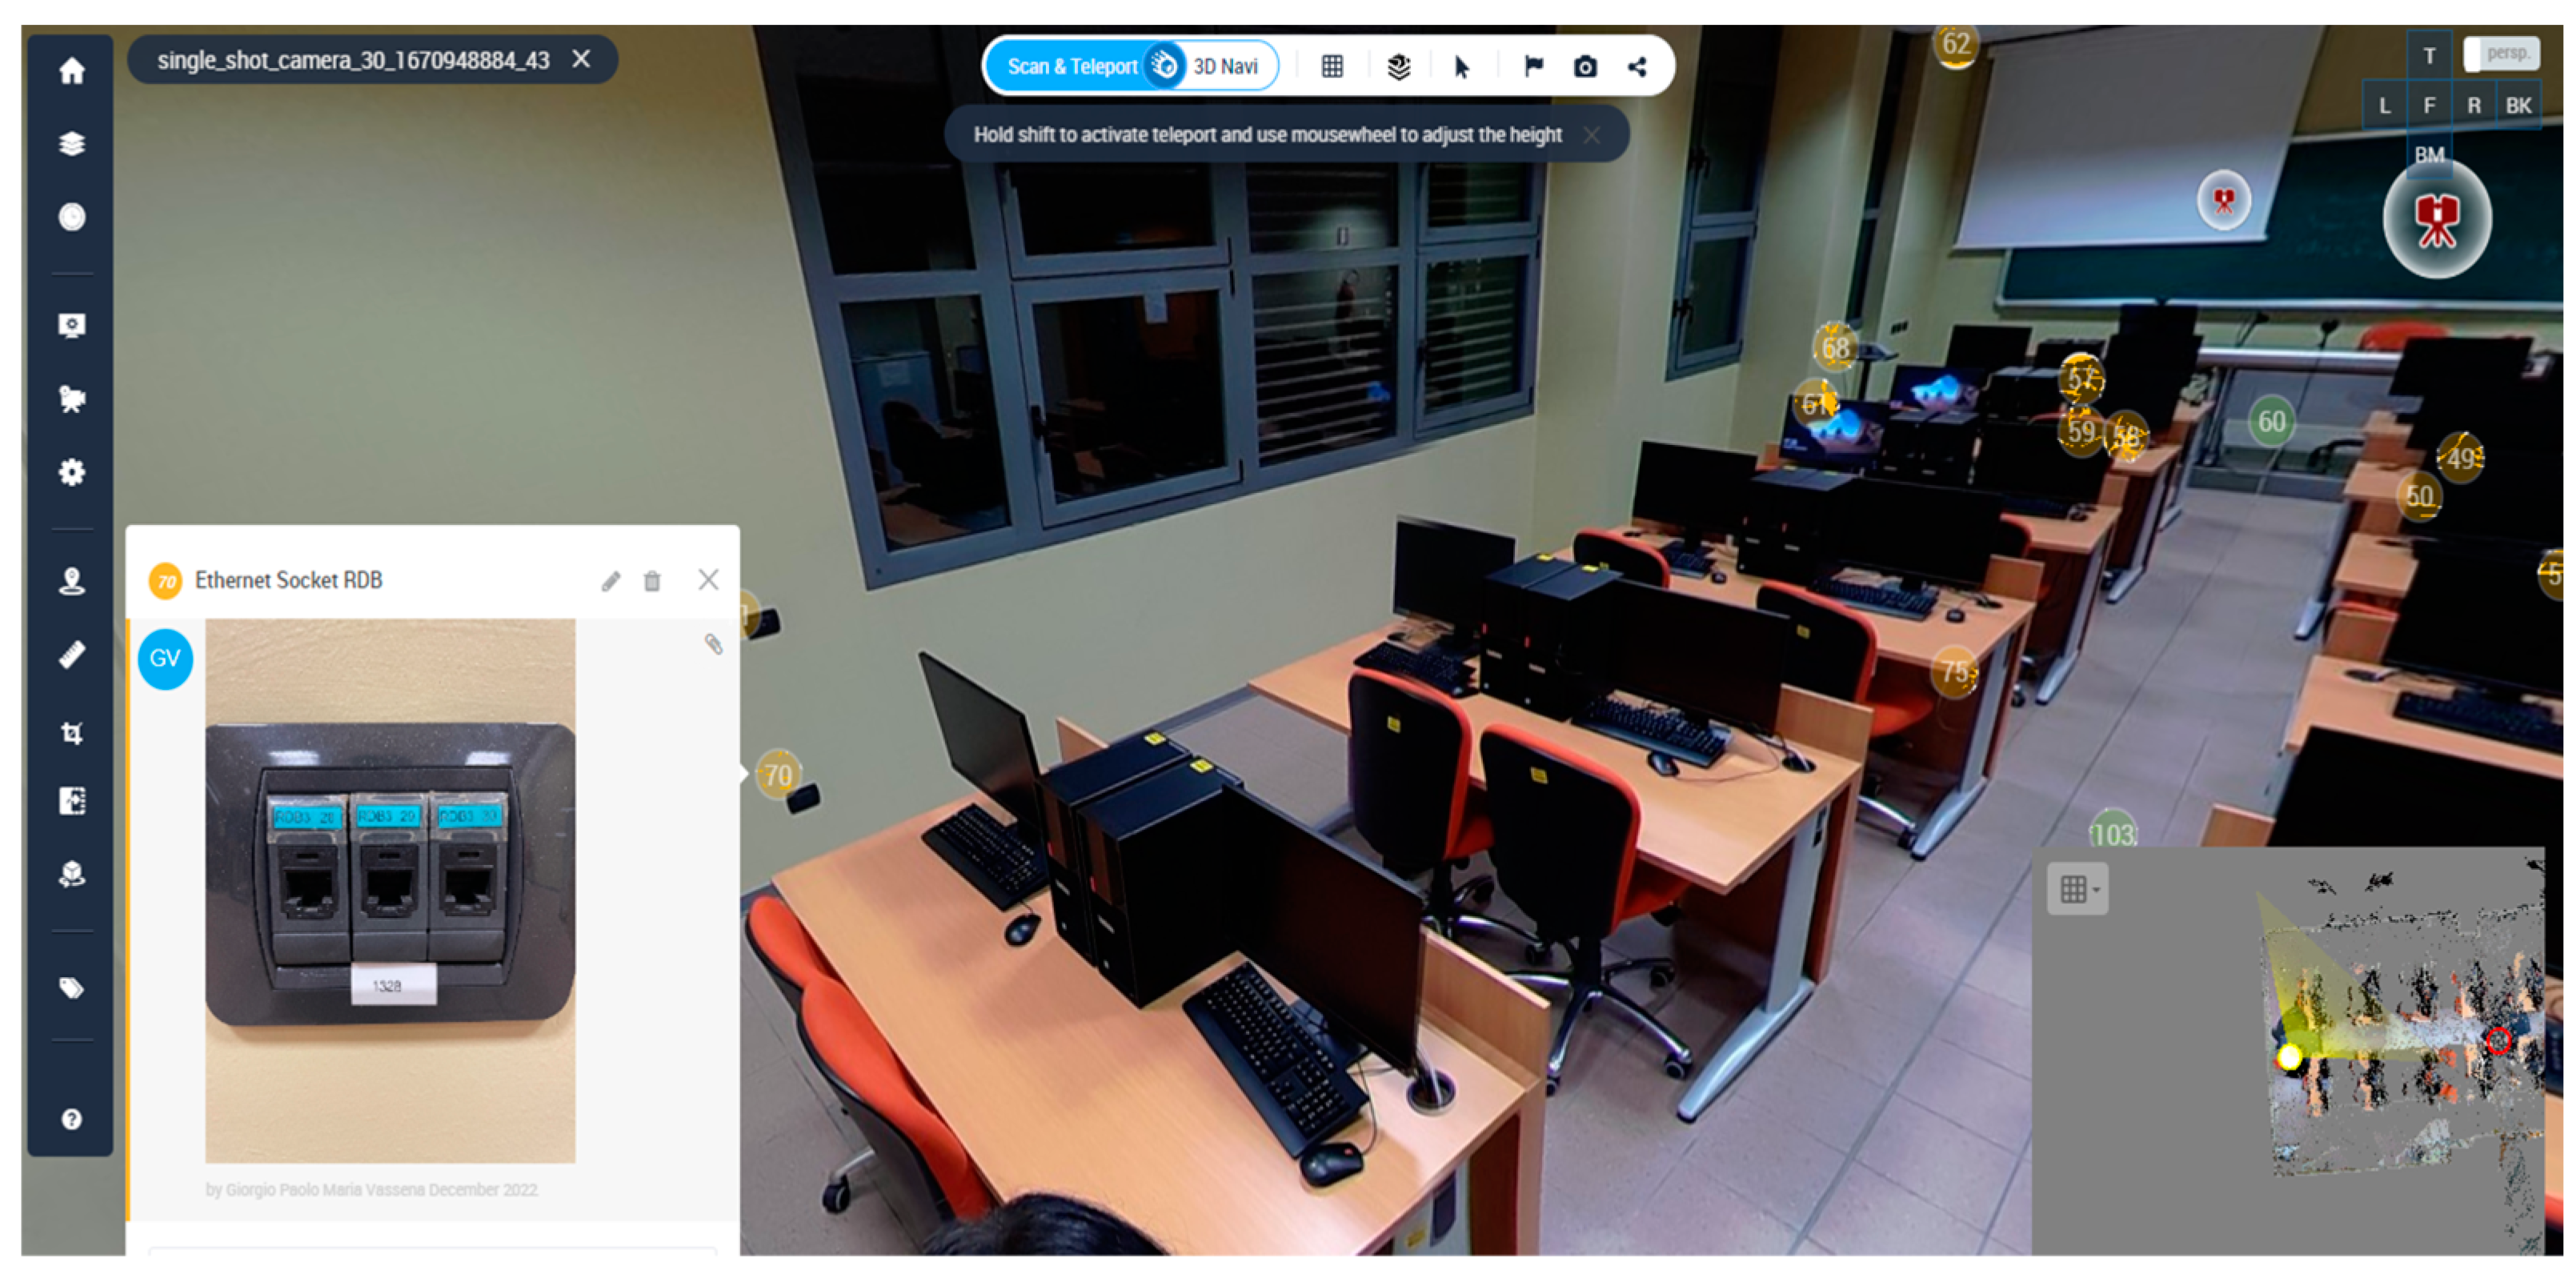
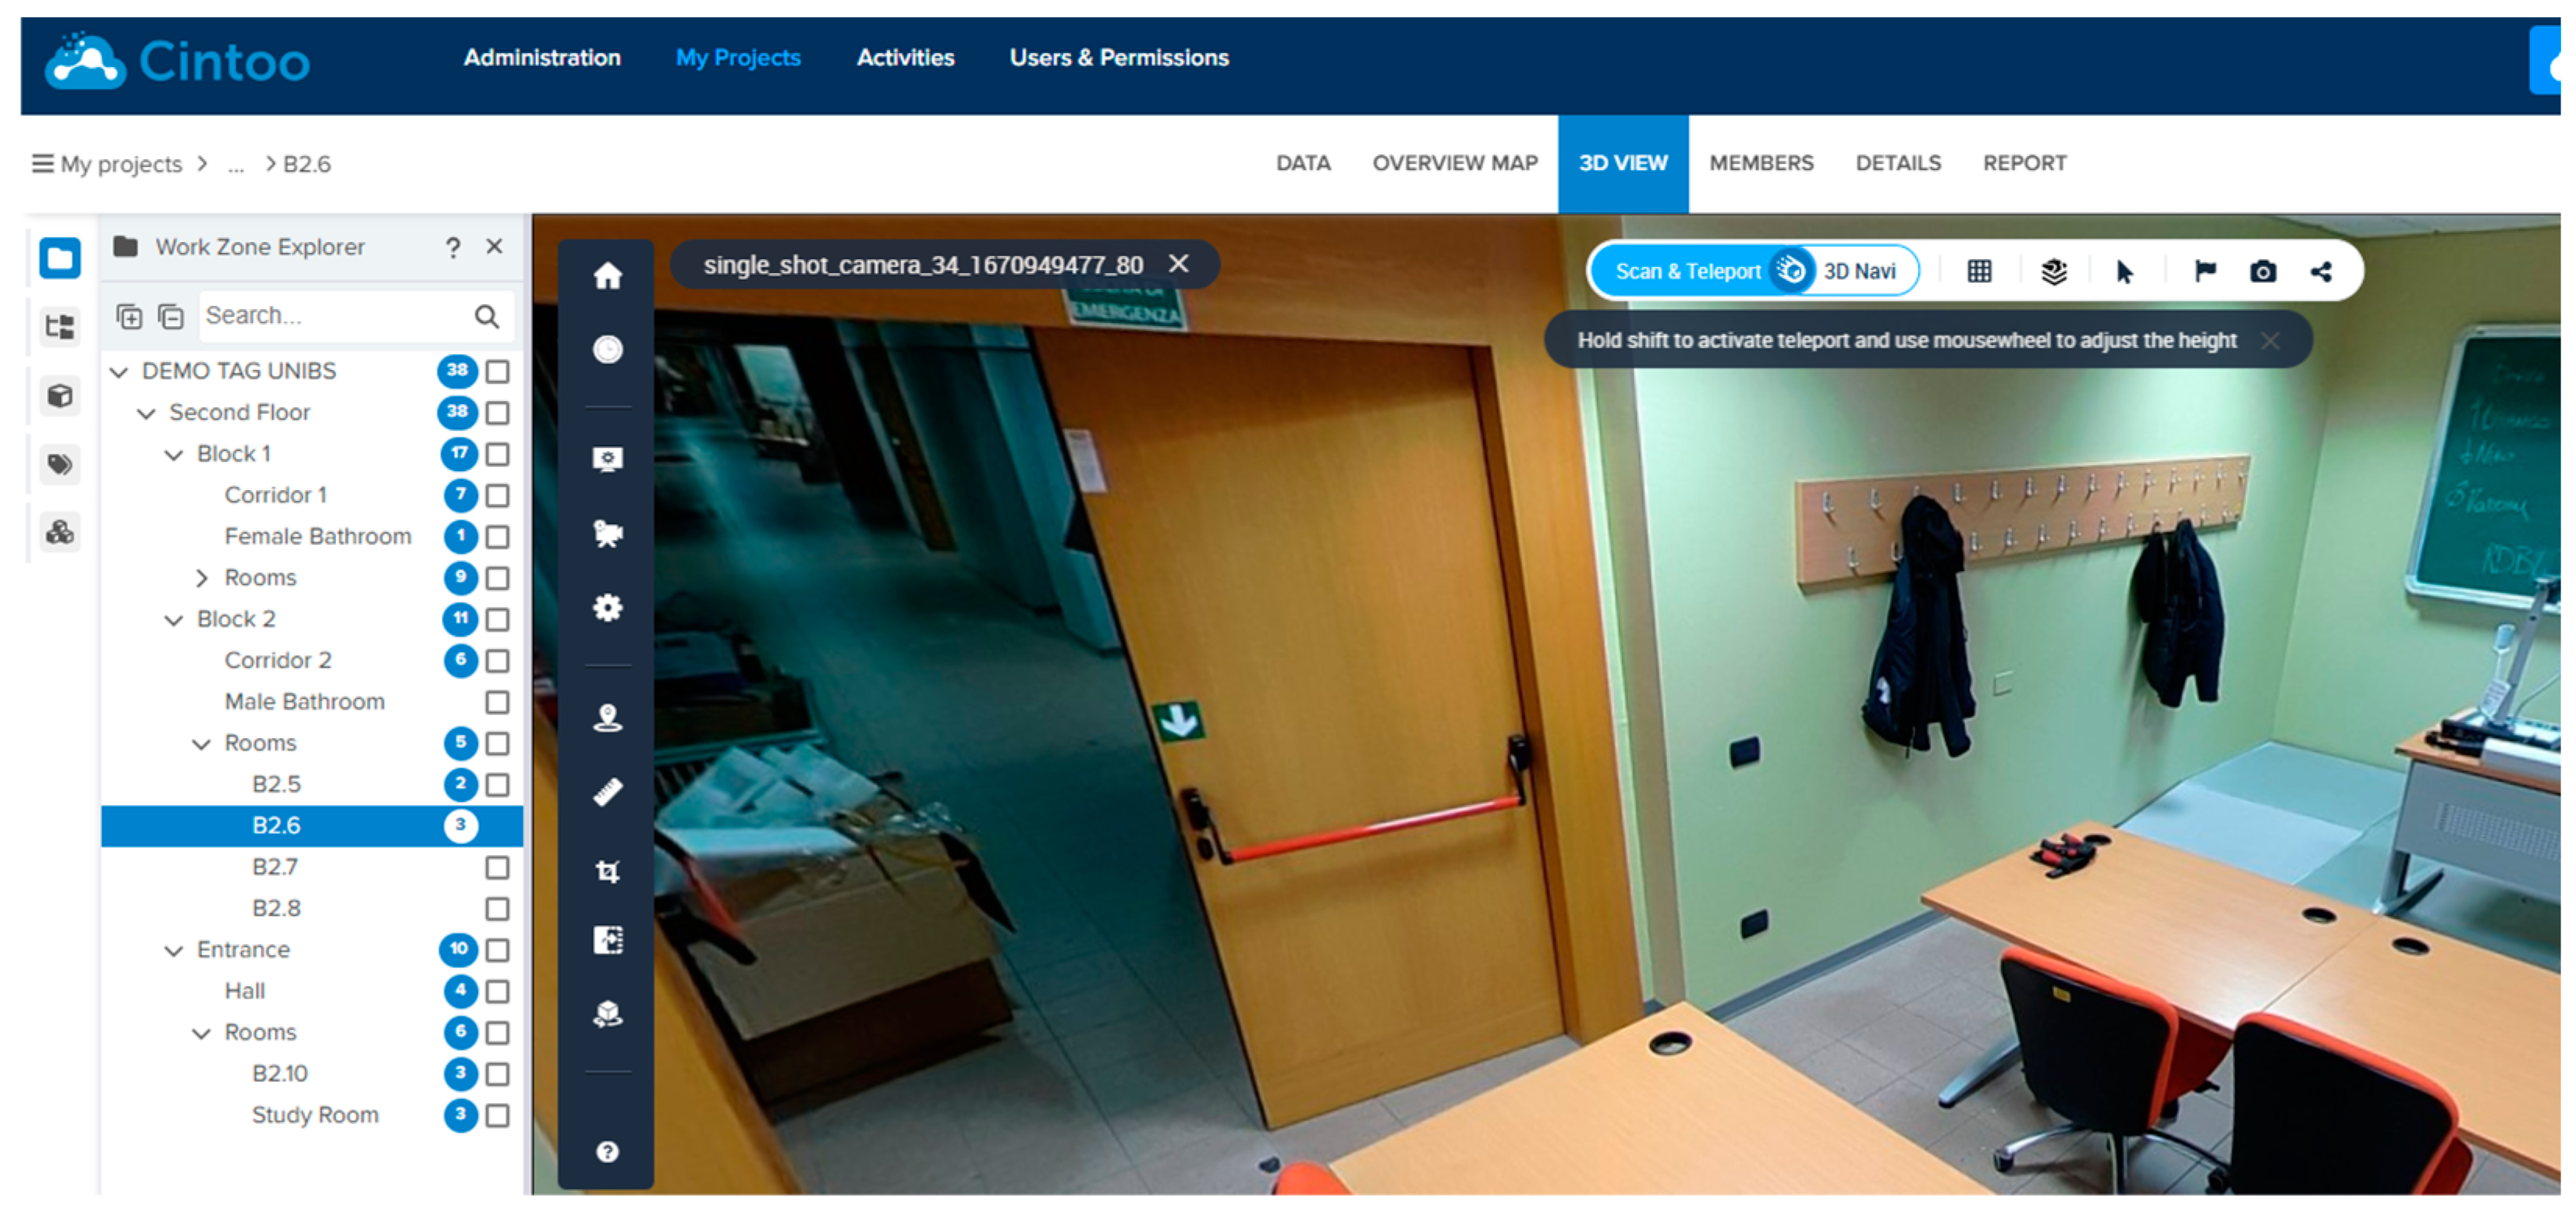
  • The second, which is optimal but not easy to implement, involves having the spherical images organized in a tree structure in which the corresponding images are listed for each building environment in the agreed structure. This approach first requires that all images be organized in a directory structure and that the software platform used for such navigation allow the organization of the data i.e., spherical views with such a structure. (Figure 30).
This approach of navigating between areas of the building complex, requires that each image be associated with the name or code of the area where that image has been acquired in order to facilitate the association of items to different zones of the complex. For example, in the navigation phase for the recognition of items in the images, the operator who intends to observe the spherical image(s) acquired, for example, the landing located on the 3rd floor, of staircase H, of Building B in Complex A, will simply have to select in the data navigation platform, the relevant directory, and not arrive at that data forcedly through a virtual journey starting from the entrance of the building complex to the required room. In this way, the technician who has to recognize the items can simply type in the name of the area of interest and immediately observe the images captured in that area.

6.6. Improvement on the Instrument

Optimal would be to have an iMMS instrument that is equipped also with a real-time tagging system that can be governed directly in the field by the surveyor. A surveyor moving within a building can in this way easily and without loss of time, signaling in the instrument when a room or zone changes, such as moving from a hallway to a room, by linking in real time each spherical image with physical space in the building complex and/or building in which the image has been acquired. Unfortunately, commercially available iMMS systems, including the Heron system, have tagging systems that are still very crude, and not very effective in the field. For this reason, in the survey activities of the Milan project, image/area code association was only occasionally performed, due to the high costs that such post-processing operations would have required.

7. Archiving of Surveyed data and Management of Survey Results

For a project of this importance, a crucial aspect is the organization of the flow of the surveyed data, the manner in which the results are delivered, and the archiving of the results. Such data flow must facilitate:
  • the quality control actions of the survey operations and the delivered deliverables
  • the data navigation and asset recognition operations by MM technicians
  • the archiving of the survey products
The project includes an intensive and accurate in-progress review phase of the surveying activities. In particular, an accurate GANTT has been drawn up, in which the survey activities have been scheduled. During the survey activities the surveyors adopted procedures of continuous communication with MM to manage and plan the field survey activities, coordinate access at the building complexes, and manage the survey timelines, processing and delivery of all deliverables in an organized way.

7.1. In-Process Testing

For such a massive surveying project, practical procedures for verification of activities were rigorously established to minimize the possibility of activities not being carried out in quality. The work-in-progress testing activities required that 5 percent of the surveys be totally verified, and only if frequent nonconformities were found that number of tests would have to be increased. The main objective of the testing of the activities was not only to verify that the results of the surveys complied with the specifications, but more importantly that the procedures for performing the surveys followed the defined criteria and rules. For all complexes, it was also planned to verify the quality of all acquired images and verification that there were no problems in uploading the three-dimensional and photographic data to the Cintoo online data sharing platform. This operation also made it possible to highlight any gross errors in the three-dimensional reconstruction of the model of the surveyed buildings.

7.2. Management of the Raw Field-Detected Data

With regard to the raw data detected in the field, the surveyors once the post-processing activity of the data detected in the field for a building complex was completed, were required to share the raw data detected by Heron and the files produced by the SLAM (Heron Desktop) post-processing software and the point cloud model and images of the complex, in the project format of the Reconstuctor point cloud management software. In this way, the quality test staff was enabled to navigate the project within the Reconstructor platform, verifying the correct alignment of the point cloud model and compliance with all design specifications. As mentioned in 7.1, for 5 percent of the surveying, the tester group would have to repeat the entire data post-processing process from raw data to the final model. Moreover within the Reconstructor platform, the tester provided quality verification of all photographic captures acquired with the mobile system. After the testing operations were completed and only after the delivery of the data in the e57 format with images and subsequent uploading to the Cintoo platform, the raw data of the Heron survey (consisting of all acquired images, the data files taken from the LiDAR sensors, and the inertial sensor file), the Heron Desktop software management files, and the Reconstructor project files, could be removed from the server. Such data are not mantained in the archive.

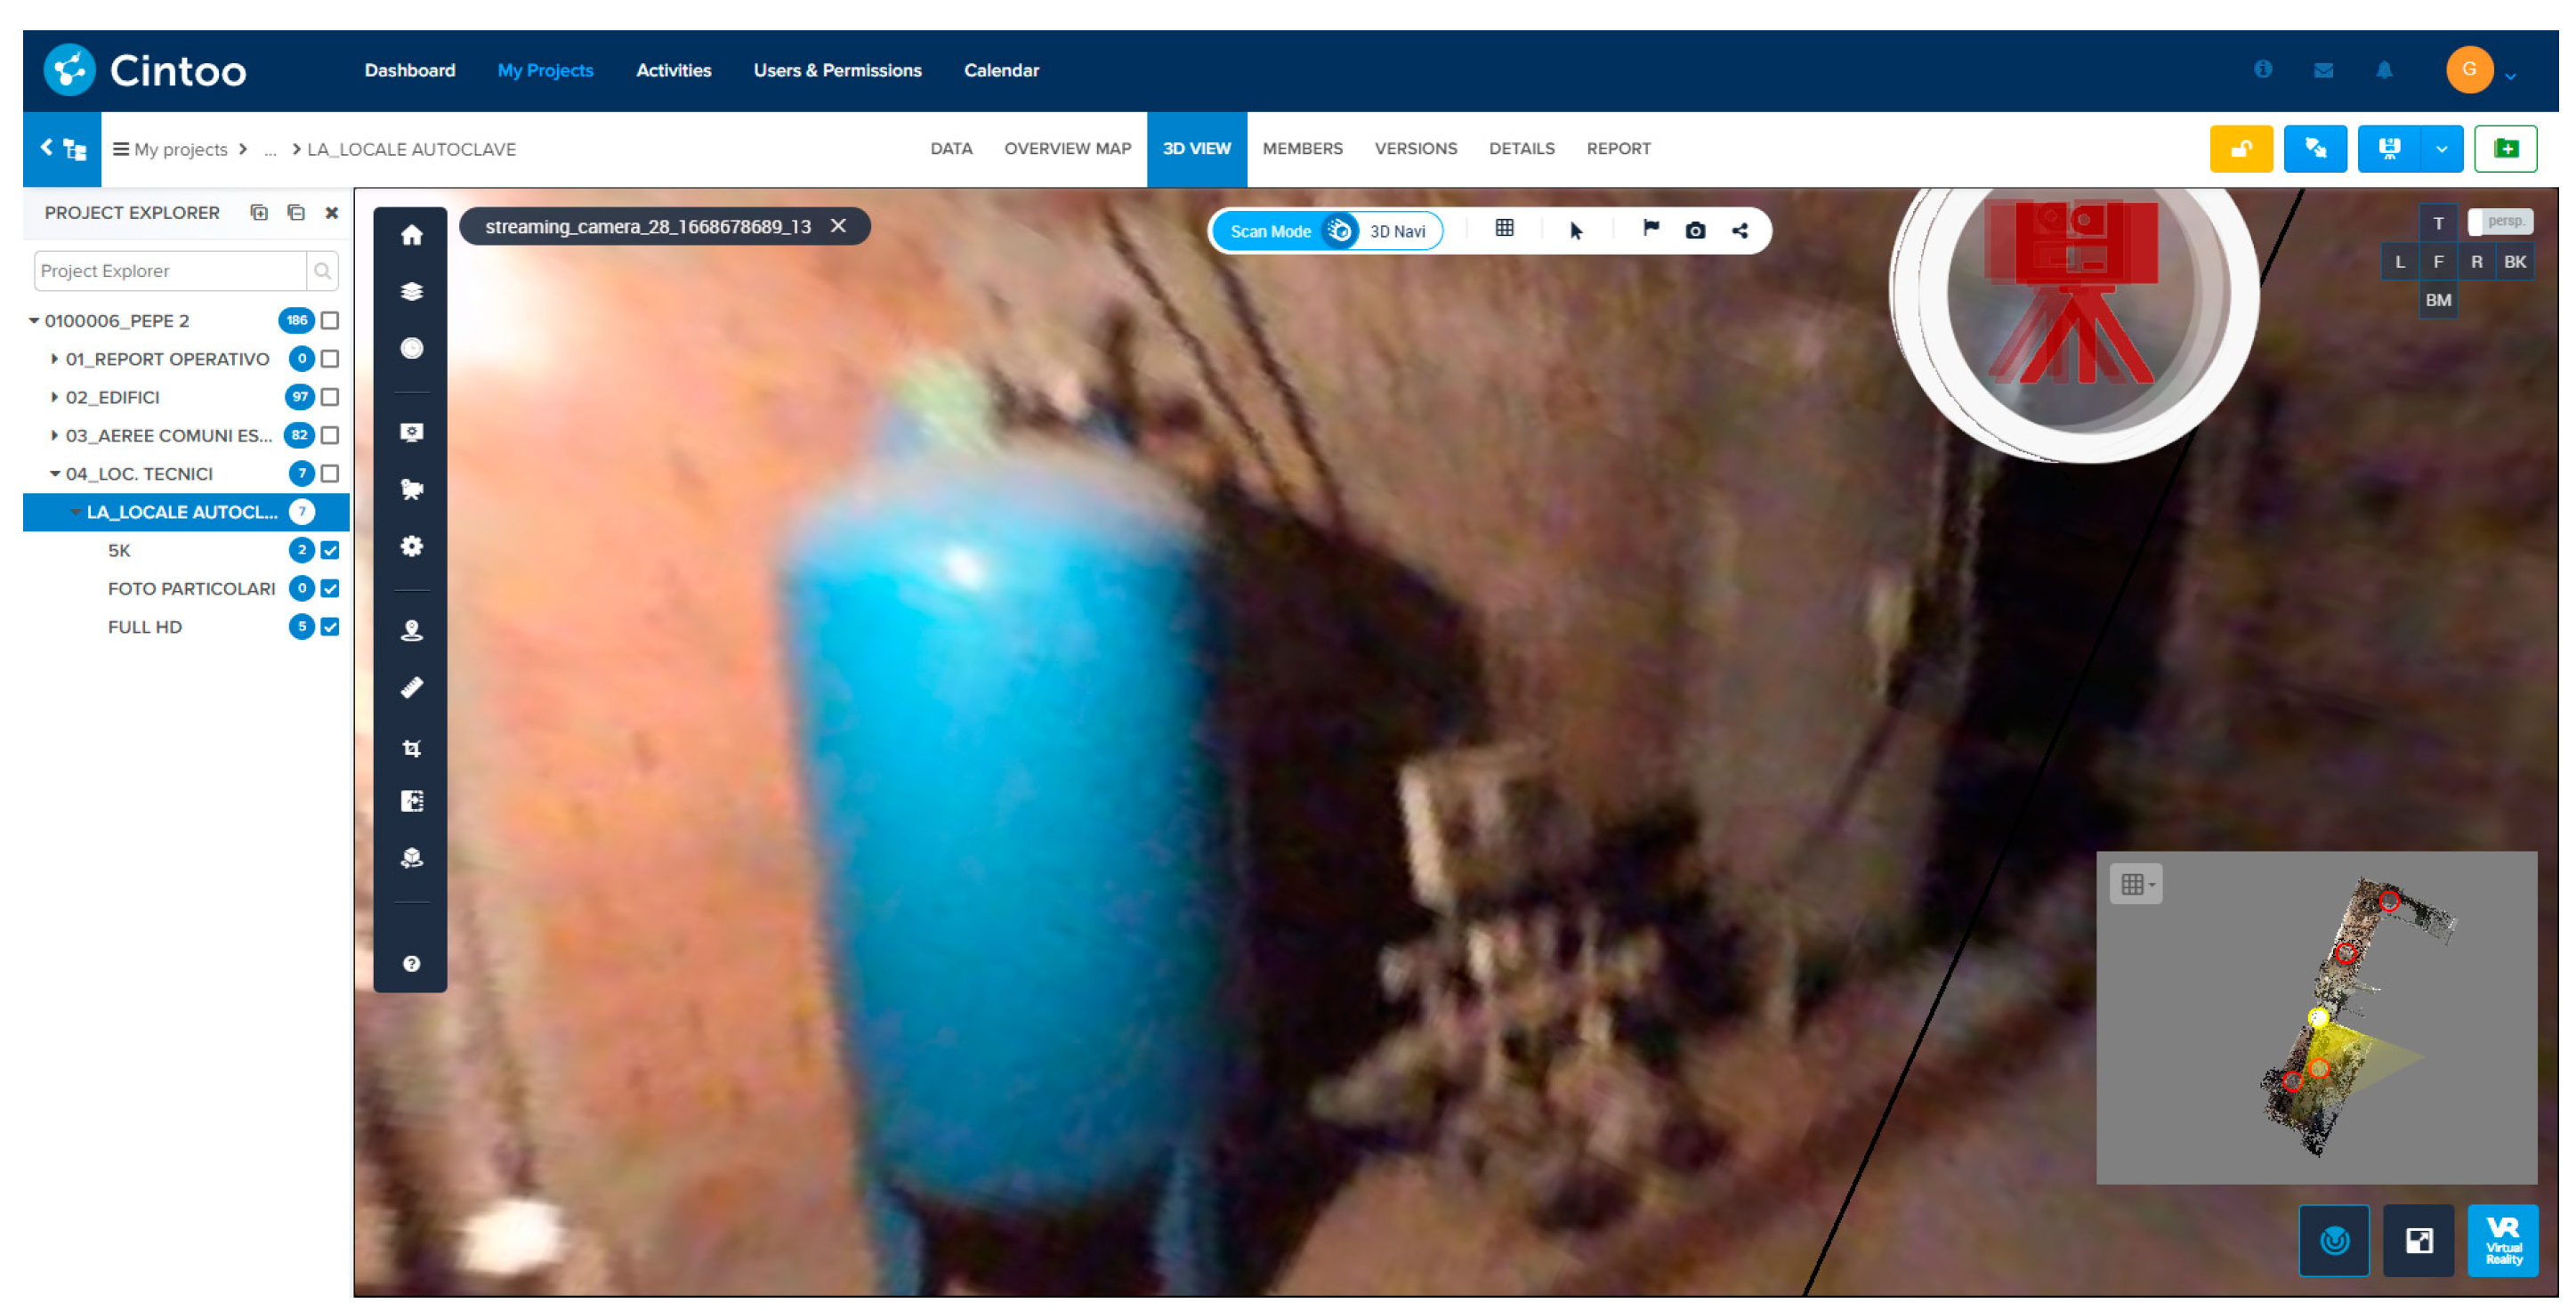
7.3. Uploading the Data to Cintoo Platform

Concurrently with the delivery of the data in formats compatible with the technical platforms for post-processing the data, the surveyor would then upload the model of the complex to the Cintoo web-based platform. Where possible this data was uploaded in a tree structure, with the images divided into appropriate directories. The quality test team would perform verification that in uploading the data from the technical data processing software Reconstructor, to the Cintoo web based platform was performed correctly. On that data, MM technicians could then begin the asset recognition activity by navigating within the Cintoo platform. In order to limit the cost of managing Cintoo’s server space, only a limited number of models of complexes were simultaneously maintained online in the shared space.

7.4 Archiving of the Surveyed Data

The final product of the three-dimensional survey, consists of a point cloud with associated spherical images acquired by the HERON, as well as other secondary products such as orthophotos of building facades. Such a data structure from the mobile technology survey is managed, in the Milan Project, by the surveyor within the Reconstructor software but the final product, is a unique point cloud model, of the entire complex (Figure 31 and Figure 32), often organized in directories according to the structure (Table 1) and in the e57 interchange format with images in JPG format.
Such three-dimensional data represents an important value for MM, such that it can be put to asset. Furthermore, in the Milan project it was placed as a constraint that the final archived data, should be in an open format not locked to proprietary software and formats. So the entire amount of surveyed data, separated by building complexes, and in turn in the above-mentioned directory structure, was archived in the company servers. In order to carry out asset recognition activities or for future uses of the three-dimensional data with images, technicians should therefore arrange for downloading the data to the company computers and browsing it in Reconstructor, either through the Cintoo platform or through different platforms that MM decided to exploit.

8. Survey Results

The large amount of survey work, involved intensive quality control activities to correct cases where data processing did not produce the results in accordance with the project specifications. The volume of the 3D data and images is closed to a value of 100 terabyte. The quality testing work, carried out by Gexcel, ensured that the results met the specifications. There were contained inconsistencies on numerous occasions, which are briefly described below.

8.1. Poor Image Quality

Ensuring the quality of the images was a very demanding task for the surveyors to guarantee, particularly due to problems of improper lighting of the photographed scene rather than excessive operator movement. In a few isolated cases, it was necessary to repeat image acquisition. The quality of the images generally was found to be adequate to ensure recognition of the assets in the pictures by the operators
Figure 33. An example of a blurry image. This defect happens when the on demand 5K resolution image is taken with the capture head on movement.
Preprints 150090 g033
Figure 34. For improper lighting is applied the images the results can be of underexposed images
Preprints 150090 g034

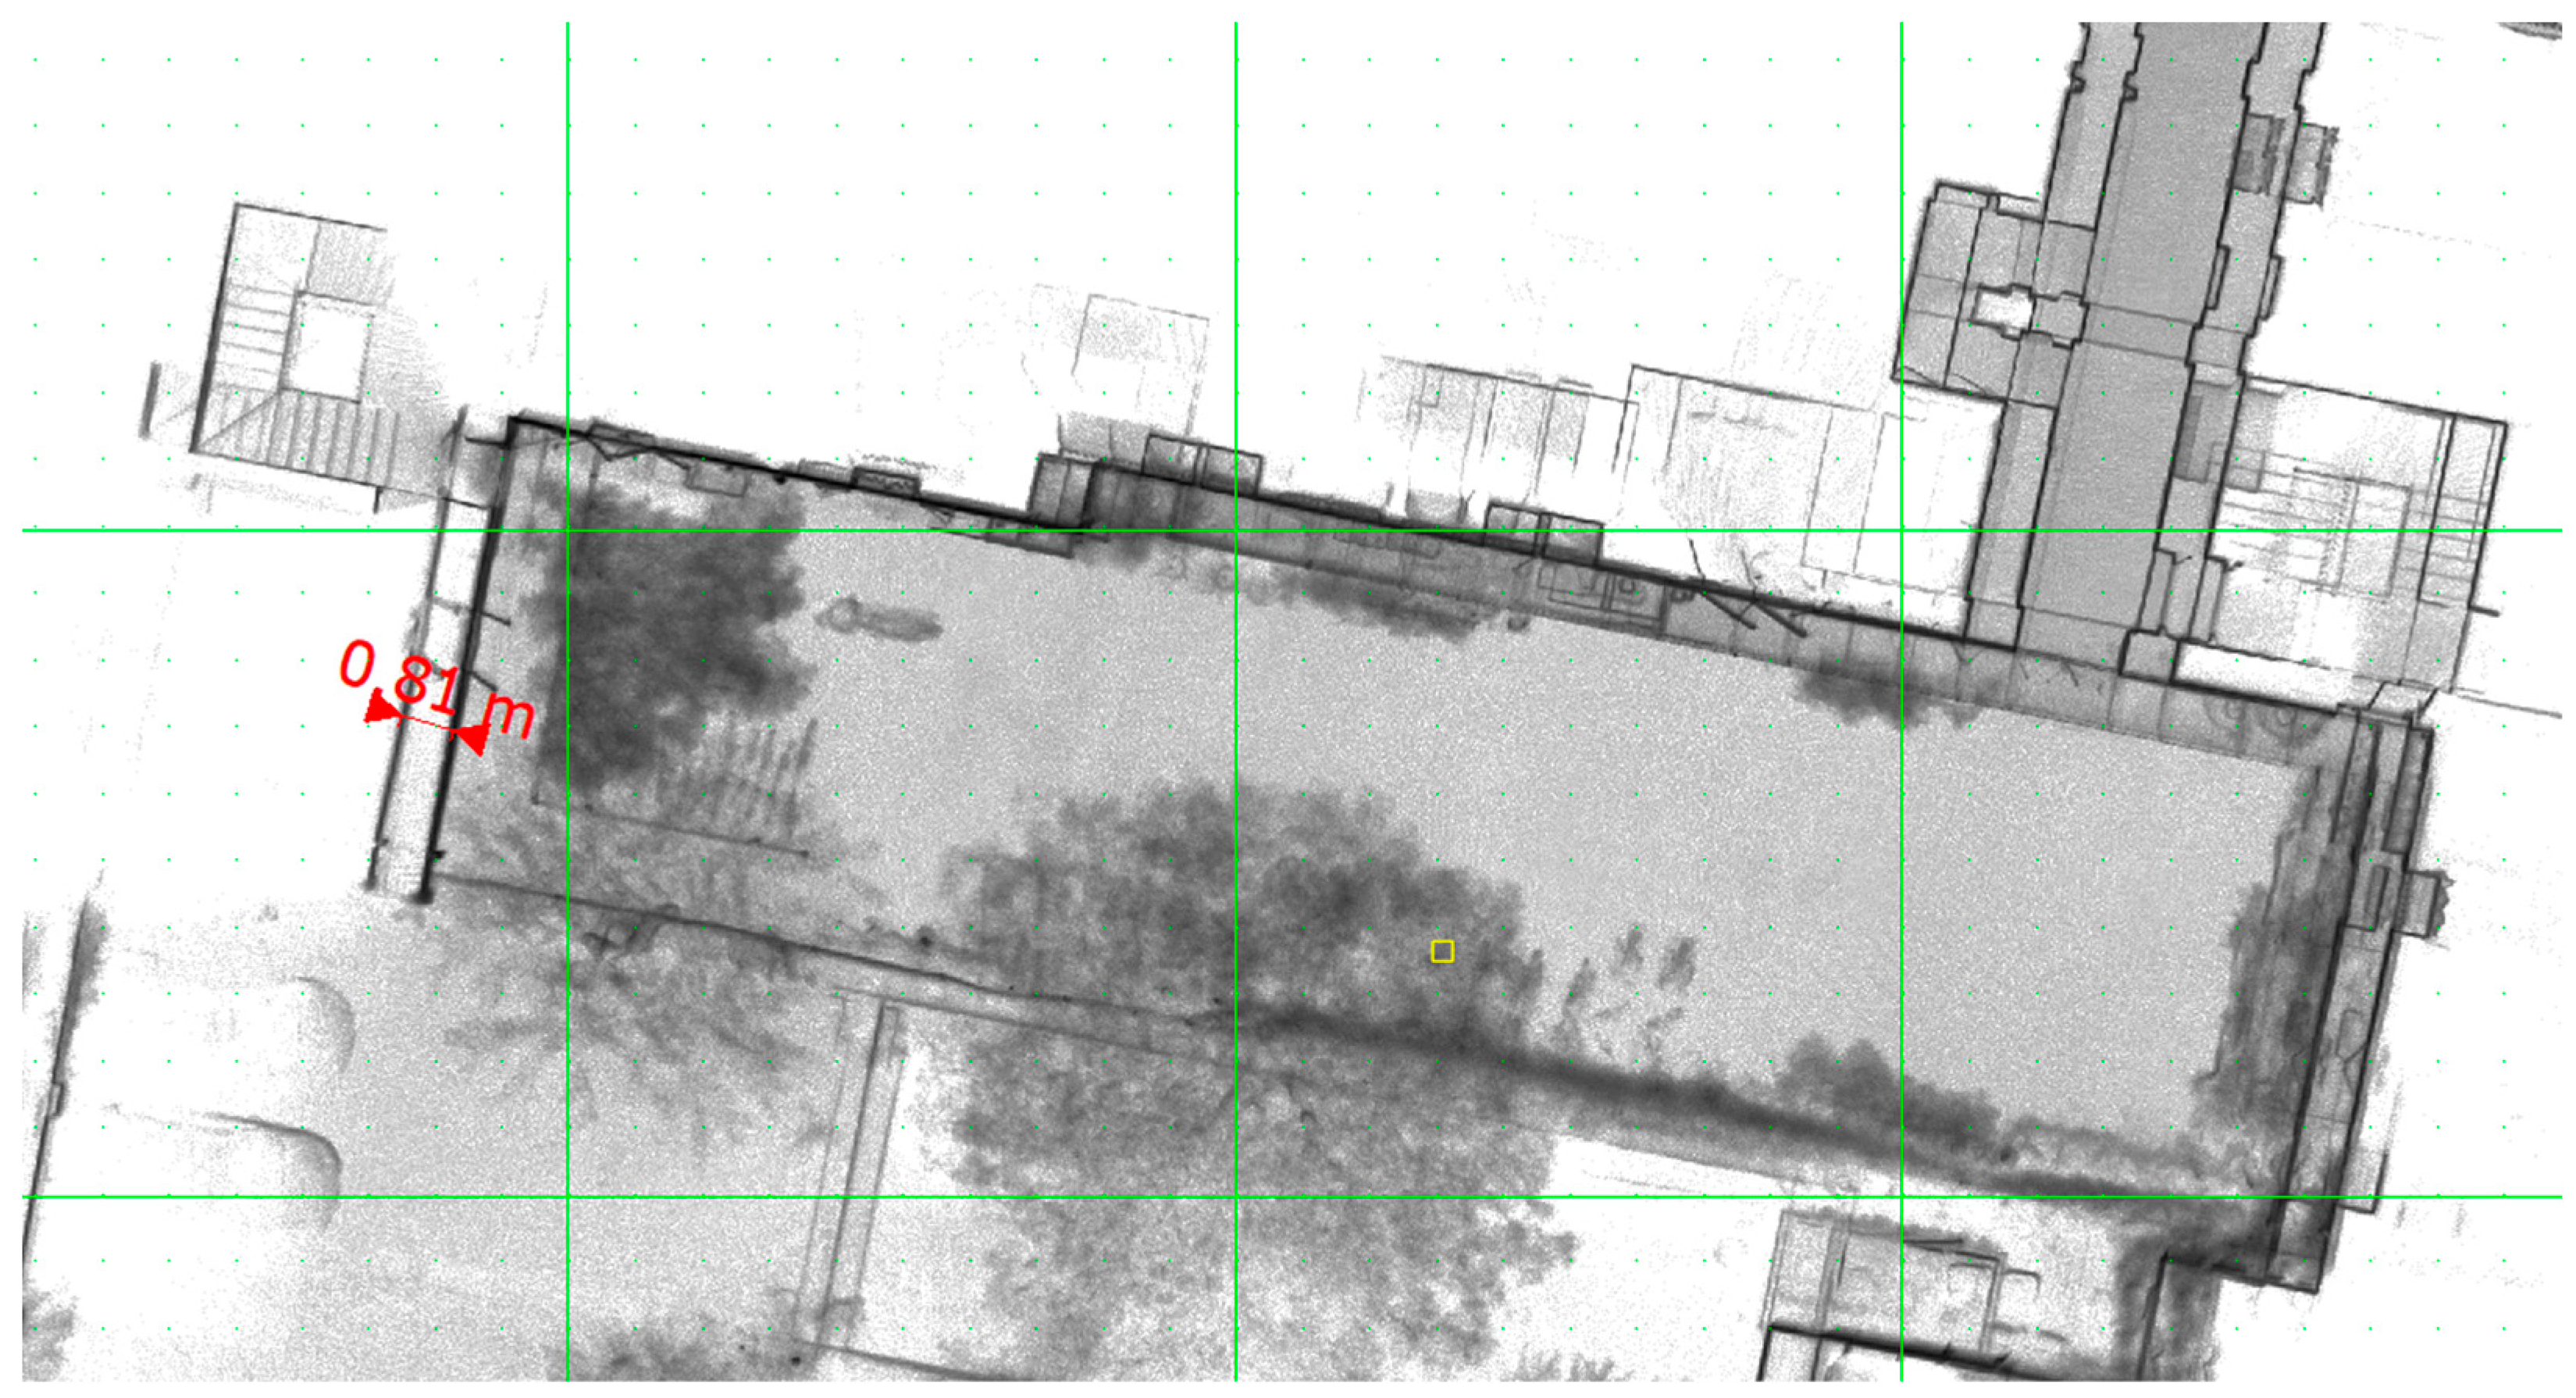
8.2. Misalignment Between Three-Dimensional Models

More serious than the quality of the images, but easier to be corrected, by a software reworking of the data, were the cases in which the survey trajectories were not joined correctly, thus not allowing the navigation of the model and generating overlaps between the three-dimensional models. In some cases, minor misalignments were found, which were nevertheless required to be corrected (Figure 35).
The work has been successfully completed, and all the data are stored in the servers of MM. Data can now be used to recognize and locate assets, or to address a wide variety of building management needs

9. Conclusions and Future Developments

First and foremost, the project met the basic requirement of conducting a census of the assets in the buildings. This recognition, which is currently performed directly by technicians, may see the implementation of machine learning and artificial intelligence algorithms. The prospects for the use of such technologies are obviously very interesting. Several tests are under development to apply AI technology in this application field.
The Milan project required a great effort of both preliminary and organizational study because of its highly innovative approach, which required the definition of survey specifications and data processing and management methodologies from zero.
The value of the acquired data is currently showing its full significance and a lot have to be done to give value at the huge surveying project.
In fact, having carried out a survey not only photographically but also with the three-dimensional component, in addition to enabling local measurements to be carried out in the mapped areas, as originally planned, is making possible to investigate the introduction of innovative technologies. Thus the Milan Project achieved the required result of creating a Digital Twin of all the building complexes managed by the engineering company. The three-dimensional point cloud model can be used to create BIM basic models, which can be employed for the implementation of on-site and real-time self-location technologies by maintenance workers rather than by the personnel responsible for updating the asset DB. Indeed, technologies are now available to support self-location of operators within simplified three-dimensional BIM models but also referring to simple point cloud models. For example, a platform such as Cupix [103], allows operators to self-locate within parametric models, but also using a simple, non-parameterized point cloud model as a reference. The goal now is to implement these new technologies so as to make the updating of the company’s data base rapid and sustainable, and in order to implement Digital Twin technologies to streamline the management processes of the social housing assets managed by MM. In particular at the University building dedicated to study rooms, a survey of it was carried out with the same instrumentation used to map the buildings of the City of Milan. From the point cloud obtained, a simplified BIM model of the building itself was extracted into the Dalux platform. The goal was not the realization of a detailed BIM model, but rather a simplified BIM model that can be produced quickly and functional only to support the self-localization features present in the Dalux platform. The all survey took few hours, including data processing while the extraction of the simplified BIM model took half a day of activity. A challenge that emerges during the processes of identifying and locating items and assets is the need to progressively associate attributes such as brand, type, installation date, scheduled maintenance date, and functional parameters (e.g., operational status, malfunction, or maintenance phase management) to each object. For extensive building assets, it would be advantageous for maintenance personnel, particularly those navigating large buildings for the first time, to automatically discover their exact position. This capability would facilitate prompt intervention in maintenance or repair tasks on the correct components and regions. For this reason some Facility Management platforms have implemented automated location features within buildings or construction sites. An exemplary case is the document management platform Dalux, which has developed a tool named SiteWalk, that enables an operator, equipped with a handheld or helmet-mounted camera, to self-locate within a building by merely capturing photographs of the surrounding environment. These solutions are gaining popularity; however, they are significantly constrained by the necessity of possessing a BIM model of the area for accurate localization. The BIM model of a building is increasingly accessible on new construction sites; however, this is not the case for extensive existing architectural heritage, where construction projects have not been conducted in BIM format and where plans and blueprints are frequently unavailable in digital form. In these kinds of situations, it is absurd to suggest doing an investigation aimed at developing the BIM model of the building complex solely to facilitate the implementation of the self-localization functionality described above.

Funding

This research received no external funding

Acknowledgments

We thank Tomaso Lamperti, Pietro Bianco and Maria Carbone to have provided sample data and information about the project. We thank Massimo Dierna and Matteo Sgrenzaroli of Gexcel, that, as part of the quality check team, have provided us data and information about the project and about the instrumentation used by the surveyors.

Conflicts of Interest

The author of the paper is the founder of the company Gexcel, and has collaborated to the definition of the technical specification of the Milan Project.

References

  1. Rocha, G.; Mateus, L. A survey of scan-to-BIM practices in the AEC industry—A quantitative analysis. ISPRS International Journal of Geo-Information, 10(8), 2021, p.564. [CrossRef]
  2. European Commission, Ministry of Development, Pwc. Roadmap for the Implementation of the BIM Methodology in Public Procurement. Digitization of the Construction Process in Poland; European Commission, Ministry of Development: Brussels, 2020, Belgium.
  3. Federal Ministry of the Interior and Community; Federal Ministry of Defence; Bundesbau. BIM Master Plan for Federal Buildings. Explanatory Report; Bundesbau: Germany, Berlin, 2021.
  4. Ministry of Digital Governance. Digital Transformation Bible 2020–2025; Ministry of Digital Governance: Athens, Greece, 2021.
  5. Ministry of Territorial Cohesion and Relations with Local Authorities. Plan BIM 2022; Ministère de la Cohésion des Territoires et des Relations avec les Collectivités Locales: Paris, France, 2018.
  6. European Commission. Digital Economy and Society Index (DESI) 2022. Integration of Digital Technology; Publication Office of the European Union: Brussels, Belgium, 2022.
  7. Mitera-Kiełbasa, E.; Zima, K. BIM Policy in Eastern Europe. Civil and Environmental Engineering Reports. 33. 14-22. 2024. [CrossRef]
  8. European Construction Sector Observatory: Digitalisation in the construction sector, Analytical Report, 2021.
  9. Croatian Chamber of Civil Engineers. Guidelines for the BIM Approach in Infrastructure Projects; Croatian Chamber of Civil Engineers: Zagreb, Croatia, 2021.
  10. McAuley, B.; Hore, A.V.; West, R.P. The Irish Construction Industry’s State of Readiness for a BIM mandate in 2020. In Proceedings of the Civil Engineering Research in Ireland 2020 Conference, Cork, Ireland, 27–28 August 2020; pp. 740–745. [Google Scholar].
  11. Turk, Ž. Structured analysis of ICT adoption in the European construction industry. Int. J. Constr. Manag. 2023, 23, 756–762. [Google Scholar] dor: 10.1080/15623599.2021.1925396Wang Q.; Kim M.K. Applications of 3D point cloud data in the construction industry: A fifteen-year review from 2004 to 2018. Adv Eng Inform. 2019, 39: Pgg. 306–319. [CrossRef]
  12. Keitaanniemi, A.; Virtanen, J. P.; Rönnholm, P.; Kukko, A.; Rantanen, T.; Vaaja, M. T. The combined use of SLAM laser scanning and TLS for the 3D indoor mapping. Buildings, 2021, 11(9), 386. [CrossRef]
  13. Dąbek, P.; Wodecki, J.; Kujawa, P.; Wróblewski, A.; Macek, A.; Zimroz, R. 3D point cloud regularization method for uniform mesh generation of mining excavations. ISPRS Journal of Photogrammetry and Remote Sensing, 218, 2024, pp. 324-343. [CrossRef]
  14. Hu, D.; Gan, V. J.; Yin, C. Robot-assisted mobile scanning for automated 3D reconstruction and point cloud semantic segmentation of building interiors. Automation in Construction, 2023, 152, 104949. [CrossRef]
  15. Warchoł, A.; Karaś, T.; Antoń, M. Selected qualitative aspects of LiDAR point clouds: GeoSLAM ZEB-REVO and Faro Focus 3D X130. The International Archives of the Photogrammetry, Remote Sensing and Spatial Information Sciences, 2023, 48, pp: 205-212. [CrossRef]
  16. Roggeri, S.; Vassena, G. P. M.; Tagliabue, L. C. Scan-to-BIM efficient approach to extract BIM models from high productive indoor mobile mapping survey. In proceedings of International Structural Engineering and Construction, 2022, 9, 1-6. [CrossRef]
  17. Abreu, N. ; Pinto, A. ; Matos, A. ; Pires, M. Procedural point cloud modelling in scan-to-BIM and scan-vs-BIM applications: A review. ISPRS International Journal of Geo-Information, 2023, 12(7), 260. [CrossRef]
  18. Coldwell, H.; Qiu, X.; Lei, Z.; Gong, M.; Rankin, J. A Review of Scan-To-BIM Technologies in Assisting Project Coordination and Management. Transforming Construction with Off-site Methods and Technologies Conference: Designing Tomorrow’s Construction, Today. Off-site Construction Research Center, Northumbria University, Fredericton, New Brunswick, Canada 2024.
  19. Kim, Y.; Nguyen, C.H.P.; Choi, Y. Automatic pipe and elbow recognition from three-dimensional point cloud model of industrial plant piping system using convolutional neural network-based primitive classification. Autom Constr 2020, 116:103236. [CrossRef]
  20. Kawashima, K.; Kanai, S.; Date, H. As-built modeling of piping system from terrestrial laser-scanned point clouds using normal-based region growing. Journal of Computational Design and Engineering, 2014, 1(1), pp: 13-26. [CrossRef]
  21. Czerniawski, T.; Nahangi, M.; Haas, C.; Walbridge, S. Pipe spool recognition in cluttered point clouds using a curvature-based shape descriptor. Autom Constr 2016, 71: Pp: 346–358. [CrossRef]
  22. Nguyen CHP, Choi Y (2018) Comparison of point cloud data and 3D CAD data for on-site dimensional inspection of industrial plant piping systems. Autom Constr 91: Pp: 44–52. [CrossRef]
  23. Abreu, N.; Pinto, A.; Matos, A.; Pires, M. Procedural point cloud modelling in scan-to-BIM and scan-vs-BIM applications: A review. ISPRS International Journal of Geo-Information, 12(7), 2023, p.260. [CrossRef]
  24. Adekunle, S.A.; Aigbavboa, C.; Ikuabe, M.; Barriers to Scan to BIM Implementation on Historic Buildings. In International Conference on Engineering, Project, and Production Management. 2023, pp: 305-315. Cham: Springer Nature Switzerland. [CrossRef]
  25. Croce, V.; Caroti, G.; Piemonte, A.; De Luca, L.; Véron, P. H-BIM and artificial intelligence: Classification of architectural heritage for semi-automatic scan-to-BIM reconstruction. Sensors, 2023, 23(5), p.2497. [CrossRef]
  26. Croce, V.; Caroti, G.; Piemonte, A.; De Luca, L.; Véron, P. H-BIM and artificial intelligence: Classification of architectural heritage for semi-automatic scan-to-BIM reconstruction. Sensors, 2023, 23(5), p.2497. [CrossRef]
  27. Akca, D. Full automatic registration of laser scanner point clouds. ETH Zurich. 2003. [CrossRef]
  28. Theiler, P. W.; & Schindler, K. Automatic registration of terrestrial laser scanner point clouds using natural planar surfaces. ISPRS Annals of the Photogrammetry, Remote Sensing and Spatial Information Sciences, 2012, 1, pp: 173-178. [CrossRef]
  29. Dias, P. ; Sequeira, V. ; Gonçalves, J. G. ; Vaz, F. Automatic registration of laser reflectance and colour intensity images for 3D reconstruction. Robotics and Autonomous Systems, 2002, 39(3-4), pp: 157-168. [CrossRef]
  30. Yao, J.; Ruggeri, M. R.; Taddei, P.; Sequeira, V. Automatic scan registration using 3D linear and planar features. 3D Research, 2010, 1(3), 1-18. [CrossRef]
  31. Li, R. Mobile mapping: An emerging technology for spatial data acquisition. Photogrammetric Engineering and Remote Sensing, 1997, 63(9), pp:1085-1092.
  32. Bossler, J. Feature Positioning Accuracy in Mobile Mapping: Results Obtained by the GPSV an TM. International archives of photogrammetry and remote sensing, 1996, 31, pp:139-142.
  33. Tao, C. V. Mobile mapping technology for road network data acquisition. Journal of Geospatial Engineering, 2000, 2(2), pp: 1-14.
  34. Hunter, G.; Cox, C.; Kremer, J. Development of a commercial laser scanning mobile mapping system–StreetMapper. Int. Arch. Photogramm. Remote Sens. Spat. Inf. Sci, 2006, 36, pp: 17-18.
  35. Dissanayake, M.G.,; Newman, P.; Clark, S.; Durrant-Whyte, H.F. ; Csorba, M. A solution to the simultaneous localization and map building (SLAM) problem. In: EEE Transactions on robotics and automation, 2001, 17(3), pp: 229-241. [CrossRef]
  36. Thrun, S.; Burgard, W.; Fox, D. A. Probabilistic Approach to Concurrent Mapping and Localization for Mobile Robots. Machine Learning, 1998, 31, pp: 29–53. [CrossRef]
  37. Borenstein, J.; Everett, H. R.; Feng, L. Navigating mobile robots: Systems and techniques. AK Peters, Ltd.. United States. 1997. ISBN: 1568810660 Published: 01 January 1997.
  38. Fox, D.; Burgard, W.; Thrun, S. Probabilistic methods for mobile robot mapping. In Proc. of the IJCAI-99 Workshop on Adaptive Spatial Representations of Dynamic Environments. 1999. pp: 565-283.
  39. Yamauchi, B.; Schultz A.; Adams, W. Mobile robot exploration and map-building with continuous localization, Proceedings. 1998 IEEE International Conference on Robotics and Automation (Cat. No.98CH36146), Leuven, Belgium, 1998, pp. 3715-3720 vol.4. [CrossRef]
  40. Smith, R.C.; Cheeseman, P. On the Representation and Estimation of Spatial Uncertainty. The International Journal of Robotics Research. 1986; 5(4), pp:56-68. [CrossRef]
  41. Durrant-Whyte, H.; Bailey, T. Simultaneous localization and mapping: Part I. IEEE robotics & automation magazine, 2006, 13(2), pp: 99-110. IEEE.
  42. Dissanayake, G.; Newman, P., Durrant-Whyte, H.F.; Clark, S.; Csobra, M. A solution to the simultaneous localisation and mapping (SLAM) problem, IEEE Trans. Robot. Automat., vol. 17, no. 3, pp. 229–241, 2001. [CrossRef]
  43. Leonard, J.J.; Durrant-Whyte, H.F. Simultaneous map building and localisation for an autonomous mobile robot, in Proc. IEEE Int. Workshop Intell. Robots Syst. (IROS), Osaka, Japan, 1991, pp. 1442–1447. [CrossRef]
  44. Castellanos, J.A.; Martnez, J.M.; Neira, J.; Tardós, J.D. Experiments in multisensor mobile robot localization and map building, in Proc. 3rd IFAC Sym. Intell. Auton. Vehicles, 1998, pp. 173–178. [CrossRef]
  45. Guivant, J.; Nebot, E.M.; Baiker, S. Localization and map building using laser range sensors in outdoor applications, J. Robot. Syst., 2000, vol. 17, no. 10, pp. 565–583. [CrossRef]
  46. Bula, J.; Derron, M. H. ; Mariethoz, G. Dense point cloud acquisition with a low-cost Velodyne VLP-16. Geoscientific Instrumentation, Methods and Data Systems, 2020, 9(2), 385-396. [CrossRef]
  47. Huang, L. Review on LiDAR-based SLAM Techniques, 2021 International Conference on Signal Processing and Machine Learning (CONF-SPML), Stanford, CA, USA, 2021, pp. 163-168. [CrossRef]
  48. Huang, L. Review on LiDAR-based SLAM Techniques, 2021 International Conference on Signal Processing and Machine Learning (CONF-SPML), Stanford, CA, USA, 2021, pp. 163-168. [CrossRef]
  49. Maset, E.; Cucchiaro, S.; Cazorzi, F.; Crosilla, F.; Fusiello, A.; Beinat, A. Investigating the performance of a handheld mobile mapping system in different outdoor scenarios. The International Archives of the Photogrammetry, Remote Sensing and Spatial Information Sciences, 2021, 43, pp:103-109. [CrossRef]
  50. Vassena, G.P.; Perfetti, L.; Comai, S.; Mastrolembo Ventura, S.; Ciribini, A. L. Construction Progress Monitoring through the Integration of 4D BIM and SLAM-Based Mapping Devices. Buildings, 2023, 13(10), 2488. [CrossRef]
  51. Labbé M., Michaud, F. Online global loop closure detection for large-scale multi-session graph-based SLAM,” 2014 IEEE/RSJ International Conference on Intelligent Robots and Systems, Chicago, IL, USA, 2014, pp. 2661-2666. [CrossRef]
  52. Marotta, F.; Pessina, A.; Vassena, G.; Fassi, F. Accuracy improvement of a IMMS in an urban scenario. International Archives of the Photogrammetry, Remote Sensing and Spatial Information Sciences, 2022, 46(2), 351-358. [CrossRef]
  53. Marotta, F.; Perfetti, L.; Fassi, F.; Achille, C.; Vassena, G.P.M. Lidar IMMS vs handheld multicamera System: A stress-test in a Mountain Trailpath. International Archives of the Photogrammetry, Remote Sensing and Spatial Information Sciences, 2022, 43(1-2022), pp.249-256. [CrossRef]
  54. Perfetti, L.; Vassena, G.P.M.; Fassi, F. Preliminary survey of historic buildings with wearable mobile mapping systems and uav photogrammetry. International Archives of the Photogrammetry, Remote Sensing and Spatial Information Sciences, 2023, 48, pp.1217-1223. [CrossRef]
  55. Ehlers, S. F.; Stuede, M.; Nuelle, K.; Ortmaier, T. Map management approach for SLAM in large-scale indoor and outdoor areas. In 2020 IEEE International Conference on Robotics and Automation (ICRA), IEEE, 2020, pp. 9652-9658. [CrossRef]
  56. Ceriani, S.; Sánchez, C.; Taddei, P.; Wolfart, E.; Sequeira, V. Pose interpolation slam for large maps using moving 3d sensors. In 2015 IEEE/RSJ international conference on intelligent robots and systems (IROS), 2015, pp. 750-757. IEEE. [CrossRef]
  57. Sequeira, V.; Wolfart, E.; Bovisio, E.; Biotti, E.; Goncalves, J. G. Hybrid 3D reconstruction and image-based rendering techniques for reality modeling. In Videometrics and Optical Methods for 3D Shape Measurement, 2020, Vol. 4309, pp. 126-136. SPIE. [CrossRef]
  58. Placed, J.A.; Strader, j.; Carrillo, h.; Atanasov N.; Indelman, V.; Carlone, L. A Survey on Active Simultaneous Localization and Mapping: State of the Art and New Frontiers, in IEEE Transactions on Robotics, 2023, vol. 39, no. 3, pp. 1686-1705. [CrossRef]
  59. Lu, Qiuchen, L.; Xie, X.; Heaton, J.; Parlikad, A.K.; Schooling, J.M. From BIM towards digital twin: Strategy and future development for smart asset management. Service Oriented, Holonic and Multi-agent Manufacturing Systems for Industry of the Future: Proceedings of SOHOMA 2019, 2020, 9, pp: 392-404. [CrossRef]
  60. Zhang, Q. 3D real estate makes real estate management more efficient and accurate. China Surveying and Mapping, 2019, 000(006):29-29. 1996:468-471. [CrossRef]
  61. Lymberopoulos, D,; Liu, J. The microsoft indoor localization competition: Experiences and lessons learned, IEEE Signal Process. Mag., 2017, vol. 34, no. 5, pp. 125–140. [CrossRef]
  62. Sánchez, C.; Ceriani, S.; Taddei, P.; Wolfart, E.; Sequeira, V. STeAM sensor tracking and mapping. Second Annual Microsoft Indoor Localization Competition. 2015.
  63. IPIN conference web site: https://ipin-conference.org Accessed on 23 November 2024.
  64. Renaudin, V.; Ortiz, M.; Perul, J.; Torres-Sospedra, J.; Jiménez, A.R.; Pérez-Navarro, A.; Martín Mendoza-Silva, G.; Seco, F.; Landau, Y.; Marbel, R.; Ben-Moshe, B.; Zheng, X.; Ye, F.; Kuang, J.; Li, Y.; Niu, X.; Landa, V.; Hacohen, S.; Shvalb, N.; Lu, C.; Uchiyama, H.; Thomas, D.; Shimada, A.; Taniguchi, R.; Ding, Z.; Xu, F.; Kronenwett, N.; Vladimirov, B.; Lee, S.; Cho, E.; Jun, S.; Lee, C.; Park, S.; Lee, Y.; Rew, J.; Park, C.; Jeong, H.; Han, J.; Lee, K.; Zhang, W.; Li, X.; Wei, D.; Zhang, Y.; Park, S.Y.; Park, C.; Knauth, S.; Pipelidis, G.; Tsiamitros, N.; Lungenstrass, T.; Morales, J.P.; Trogh, J.; Plets, D.; Opiela, M.; Fang, S.-H.; Tsao, Y.; Chien, Y.-R.; Yang, S.-S.; Ye, S.-.; Ali, M.U.; Hur, S.; Park, Y. Evaluating Indoor Positioning Systems in a Shopping Mall: The Lessons Learned From the IPIN 2018 Competition, in IEEE Access, 2018, vol. 7, pp. 148594-148628, 2019. [CrossRef]
  65. Tucci, G.; Visintini, D.; Bonora, V.; Parisi, E.I. Examination of indoor mobile mapping systems in a diversified internal/external test field. Applied Sciences, 2018, 8(3), 401. [CrossRef]
  66. Lovas, T.; Hadzijanisz, K.; Papp, V.; Somogyi, A. J. Indoor building survey assessment. In the International Archives of the Photogrammetry, Remote Sensing and Spatial Information Sciences, 2020, 43, pp: 251-257. [CrossRef]
  67. Maset, E.; Scalera, L.; Beinat, A.; Cazorzi, F.; Crosilla, F.; Fusiello, A.; Gasparetto, A. Preliminary comparison between handheld and mobile robotic mapping systems. In Proceedings of I4SDG Workshop 2021: IFToMM for Sustainable Development Goals, 2022, 1, pp: 290-298. Springer International Publishing. [CrossRef]
  68. Information Technology—Real Time Locating Systems—Test and Evaluation of Localization and Tracking Systems, Standard ISO/IEC 18305:2016, 2016.
  69. Filgueira, A.; Laguela, S.; Arias, P.; Bueno, M. Novel inspection system, backpack-based, for 3D modelling of indoor scenes. International Conference on Indoor Positioning and Indoor Navigation (IPIN). 2016, Madrid. [CrossRef]
  70. Maboudi, M., Bánhidi, D., & Gerke, M. (2018). Investigation of geometric performance of an indoor mobile mapping system. The International Archives of the Photogrammetry, Remote Sensing and Spatial Information Sciences, 42, pp: 637-642. [CrossRef]
  71. Otero, R., Lagüela, S., Garrido, I., & Arias, P. (2020). Mobile indoor mapping technologies: A review. Automation in Construction, 120, 103399. [CrossRef]
  72. Bavarian Research and Innovation Agency official web site: https://www.forschung-innovation-bayern.de/en/contact/directions/ accessed on 12 November 2024.
  73. Campi, M.; Di Luggo, A.; Monaco, S.; Siconolfi, M.; Palomba, D. Indoor and outdoor mobile mapping systems for architectural surveys. The International Archives of the Photogrammetry, Remote Sensing and Spatial Information Sciences, 2018, 42, pp: 201-208. [CrossRef]
  74. Gexcel website. Available online: www.gexcel.it (accessed on 4 January 2025).
  75. Vassena, G.; Perfetti, L.; Fassi, F.; Fellin, A.; Cavallari, L.; Sgrenzaroli, M.; Mainardi, A. Accurate 3D Model Of Venice: Preserving Historical Data And Introducing Slam Imms For Change Detection And Updating Procedures. International Archives of the Photogrammetry, Remote Sensing and Spatial Information Sciences, 2024, 48, pp: 453-460. [CrossRef]
  76. Viametris official website. Available online: https://viametris.com/ms-96/ (accessed on 4 January 2025).
  77. Askar, C.; Scheider, A.; Sternberg, H. Evaluation of a State-of-the-Art Indoor Mobile Mapping System in a Complex Indoor Environment. ZfV-Zeitschrift für Geodäsie, Geoinformation und Landmanagement, 2023, (zfv 5/2023).
  78. Leica Geosystem official: https://shop.leica-geosystems.com/it/leica-blk/blk2go/overview (accessed on 4 January 2025).
  79. Dlesk, A.; Vach, K.; Šedina, J.; Pavelka, K. Comparison of leica blk360 and leica blk2go on chosen test objects. The International Archives of the Photogrammetry, Remote Sensing and Spatial Information Sciences, 2022, 46, 77-82. [CrossRef]
  80. Maboudi, M.; Bánhidi, D.; Gerke, M. Investigation of geometric performance of an indoor mobile mapping system. The International Archives of the Photogrammetry, Remote Sensing and Spatial Information Sciences, 2018, 42, pp: 637-642. [CrossRef]
  81. Dalux Official Website: www.dalux.com (accessed on 4 January 2025).
  82. Acca website: www.acca.it (accessed on 4 January 2025).
  83. Asset Panfa web site. Available online: https://www.assetpanda.com/ (accessed on 4 January 2025).
  84. Faciliteasy website. Available online: https://www.faciliteasy.com/industry/building-management/ (accessed on 4 January 2025).
  85. Asolvi website. Available online: https://www.asolvi.com/property-and-building (accessed on 4 January 2025).
  86. UpKeep website. Available online: https://b2b.upkeepworld.com (accessed on 4 January 2025).
  87. Metropolitana Milanese official web site: https://www.mmspa.eu/en/ accessed on 20 November 2024.
  88. Perfetti, L.; Vassena, G.P M.; Fassi, F. Preliminary survey of historic buildings with wearable mobile mapping systems and uav photogrammetry. Interantioanl archives of the photogrammetry, remote sensing and spatial information sciences, 2023, 48, pp: 1217-1223. [CrossRef]
  89. Velodyne official web site: https://velodynelidar.com/ Accessed on 09-August-2022.
  90. Gexcel official web site: https://gexcel.it/en/software/Heron-desktop. Accessed on 10 September 2024.
  91. Gexcel official web site: https://gexcel.it/en/software/Heron-desktop. Accessed on 10 September 2024.
  92. Sánchez-Belenguer, C.; Ceriani, S.; Taddei, P., Wolfart, E.; Sequeira, V. Global matching of point clouds for scan registration and loop detection. Robotics and Autonomous Systems, 2020, 123, 103324. [CrossRef]
  93. Hess, W.; Kohler, D.; Rapp, H.; Andor, D. Real-time loop closure in 2D LIDAR SLAM. In 2016 IEEE international conference on robotics and automation (ICRA), 2016, pp: 1271-1278.
  94. Labbe, M.; Michaud, F. Online global loop closure detection for large-scale multi-session graph-based SLAM. In 2014 IEEE/RSJ International Conference on Intelligent Robots and Systems, 2014, pp. 2661-2666.
  95. Maset, E.; Scalera, L.; Beinat, A.; Visintini, D.; Gasparetto, A. Performance investigation and repeatability assessment of a mobile robotic system for 3D mapping. Robotics, 2022, 11(3), 54. [CrossRef]
  96. Hesai Official web site: https://www.hesaitech.com/. Accessed on 1st of November 2024.
  97. Celantur Official web site: https://www.celantur.com/. Accessed on 15 November 2024.
  98. Gexcel official web site: https://gexcel.it/it/software/goblueprint. Accessed on 2 January 2025.
  99. Atis Cloud website: https://www.atis.cloud/ (accessed on 23 October 2024).
  100. Benaco Ltd. Website: https://benaco.com/ (accessed on 23 August 2024).
  101. Fangming, L.; Franco, S.; Achille, C.; Vassena, G.P.M.; Fassi, F. The Role of Web Platforms in Balancing Sustainable Conservation and Development in Large Archaeological Site: The Naxos case study. International Archives of the Photogrammetry, Remote Sensing and Spatial Information Sciences, 2024, 48, 303-310.
  102. Cupix web site: https://www.cupix.com Accessed on 23 November 2024.
Figure 1. The mobile mapping devices installed on trolley. (a) Viametris iMS3D [72] (b) The NAVVIS M3 [73] (c) Trimble TIMMS [74].
Preprints 150090 g001
Figure 2. (a) Heron Twin Color by Gexcel [75] (b) MS-96 by Viametris [77]
Preprints 150090 g002
Figure 4. The use of a tablet with a floor plan on the background is currently use for census projects. Courtesy of Dalux [82].
Preprints 150090 g004
Figure 5. Example of a survey by iMMS (University of Brescia campus).
Preprints 150090 g005
Figure 8. Example of organization of a complex of buildings. In this case the complex has a code “200019 “and a name “Gaggioli 7”. The complex was built in 1959 and is composed by 8 buildings.
Preprints 150090 g008
Figure 11. The local map phase of the Heron Desktop software. The produced local maps are presented in various colours.
Preprints 150090 g011
Figure 12. The centroids of local maps, denoted by coloured dots, are automatically linked for the final bundle adjustment and optimisation procedure.
Preprints 150090 g012
Figure 13. The Hesai mid range lidar PANDAR XT32 [97]
Preprints 150090 g013
Figure 14. (a) The latest version (2024) of the Heron Twin Color (b) The University of Brescia team during some field tests on one of the Milan Location.
Preprints 150090 g014
Figure 16. Mobile mapping system trajectories for surveying three levels of the University of Brescia, Italy. Overall length = 2680 m; acquisition time = 1 hour and 11 minutes. Trajectory crossing facilitates the reduction of trajectory drifts.
Preprints 150090 g016
Figure 17. Virtual tour inside a building of the Milan Project, using the Reconstructor software. The images are taken on demand with a resolution of 5K.
Preprints 150090 g017
Figure 19. An example of operational report, where in a draft map are detailed the positions of the technical rooms of the complex of buildings
Preprints 150090 g019
Figure 20. Example of operational report with the position of building staircases
Preprints 150090 g020
Figure 21. Example of a operational report where are detailed the suggested best trajectories to be follow by the surveyor. The trajectories must have a minimum overlap so to be connected.
Preprints 150090 g021
Figure 22. An example of a comparison between the survey route planned in the operational report (a) and the result of the trajectory realized in the reality shown in the survey report (b)
Preprints 150090 g022
Figure 23. Example of Virtual Tour navigation along the external part of a complex, by using the navigation tool available in the on premise Reconstructor software
Preprints 150090 g023
Figure 24. Example of BluePrint format. The GoBluePrint free app [99] can be used for easy measurement of the surveyed sites.
Preprints 150090 g024
Figure 25. An example of one of orthophoto views of the facades of the buildings requested in the Milan project. The survey is carried on with Terrestrial Laser scanner, without use of control points, at the nominal scale of 1:200
Preprints 150090 g025
Figure 26. Example of Virtual tour in the Reconstructor platform, of a site of the Milan project.
Preprints 150090 g026
Figure 27. Example of how the data of the assets are managed in Cintoo. Example from tagging tests in the University of Brescia
Preprints 150090 g027
Figure 28. Example of how the data of the assets are managed in Cintoo. Example from tagging tests in the University of Brescia
Preprints 150090 g028
Figure 29. Navigation interface in the Benaco [101] web platform. The example is taken from navigation tests in the “Modulo” building at the Faculty of Engineering of Brescia University.
Preprints 150090 g029
Figure 30. The figure visualize how the navigation can be organized in a tree structure. Every level represent an area of the building following the global structure (Table 2)
Preprints 150090 g030
Figure 31. The “Senigallia” complex in Milan. (Courtesy of Google®)
Preprints 150090 g031
Figure 32. The “Senigallia” complex in Milan. The 3d point cloud model obtained by the mobile mapping survey (tests of the University of Brescia)
Preprints 150090 g032
Figure 35. An example where an incorrect alignment between trajectories resulted in an appreciable discrepancy between the walls of a building.
Preprints 150090 g035
Disclaimer/Publisher’s Note: The statements, opinions and data contained in all publications are solely those of the individual author(s) and contributor(s) and not of MDPI and/or the editor(s). MDPI and/or the editor(s) disclaim responsibility for any injury to people or property resulting from any ideas, methods, instructions or products referred to in the content.
Copyright: This open access article is published under a Creative Commons CC BY 4.0 license, which permit the free download, distribution, and reuse, provided that the author and preprint are cited in any reuse.
Prerpints.org logo

Preprints.org is a free preprint server supported by MDPI in Basel, Switzerland.

Subscribe

Disclaimer

Terms of Use

Privacy Policy

Privacy Settings

© 2025 MDPI (Basel, Switzerland) unless otherwise stated