
Submitted:
03 January 2025
Posted:
03 January 2025
You are already at the latest version
Abstract
Insider threats pose a significant challenge to organizational cybersecurity, often leading to catastrophic financial and reputational damages. Traditional tools like firewalls and antivirus systems lack the sophistication needed to detect and mitigate these threats in real time, particularly when faced with subtle and evolving malicious behaviors. This paper introduces a machine learning-based system that integrates real-time anomaly detection with dynamic user profiling, enabling the classification of employees into risk categories—low, medium, and high. By leveraging continuous monitoring and adaptive algorithms, the proposed tool provides immediate alerts and actionable insights, significantly enhancing organizational responsiveness to insider threats. The system’s efficacy was validated using a synthetic dataset, achieving exceptional accuracy across machine learning models, with XGBoost emerging as the most effective for detection and classification. This work addresses critical gaps in traditional and existing machine learning methods, offering a proactive, scalable, and fully automated solution. Future research will explore real-world data validation and incorporate psychological profiling to further augment detection capabilities, setting a foundation for the next generation of insider threat management systems.
Keywords:
Insider Threats
; Machine Learning
; Real-Time Detection
; User Behavior Classification
; Risk Assessment
; Organizational Security
; Anomaly Detection
; Dynamic Profiling
1. Introduction
In today’s digital transformation era, organizations are increasingly vulnerable to insider cyber threats. Insider attacks often exhibit subtle, complex behaviors that make them difficult to detect in real-time, leading to severe data breaches, financial losses, and damage to reputations. According to the 2024 Data Breach Investigations Report by Verizon, insiders account for 31% of data breaches in the financial and insurance sectors [1]. Additionally, the 2024 IBM Cost of a Data Breach Report revealed that malicious insider attacks resulted in the highest average costs, at $4.99 million [2]. Employees and internal users, with privileged access to sensitive systems, pose significant risks, particularly since they possess knowledge of how to evade detection [3]. This complicates efforts to identify and mitigate insider threats using traditional security measures, such as antivirus and firewalls, which remain inadequate for detecting malicious insiders [4].
Machine Learning (ML) has emerged as a critical tool in enhancing insider threat detection. ML algorithms can identify abnormal behaviors (e.g., clicking unsafe links, logging in during non-business hours) in near real-time. These models continuously learn from new data, allowing them to analyze large volumes of information, improve detection accuracy, and reduce false positives. However, current ML-based detection tools often lack key capabilities, such as real-time data analysis and dynamic classification of users based on their behavior. Addressing these gaps is crucial for building more effective threat detection systems.
This paper proposes a ML tool that integrates real-time data analysis with dynamic user behavior classification. The tool provides immediate detection and analysis of potentially risky behaviors, while continuously adapting to evolving threat patterns. By enhancing the accuracy of detecting insider threats and dynamically classifying users, the proposed tool significantly improves upon existing security measures.
This paper addresses the following key questions in the field of cybersecurity behavior detection and classification:
- How can ML be leveraged to improve the real-time detection and identification of insider threats in organizational environments? Answered in Subsection 3.1.
- What limitations of existing security tools can be addressed through real-time data analysis and dynamic user profiling using ML? Answered in Section 2.
- How can ML models effectively classify users based on their behavior and assign risk levels to detect and mitigate insider threats in real-time? Answered in Section 5.
- What unique capabilities does the proposed ML tool provide over traditional security measures, especially in terms of automating real-time threat detection and user risk profiling? Answered in Subsection 3.2, Subsection 3.3, and Subsection 7.1.
- What are the key vulnerabilities of the proposed tool, and what measures can be implemented to mitigate these threats effectively? Answered in Section 6.
To address these questions, this paper makes the following key contributions:
- Introduces a ML tool that continuously monitors employee activity in real-time, enabling rapid detection of insider threats.
- Implements dynamic user profiling that classifies individuals into risk categories (low, medium, high) based on their behavior, ensuring accurate identification of risky users.
- Automates immediate alert generation, notifying cybersecurity teams promptly when abnormal activities are detected, reducing response time.
- Operates as a fully automated, non-interactive system, eliminating the need for manual intervention while enhancing efficiency.
- Allows for customizable configurations, enabling organizations to adjust parameters like feature weights and risk thresholds according to their specific security needs.
- Combines real-time detection and user classification into a unified solution, addressing the shortcomings of traditional tools lacking these capabilities.
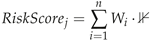
The remainder of this paper is structured as follows: Section 2 describes the background and rationale of the study. Section 3 provides an overview of the proposed tool. Section 4 explains the steps taken to acquire the data, clean data, and visualization steps. Section 5 presents the findings of the study. Section 6 discusses the potential threats that can compromise the proposed tool. Section 7 provides the discussion, and finally, section 8 concludes the proposed tool and findings. Figure 1 illustrates the overall structure visually.
2. Related Work
Effective monitoring of insider threats is crucial for organizational cybersecurity, including identifying risky employee behavior, ensuring accountability, and mitigating potential impacts. This section reviews both traditional and ML-based approaches for insider threat detection, highlighting their advantages and limitations.
2.1. Traditional-Based
Traditional insider threat detection relies on predefined rules and static policies, often employing methods such as log activity monitoring, rule-based Intrusion Detection Systems (IDS), and Endpoint Detection and Response Solutions (EDR) [5,6,7]. Anomaly detection tools such as XABA [8] and scoring-based activity log analysis [9] use predefined keywords and scoring mechanisms, but their dependence on manual thresholds and analyst intervention introduces performance bottlenecks and limits adaptability to novel threats.
Signature-based IDS, such as SNORT, Suricata, and Zeek, rely on matching known malicious patterns, but they are vulnerable to Zero-Day attacks [10,11,12,13,14,15,16]. These IDS tools have limited capabilities against previously unseen threats, as they rely on a fixed database of known signatures. Combining IDS tools with other network analysis tools, such as Wireshark, can enhance detection efficiency, but reliance on predefined rules limits adaptability [17].
Approaches like Corporate Insider Threat Detection (CITD) [18] and tree-structured activity profiling [19] aimed to reduce false positives by incorporating analyst feedback. However, manual intervention introduces challenges in scaling and reduces the efficacy of real-time analysis. Adversarial Risk Analysis (ARA) models [20,21] provide a structured approach for insider threat detection, but their static nature limits adaptability. Methods based on recording user inputs, such as key-loggers [22], face privacy concerns and reduced efficiency. The two-step insider detection approach proposed by [23] further illustrates the challenges in balancing accuracy and adaptability in traditional methods.
Overall, traditional methods suffer from high false positives, static adaptability, and dependence on human intervention, making them less effective for dynamic and evolving threats.
2.2. ML-Based
ML has emerged as a potent tool for insider threat detection, enabling early-stage identification of anomalous behavior, scalability, and predictive analysis [24,25]. ML-based IDS enhance detection through models that can identify novel attack patterns. For example, Random Forest (RF) and Naive Bayes classifiers have been used in anomaly detection, demonstrating good accuracy, though limited by a lack of adaptive features [26].
Studies employing supervised learning, such as RF, Support Vector Machine (SVM), and Decision Trees (DT), have shown promising results for detecting insider threats using log data [27,28,29]. However, challenges include the reliance on manual thresholds and the lack of real-time analysis capabilities. The integration of data preprocessing techniques, such as SMOTE, improved accuracy but introduced computational overhead [30].
Ensemble learning methods, like Gradient Boosting and Isolation Forest (IF), have demonstrated improved detection rates, but higher computational requirements limit real-time performance [31,32,33]. Hybrid approaches, such as combining supervised and unsupervised algorithms [34], improved anomaly detection scores, but their reliance on batch analysis of historical data limits their effectiveness for continuous monitoring.
Recent research has emphasized human behavior analysis for insider threat detection. Tools combining RF, XGBoost, and other ensemble methods [35,36] have shown high detection accuracy. However, issues persist with real-time adaptability and user behavior analysis. Studies integrating behavior profiling, such as K-means clustering [37,38], have been able to classify employees based on session data, but they often fail to incorporate risk severity and continuous analysis. Several studies have explored ML techniques for detecting insider threats and abnormal behavior in users. Nandini et al. [39] employed XGBoost with Cost Gradient Boosting Algorithm (CGBA) for classifying users based on their activities, outperforming other methods like DT and IF. Li and Su [40] focused on a university website’s log data, using log parsing and clustering techniques for anomaly detection, though they faced challenges with false positives due to reliance on threshold-based distances.
Suresh and Madhavu [41] improved RF efficiency with Randomized Weighted Majority Algorithm (RWMA) and Fuzzy Feature Aggregation (FFA) to classify risky users. Other studies, such as [42], demonstrated that IF was the most effective algorithm when applied to large datasets. Real-time detection methods like RADISH [43] utilized KNN to detect insider threats, although ongoing session analysis was missing.
Verma et al. [44] applied K-Nearest Neighbours (KNN) and K-means for classifying network traffic into five categories, with KNN showing superior accuracy. A multi-layered detection framework incorporating supervised and unsupervised classifiers (KNN, DT, RF, and Bootstrap Aggregating) was proposed in [45], with KNN achieving the highest true positive rate and RF showing zero false positives. Begli et al. [46] used SVM to classify network traffic in healthcare organizations, revealing that detecting sensitive data was more challenging.
Kim et al. [47] proposed an anomaly detection system using statistical methods and K-means, achieving good detection rates for abnormal user behavior, but lacking real-time capabilities. An evaluation of three ML algorithms, Logistic Regression (LR), RF and XGBoost, showed that RF outperformed others in detecting insider activities [48]. Similarly, AI-based distance measurement techniques, like Levenshtein distance, were evaluated for detecting IoT sensor-based insider threats [49].
Further, XGBoost combined with Data Adjustment techniques (SMOTE and Random Undersampling (RUS)) achieved high accuracy in anomaly detection tasks using the CERT dataset [50]. Studies like [51] also tested multiple algorithms (AdaBoost, Naive Bayes, and others) for classifying anomalous emails, although the dataset size was limited. In the IoT domain, Shaver et al. [52] compared ML algorithms, finding RF effective for anomaly detection despite its high computational overhead.
Abhale et al. [53] explored a broader set of supervised models (RF, SVM, DT, Light Gradient Boosting Machine (LGBM), Extra Tree, Gradient Boosting, Ada Boost, KNN, Multi-Layer Perceptron (MLP), Gaussian Naive Bayes, and LR), with SVM achieving the highest accuracy. Another study, [54], used RF and deep learning models to classify network attacks into five types, although real-time adaptation was not addressed. Al-Shehari and Alsowail [55] employed data processing techniques (Label Encoding, One-Hot Encoding, SMOTE) to enhance ML-based detection of data leakage incidents, showing that RF and DT performed best on the CERT dataset.
Almomani et al. [56] compared classifiers for intrusion detection, with RF and Gradient Boost performing well. Taghavi-Rashidizadeh et al. [57] combined Principal Component Analysis (PCA) and XGBoost for anomaly detection, achieving high accuracy on the UNSW-NB15 dataset, though continuous monitoring was not considered. Lastly, Manoharan et al. [58] evaluated RF, KNN, and DT using balanced datasets, with RF achieving the highest accuracy, but instantaneous data analysis was missing. Inuwa and Das [59] compared ML models like SVM, DT, and KNN for detecting IoT network anomalies, achieving real-time detection but lacking user behavior analysis. Finally, some studies reported exceptionally high detection accuracy. However, it’s important to note that these results were derived from offline datasets rather than real-time, instantaneous data [60,61,62,63]. Overall, ML-based approaches improve upon traditional methods by offering predictive capabilities and reducing false positives. However, they often require significant computational resources and lack effective real-time classification features.
2.3. Limitations and Gaps
The literature indicates that while extensive research has been conducted on insider threat detection tools, the majority fail to provide both real-time analysis and comprehensive user risk classification. These tools often rely on offline datasets or historical log files, delaying detection and response. There remains a critical need for tools that can dynamically analyze user behavior using continuously updated data.
The proposed tool aims to bridge this gap by integrating real-time analysis with dynamic classification features, offering a significant improvement over existing solutions. A qualitative and quantitative comparison of this tool with related works is presented in Subsection 3.3 and Subsection 7.1.
3. The Proposed Tool
This section discusses the proposed tool’s workflow and features, and concludes with a qualitative comparison to the works discussed in Section 2.
3.1. Workflow
The proposed tool combines real-time analysis capabilities to detect abnormalities and classify employee risk levels, all based on an the employees’ daily activities. Figure 2 illustrates the proposed tool workflow.
3.1.1. Real-Time Analysis Tool
- Continuous Activities Monitoring: The proposed tool provides continuous surveillance of an organization’s network, capturing real-time data that shows the organization’s employees’ daily activities.
- Abnormality Identification: Utilizing ML, the system identifies abnormalities by examining the anomalous daily activities of employees on an organization’s network.
- Immediate Alert Generation: Upon identifying abnormalities, the proposed tool promptly issues detailed alerts to the cybersecurity team for immediate action. Figure 3 shows an example of the generated alert.
3.1.2. Employee Risk Classification Tool
- 4.
-
Risk-score Calculation: Each employee is assigned a risk-score, which is determined by their daily activities within the organization’s network, as calculated according to Equation (1).
 Where
Where- is the RiskScore for the record.
- The summation indicates that we are summing over all features from 1 to n.
- is the weight associated with the feature.
 is the indicator function that equals 1 if the feature for the record, , is 1 indicating first-time abnormal daily activity, and 0 otherwise indicating no abnormal activity.
- 5.
- Dynamic Employee Profiling: Following step 4, employees are dynamically profiled, with their profiles undergoing continuous updates to reflect behaviors within the organization’s networks as well as their calculated risk-scores.
- 6.
- Classification of Employees: Each employee is classified into one of the risk levels (i.e., Low, Moderate, High) based on their data updated in step 5, utilizing ML.
- 7.
- Administration Notification: Employees identified as moderate or high risk are reported to the administration for necessary interventions, which may include additional training or enhanced monitoring. Figure 4 shows an example of the generated messages that will be sent to the administration.
3.1.3. Continuous
- 8.
- Recurrence: The proposed tool then restarts its monitoring process, ensuring continuous adaptation and up-to-date security maintenance.
3.2. The Proposed Tool Features
The subsection introduces the key features for the proposed tool explaining each feature in detail.
3.2.1. Instantaneous Data
The proposed tool depends on instantaneous data to actively monitor insider activities as they occur, emphasizing real-time insights rather than relying on static offline data. By leveraging instantaneous data, the tool ensures that the monitoring is dynamic, responsive, and mirrors the latest trends and patterns in insider activities. This approach provides the ability to promptly detect and address potential risks without relying on information from log files or other offline resources.
3.2.2. Real-Time Analysis
The proposed tool facilitates real-time analysis of user behavior, enabling prompt assessment of security risks within the organizational environment. By using ML, the proposed tool can detect abnormal insider activities as they unfold.
Such capability empowers security personnel to promptly detect abnormal activities, facilitating proactive intervention and implementation of mitigation measures aimed at safeguarding sensitive data. This empowers organizations to enhance their security protocols and address potential risky employees. The real-time analysis process includes the instant detection of abnormal user actions, documentation of user details, recording abnormal activity types, and recording activity frequencies, which subsequently inform immediate alert generation for the cybersecurity team and contribute to the system’s subsequent stage: Classification.
3.2.3. Real-Time Classification
The tool incorporates a real-time user classification feature, which dynamically categorizes employees according to their risk scores. Equation (1) is used to calculate the RiskScore values for users according to their abnormal activities, where each activity has its own weight implying the severity of this activity. For the proposed tool, risk scores are calculated based on the first occurrence of an anomalous activity which is based on the fact that a single successful breach can compromise the whole system. Each employee has a profile that dynamically updates according to the corresponding behavior and risk scores. Finally, each employee is classified according to the previous steps into three main classes; Low-Risk, Moderate-Risk, or High-Risk where medium and high-risk employees are reported to the system administrator for further actions.
3.2.4. Non-Interactive
A major aspect of the proposed tool lies in its full automation capabilities from analysis to administrator notification. Each step in the system (e.g., behaviour analysis, risk scores calculation, and classification) follows an automated process without the need for human intervention. The system provides activity monitoring, analysis, and abnormality identification by automatically recording activities and user details without human interaction. The risk scores are then calculated by the tool based on equation (1) and the user profiles are automatically updated to reflect the behavior and risk scores. The tool also automatically classify users based on their risk scores into low, moderate, or high risk. An automatic alert will then be sent to the cybersecurity administrator in case of identifying a high or moderate abnormal activity which eliminates the necessity for human intervention to manually investigate the classification outcome.
3.2.5. Continuous
One of the main features of the proposed tool is to provide continuous monitoring around the clock. The 24/7 functionality of the system is crucial in maintaining the detection process over real-time data streams. The nonstop operation of the proposed tool ensures that employee classification is not limited by time constraints, allowing for timely identification and response to potential insider abnormal behavior at any hour. Also, it ensures that the system is protected through non-business hours, weekends, and holidays. This continuous monitoring aligns with the organizational security objectives, providing a robust employee classification during any time.
3.2.6. Adjustable
The proposed tool possesses the capability to dynamically adjust parameters in alignment with organizational objectives. Key parameters, including weight, the number and type of features, and threshold ranges, can be fine-tuned by system administrators to better reflect the strategic goals of the business. For example, an organization may need to increase the weight of a specific abnormal activity that is risky to their operations, similarly, they may want to add/remove specific features (activities) according to their business goals. The risk ranges specifying levels of risks (low, medium, or high) can also be adjusted according the organizational goals and nature of business. This adaptability grants administrators the flexibility to customize the system’s configuration based on the unique requirements of the organization’s risk management strategies.
3.2.7. Detection Time
The proposed tool is designed to rapidly identify potential threats within a system, minimizing the time required for initial detection. This efficiency is achieved through the integration of optimized algorithms and real-time processing capabilities, ensuring that anomalies are flagged promptly. Such swift detection enhances the system’s ability to respond to threats proactively, reducing the likelihood of escalation or system compromise. The proposed tool’s ability to identify threats swiftly is validated through the experiment presented in Subsection 5.5.1.
3.2.8. Classification Time
Following detection, the tool exhibits a streamlined process for categorizing identified threats. By employing advanced classification models, it minimizes the duration required to assign risk levels and determine the nature of the threat. This precise and timely classification supports informed decision-making and allows for the implementation of tailored countermeasures without unnecessary delay. The efficiency of the tool’s classification mechanism, particularly in terms of time, is thoroughly evaluated in the experiment presented in Subsection 5.5.2.
3.3. Qualitative Comparison with the Discussed Works
An analysis of the related works discussed in Section 2 reveals that each of the reviewed papers faces at least one limitation in applying ML to insider threat detection. Common challenges include the lack of instantaneous data usage, real-time analysis, real-time classification, non-interactivity, continuity, and adjustability. Table 1 highlights these shortcomings and provides a qualitative comparison between the proposed method and existing approaches in the literature.
4. Dataset
The dataset forms the cornerstone of our study, providing the basis for analysis and findings. This section details the data acquisition process, the methodologies used for data preprocessing and validation, feature engineering, data privacy considerations, and feature selection.
4.1. Data Acquisition
We utilized a synthetic dataset specifically crafted to mimic real-world insider threat scenarios, allowing for adjustments aligned with various organizational cybersecurity objectives. Generating synthetic data addresses the challenge of accessing real organizational datasets due to security and privacy concerns. The dataset comprises 10,000 records which represent 500 employees’ activities over 4 weeks (expanded to 23,483 after re-sampling) with 22 features, including Personally Identifiable Information (PII) such as users’ names, email addresses, Social Security Numbers (SSNs), Dates of Birth (DoB), and Employee Numbers, as well as 17 distinct anomalous activity types detailed in Table 2. Each anomalous activity type represents common abnormal behaviors, assigned specific weights reflecting their severity. These weights, determined by our expertise, can be adjusted to meet organizational needs, as discussed in Section 3.2.6. Each activity consists of several features that determine whether the activity is anomalous. A description of these features is shown in Table 3 and the encoded features’ values are shown in Table 4. The purpose of the features is to create patterns for the employees behavior and to form a pattern for the ML rather than relying on pre-defined rules. These features were determined based on domain knowledge.
The process for generating this dataset is outlined in Algorithm 1.
| Algorithm 1 Data Generation |
|
4.2. Feature Engineering
To enhance risk assessment, we introduced a composite feature, RiskScore, calculated using Equation (1), which incorporates both activity frequency and risk weight. The score is based on the first occurrence of an abnormal activity, multiplied by the corresponding activity’s weight. Users are then labeled according to their RiskScore: Low risk (0-10), Medium risk (10-25), and High risk (above 25). These thresholds are designed to detect risky users at early stages; however, organizations can modify these ranges according to their specific requirements.
4.3. Data Validation
Ensuring data quality and reliability is essential. We performed several preprocessing steps to clean the data, summarized as follows and illustrated in Figure 5
- Handling Missing Values: Missing values were imputed with 1, aligning with the goal of detecting the first instance of anomalous activity. This conservative approach minimizes the risk of false negatives by assuming that missing values may indicate potential anomalous activity.
- Outlier Detection and Treatment: Frequency values outside the {0, 1} range were adjusted to 1, treating these anomalies as indicators of potentially risky behavior. Our dataset did not exhibit outliers outside this range, as shown in Figure 6.
- Addressing Dataset Imbalance: We employed the Synthetic Minority Over-sampling Technique combined with Edited Nearest Neighbors (SMOTEENN) to balance the representation across anomalous behaviors, which is crucial for effective model training.
The process for data validation is shown in Algorithm 2.
| Algorithm 2 Data Validation |
|
4.4. Data Privacy
To ensure the ethical use of data and address privacy concerns, we implemented the following measures:
- Pseudonymization in Alerts: Users remain pseudonymized during the alert and monitoring phase, allowing for risk assessment without revealing sensitive information; see Figure 3.
- Controlled Access for De-anonymization: Full identification is restricted to authorized personnel when corrective action is necessary, maintaining privacy until intervention is required; see Figure 4.
5. Tool Validation
This section evaluates the proposed tool through real-time simulation to test the experimental setup and process, the ML models used, and the metrics for assessing performance. It also examines detection and classification times to demonstrate the tool’s real-time capabilities.
5.1. Real-Time Simulation
In order to test the capability of the proposed tool in detecting, analysing, and classifying employees in real-time, a simulator was created with the following components
- The system used for this research is a Windows 11 Pro 64-bit HP laptop, equipped with an Intel(R) Core(TM) i5-10210U CPU, operating at a base speed of 1.60 GHz with a maximum clock speed of 2.11 GHz. The laptop features 8 GB of RAM and runs a 64-bit operating system on an x64-based processor. This configuration was sufficient for conducting the experiments in this study.
- The laptop is equipped with Intel(R) UHD Graphics, provided by Intel Corporation, featuring an internal DAC type. It offers a total memory of 4147 MB, including 128 MB of dedicated VRAM. The display operates at a resolution of 1366 x 768 with 32-bit color depth and a 60 Hz refresh rate.
- Anaconda was utilized as the primary environment manager, enabling the installation and management of required Python libraries. Python served as the main programming language, with key libraries such as Pandas and NumPy for data manipulation, Scikit-learn for implementing ML models (RandomForest, LogisticRegression, and SVM), and XGBoost for advanced gradient boosting. The Faker library was employed to generate synthetic employee data, such as names, emails, and behaviors, simulating various anomalous activities.
- Flask was used to set up a REST API for simulating the injection of employee behaviors and POSTMAN was the API testing platform used to inject behaviors into the simulation and retrieve results.
The simulation involves pushing the dataset into the system to evaluate how the ML algorithms detect and classify employees based on anomalous behaviors.
Algorithm 3 shows the real-time monitoring and abnormality detection. The simulation begins by capturing ongoing activities as the system remains active. It continuously gathers real-time data from the adjusted dataset and updates a monitoring dashboard with the latest activities. Once the data is collected, the algorithm splits it into training, validation, and test sets using a 70-15-15 ratio. It then initializes and trains four machine learning models RF, LR, XGBoost, and SVM using the training dataset.
As each activity is recorded, the algorithm evaluates it against each trained model to detect any abnormal behavior. If an anomaly is identified, the system logs the incident for further investigation, notifies the security team, and generates an alert containing critical information such as the employee’s name, ID, behavior type, and time of occurrence. This alert is then sent to the cybersecurity team for immediate action. The algorithm ultimately returns a list of identified abnormal activities, demonstrating the effectiveness of real-time detection in monitoring multiple employees simultaneously. This proactive approach aims to mitigate potential anomalous behaviors by identifying and addressing any irregularities in employee behavior during the simulation. The time taken to detect the anomalous behavior is calculated in this step.
Algorithm 4 outlines the process for calculating the RiskScore based on instances of abnormal behaviors. Users are classified into three main categories: low, medium, and high risk, depending on their calculated RiskScores. Additionally, each user profile is dynamically adjusted in response to any future abnormal activities, ensuring that the risk classification remains current and reflective of the users’ behavior. The time taken to calculate the risk score and classify users is calculated in this step.
Algorithm 5 outlines the process for notifying administration about employees identified as moderate or high risk based on their anomalous behaviors. It creates detailed notifications that include the employee’s name, ID, risk level, abnormal behaviors, and time of occurrence. Once notifications are sent, the algorithm initiates a continuous monitoring process that captures new real-time data from the organization’s network. This ensures ongoing adaptation and security maintenance, allowing the system to respond promptly to any emerging risks.
| Algorithm 3 Continuous Activities, Identification, and Alert |
|
| Algorithm 4 Employee Risk Classification and Dynamic Profiling |
|
| Algorithm 5 Administration Notification and Recurrence |
|
5.2. ML Models
As part of the evaluation process, several ML models were selected to assess their ability to detect anomalous behavior and classify user risk based on their behavior. The models chosen are well-suited for classification tasks and have shown effectiveness in cybersecurity domains, especially when dealing with large datasets and multiple features.
The following models were evaluated:
- Random Forest (RF): A robust ensemble learning method that builds multiple decision trees and aggregates their results. It is well-suited for this system due to its ability to handle large datasets with a mixture of features types and its strength in estimating feature importance.
- XGBoost: Like RF, XGBoost is an ensemble method but uses a gradient boosting framework, building trees sequentially to improve model accuracy. It is known for its high performance, speed, and ability to handle complex patterns, which is crucial for accurately classifying user risk.
- Support Vector Machine (SVM): A powerful model for classification problems, particularly when data points are not linearly separable. It works well in high-dimensional spaces, making it effective for identifying risky behavior based on a variety of input features.
- Logistic Regression (LR): An interpretable model that provides clear probabilities for classification. Given its simplicity and ease of implementation, it serves as a baseline to compare with more complex models like RF and XGBoost.
5.3. Evaluation Metrics
To assess the performance of the ML models, we employ several key metrics, including Accuracy, Precision, Recall, F1-Score, and the Confusion Matrix. Each metric provides insight into different aspects of the model’s classification ability.
Accuracy is a general measure of how well the model classifies all instances, defined as the ratio of correctly predicted cases (true positives and true negatives) to the total number of predictions. Mathematically, Accuracy can be expressed as:
Where denotes true positives, true negatives, false positives, and false negatives.
Precision focuses on the reliability of positive predictions, measuring the proportion of true positives among all predicted positives. This metric is particularly important when the cost of false positives is high. Precision is given by:
Recall, also known as sensitivity, quantifies the model’s ability to capture all relevant instances within a particular class. It is the ratio of true positives to the sum of true positives and false negatives, and can be formulated as:
The F1-Score balances Precision and Recall by computing their harmonic mean, offering a single metric that considers both false positives and false negatives. This is particularly useful when there is an uneven class distribution. The F1-Score is represented as:
Finally, the Confusion Matrix shown in Figure 7 provides a comprehensive view of the model’s performance by displaying the average distribution of true positives, false positives, true negatives, and false negatives across all anomalous behaviors. This matrix enables a more granular understanding of the model’s behavior in detecting different behaviors.
5.4. ML Results
In this study, the dataset was divided into training, validation, and test sets to ensure robust model evaluation and prevent overfitting. The training set, comprising 70% of the data, was used to train the ML models. The validation set, consisting of 15% of the data, was employed to tune the model parameters and select the best-performing model during the training process. Finally, the test set, also making up 15% of the data, was reserved for evaluating the models’ performance on unseen data, providing a clear indication of their generalization ability. This separation allows for effective assessment and helps in developing a reliable predictive tool for detecting anomalous activities.
We evaluated the performance of four ML models—LR, RF, XGBoost, and SVM—using key evaluation metrics, including accuracy, precision, recall, and F1-score. Table 5 presents the average detection performance of these models, and Figure 7 illustrates their respective confusion matrices.
Precision, a measure of the proportion of true positives among all positive predictions, was similarly high across all models. XGB achieved a perfect precision score of 1.00, while LR and SVM followed closely with scores of 0.996, and RF achieved 0.986. These results reflect the models’ reliability in minimizing false positives when predicting the positive class.
Recall, which quantifies the ability of a model to identify all true positive instances, paralleled the precision scores. XGB and SVM both achieved perfect recall of 1.00, whereas LR and RF scored slightly lower at 0.996 and 0.986, respectively. This demonstrates that the models were equally adept at minimizing false negatives.
The F1-scores, which balance precision and recall, also underscore the models’ robust performance. XGB and SVM achieved perfect scores of 1.00, indicating an optimal trade-off between precision and recall. LR and RF, with F1-scores of 0.996 and 0.986, respectively, demonstrated slightly lower but still excellent performance.
Comparing these results with previous studies, our implementation of LR, XGBoost, and SVM notably outperformed the benchmarks in terms of classification accuracy and precision [35,52,57]. While RF scored similarly to existing results, XGB consistently achieved superior performance across all metrics. For example, [57] highlighted lower recall for SVM in anomaly detection, whereas our implementation achieved perfect recall scores. These improvements underscore the effectiveness of the models employed in this study.
Given the uniformly high performance of the models, selecting one for deployment may depend on factors such as computational efficiency, interpretability, and application-specific requirements. For example, LR’s simplicity and interpretability make it a suitable choice when model transparency is crucial. Conversely, XGB’s unmatched accuracy makes it ideal for high-stakes environments where predictive precision is paramount.
5.5. Detection and Classification Time Evaluation
This experiment evaluates the average detection and classification times of the proposed tool using four ML algorithms: LR, RF, XGBoost, and SVM. These metrics highlight the tool’s real-time capabilities and its suitability for continuous monitoring and dynamic profiling in high-security environments.
5.5.1. Detection Time
Detection time refers to the duration the system takes to identify anomalies in employee activities, which is recorded based on the steps in Algorithm 3. This metric is crucial for ensuring timely intervention and mitigating potential risks. Table 6 presents the average detection times for the algorithms.
5.5.2. Classification Time
Classification time represents the time taken to assign a risk score to employees based on identified anomalies, as described in Algorithm 4, which outlines the steps involved in calculating and assigning the risk scores. Efficient classification ensures that high-risk employees are promptly flagged for administrative review. The results are shown in Table 6.
As you can see on Table 6, the experiment demonstrated that XGBoost was the most efficient among the tested models in terms of both detection and classification times, affirming its suitability for real-time applications. These findings underscore the tool’s potential for proactive anomaly detection and risk assessment in organizational environments.
6. Threat Models
The proposed tool, designed for real-time insider threat identification and user profiling, is subject to several potential threats that can compromise its effectiveness and reliability. These threats stem from both internal and external adversaries, each leveraging specific vulnerabilities in the system’s architecture, processes, or underlying technologies. Addressing these risks is essential to ensure the robustness and trustworthiness of the solution.
6.1. Internal Threats
Internal users, such as employees and contractors with authorized access, pose a significant challenge. These individuals have insider knowledge of the system, enabling them to exploit its weaknesses. They may manipulate risk scores, bypass monitoring protocols, or disguise malicious behavior as legitimate actions. To mitigate these risks, the system must implement granular access controls and multi-level authentication mechanisms that limit user privileges to only those necessary for their roles. Also, deploying anomaly detection algorithms capable of identifying subtle behavioral deviations is crucial. Continuous employee training on cybersecurity awareness can further reduce the risk of accidental or intentional misuse.
6.2. External Threats
Externally, adversaries such as cybercriminals and malicious actors can exploit vulnerabilities through sophisticated attacks, including data poisoning, adversarial inputs, and evasion tactics. For instance, attackers may inject misleading data during model training to degrade its detection accuracy. Similarly, adversarial samples crafted to deceive the ML algorithms can lead to misclassification of risky behaviors. To counter these risks, the system must employ robust model training techniques with adversarial robustness, such as defensive distillation or gradient masking. Regularly updating models with verified data and incorporating ensemble learning methods can further enhance resilience against external manipulations.
6.3. Systemic Vulnerabilities
The reliance on ML models introduces risks related to their interpretability and performance under unseen conditions. For example, high dependency on synthetic datasets during model development can limit real-world generalizability, leaving the system vulnerable to unexpected anomalies. To address this, continuous model validation with diverse, real-world datasets should be conducted. Integrating explainable AI techniques can help administrators understand and trust the system’s decisions, allowing them to identify and rectify flaws quickly.
6.4. Communication and Infrastructure Threats
The communication channels and system infrastructure are also potential targets for attacks, such as man-in-the-middle (MITM) interception, unauthorized data access, or distributed denial-of-service (DDoS) attacks. Encrypting all data transmissions using end-to-end encryption protocols and implementing network segmentation can protect against these threats. Redundancy and failover mechanisms should be incorporated to maintain functionality during infrastructure attacks.
7. Discussion
This section examines the proposed tool by quantitatively comparing it with recent studies, identifying key limitations, and proposing future research directions.
7.1. Quantitative Comparison with Recent Studies
Table 7 compares the proposed tool quantitatively with recently developed tools discussed in Section 2, which utilize the same ML algorithms as our study. While most recent studies in the table primarily focus on classifying behavior types or detecting the occurrence of anomalous behavior, our work distinguishes itself by addressing anomalous behavior through dynamic user classification based on risk. Also, we believe that our model enhances other studies [60,61,62,63] that have similar results as our study by working on online data instead of relying on offline-static data.
7.2. Limitations
A limitation of this study is the use of synthetic data, which may not fully reflect the complexities of real-world scenarios. The reliance on synthetic datasets is necessitated by the challenges of obtaining real-world datasets. Insider datasets are highly sensitive, and organizations are often unwilling to share such information due to concerns about confidentiality, privacy regulations, and potential reputational damage. Therefore, Synthetic datasets allow us to simulate a wide range of scenarios and behaviors in a controlled environment, enabling the development and testing of the proposed tool despite the lack of access to real-world data.
Another limitation of this study is the focus on technical indicators, such as login patterns and data transfer anomalies, excludes critical psychological and contextual factors. For example, factors such as employee stress, dissatisfaction, or behavioral shifts, which could serve as early indicators of malicious intent, are not integrated into the detection framework. This omission limits the comprehensiveness of the threat model, as insider threats often involve a combination of technical and human elements.
7.3. Future Research Direction
To address these limitations, future research should prioritize integrating real-world datasets from diverse industries. For instance, datasets from financial or healthcare sectors, which are highly sensitive to insider threats, could enhance the model’s robustness and generalizability. Collaboration with industry partners could also facilitate the acquisition of such data while addressing privacy and compliance concerns.
Moreover, incorporating psychological profiling into the detection framework presents a promising avenue. For example, natural language processing techniques could analyze communication patterns for signs of stress or dissatisfaction, while sentiment analysis could evaluate email or chat logs for indicators of potential risks. These insights, combined with technical indicators, would enable a more holistic and proactive security strategy.
Finally, expanding the tool’s scalability and interoperability with existing security systems, such as SIEM platforms or identity management tools, could increase its adoption in real-world scenarios. Performance benchmarking on heterogeneous infrastructure and further exploration of adversarial robustness in ML will also be critical in refining the system.
8. Conclusion
This paper underscores the critical role of real-time threat detection and classification systems in mitigating insider threats, a persistent challenge in organizational cybersecurity. By leveraging ML, the proposed tool dynamically categorizes employee behaviors into risk levels—low, medium, and high—thereby enhancing organizational resilience against malicious activities. The tool’s simulation, conducted using the Postman API platform, effectively demonstrated the system’s capabilities in detecting anomalous actions, calculating risk scores, and classifying users based on their behaviors. Among the evaluated models, XGBoost emerged as the most effective, achieving superior accuracy and excelling in the identification of malicious behaviors. These results validate the tool’s potential as a robust solution for real-time decision-making and proactive threat management.
The findings emphasize the transformative impact of ML in automating insider threat detection, enabling security teams to focus on higher-priority tasks while reducing response times. Moreover, the tool’s design and real-time analytics provide a scalable framework that can be tailored to various organizational contexts.
Despite its strengths, the study acknowledges the limitation of relying on synthetic datasets. Future research will focus on validating the system using real-world datasets to ensure broader applicability and reliability. Also, incorporating contextual and psychological profiling, such as detecting behavioral shifts or stress indicators, could further enhance the system’s comprehensiveness and predictive capabilities.
Finally, this proposed tool provides a significant step forward in addressing insider threats, offering an innovative and practical approach that bridges the gaps in existing methods. The proposed tool paves the way for more effective, scalable, and interdisciplinary solutions, ensuring enhanced security in an increasingly complex digital landscape.
References
- Verizon. 2024 Data Breach Investigations Report. Technical report, Verizon, 2024. Accessed September 10, 2024.
- IBM. Cost of a Data Breach Report 2024. Technical report, IBM, 2024. Accessed September 10, 2024.
- Le, D.C.; Zincir-Heywood, N. Exploring anomalous behaviour detection and classification for insider threat identification. International Journal of Network Management 2021, 31, e2109. [CrossRef]
- Al-Shehari, T.; Rosaci, D.; Al-Razgan, M.; Alfakih, T.; Kadrie, M.; Afzal, H.; Nawaz, R. Enhancing Insider Threat Detection in Imbalanced Cybersecurity Settings Using the Density-Based Local Outlier Factor Algorithm. IEEE Access 2024. [CrossRef]
- Chaabouni, N.; Mosbah, M.; Zemmari, A.; Sauvignac, C.; Faruki, P. Network intrusion detection for IoT security based on learning techniques. IEEE Communications Surveys & Tutorials 2019, 21, 2671–2701. [CrossRef]
- Khraisat, A.; Gondal, I.; Vamplew, P.; Kamruzzaman, J. Survey of intrusion detection systems: techniques, datasets and challenges. Cybersecurity 2019, 2, 1–22.
- Chandel, S.; Yu, S.; Yitian, T.; Zhili, Z.; Yusheng, H. Endpoint protection: Measuring the effectiveness of remediation technologies and methodologies for insider threat. In Proceedings of the 2019 international conference on cyber-enabled distributed computing and knowledge discovery (cyberc). IEEE, 2019, pp. 81–89.
- Zargar, A.; Nowroozi, A.; Jalili, R. XABA: A zero-knowledge anomaly-based behavioral analysis method to detect insider threats. In Proceedings of the 2016 13th International Iranian society of cryptology conference on information security and cryptology (ISCISC). IEEE, 2016, pp. 26–31.
- Fujii, S.; Kurima, I.; Isobe, Y. Scoring Method for Detecting Potential Insider Threat based on Suspicious User Behavior using Endpoint Logs. In Proceedings of the Proceedings on the International Conference on Artificial Intelligence (ICAI). The Steering Committee of The World Congress in Computer Science, Computer …, 2019, pp. 291–297.
- Pramudya, P.B.; Alamsyah, A. Implementation of signature-based intrusion detection system using SNORT to prevent threats in network servers. Journal of Soft Computing Exploration 2022, 3, 93–98. [CrossRef]
- Díaz-Verdejo, J.; Muñoz-Calle, J.; Estepa Alonso, A.; Estepa Alonso, R.; Madinabeitia, G. On the detection capabilities of signature-based intrusion detection systems in the context of web attacks. Applied Sciences 2022, 12, 852. [CrossRef]
- Asad, H.; Adhikari, S.; Gashi, I. A perspective–retrospective analysis of diversity in signature-based open-source network intrusion detection systems. International Journal of Information Security 2023, pp. 1–16. [CrossRef]
- Gupta, A.; Sharma, L.S. Performance evaluation of snort and suricata intrusion detection systems on ubuntu server. In Proceedings of the Proceedings of ICRIC 2019: Recent Innovations in Computing. Springer, 2020, pp. 811–821.
- Kumar, A.; Tanwar, A.; Malhotra, V. A COMPARATIVE ANALYSIS OF DIFFERENT INTRUSION DETECTION SYSTEMS. International Research Journal of Modernization in Engineering Technology and Science 2023.
- Guo, Y. A review of Machine Learning-based zero-day attack detection: Challenges and future directions. Computer Communications 2023, 198, 175–185. [CrossRef]
- Singh, U.K.; Joshi, C.; Kanellopoulos, D. A framework for zero-day vulnerabilities detection and prioritization. Journal of Information Security and Applications 2019, 46, 164–172. [CrossRef]
- Alsharabi, N.; Alqunun, M.; Murshed, B.A.H. Detecting Unusual Activities in Local Network Using Snort and Wireshark Tools. Journal of Advances in Information Technology 2023, 14. [CrossRef]
- Legg, P.A.; Buckley, O.; Goldsmith, M.; Creese, S. Caught in the act of an insider attack: detection and assessment of insider threat. In Proceedings of the 2015 IEEE International Symposium on Technologies for Homeland Security (HST), 2015, pp. 1–6. [CrossRef]
- Legg, P.; Buckley, O.; Goldsmith, M.; Creese, S. Automated Insider Threat Detection System Using User and Role-Based Profile Assessment. IEEE Systems Journal 2017, 11, 503–512. [CrossRef]
- Joshi, C.; Aliaga, J.R.; Insua, D.R. Insider Threat Modeling: An Adversarial Risk Analysis Approach. IEEE Transactions on Information Forensics and Security 2021, 16, 1131–1142. [CrossRef]
- Rios Insua, D.; Couce-Vieira, A.; Rubio, J.A.; Pieters, W.; Labunets, K.; G. Rasines, D. An adversarial risk analysis framework for cybersecurity. Risk Analysis 2021, 41, 16–36. [CrossRef]
- Kaushik, K. A systematic approach to develop an advanced insider attacks detection module. Journal of Engineering and Applied Sciences 2021, 8, 33. [CrossRef]
- Mehnaz, S.; Bertino, E. A Fine-Grained Approach for Anomaly Detection in File System Accesses With Enhanced Temporal User Profiles. IEEE Transactions on Dependable and Secure Computing 2021, 18, 2535–2550. [CrossRef]
- Pham, N.; Guo, J.; Wang, Z. Abnormality Detection in Network Traffic by Classification and Graph Data Analysis. In Proceedings of the 2022 IEEE 13th Annual Information Technology, Electronics and Mobile Communication Conference (IEMCON), 2022, pp. 0041–0047. [CrossRef]
- Teymourlouei, H.; Harris, V.E. Preventing Data Breaches: Utilizing Log Analysis and Machine Learning for Insider Attack Detection. In Proceedings of the 2022 International Conference on Computational Science and Computational Intelligence (CSCI), 2022, pp. 1022–1027. [CrossRef]
- Abdulhammed, R.; Faezipour, M.; Abuzneid, A.; AbuMallouh, A. Deep and machine learning approaches for anomaly-based intrusion detection of imbalanced network traffic. IEEE sensors letters 2018, 3, 1–4. [CrossRef]
- Le, D.C.; Zincir-Heywood, A.N. Evaluating insider threat detection workflow using supervised and unsupervised learning. In Proceedings of the 2018 IEEE Security and Privacy Workshops (SPW). IEEE, 2018, pp. 270–275. [CrossRef]
- Park, H.; Kim, K.; Shin, D.; Shin, D. BGP Dataset-Based Malicious User Activity Detection Using Machine Learning. Information 2023, 14, 501.
- Alshamy, R.; Ghurab, M.; Othman, S.; Alshami, F. Intrusion detection model for imbalanced dataset using SMOTE and random forest algorithm. In Proceedings of the Advances in Cyber Security: Third International Conference, ACeS 2021, Penang, Malaysia, August 24–25, 2021, Revised Selected Papers 3. Springer, 2021, pp. 361–378.
- Padmavathi, G.; Shanmugapriya, D.; Asha, S. A framework to detect the malicious insider threat in cloud environment using supervised learning methods. In Proceedings of the 2022 9th International Conference on Computing for Sustainable Global Development (INDIACom). IEEE, 2022, pp. 354–358.
- Le, D.C.; Zincir-Heywood, N. Anomaly Detection for Insider Threats Using Unsupervised Ensembles. IEEE Transactions on Network and Service Management 2021, 18, 1152–1164. [CrossRef]
- Ahmadi-Assalemi, G.; Al-Khateeb, H.; Epiphaniou, G.; Aggoun, A. Super Learner Ensemble for Anomaly Detection and Cyber-Risk Quantification in Industrial Control Systems. IEEE Internet of Things Journal 2022, 9, 13279–13297. [CrossRef]
- Diop, A.; Emad, N.; Winter, T.; Hilia, M. Design of an ensemble learning behavior anomaly detection framework. International Journal of Computer and Information Engineering 2019, 13, 547–555.
- Yi, J.; Tian, Y. Insider Threat Detection Model Enhancement Using Hybrid Algorithms between Unsupervised and Supervised Learning. Electronics 2024, 13, 973. [CrossRef]
- Alshuaibi, F.; Alshamsi, F.; Saeed, A.; Kaddoura, S. Machine Learning-Based Classification Approach for Network Intrusion Detection System. In Proceedings of the 2024 15th Annual Undergraduate Research Conference on Applied Computing (URC). IEEE, 2024, pp. 1–6.
- Al Lail, M.; Garcia, A.; Olivo, S. Machine learning for network intrusion detection—a comparative study. Future Internet 2023, 15, 243. [CrossRef]
- Nikiforova, O.; Romanovs, A.; Zabiniako, V.; Kornienko, J. Detecting and Identifying Insider Threats Based on Advanced Clustering Methods. IEEE Access 2024, 12, 30242–30253. [CrossRef]
- Mehmood, M.; Amin, R.; Muslam, M.M.A.; Xie, J.; Aldabbas, H. Privilege Escalation Attack Detection and Mitigation in Cloud Using Machine Learning. IEEE Access 2023, 11, 46561–46576. [CrossRef]
- Nandini, K.; Girisha, G.; Reddy, S. CGBA: A Efficient Insider Attacker Detection Technique in Machine Learning. In Proceedings of the 2024 International Conference on Advances in Computing, Communication and Applied Informatics (ACCAI). IEEE, 2024, pp. 1–8.
- Li, Y.; Su, Y. The Insider Threat Detection Method of University Website Clusters Based on Machine Learning. In Proceedings of the 2023 6th International Conference on Artificial Intelligence and Big Data (ICAIBD), 2023, pp. 560–565. [CrossRef]
- Suresh, P.V.; Madhavu, M.L. Insider attack: Internal cyber attack detection using machine learning. In Proceedings of the 2021 12th International conference on computing communication and networking technologies (ICCCNT). IEEE, 2021, pp. 1–7.
- Peccatiello, R.B.; Gondim, J.J.C.; Garcia, L.P.F. Applying One-Class Algorithms for Data Stream-Based Insider Threat Detection. IEEE Access 2023, 11, 70560–70573. [CrossRef]
- Böse, B.; Avasarala, B.; Tirthapura, S.; Chung, Y.Y.; Steiner, D. Detecting Insider Threats Using RADISH: A System for Real-Time Anomaly Detection in Heterogeneous Data Streams. IEEE Systems Journal 2017, 11, 471–482. [CrossRef]
- Verma, A.; Ranga, V. Statistical analysis of CIDDS-001 dataset for Network Intrusion Detection Systems using Distance-based Machine Learning. Procedia Computer Science 2018, 125, 709–716. The 6th International Conference on Smart Computing and Communications. [CrossRef]
- Zhang, F.; Kodituwakku, H.A.D.E.; Hines, J.W.; Coble, J. Multilayer Data-Driven Cyber-Attack Detection System for Industrial Control Systems Based on Network, System, and Process Data. IEEE Transactions on Industrial Informatics 2019, 15, 4362–4369. [CrossRef]
- Begli, M.; Derakhshan, F.; Karimipour, H. A layered intrusion detection system for critical infrastructure using machine learning. In Proceedings of the 2019 IEEE 7th International Conference on Smart Energy Grid Engineering (SEGE). IEEE, 2019, pp. 120–124.
- Kim, J.; Park, M.; Kim, H.; Cho, S.; Kang, P. Insider threat detection based on user behavior modeling and anomaly detection algorithms. Applied Sciences 2019, 9, 4018.
- Le, D.C.; Zincir-Heywood, N.; Heywood, M.I. Analyzing Data Granularity Levels for Insider Threat Detection Using Machine Learning. IEEE Transactions on Network and Service Management 2020, 17, 30–44. [CrossRef]
- Khan, A.Y.; Latif, R.; Latif, S.; Tahir, S.; Batool, G.; Saba, T. Malicious Insider Attack Detection in IoTs Using Data Analytics. IEEE Access 2020, 8, 11743–11753. [CrossRef]
- Zou, S.; Sun, H.; Xu, G.; Quan, R. Ensemble Strategy for Insider Threat Detection from User Activity Logs. Computers, Materials & Continua 2020, 65, 1321–1334. [CrossRef]
- Janjua, F.; Masood, A.; Abbas, H.; Rashid, I. Handling insider threat through supervised machine learning techniques. Procedia Computer Science 2020, 177, 64–71. [CrossRef]
- Shaver, A.; Liu, Z.; Thapa, N.; Roy, K.; Gokaraju, B.; Yuan, X. Anomaly based intrusion detection for iot with machine learning. In Proceedings of the 2020 IEEE applied imagery pattern recognition workshop (AIPR). IEEE, 2020, pp. 1–6.
- Abhale, A.B.; Manivannan, S. Supervised machine learning classification algorithmic approach for finding anomaly type of intrusion detection in wireless sensor network. Optical Memory and Neural Networks 2020, 29, 244–256. [CrossRef]
- Oliveira, N.; Praça, I.; Maia, E.; Sousa, O. Intelligent Cyber Attack Detection and Classification for Network-Based Intrusion Detection Systems. Applied Sciences 2021, 11. [CrossRef]
- Al-Shehari, T.; Alsowail, R.A. An insider data leakage detection using one-hot encoding, synthetic minority oversampling and machine learning techniques. Entropy 2021, 23, 1258.
- Almomani, O.; Almaiah, M.A.; Alsaaidah, A.; Smadi, S.; Mohammad, A.H.; Althunibat, A. Machine learning classifiers for network intrusion detection system: comparative study. In Proceedings of the 2021 International Conference on Information Technology (ICIT). IEEE, 2021, pp. 440–445.
- Taghavirashidizadeh, A.; Zavvar, M.; Moghadaspour, M.; Jafari, M.; Garoosi, H.; Zavvar, M.H. Anomaly Detection In IoT Networks Using Hybrid Method Based On PCA-XGBoost. In Proceedings of the 2022 8th Iranian Conference on Signal Processing and Intelligent Systems (ICSPIS). IEEE, 2022, pp. 1–5.
- Manoharan, P.; Yin, J.; Wang, H.; Zhang, Y.; Ye, W. Insider threat detection using supervised machine learning algorithms. Telecommunication Systems 2023, pp. 1–17. [CrossRef]
- Inuwa, M.M.; Das, R. A comparative analysis of various machine learning methods for anomaly detection in cyber attacks on IoT networks. Internet of Things 2024, 26, 101162. [CrossRef]
- Faysal, J.A.; Mostafa, S.T.; Tamanna, J.S.; Mumenin, K.M.; Arifin, M.M.; Awal, M.A.; Shome, A.; Mostafa, S.S. XGB-RF: A hybrid machine learning approach for IoT intrusion detection. In Proceedings of the Telecom. MDPI, 2022, Vol. 3, pp. 52–69.
- OYELAKIN, A.M. A Learning Approach for The Identification of Network Intrusions Based on Ensemble XGBoost Classifier. Indonesian Journal of Data and Science 2023, 4, 190–197. [CrossRef]
- Khan, N.; Mohmand, M.I.; Rehman, S.u.; Ullah, Z.; Khan, Z.; Boulila, W. Advancements in intrusion detection: A lightweight hybrid RNN-RF model. Plos one 2024, 19, e0299666. [CrossRef]
- Onyebueke, A.E.; David, A.A.; Munu, S. Network Intrusion Detection System Using XGBoost and Random Forest Algorithms. Asian Journal of Pure and Applied Mathematics 2023, pp. 321–335.
Figure 1.
Paper Structure.
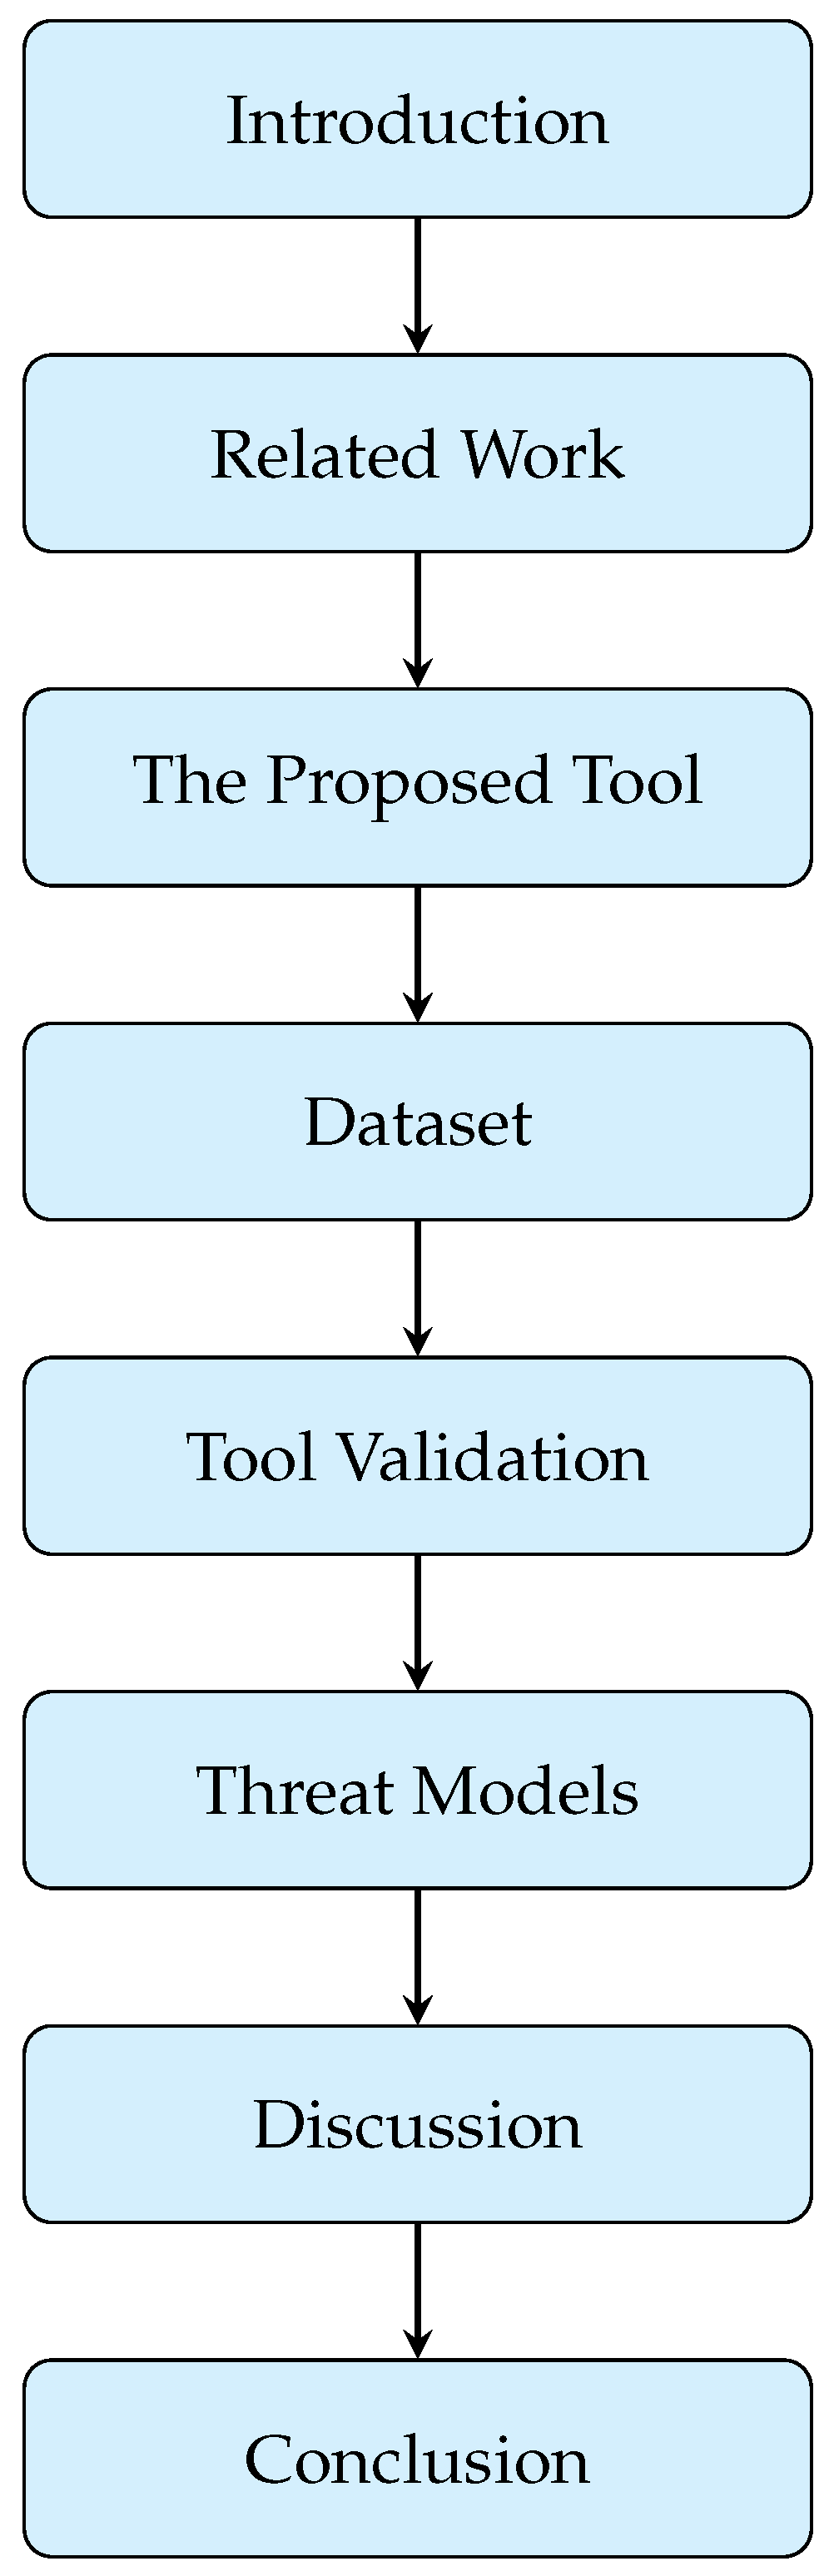
Figure 2.
System Workflow Diagram.
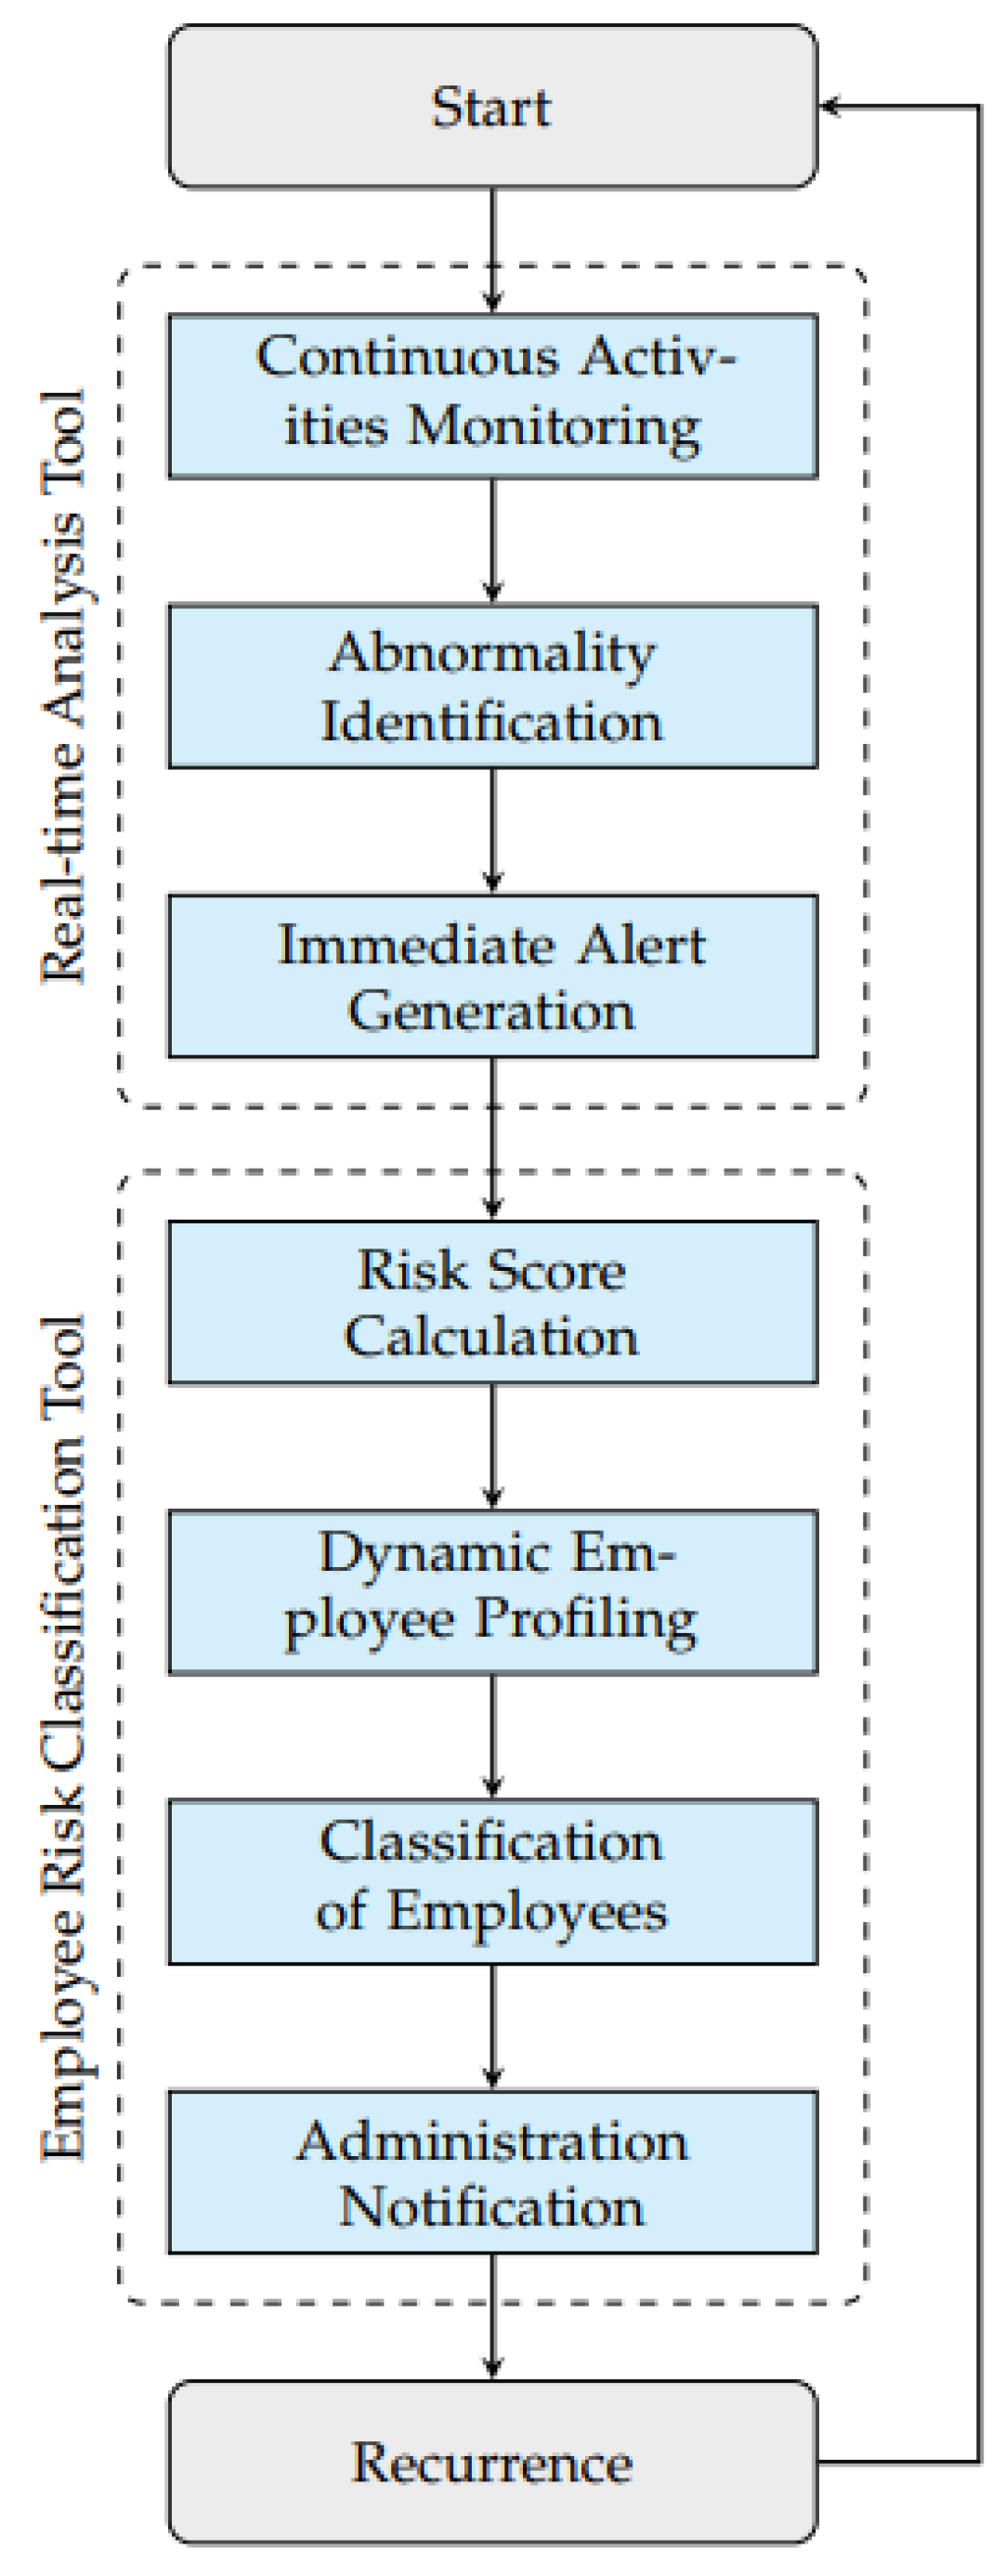
Figure 3.
Alert Generation.
Figure 4.
Administration Notification.
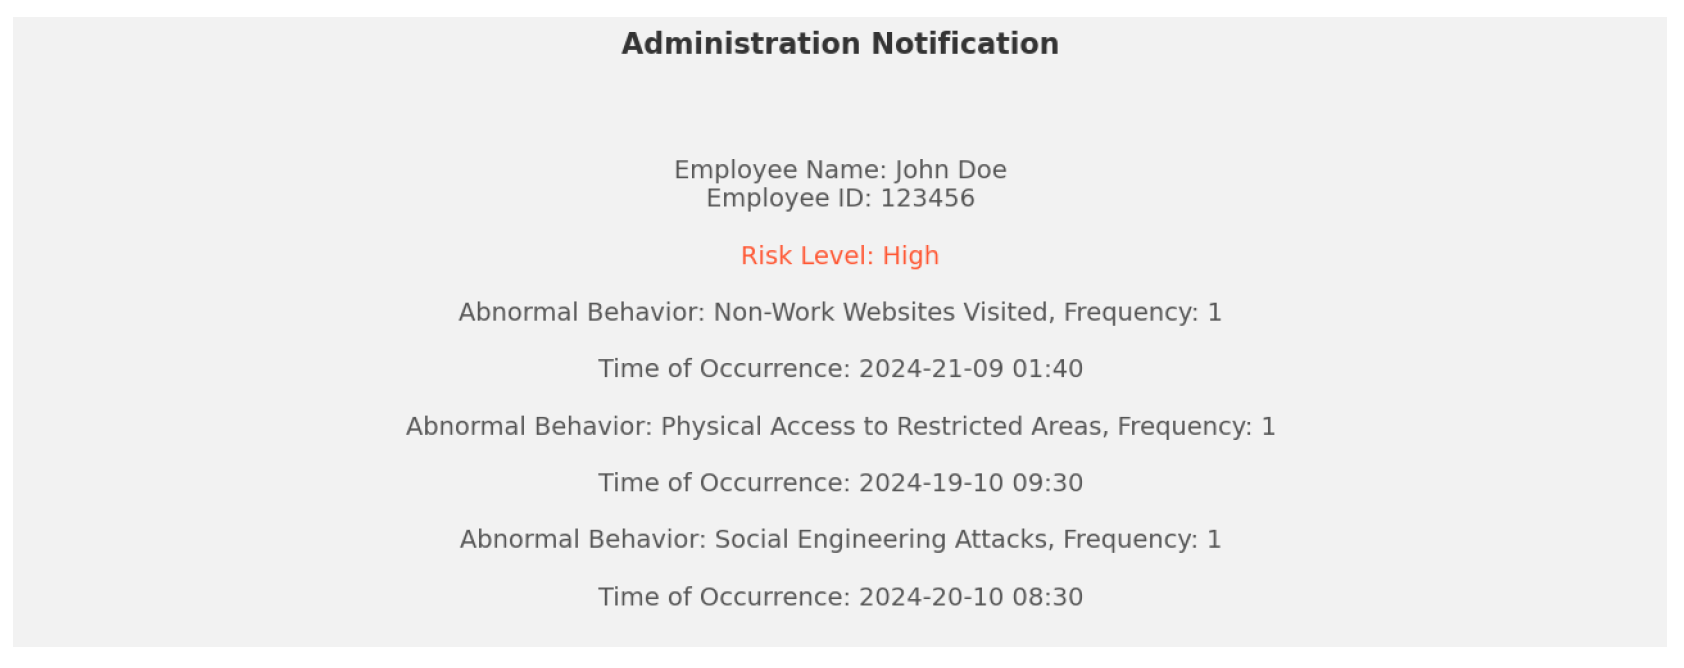
Figure 5.
Data Cleaning and Preprocessing Workflow.
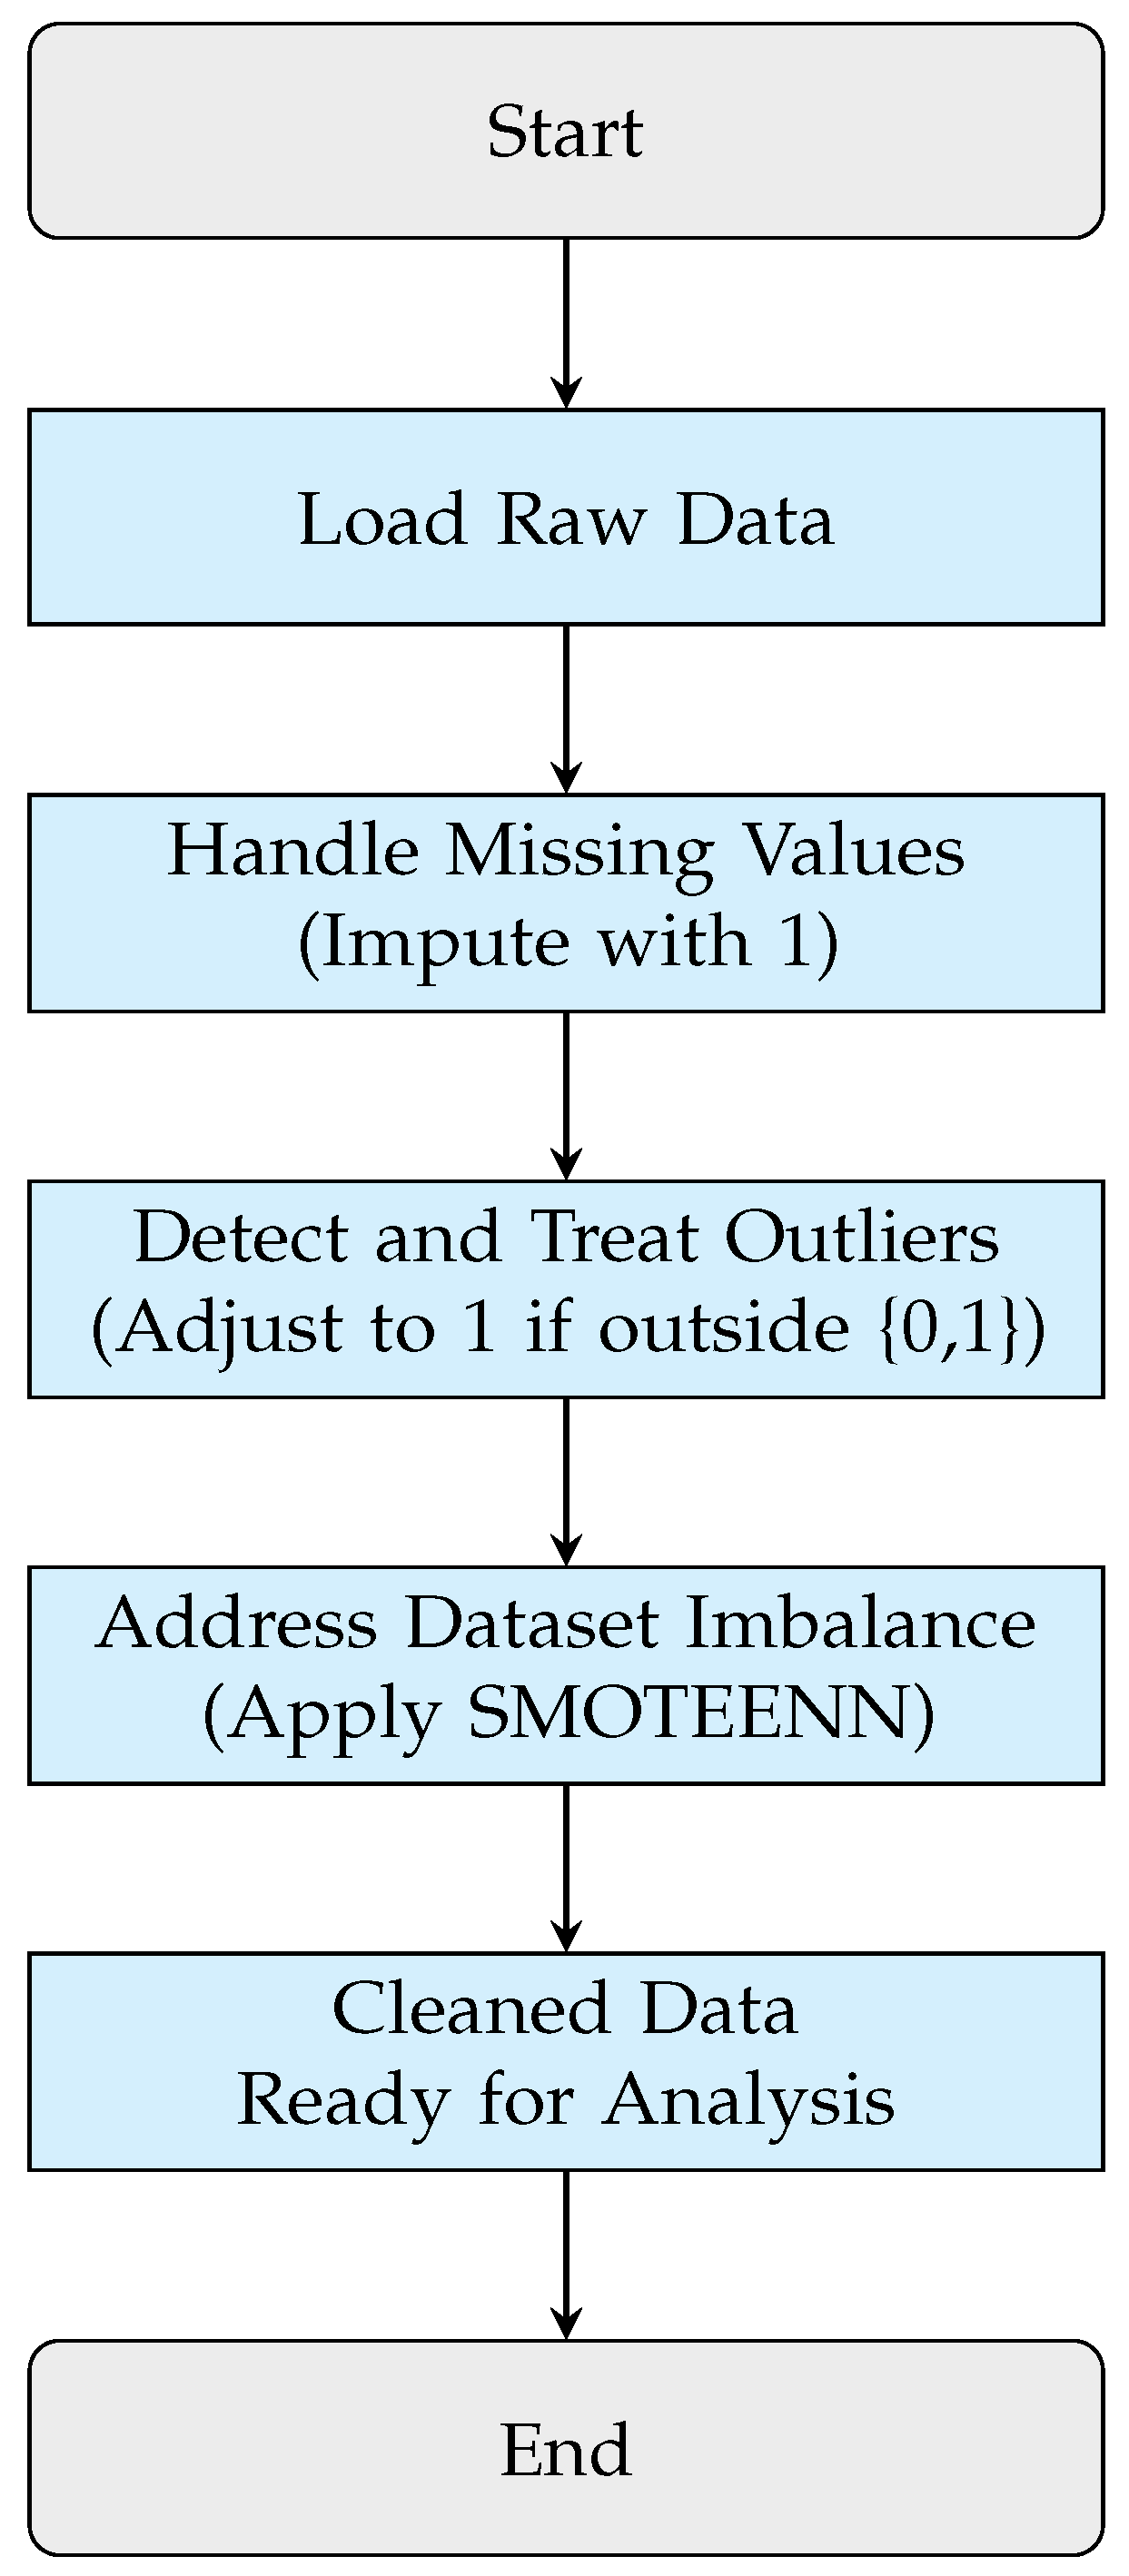
Figure 6.
Outliers Boxplots.
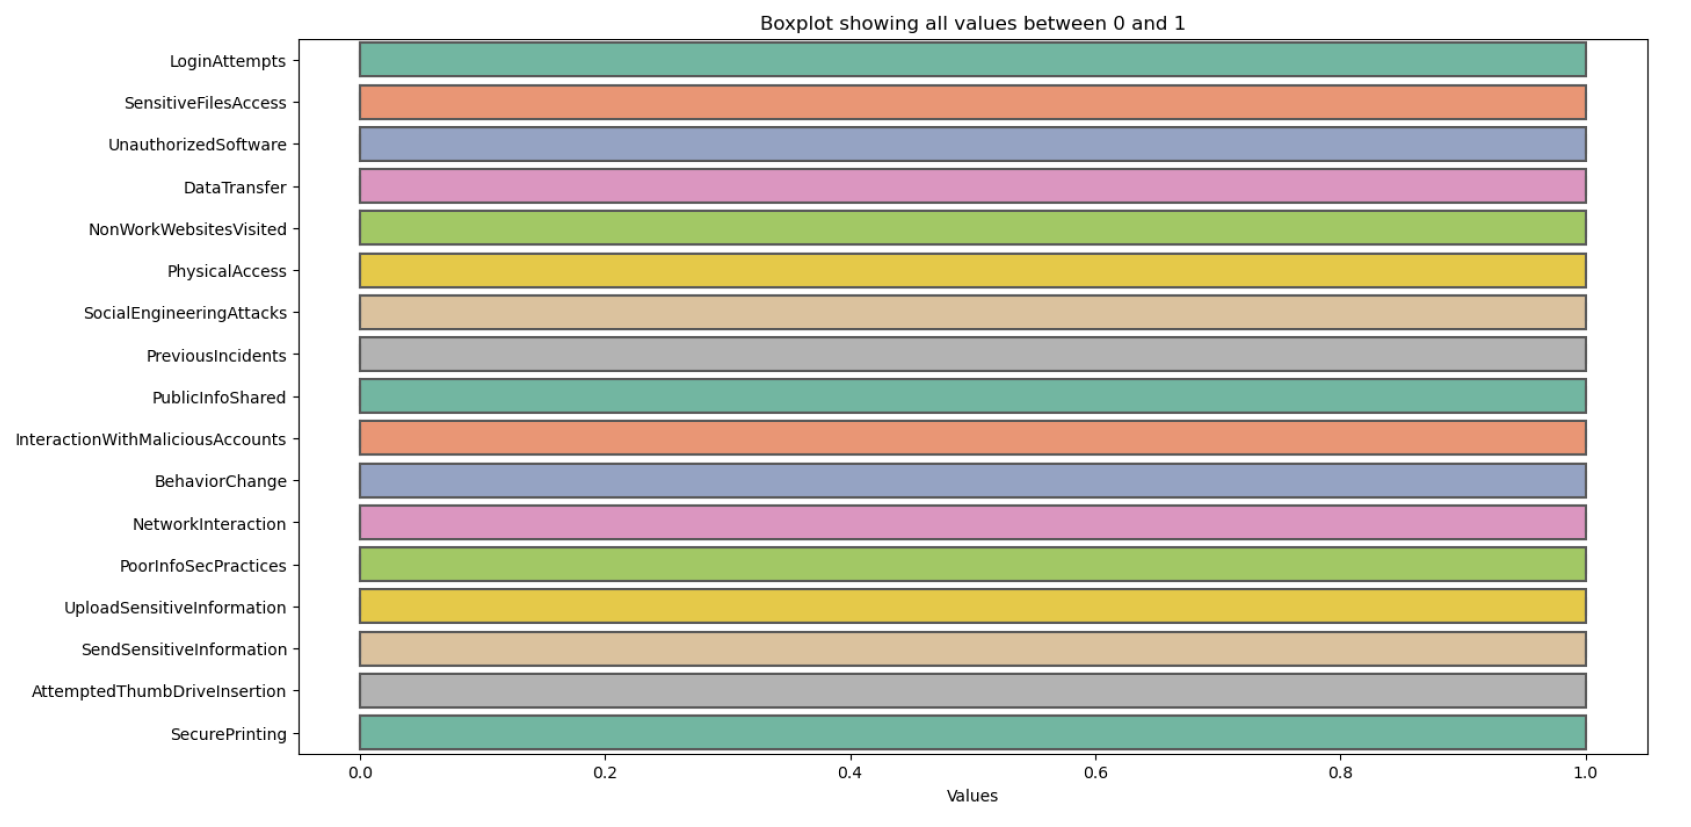
Figure 7.
Confusion matrices for various models: (a) Random Forest (RF). (b) Logistic Regression (LR). (c) XGBoost. (d) Support Vector Machine (SVM).
Figure 7.
Confusion matrices for various models: (a) Random Forest (RF). (b) Logistic Regression (LR). (c) XGBoost. (d) Support Vector Machine (SVM).
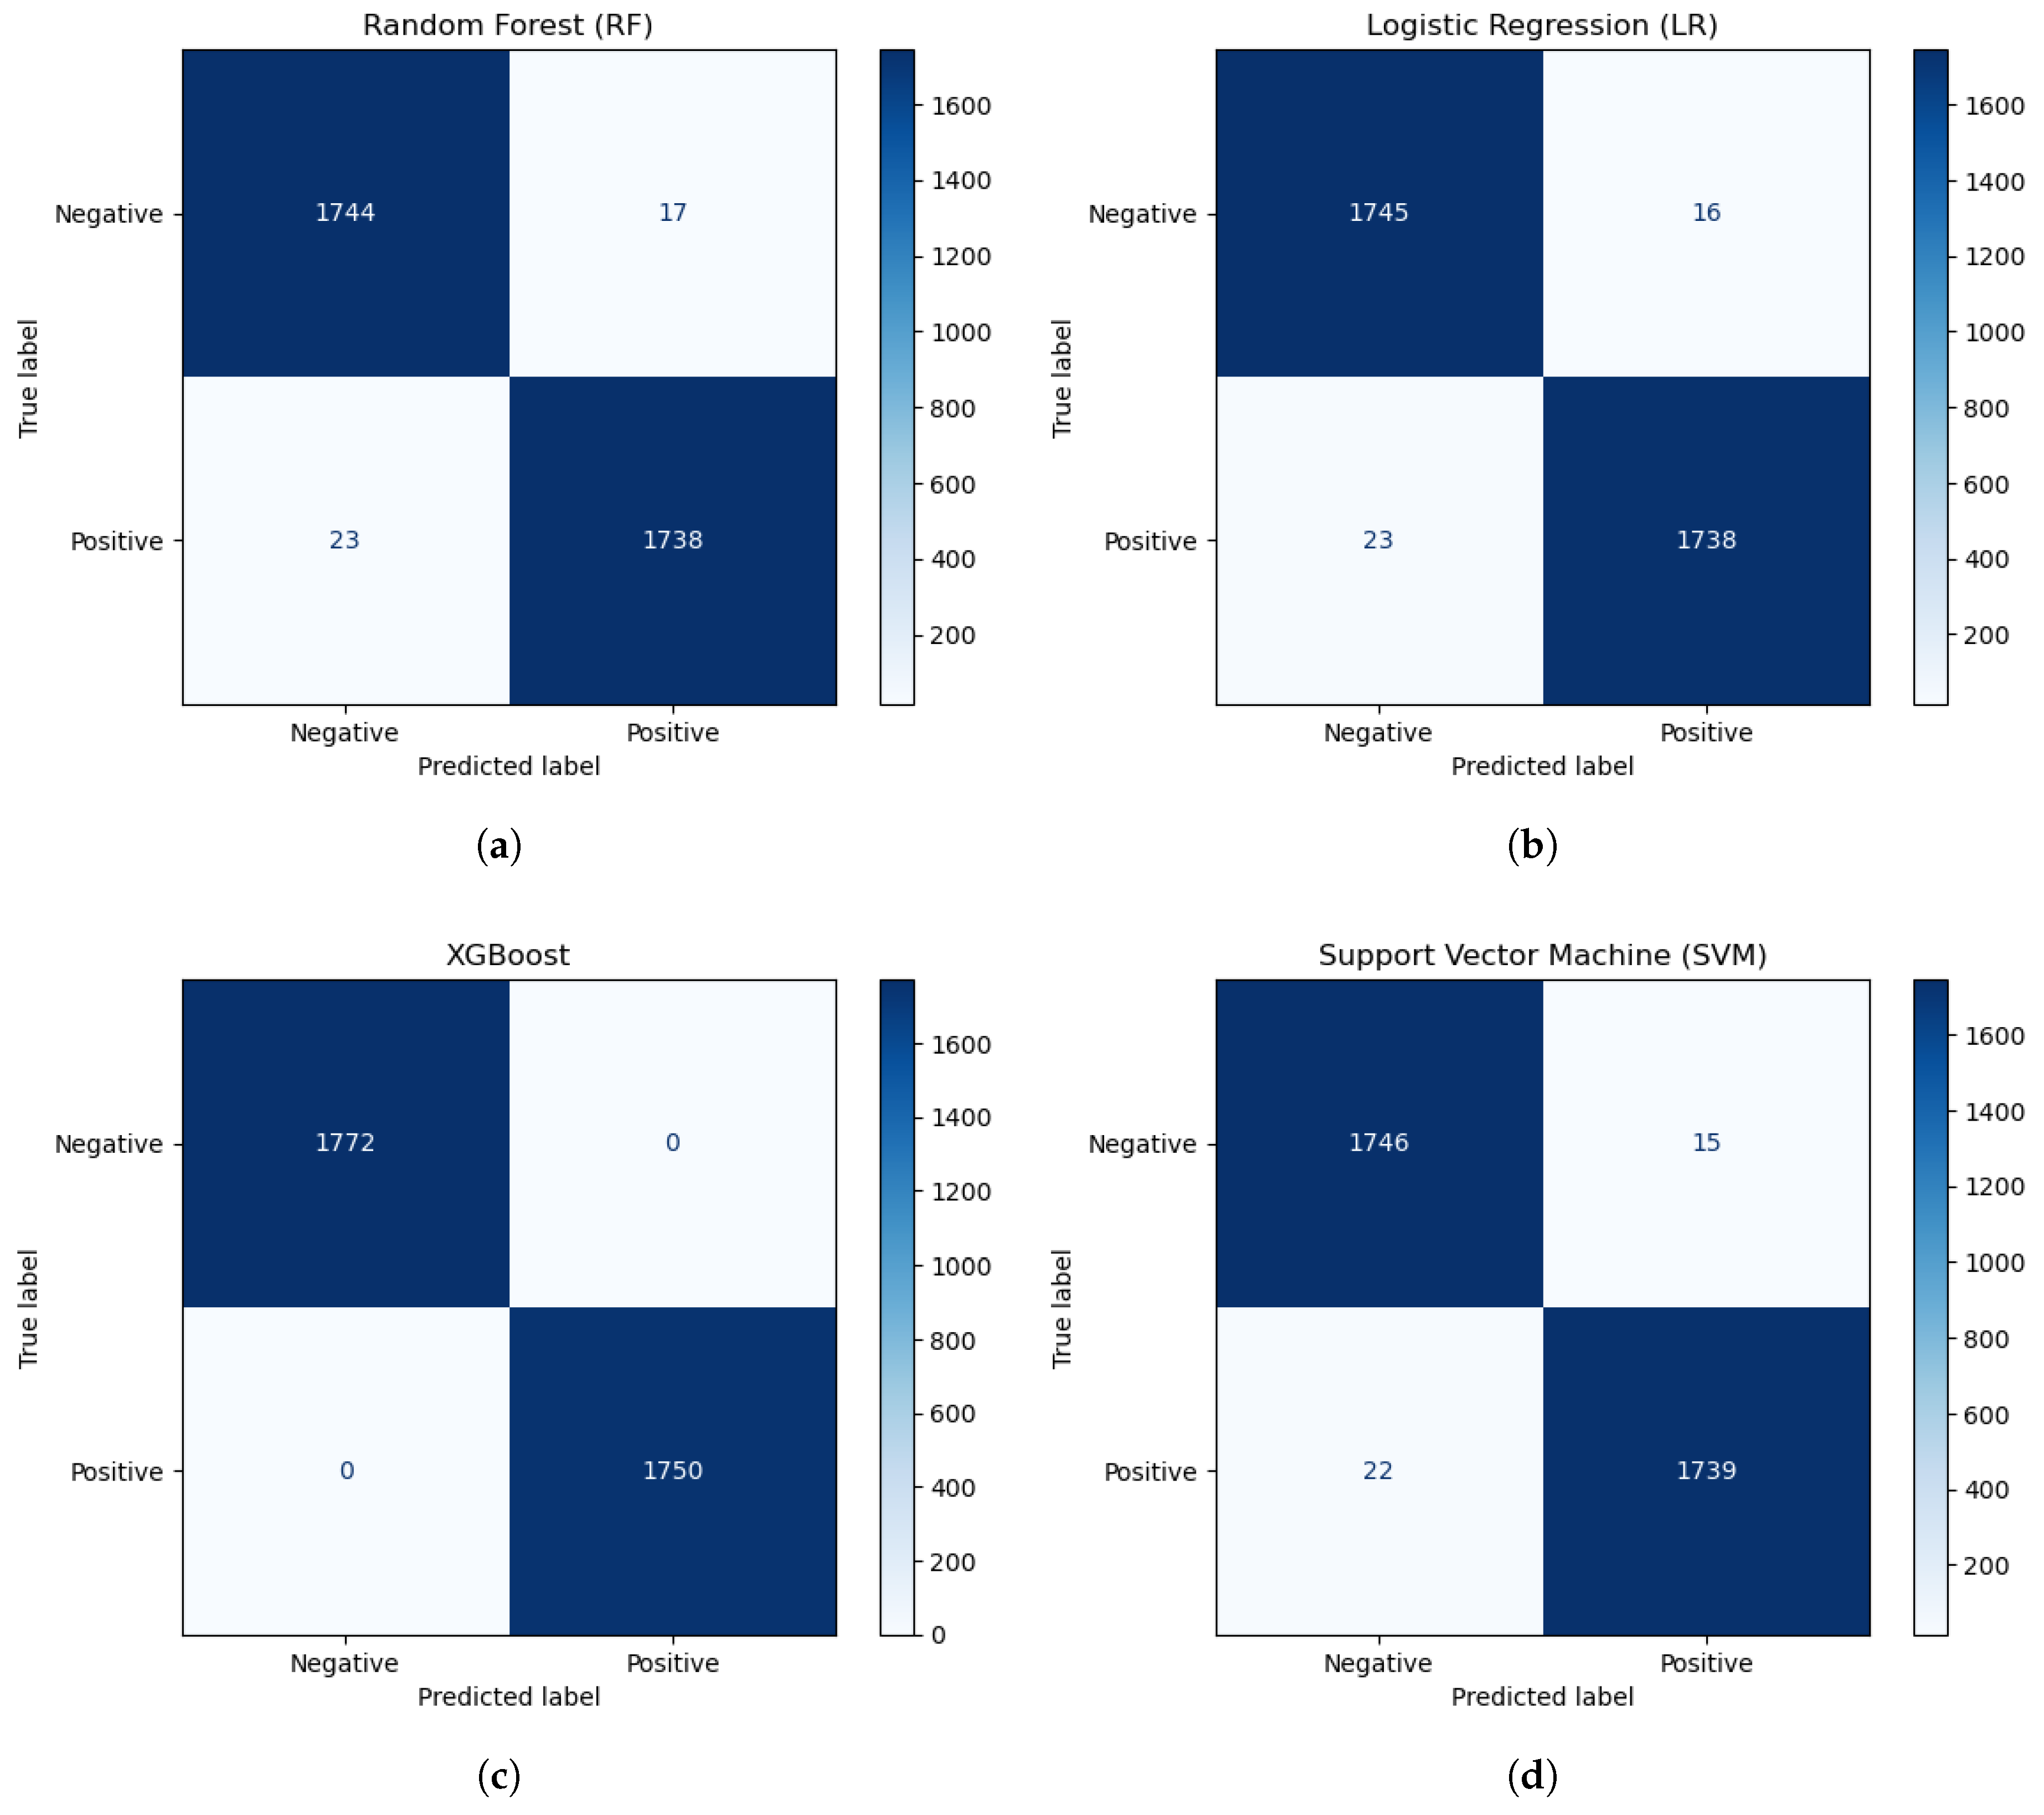

Table 1.
Comparison with The Discussed Works, Where ✓: Feature Supported, ✗: Feature Not Supported, and N/D: Feature Not Discussed.
Table 1.
Comparison with The Discussed Works, Where ✓: Feature Supported, ✗: Feature Not Supported, and N/D: Feature Not Discussed.
| Study | Instantaneous Data | Real-Time | Real-Time User Classification | Non-Interactive | Continuous | Adjustability | Detection Time | Classification Time |
|---|---|---|---|---|---|---|---|---|
| Analysis | ||||||||
| [26] | N/D | ✓ | ✗ | ✓ | ✗ | ✗ | ✗ | ✗ |
| [27] | ✗ | ✗ | ✗ | ✓ | ✓ | ✗ | ✓ | ✗ |
| [28] | ✓ | ✓ | ✗ | N/D | ✓ | ✓ | ✗ | ✗ |
| [29] | ✓ | ✓ | ✗ | ✗ | ✗ | ✓ | ✓ | ✗ |
| [30] | ✓ | ✓ | ✗ | ✓ | ✓ | ✗ | ✗ | ✗ |
| [31] | ✗ | ✓ | ✗ | ✗ | ✓ | ✓ | ✗ | ✗ |
| [32] | ✓ | ✗ | ✗ | ✓ | ✓ | ✓ | ✓ | ✗ |
| [33] | ✓ | ✓ | ✗ | ✓ | ✓ | ✓ | ✗ | ✗ |
| [34] | ✗ | ✗ | ✗ | ✓ | ✓ | ✓ | ✗ | ✗ |
| [35] | ✓ | ✓ | ✗ | N/D | ✗ | ✓ | ✗ | ✗ |
| [36] | ✓ | ✓ | ✗ | N/D | N/D | N/D | ✗ | ✗ |
| [37] | ✓ | ✓ | ✗ | ✗ | ✓ | N/D | ✗ | ✗ |
| [38] | ✓ | ✓ | ✗ | ✗ | N/D | ✗ | ✗ | ✗ |
| [39] | N/D | ✗ | ✗ | ✓ | N/D | N/D | ✗ | ✗ |
| [40] | ✓ | ✓ | ✗ | ✗ | ✓ | ✗ | ✗ | ✗ |
| [41] | N/D | ✓ | ✗ | ✓ | N/D | N/D | ✓ | ✗ |
| [42] | ✓ | ✗ | ✗ | ✓ | ✓ | ✓ | ✗ | ✗ |
| [43] | ✓ | ✗ | ✗ | ✗ | ✓ | ✓ | ✓ | ✗ |
| [44] | ✗ | ✓ | ✗ | N/D | N/D | N/D | ✗ | ✗ |
| [45] | ✓ | ✓ | ✗ | ✓ | ✓ | ✗ | ✗ | ✗ |
| [46] | ✓ | ✓ | ✗ | ✓ | ✓ | ✗ | ✓ | ✗ |
| [47] | ✓ | ✗ | ✗ | ✓ | ✓ | N/D | ✗ | ✗ |
| [48] | ✓ | ✓ | ✗ | ✗ | ✓ | ✗ | ✓ | ✗ |
| [49] | ✗ | ✗ | ✗ | ✓ | ✓ | ✓ | ✗ | ✗ |
| [50] | ✓ | ✗ | ✗ | ✓ | ✓ | ✓ | ✗ | ✗ |
| [51] | ✓ | ✓ | ✗ | ✓ | ✗ | N/D | ✗ | ✗ |
| [52] | ✓ | ✓ | ✗ | N/D | N/D | ✓ | ✓ | ✗ |
| [53] | ✓ | ✓ | ✗ | ✓ | ✗ | ✗ | ✗ | ✗ |
| [54] | ✓ | ✓ | ✗ | N/D | ✓ | ✗ | ✗ | ✗ |
| [55] | ✓ | ✗ | ✗ | N/D | ✓ | ✓ | ✗ | ✗ |
| [56] | ✓ | N/D | ✗ | ✓ | N/D | ✗ | ✗ | ✗ |
| [57] | ✗ | ✓ | ✗ | N/D | N/D | ✓ | ✗ | ✗ |
| [58] | ✗ | ✓ | ✗ | ✓ | ✓ | ✓ | ✗ | ✗ |
| [59] | ✓ | ✓ | ✗ | ✓ | N/D | ✓ | ✗ | ✗ |
| [60] | ✗ | ✓ | ✗ | N/D | N/D | ✗ | ✓ | ✗ |
| [61] | ✗ | ✗ | ✗ | ✓ | N/D | N/D | ✗ | ✗ |
| [62] | ✗ | ✓ | ✗ | N/D | N/D | ✓ | ✓ | ✗ |
| [63] | ✗ | ✓ | ✗ | N/D | N/D | N/D | ✗ | ✗ |
| ]1*Ours | ✓ | ✓ | ✓ | ✓ | ✓ | ✓ | ✓ | ✓ |
Table 2.
Abnormal Behaviors Description.
| Activity Type | Description | Weight |
|---|---|---|
| Login Attempts | Logging in outside the normal business hours | 4 |
| Sensitive Files Access | Unauthorized entry into confidential data | 7 |
| Unauthorized Software | Installation or use of unapproved software within an organization | 9 |
| Data Transfer | Unauthorized or unmonitored transfer of sensitive or confidential data within an organization | 6 |
| Non-Work Websites Visited | Unauthorized access or frequent visitation of websites unrelated to work duties | 5 |
| Physical Access | Unauthorized entry or access to restricted areas, equipment, or sensitive information | 8 |
| Social Engineering Attacks | Deceive individuals into divulging confidential information or performing actions that compromise security protocols | 8 |
| Previous Incidents | Past security breaches, data leaks, or unauthorized activities within an organization’s information systems | 10 |
| Public Info Shared | Disclosing sensitive or confidential information to the public domain | 5 |
| Interaction With Malicious Accounts | Engaging with fraudulent or compromised online entities | 8 |
| Behavior Change | Significant alterations in an individual’s actions or habits, often signaling potential security concerns | 6 |
| Network Interaction | Illegal engagement and communication activities that occur within a networked environment | 7 |
| Poor InfoSec Practices | Inadequate or careless information security practices | 9 |
| Upload Sensitive Information | Upload time, file type, encryption status, and user privilege | 8 |
| Send Sensitive Information | Transmitting confidential or proprietary data through various communication channels | 8 |
| Attempted Thumb Drive Insertion | Unauthorized or suspicious insertion of external storage devices, such as USB thumb drives, into computer systems or network devices | 10 |
| Secure Printing | Printing documents without adequate safeguards to protect the confidentiality and integrity of the printed information | 6 |
Table 3.
Features Description.
| Activity Type | Features |
|---|---|
| Login Attempts | Login time, number of failed attempts, login location, and device type |
| Sensitive Files Access | Access time, file type, access location, and user privilege |
| Unauthorized Software | Installation time, user permission, and location |
| Data Transfer | Transfer time, file size, and destination |
| Non-Work Websites Visited | Visit time, website category, and visit frequency |
| Physical Access | Entry time, location accessed, and badge type |
| Social Engineering Attacks | Attack type, response time, and sensitivity |
| Previous Incidents | Incident type, incident date, user involvement, and incident severity |
| Public Info Shared | Sharing time, information type, and platform location |
| Interaction With Malicious Accounts | Interaction time, malicious flag, and user reaction |
| Behavior Change | Change type, frequency, time of change, and user motivation |
| Network Interaction | Protocol type, data volume, and frequency |
| Poor InfoSec Practices | Practice type, frequency, user awareness, and severity |
| Upload Sensitive Information | Upload time, file type, encryption status, and user privilege |
| Send Sensitive Information | Send time, file type, and user privilege |
| Attempted Thumb Drive Insertion | Insert time, device type, and location |
| Secure Printing | Print time, document type, location, and user privilege |
Table 4.
List of Encoded Values.
| Variable | Encoded Values |
|---|---|
| Login Time | Working Hours (0), Non-Working Hours (1) |
| Login Location | Office (0), Remote (1) |
| Device Type | Desktop (0), Laptop (1), Mobile (2) |
| Access Time | Working Hours (0), Non-Working Hours (1) |
| Access Location | Office (0), Remote (1) |
| User Privilege | Normal (0), Admin (1) |
| File Type | Document (0), Media (1), Executable (2) |
| Installation Time | Working Hours (0), Non-Working Hours (1) |
| User Permission | Normal (0), Admin (1) |
| Location | Office (0), Remote (1) |
| Transfer Time | Working Hours (0), Non-Working Hours (1) |
| File Size | Small (0), Medium (1), Large (2) |
| Destination | Internal (0), External Trusted (1), External Untrusted (2) |
| Visit Time | Working Hours (0), Non-Working Hours (1) |
| Website Category | Social Media (0), Shopping (1), News (2), Gaming (3) |
| Entry Time | Working Hours (0), Non-Working Hours (1) |
| Location Accessed | Office (0), Remote (1) |
| Badge Type | Visitor (0), Employee (1), Contractor (2) |
| Attack Type | Phishing (0), Baiting (1), Pretexting (2) |
| Response Time | Working Hours (0), Non-Working Hours (1) |
| Sensitivity | No Response (0), Minimal Disclosure (1), Sensitive Disclosure (2) |
| Incident Type | Low Risk (0), Medium Risk (1), High Risk (2) |
| User Involvement | None (0), Indirect (1), Direct (2) |
| Incident Severity | Low (0), Medium (1), High (2) |
| Sharing Time | Working Hours (0), Non-Working Hours (1) |
| Information Type | Personal (0), Professional (1), Sensitive (2) |
| Platform Location | Internal (0), External Public (1), External Private (2) |
| Interaction Time | Working Hours (0), Non-Working Hours (1) |
| Malicious Flag | Not Malicious (0), Malicious (1) |
| User Reaction | None (0), Minimal (1), Full (2) |
| Change Type | Behavioral (0), Habitual (1), Sudden (2) |
| Time of Change | Working Hours (0), Non-Working Hours (1) |
| User Motivation | Work Related (0), Personal (1), Suspicious (2) |
| Protocol Type | HTTP (0), HTTPS (1), FTP (2), SMTP (3) |
| User Awareness | Fully Aware (0), Partially Aware (1), Unaware (2) |
| Practice Type | Weak Passwords (0), Sharing Credentials (1), Lack of Updates (2) |
| Severity | Low (0), Medium (1), High (2) |
| Upload Time | Working Hours (0), Non-Working Hours (1) |
| Encryption Status | Not Encrypted (0), Encrypted (1) |
| Send Time | Working Hours (0), Non-Working Hours (1) |
| Insert Time | Working Hours (0), Non-Working Hours (1) |
| Print Time | Working Hours (0), Non-Working Hours (1) |
| Document Type | Personal (0), Official (1), Confidential (2) |
Table 5.
Models’ Performance.
| Metric | Logistic Regression (LR) | Random Forest (RF) | XGBoost | Support Vector Machine (SVM) |
|---|---|---|---|---|
| Accuracy | 0.99 | 0.99 | 1.00 | 0.99 |
| Precision | 0.996 | 0.986 | 1.00 | 0.996 |
| Recall | 0.996 | 0.986 | 1.00 | 0.996 |
| F1-score | 0.996 | 0.986 | 1.00 | 1.00 |
Table 6.
Average Detection and Classification Time.
| Metric | Logistic Regression (LR) | Random Forest (RF) | XGBoost | Support Vector Machine (SVM) |
|---|---|---|---|---|
| Detection (s) | 0.014 | 0.15 | 0.056 | 0.046 |
| Classification (s) | 0.071 | 0.34 | 0.102 | 0.1051 |
Table 7.
Quantitative Comparison with Recent Studies, Including Detection and Classifica;tion Times (Where N/D is Not Discussed).
Table 7.
Quantitative Comparison with Recent Studies, Including Detection and Classifica;tion Times (Where N/D is Not Discussed).
| Study | Logistic Regression (LR) | Study Date | |||||
|---|---|---|---|---|---|---|---|
| Accuracy | Recall | Precision | F1-Score | Detection (s) | Classification (s) | ||
| [29] | 0.97 | 0.97 | 0.98 | 0.97 | N/D | N/D | 2021 |
| [35] | 0.93 | 0.961 | 0.912 | 0.936 | N/D | N/D | 2024 |
| [36] | 0.90 | 0.25 | 0.24 | 0.24 | N/D | N/D | 2023 |
| [52] | 0.913 | 0.91 | 0.91 | 0.90 | N/D | N/D | 2020 |
| [53] | 0.80 | 0.86 | 0.81 | 0.83 | N/D | N/D | 2020 |
| [56] | 0.70 | N/D | 0.90 | 0.54 | N/D | N/D | 2021 |
| [57] | 0.946 | 0.973 | 0.969 | 0.971 | N/D | N/D | 2022 |
| Ours | 0.99 | 0.996 | 0.996 | 0.996 | 0.014 | 0.071 | N/A |
| Study | Random Forest (RF) | ||||||
| [29] | 0.99 | 0.99 | 0.99 | 0.99 | N/D | N/D | 2021 |
| [35] | 0.993 | 0.996 | 0.992 | 0.994 | N/D | N/D | 2024 |
| [36] | 0.99 | 0.97 | 0.97 | 0.97 | N/D | N/D | 2023 |
| [52] | 0.996 | 1.00 | 1.00 | 1.00 | N/D | N/D | 2020 |
| [53] | 0.83 | 0.91 | 0.81 | 0.86 | N/D | N/D | 2020 |
| [56] | 0.87 | N/D | 0.98 | 0.84 | N/D | N/D | 2021 |
| [57] | N/D | N/D | N/D | N/D | N/D | N/D | 2022 |
| Ours | 0.99 | 0.986 | 0.986 | 0.986 | 0.15 | 0.34 | N/A |
| Study | XGBoost | ||||||
| [29] | N/D | N/D | N/D | N/D | N/D | N/D | 2021 |
| [35] | 0.993 | 0.995 | 0.992 | 0.994 | N/D | N/D | 2024 |
| [36] | N/D | N/D | N/D | N/D | N/D | N/D | 2023 |
| [52] | 0.992 | 0.99 | 0.99 | 0.99 | N/D | N/D | 2020 |
| [53] | N/D | N/D | N/D | N/D | N/D | N/D | 2020 |
| [56] | N/D | N/D | N/D | N/D | N/D | N/D | 2021 |
| [57] | 0.999 | 0.999 | 0.999 | 0.999 | N/D | N/D | 2022 |
| Ours | 1.00 | 1.00 | 1.00 | 1.00 | 0.056 | 0.102 | N/A |
| Study | Support Vector Machine (SVM) | ||||||
| [29] | 0.97 | 0.97 | 0.98 | 0.98 | N/D | N/D | 2021 |
| [35] | 0.969 | 0.982 | 0.96 | 0.971 | N/D | N/D | 2024 |
| [36] | 0.70 | 0.14 | 0.14 | 0.14 | N/D | N/D | 2023 |
| [52] | 0.874 | 0.87 | 0.76 | 0.82 | N/D | N/D | 2020 |
| [53] | 0.84 | 0.86 | 0.87 | 0.87 | N/D | N/D | 2020 |
| [56] | N/D | N/D | N/D | N/D | N/D | N/D | 2021 |
| [57] | 0.786 | 0.896 | 0.722 | 0.80 | N/D | N/D | 2022 |
| Ours | 0.99 | 0.996 | 0.996 | 1.00 | 0.046 | 0.1051 | N/A |
Disclaimer/Publisher’s Note: The statements, opinions and data contained in all publications are solely those of the individual author(s) and contributor(s) and not of MDPI and/or the editor(s). MDPI and/or the editor(s) disclaim responsibility for any injury to people or property resulting from any ideas, methods, instructions or products referred to in the content. |
© 2025 by the authors. Licensee MDPI, Basel, Switzerland. This article is an open access article distributed under the terms and conditions of the Creative Commons Attribution (CC BY) license (http://creativecommons.org/licenses/by/4.0/).
Copyright: This open access article is published under a Creative Commons CC BY 4.0 license, which permit the free download, distribution, and reuse, provided that the author and preprint are cited in any reuse.


