
Submitted:
20 December 2024
Posted:
23 December 2024
You are already at the latest version
Abstract
There has been relatively comprehensive research on reservoir sedimentation and the resulting longitudinal profile adjustment. However, the research on the impact of the coordinated changes of sedimentation in cascade reservoirs on the sedimentation pattern in the reservoirs and the adjustment of river channel morphology is still insufficient, and thus it is a scientific problem worthy of exploration. This study selected Xiangjiaba and Xiluodu, the two cascade reservoirs in the lower Jinsha River, as the research objects. Based on the observed data of thalweg elevation in the reservoirs for multiple measurement times before and after the dam closure, the local mean gradient, as well as the regional mean gradient, were calculated. The temporal and spatial changes of the sedimentation rate in the above-mentioned reservoir and the response characteristics of the longitudinal gradient were analyzed. The following main results were obtained: Compared with the long-term erosive state of the river section in the reservoirs before the dam closure, the sedimentation rate in the Xiangjiaba reservoir increased significantly in the early stage after dam closure and showed a trend of decreasing along the course. After that, it decreased obviously but without an obvious changing trend. The average sedimentation rate in the Xiluodu reservoir showed the largest value in the middle section and decreased towards the upstream and downstream, with spatial heterogeneity. The local mean gradient differed between the reservoirs. In the Xiangjiaba reservoir, it decreased slightly in the upstream section in the early stage of dam construction and then fluctuated slightly. After the dam closure in the Xiluodu reservoir, it decreased obviously in the upstream section and increased obviously in the downstream section, with a spatial heterogeneity of increasing along the course. The width-depth ratio of the river channel changed very little in the Xiangjiaba reservoir and increased somewhat in the Xiluodu reservoir. The magnitude and longitudinal heterogeneity of the sedimentation rate in the reservoir are related to the amount of sediment deposition and the sedimentation pattern, and the differences between the reservoirs are related to the location of the dam and the closure time of the dam. The adjustment of the longitudinal gradient and width-depth ratio of cross-sections depends on the magnitude of the sedimentation rate and its longitudinal distribution pattern.
Keywords:
sedimentation rate
; Longitudinal gradient
; width-depth ratio
; differentiation
; cascade reservoirs
; lower Jinsha River
1. Introduction
The construction of dams with flood control and power generation as the main purposes not only seriously affects the process of material transport within river basins [1,2,3,4], but also influences the development of riparian ecosystems and the changes of shorelines in estuary areas [5,6,7,8,9]. Therefore, paying attention to the systematic impacts of dam construction and reservoir sediment deposition is helpful for understanding the changing trends of the water and sediment processes and the characteristics of environmental succession in the river system downstream of the dam. With the growth of people's demand for hydropower and the progress of construction technologies, in the river canyon sections with large flow and high concentration of water energy, the construction of cascade reservoirs has become the preferred way for the efficient development of regional hydropower resources.
A series of reservoirs built in the early stage in the upper and middle reaches of the Jinsha River have intercepted a large amount of sediment [10,11], changing the inherent process of water and sediment in the Jinsha River, especially resulting in a significant decrease in the sediment transport volume in the middle and lower reaches of the Jinsha River [9,12,13,14,15,16,17]. Since 2012, the four large cascade reservoirs successively built in the lower reach of the Jinsha River have sharply reduced the sediment output volume of this river basin. Scholars in different research fields have conducted extensive research on the reduction range, inflection point of change, changing trend, main controlling factors, and potential environmental impacts caused by these dam reservoirs, and obtained a series of new insights [9,17,18,19]. In addition, the impact of the large amount of sediment interception by these cascade reservoirs on the scouring and silting of the downstream river channels, the sediment reduction of the Three Gorges Reservoir, and the sediment budget balance in the middle and lower reaches of the Yangtze River has also been relatively thoroughly studied [16,19,20,21]. The above research work has explored the changes of water and sediment processes in the Jinsha River basin in response to dam construction and reservoir sediment interception from different temporal and spatial scales, and analyzed the actual or potential impacts on the ecological environment.
However, the completion and operation of cascade reservoirs have reversed the long-term erosion process of the lower reach of the Jinsha River [22] into a significant silting process. There must be complex correlations among the reservoirs in terms of the temporal changes and spatial distribution patterns of the sediment interception volume, deposition volume, and sedimentation rate. What are the changing trends of the relative sediment interception volume among cascade reservoirs? How are the sediment silting intensity and its spatial distribution different? What are the restrictive relationships among cascade reservoirs in terms of sediment interception volume, deposition intensity, and possible spatial variation? Related questions including the above ones are all important scientific questions that need to be answered. This study selects Xiangjiaba and Xiluodu reservoirs, which have been built for more than ten years in the lower Jinsha River and have relatively abundant observational data of water and sediment and river channel geomorphology, as the research objects. Based on the multi-period observational data of the thalweg before and after dam construction, the thalweg sedimentation rate in different periods and its temporal and spatial changing trends are analyzed to reveal the impact mechanism of dam construction and changes in reservoir operation mode on the reservoir sedimentation rate and the response characteristics of river channel morphology adjustment. The research results can serve as a reference for understanding the changing pattern of the sedimentation rate in the cascade reservoirs in similar areas and the corresponding trend of river channel morphology adjustment.
2. Study Area, Dataset and Methods
2.1. Study Area
The lower reach of the Jinsha River refer to the river section between the Sanduizi Hydrological Station and the confluence of the Minjiang River [9]. The total length of the main stream is 765 km, and the area of the inter-valley basin is 21.4 km² [18]. The average annual discharge and the average annual suspended sediment load are 4750 m³/s and 255 million tons per year respectively [9]. With the commencement of impoundment by closing the dams of the four cascade reservoirs, namely Xiangjiaba, Xiluodu, Wudongde and Baihetan (Figure 1), in October 2012, May 2013, May 2020 and April 2021, respectively, the entire lower reach of the Jinsha River have changed from the previous long-term erosive state to a state of intense sediment interception and deposition.
The Xiangjiaba Reservoir is located at the end of the lower reach of the Jinsha River. The entire reservoir is situated between the Xiluodu Dam and the Xiangjiaba Dam. The length of the main stream in the reservoir is 156.6 km. The total area of the basin above the Xiangjiaba Dam is 458,800 km², accounting for approximately 97% of the total area of the Jinsha River Basin; the total area of the basin in the reservoir section is 4,400 km², accounting for only 0.95% of the total area of the Jinsha River Basin. The normal water level and the dead water level are 380 m and 370 m respectively, and the corresponding reservoir capacities are 4.977 billion m³ and 4.074 billion m³ respectively, with the regulation reservoir capacity being 903 million m³. The tributaries with a basin area larger than 600 km² are the Xisha River, Xining River and Zhongdu River. The total area of the basins of these three tributaries is 2,314 km², accounting for approximately 52.6% of the total area of the basin in the reservoir section. Among them, the basin area of the largest tributary, the Xining River, is 1,034 km², accounting for approximately 23.5% of the total area of the reservoir section.
The Xiluodu Reservoir is the adjacent reservoir upstream of the Xiangjiaba Reservoir, located between the Baihetan Dam and the Xiluodu Dam. The length of the river between the two dams is 195.1 km. The total area of the basin above the Xiluodu Dam is 454,000 km², accounting for approximately 96% of the total area of the Jinsha River Basin [20]; the total area of the basin where the reservoir area is located is 24,092 km², accounting for approximately 5.3% of the total area of the Jinsha River Basin. The tributaries with a catchment area exceeding 600 km² in this section are the Niulan River, Meigu River and Xixi River. The total area of these three rivers is 19,770 km², accounting for 82.1% of the total area of the basin in the reservoir section. Among them, the catchment area of the Niulan River is 13,672 km², accounting for 56.7% of the total area of the reservoir section. The normal water level and dead water level of the reservoir are 600 m and 540 m [20], respectively, and the total reservoir capacity and the regulation reservoir capacity are 12.67 billion m³ and 6.46 billion m³, respectively.
The total area of the basin in the reservoir sections of the above two reservoirs, the average annual (1952–2004) water yield and sediment yield respectively account for approximately 6.3%, 11.4% and 28.8% of the Jinsha River Basin [23], indicating that the sediment yield modulus of the tributaries in the reservoir sections is high and it is the main sediment source area of the Jinsha River Basin [10,16,17]. Considering the significant difference in the drainage area of the reservoir sections of the above reservoirs, under the condition that the sediment yield modulus is roughly the same, the net sediment yield of the Xiluodu reservoir section is approximately 5.5 times that of the Xiangjiaba reservoir section.
The average annual incoming runoff in the Xiluodu reservoir section before 1999 was 127.6 billion m³, and the average annual suspended sediment load was 160.19 million tons; from 1999 to 2019, the runoff did not change much, and the average annual suspended sediment load decreased by 34.4%, which was caused by the reduction of sediment coming from the upstream basin of the reservoir [18]. The average annual outgoing runoff of the Xiluodu reservoir from 2004 to 2019 was 138.7 billion m³, the average annual suspended sediment load from 2004 to 2012 was 134.6 million tons, and from May 2013 when the Xiluodu Dam started impounding water to intercept sediment until 2019, the average annual suspended sediment load out of the reservoir was only 2.49 million tons, a reduction of 98.15% compared to the previous period. There was no obvious changing trend in the flow of the Xiangjiaba reservoir. The average annual runoff from 1954 to 2020 was 143.5 billion m³. From the closure of the dam to start impounding water (May 2012) until 2020, the average annual suspended sediment load was only 0.015 billion tons, accounting for approximately 0.61% of the average annual suspended sediment load of 2.46 billion tons from 1954 to 2020 before the dam construction [9].
2.2. Dataset
The data materials include the observed data of the thalweg elevation and the elevation of typical cross-sections of the river section where the reservoir is located, involving multiple measurement times before and after the dam construction. The observed data of the thalweg elevation in the Xiangjiaba reservoir in March 2008, November 2011, November 2012, and April 2013 were collected from the literature [21], and the data in May 2020 were collected from another literature [20]. The thalweg elevation data of the Xiluodu reservoir in February 2008, May 2014, and November 2020 were collected from multiple literatures [20,21,24,25]. These data materials are mainly used to calculate the thalweg deposition thickness and sedimentation rate of different river sections in different periods.
The morphological observation data of typical cross-sections in the reservoir were collected from the literature [21]. Among them, the four cross-sections B35, B98, B144, and B216 in the Xiluodu Reservoir are respectively located at the river lengths of 31.6 km, 87.6 km, 129.0 km, and 190.5 km away from the Xiluodu Dam; the four cross-sections A24, A74, A116, and A144 in the Xiangjiaba Reservoir are respectively located at the river lengths of 22.8 km, 67.3 km, 109.1 km, and 139.7 km away from the Xiangjiaba Dam. These data materials are used to analyze the main positions of sediment deposition in the cross-sections in the reservoirs, the characteristics of cross-section morphological changes, and to calculate the mean gradient between cross-sections.
2.3. Methods
In mountain rivers, there are often micro-landform such as pools and shoals, which are alternately distributed, as well as huge rock masses from canyon collapses on the thalweg. Considering that these micro-landforms can cause large fluctuations in the thalweg elevation within a short distance, differences in observation points during different measurement times may lead to large elevation deviations, which will bring large systematic errors to relevant calculations. To reduce such systematic errors, this study divides the river section into 20-km-long segments one by one in the upstream direction starting from the dam (only the last segment is less than 20 km). The average value of the elevations of all thalweg measurement points observed in each river section during each measurement time is calculated, and then the average deposition thickness (the difference term in parentheses) and the average sedimentation rate of each river section in different periods are calculated using Equation (1).
In Equation (1), Sr represents the average sedimentation rate of a certain river section (unit: m yr−1); p represents the number of years between two measurement times (unit: a); xi and xj respectively represent the elevations of all measurement points in the river section for the previous and subsequent measurement times (unit: m), and k and n are the numbers of measurement points respectively.
There are two types of mean gradients of the thalweg in the reservoirs: the mean gradient from the midpoint of a certain river section to the dam (which can be called the regional mean gradient, Jsd) and the mean gradient between adjacent river sections (which can be called the local mean gradient, Jss), which are calculated according to Equations (2) and (3), respectively.
In Equation (2), Jsd represents the regional mean gradient (unit: ‰); lsd represents the length of the river from the midpoint of a certain river section to the dam (unit: km); xi represents the elevation of each measurement point in this river section and ed represents the thalweg elevation in front of the dam (unit: m), and n is the number of measurement points.
In Equation (3), Jss represents the local mean gradient (unit: ‰); lss represents the length of the river between the midpoints of adjacent river sections (unit: km); xj and xi respectively represent the elevations of all measurement points of the two adjacent river sections (unit: m), and n and k are the numbers of measurement points respectively.
3. Results
3.1. Spatio-Temporal Variation of Sedimentation Rate
3.1.1. Sedimentation Rate in Xiangjiaba Reservoir
The Xiangjiaba Reservoir is the first cascade reservoir built in the lower Jinsha River. The completion of its dam has effectively intercepted the incoming sediment in the Jinsha River Basin, causing significant sediment deposition in the reservoir. The average deposition thickness of the thalweg in each 20-km-long river section in the reservoir during the four periods from March 2008 to May 2020 is shown in Figure 2a, and the sedimentation rate is shown in Figure 2b.
From March 2008 to November 2011 before the closure of the Xiangjiaba Dam, only the riverbed thalweg in the river section 20 km away from the dam in the Xiangjiaba Reservoir had net deposition, with a deposition thickness of 0.98 m. Erosion was dominant in other river sections. The maximum erosion thickness was 2.75 m, and the second largest erosion thickness was 1.31 m, which occurred respectively in the river sections 80–100 km and 20–40 km away from the dam. The distribution of the sedimentation rate was consistent with that of the scouring and silting amplitudes, with its value ranging from −0.75 m yr−1 to 0.27 m yr−1.
From November 2011 to November 2012, the thalweg line in the Xiangjiaba Reservoir was generally in a deposition state, with the deposition thickness ranging from 0.42 m to 2.61 m. The maximum and minimum values were respectively in the river sections 100–120 km and 140–156.6 km away from the dam. The sedimentation rate ranged from 0.42 m yr−1 to 2.61 m yr−1. Compared with the previous period, the sedimentation rate increased. Both the scouring and silting thickness and the scouring and silting rate indicated that during this period, the thalweg in the two river sections in front of the dam in the Xiangjiaba Reservoir was still in a mild erosion state, but the erosion thickness was less than 0.71 m, and the erosion rate was less than 1.70 m yr−1.
From November 2012 to April 2013 after the dam closure, the water storage in the Xiangjiaba Reservoir reached the normal water level. Meanwhile, the functions of water storage and sediment interception of the dam became prominent, and the sediment scouring and silting situation in the reservoir changed significantly. In the upper and middle river sections more than 80 km away from the dam, the deposition thickness increased significantly. The average silting thickness of the thalweg in each river section ranged from 6.13 m to 8.18 m, and the average sedimentation rate ranged from 14.70 m yr−1 to 19.62 m yr−1. The average sedimentation rate of the thalweg in the reservoir was 8.88 m yr−1.
From April 2013 to May 2020, silting was dominant in all sections of the reservoir, with the average deposition thickness ranging from 0.87 m to 4.05 m, and the average value of all sections was 1.96 m. The maximum value was in the river section 60–80 km away from the dam, and it showed a gradually decreasing spatial variation trend both upstream and downstream from this section. The average sedimentation rate ranged from 0.12 m yr−1 to 0.57 m yr−1, and the spatial variation trend was similar to that of the deposition thickness. Compared with the initial stage of water storage (from November 2012 to April 2013), the sedimentation rates during these more than seven years decreased significantly. The thalweg average sedimentation rates in the reservoir before and after the dam closure were respectively 0.07 m yr−1 and 0.67 m yr−1, with the latter being 9.6 times that of the former.
3.1.2. Sedimentation Rate in Xiluodu Reservoir
From February 2008 to May 2014, significant silting occurred at the thalweg of the Xiluodu Reservoir. The maximum (9.07 m) and minimum (0.23 m) values of the deposition thickness were respectively located in the sections 60–80 km and 160–180 km away from the Xiluodu Dam (Figure 3a). Except for the two sections in front of the dam and at the reservoir tail, the deposition thickness gradually decreased both upstream and downstream from the section 60–80 km away from the dam. During the same period, the spatial variation trend of the average sedimentation rate of all sections was consistent with that of the deposition thickness. Its maximum value was 1.45 m yr−1, and its minimum value was 0.04 m yr−1 (Figure 3b). The average sedimentation rate of all sections in the reservoir was 0.66 m yr−1.
The Xiluodu Dam was closed in May 2013, and the reservoir began to store water and intercept sediment. Before water storage, this river section was a natural mountain-valley type river channel, and the riverbed was in a net erosion state. Therefore, it can be considered that almost all the net deposition in the Xiluodu Reservoir during the period from February 2008 to May 2014 was caused by the deposition effect after the closure of the Xiluodu Dam. Accordingly, the maximum average sedimentation rate of this reservoir from May 2013 to May 2014 could be obtained as 9.07 m yr−1, the minimum value was 0.23 m yr−1 (Figure 3b), and the average sedimentation rate was 4.15 m yr−1.
From May 2014 to November 2020, continuous silting occurred in the Xiluodu Reservoir. Only the average deposition thickness in the section 20 km in front of the dam was slightly reduced compared with the previous period. The maximum value of the average deposition thickness (26.27 m) appeared in the middle river section 100–120 km away from the dam, and it showed a decreasing trend in both upstream and downstream directions from this section, decreasing to 8.05 m and 0.70 m respectively (Figure 3a). Compared with the previous period, the section with the largest deposition thickness roughly migrated 40 km upstream.
After the dam closed and water storage began, the average sedimentation rate in the Xiluodu Reservoir increased significantly. From May 2014 to November 2020, the maximum value of the average sedimentation rate could reach 4.04 m yr−1, also located in the section 100–120 km away from the dam (Figure 3b). Similar to the spatial distribution of the deposition thickness, the average sedimentation rate also showed an obvious decreasing trend in both upstream and downstream directions from the section, decreasing to 1.24 m yr−1 and 0.11 m yr−1 respectively. The average sedimentation rate of the entire Xiluodu Reservoir during this period was 2.51 m yr−1, accounting for 60% of the sedimentation rate (4.15 m yr−1) during the one-year period of initial water storage after the dam closure.
3.2. Adjustment of Thalweg Longitudinal Gradient in the Reservoirs
3.2.1. Change in Mean Gradient in Xiangjiaba Reservoir
The average thalweg elevation, regional mean gradient and its change value, as well as local mean gradient and its change value of the sections in the Xiangjiaba Reservoir for different measurement times are shown in Figures 4(a–e), respectively. The silting-induced elevation increase of the thalweg in the reservoir is more obvious in the upstream section (Figure 4a). After the dam closure, the regional mean gradient of each section in the upstream part of the reservoir is generally greater than that before the dam closure. Meanwhile, the period when the local mean gradient increased significantly was from November 2012 to April 2013 (Figure 4b, c). The values of such gradients in the downstream section of the reservoir remained roughly unchanged or decreased slightly.
It can be seen from the local mean gradient (Figure 4d) that there are relatively obvious alternating changes in magnitude along the course. Among different periods, the area with the largest increase in the local mean gradient is located in the middle of the reservoir (about 80 km away from the dam), and the second largest value appears near 120 km away from the dam. Meanwhile, the period with the largest variation range of the local mean gradient was from November 2012 to May 2013 during the initial stage of dam closure (Figure 4e). Compared before and after dam closure, the sections with an obvious increase in the local mean gradient is similar to that in the initial stage of dam closure. The local mean gradient is significantly affected by the maximum sedimentation rate.
3.2.2. Change in Mean Gradient in Xiluodu Reservoir
The average thalweg elevation, regional mean gradient and its change value, as well as local mean gradient and its change value of the sections in the Xiluodu Reservoir for different measurement times are shown in Figures 5. The approximately 40-km-long section at the tail of the Xiluodu Reservoir is the fluctuating backwater area in the drawdown zone, undergoing annual alternating changes between the river and reservoir-type "lake" environments (Figure 5a). The regional mean gradient generally showed a decreasing trend along the course before the dam closure (Figure 5b), but basically showed an increasing trend along the course after the dam closure.
In the period from February 2008 to May 2014, the change value of the regional mean gradient decreased in the sections more than 80 km away from the dam (Figure 5c), with a mean decrease of 0.037‰ in the sections, while there were relatively obvious increases and decreases at 60 km and 20 km away from the dam, respectively. In the period from May 2014 to November 2020, the regional mean gradient of each section was increasing, showing an obvious increasing trend along the course in space, with the increased value ranging from 0.041‰ at the tail of the reservoir to 0.649‰ in front of the dam.
The local mean gradient shows fluctuating changes along the course. There was no obvious spatial change trend before the dam closure, while it showed a fluctuating increasing trend along the course after the dam closure (Figure 5d). The change values of the local mean gradient ranged from −0.233‰ to 0.139‰ during the period from February 2008 to May 2014, and the average variation was only −0.036‰, that is, it decreased slightly on the whole. During the period from May 2014 to November 2020, the variation of the local mean gradient ranged from −0.370‰ to 0.650‰, and the average variation was 0.041‰ (Figure 5e). Compared with that in the period from February 2008 to May 2014, the variation range of the local mean gradient has changed from the longitudinal fluctuating characteristic to an increasing trend along the course in the period from May 2014 to November 2020, indicating that the nature of the longitudinal thalweg profile has changed.
3.3. Adjustment of Cross-Sectional Morphology
The typical morphological characteristics of the cross-sections in the cascade reservoirs are shown in Figure 6. Due to the natural longitudinal gradients of the channel thalweg existing in the cascade reservoirs, below different storage water levels (including the normal storage water level and the dead water level), the area, width and depth of the cross-sections significantly increase along the flow direction. The normal storage water level of the Xiluodu Reservoir is 60 meters higher than the dead water level. The average thalweg elevation of B216 cross-section is higher than the dead water level, that is, it is located in the fluctuating backwater area where the coarsening and refining of the riverbed alternate within a year and the net deposition thickness is relatively small.
In May 2013, the width-depth ratios of the four cross-sections in the Xiangjiaba Reservoir were between 3.2 and 9.4 and between 3.5 and 9.7 under the normal and dead water levels, respectively. The width-depth ratios of the cross-sections at the half water depth under the above two water levels were between 3.9 and 11.5 and between 4.5 and 11.8, respectively (Figure 7a, b). In April 2019, the width-depth ratios of the above cross-sections were between 3.2 and 9.5 and between 3.3 and 9.8 under the normal and dead water levels, respectively; the width-depth ratios of the cross-sections below the half water depth were between 3.7 and 11.8 and between 3.9 and 12.0 respectively, with no obvious changes compared with those in May 2013. The width-depth ratios of the cross-sections all showed an obvious increasing trend along the river course.
The width-depth ratios of the cross-sections in the Xiluodu Reservoir under the normal water level and the dead water level were between 3.3 and 4.0 and between 3.3 and 5.6 respectively in February 2008, fluctuating along the river course (Figure 7c, d); the width-depth ratios at the half water depth were between 3.6 and 5.2 and between 3.9 and 8.1 respectively, showing an obvious decreasing trend along the river course. In May 2019, the width-depth ratios of the above cross-sections were between 3.8 and 5.0 and between 4.3 and 9.9 under the normal and dead water levels respectively, and between 4.0 and 7.3 and between 4.4 and 14.1 below the half water depth respectively, all significantly larger than those in February 2008. In the middle section of the reservoir represented by the B144 cross-section, the increase in the width-depth ratio was the most significant, while in the area in front of the dam represented by the B35 cross-section, the increase in the width-depth ratio was the smallest. With the longitudinal differential deposition of sediment in the reservoir, the responsive adjustment of the cross-sectional morphology in the Xiluodu Reservoir was particularly intense in the middle section.
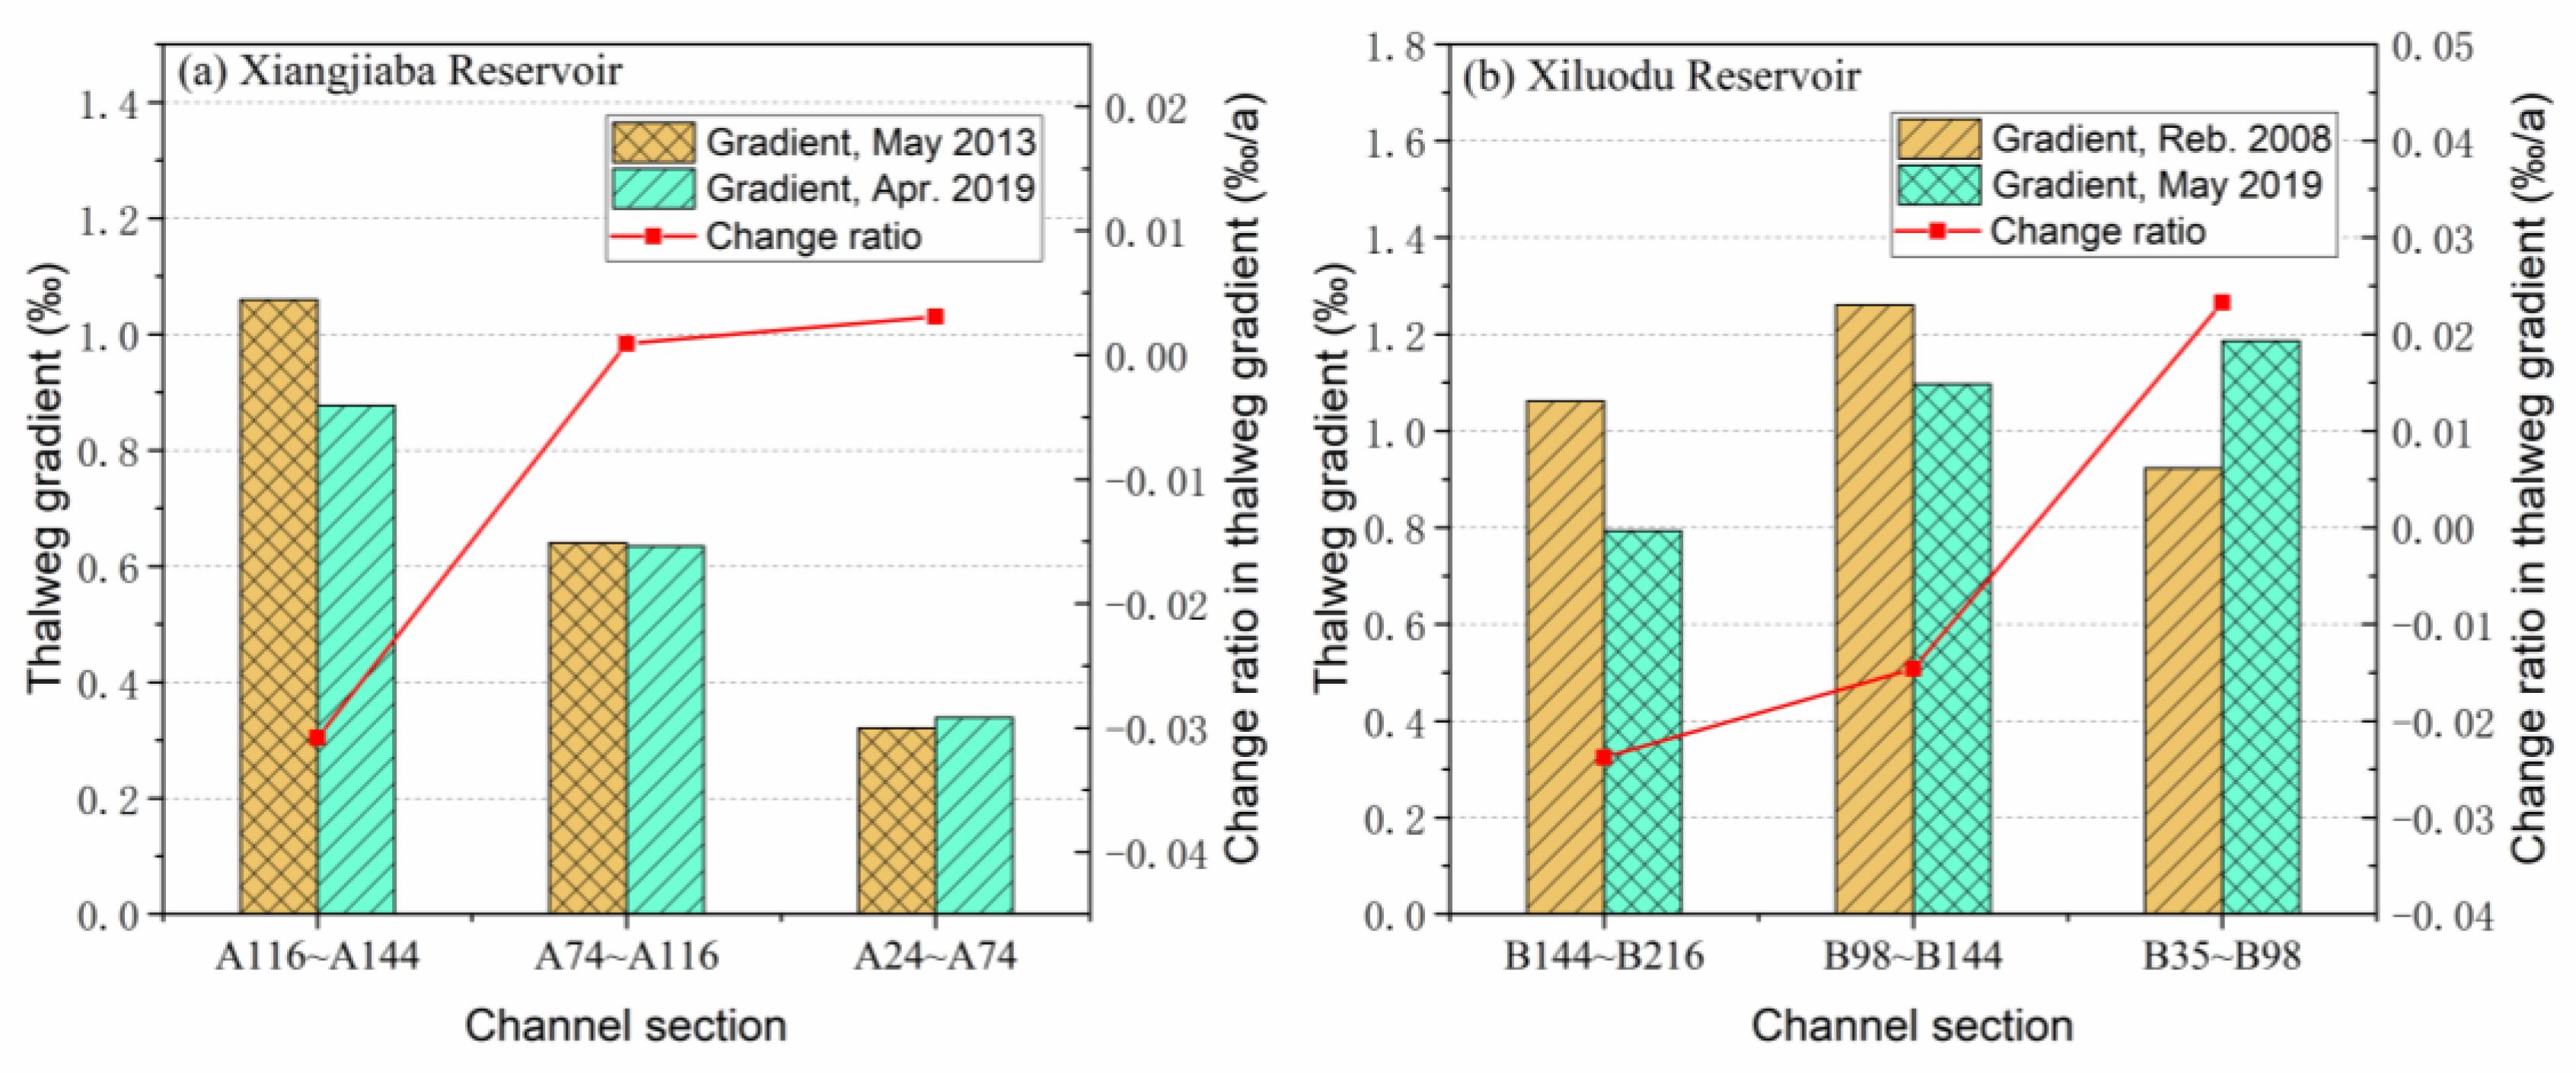
The spatio-temporal variations of the local mean gradients in the cascade reservoirs of the lower Jinsha River are shown in Figure 8. The local mean gradients in the three river sections of the Xiangjiaba Reservoir all showed a decreasing trend along the river course before and after the dam closure (Figure 8a). After the dam closure, the local mean gradients in the Xiluodu Reservoir showed an increasing trend along the river course (Figure 8b). During the period from May 2013 to April 2019, the gradients in the upper sections (A144–2A116) and the middle sections (A116–A74) of the Xiangjiaba Reservoir decreased by 17.2% and 0.85% respectively, with the average annual decreasing rates being 2.9% yr−1 and 0.14% yr−1 respectively; the gradient in the lower sections (A74–A24) of the reservoir increased by 5.7%, with the average annual increasing rate being 0.96% yr−1. In the period from February 2008 to May 2019, the gradients in the upper sections (B216–B144) and the middle sections (B144–B98) of the Xiluodu Reservoir decreased by 25.3% and 13.0% respectively, with the average annual decreasing rates being 2.25% yr−1 and 1.16% yr−1 respectively; the gradient in the lower section (B98–B35) of the reservoir increased by 28.5%, with the average annual increasing rate being 2.53% yr−1. The cumulative adjustment amplitude of the gradient in the Xiluodu Reservoir is much larger than that in the Xiangjiaba Reservoir, and its average annual adjustment rate is also relatively large in the middle and lower sections, only the rate in the upper sections is smaller than that in the Xiangjiaba Reservoir.
4. Discussion
4.1. The Impact of Changes in Incoming Sediment on the Sedimentation Rate
The mountains around the Qinghai-Tibet Plateau are steep. Rivers flowing through this area have a large gradient, and their water flow has strong erosion and sediment transport capabilities, which generally keeps riverbeds in a downcutting state. The Jinsha River, as a mountainous river on the southeastern edge of the Qinghai-Tibet Plateau, has long been undergoing the process of riverbed downcutting. The average erosion rate of the riverbed of the river reach, where the Xiluodu Reservoir is located, was 0.32 mm yr−1 since more than 1 million years ago [22]. With the closure of the cascade dams and the deposition of a large amount of sediment entering the reservoirs, the lower Jinsha River have changed from an erosive state to a state of intense deposition.
In the five years before and after the closure of the Xiluodu Dam (from 2008 to 2013 and from 2014 to 2019), the annual average input amounts of suspended sediment in the reservoir were 122.9 million tons and 96.48 million tons respectively (with an average annual decrease of 26.4 million tons, a decrease rate of 21.5%), and the annual average output amounts were 131.8 million tons and 2.98 million tons respectively (with an average annual decrease of 129 million tons, a decrease rate of 97.74%) [25]. This indicates that within five years after the dam closure, the average annual net deposition amount of suspended sediment in the Xiluodu Reservoir was 93.5 million tons, which was also the average annual reduction amount of sediment entering the Xiangjiaba Reservoir in the same period (with a reduction rate of 76.24%). The amount of annual sediment deposited in the reservoirs in the lower Jinsha River changed from 97 million tons during the period from 1998 to 2012 to 243 million tons during the period from 2013 to 2021. Meanwhile, reservoir’s contribution ratio to sediment reduction changed from 0.67 to 0.97, while the contribution ratio of soil and water conservation measures decreased from 0.33 to 0.03 [26]. Obviously, the sediment deposition in the Xiluodu Reservoir, which was built later and is located upstream, not only changed this reservoir area from an erosive state to a sedimentation state with a relatively high sedimentation rate, but also greatly reduced the amount of sediment entering the Xiangjiaba Reservoir, which was built earlier and is located downstream, and significantly decreased its sedimentation rate. Therefore, reservoirs relatively located in the upstream sections can preferentially intercept a large amount of sediment, causing significant changes in the sediment transport pattern of the cascade reservoirs. This is the fundamental reason for the significant spatial and temporal variability of the sedimentation rates of the cascade reservoirs.
The dam that was closed first enables the reservoir to intercept and deposit the sediment from the upstream basin of the dam at the earliest time. During the operation process of reservoirs with the purposes of water storage for power generation and flood control, almost all of the bed load and a large amount of suspended sediment will be intercepted. When a newly built dam in a cascade reservoir is located upstream of an earlier built dam, the sediment interception by the newly built reservoir significantly reduces the amount of sediment entering the earlier built reservoir, thus leading to a sharp decrease in the sediment deposition amount and a significant reduction in the sedimentation rate of the earlier reservoir, and thus showing obvious temporal variability. For the cascade reservoirs in the study area, the Xiangjiaba Reservoir was built earliest and is located in the most downstream section. In the early stage of the dam's water storage, it was able to intercept a large amount of sediment in the basin, and the sedimentation rate in the reservoir was very high. When the Xiluodu Dam, which was built later and is located upstream of it, began to intercept a large amount of sediment, the amount of sediment entering the Xiangjiaba Reservoir decreased significantly [27], resulting in the sedimentation rate in the Xiangjiaba Reservoir changing from a high value in the early stage after dam closure to a low value in the later stage, showing obvious temporal variability.
When a newly built dam is located downstream of an earlier built dam, under the premise of not considering the influence of other factors, the amount of sediment entering the earlier built reservoir and its sedimentation rate will not change significantly. And the sediment coming into the newly built reservoir mainly comes from the sediment output by the upstream reservoir and the supply from the tributaries in the river section where the reservoir is located, resulting in a relatively small sedimentation rate in this reservoir and unobvious temporal and spatial variability.
3.2. The Sedimentation Rate Restricts the Gradient Adjustment Pattern
The underwater cross-sectional area of mountainous canyon-type reservoirs increases along the course. According to the principle of the continuity equation of water flow, the water discharge at a cross-section is equal to the cross-sectional area multiplied by the average flow velocity. Thus, the velocity of water flow in the reservoirs decreases along the course, causing the suspended sediment to deposit along the course and the sediment concentration in the water body to decrease accordingly. In addition, the quantity of bed load entering the reservoir and its main deposition area result in the spatial variability of the sedimentation rate in the reservoirs.
With the completion of the dam and the start of intercepting the sediment coming from the basin, an underwater delta deposition environment dominated by bed load deposition has initially formed from the front edge of the reservoir tail's drawdown zone (variable backwater area) to the upper and middle parts of the reservoir. When there is no influence from large reservoirs upstream, the bed load can continuously enter this reservoir. The coarse clastic sediments dominated by pebbles, accounting for 1.5% of the total sediment transport volume [28], becomes the main framework of the underwater deltaic sedimentary facies (environment) and maintains the continuous development of the underwater delta in the reservoir. In this way, the spatial differentiation where the sedimentation rate is high in the delta area and decreases upwards and downwards will be maintained for a long time. This kind of spatially distributed pattern of the sedimentation rate with an upward convex shape leads to the continuous decrease of the mean gradient in the upper reservoir and the continuous increase in the lower reservoir, thus showing the spatial variability of the thalweg gradient.
In the Xiangjiaba Reservoir, within half a year after the closure of its dam, the amount of sediment deposition in the reservoir was large, and its sedimentation rate showed spatial variability that decreased along the course. However, after the closure of the Xiluodu Dam and the start of sediment interception, the amount of sediment coming from the main stream into the Xiangjiaba Reservoir decreased significantly. In particular, the bed load from the main stream completely stopped, and the underwater delta that had initially formed in the Xiangjiaba Reservoir ceased to develop. Besides, the sediment input from the tributaries in the reservoir section was limited due to the small number and area of the tributaries. These factors led to a significant decrease in the sedimentation rate of the Xiangjiaba Reservoir from the high value in the early stage of dam closure, and its spatial variability basically disappeared. The longitudinal gradient of the reservoir also underwent corresponding adjustments. It changed from a relatively significant increase in the middle sections of the reservoir in the early stage after dam closure to very small fluctuating changes within the entire reservoir in the later stage. Overall, the longitudinal profile shape was basically the same as that before the dam construction [27].
The length of the river channel within the reservoir drawdown zone is mainly related to the water level difference between the normal storage water level and the dead water level. The water level difference in the Xiluodu Reservoir is 60 meters, and the length of the river channel within the maximum drawdown zone is approximately 40 km. Reservoir regulation does not necessarily bring the water level down to the dead water level every year. Therefore, the length of the river channel within the drawdown zone formed by reservoir storage and release is usually close to 36 km [25]. This indicates that the area where the pebble and cobble of the riverbed material in the main stream above the dam can be deposited stably for a long time is in the section below 36 km away from the reservoir tail. Considering the supply of the riverbed material from the largest tributary, the Niulan River (the confluence point is about 45 km away from the reservoir tail), the upper sections in the middle Xiluodu Reservoir is the main deposition area for the riverbed material.
However, the maximum water level difference in the Xiangjiaba Reservoir is only 10 m, and the length of the river channel within the maximum drawdown zone is approximately 10 m. According to the results of water level observations in recent years, the maximum and minimum monthly average water levels at the tail of the Xiangjiaba Reservoir are 383.54 m (in September 2020) and 374.61 m (in June 2019) respectively [29]. The maximum monthly average water level difference is only 8.93 m, and the length of the river channel within the drawdown zone at the tail of the Xiangjiaba Reservoir is approximately less than 5 km. Moreover, there are no large tributaries in the river section where the Xiangjiaba Reservoir is located to supply a large amount of bed load. Therefore, during the period of intense deposition, the spatial variability of the sedimentation rate in the Xiangjiaba Reservoir is completely different from that in the Xiluodu Reservoir. The former shows a trend of decreasing along the course, while the latter shows a trend of being the largest in the upper-middle sections and gradually decreasing towards both the upper and lower ends. In fact, the adjustment of the longitudinal gradient of the reservoir is also controlled by the spatial variability and changes of the sedimentation rate.
The spatial changes in the sedimentation rate also affect the morphological adjustment of the cross-section of the river channel in the reservoir. With the continuous deposition of sediment in the reservoir, the increase in the width-depth ratio of the cross-section of the river channel in the Xiluodu Reservoir shows a spatial change trend where it is large in the middle section of the reservoir and small in the upper and lower sections of the reservoir. This is consistent with the spatial variability of the sedimentation rate in this reservoir and is obviously controlled by the magnitude of the sedimentation rate. In the Xiangjiaba Reservoir, since the period of intense deposition is only half a year, although the sedimentation rate is high during this period, the total amount of sediment deposition in the reservoir is generally limited (Figure 6). Therefore, the change in the width-depth ratio of the underwater cross-section of the reservoir is extremely insignificant.
5. Conclusions
Through the research on the longitudinal changes in the thalweg sedimentation rate and the gradient adjustment before and after the construction of cascade reservoirs in the lower the Jinsha River, the following main conclusions are drawn:
(1)The average sedimentation rate of the cascade reservoirs in the lower Jinsha River has obvious spatial and temporal variability. Within half a year after the closure of the Xiangjiaba Dam, the average sedimentation rate in the Xiangjiaba reservoir reached a maximum of 20.75 m yr−1, and it showed a trend of decreasing along the course. After that, the average sedimentation rate decreased significantly, with the maximum value being only 0.35 m yr−1. After the closure of the Xiluodu Dam, the average sedimentation rate in the Xiluodu Reservoir ranged from 0.65 to 3.97 m yr−1, and its high-value area was located in the upper-middle sections of the reservoir, and decreased upwards and downwards from there.
(2)The longitudinal gradient adjustment of the cascade reservoirs is obviously controlled by the changes in the sedimentation rate. In the Xiangjiaba Reservoir, the average thalweg gradient increased significantly in the middle within the first half year after the dam closure. After that, due to the influence of the start of sediment interception by the upstream Xiluodu Dam, it underwent slight adjustments and the changes were not significant. After the closure of the Xiluodu Dam, the gradient change in the reservoir showed a trend of increasing along the course.
(3)The spatial and temporal changes and adjustments of the sedimentation rate within the reservoirs are controlled by the changes in the amount of sediment coming from the basin; the differences in the sedimentation rates among cascade reservoirs are restricted by the closure time of the dams and the relative locations of the dams.
Funding
This work was supported by the National Key Research and Development Program of China (Grant No. 2022YFC3203903) and National Natural Science Foundation of China (Grant No. 42371010).
Data Availability Statement
Data can be accessed through personal contact.
Acknowledgments
The author greatly appreciate the valuable comments and constructive suggestions from the anonymous reviewers.
Conflicts of Interest
The author declares no conflicts of interest.
References
- Junk, W. J.; Bayley, P. B.; Sparks, R. E. The flood pulse concept in river-floodplain systems. Can. J. Fish. Aquat. Sci. 1989, 106, 110–127. [Google Scholar]
- Hooke, J. Coarse sediment connectivity in river channel systems: A conceptual framework and methodology. Geomorphology 2003, 56, 79–94. [Google Scholar] [CrossRef]
- Wang, S.; Wang, X. Changes of water and sediment processes in the Yellow River and their responses to ecological protection during the last six decades. Water 2023, 15, 2285. [Google Scholar] [CrossRef]
- Chua, S. De. X.; Yang, Y.; Kondolf, G. M.; et al. Can restoring water and sediment fluxes across a mega-dam cascade alleviate a sinking river delta? Sci. Adv. 2024, 10, eadn9731. [Google Scholar] [CrossRef] [PubMed]
- Graf, W. L. Downstream hydrologic and geomorphic effects of large dams on American rivers. Geomorphology 2006, 79, 336–360. [Google Scholar] [CrossRef]
- Poff, L.; Olden, J. D.; Merritt, D. M.; et al. Homogenization of regional river dynamics by dams and global biodiversity implications. Proc. Natl. Acad. Sci. U.S.A 2007, 104, 5732–5737. [Google Scholar] [CrossRef]
- Syvitski, J. P. M.; Kettner, A. J.; Overeem, I.; et al. Sinking deltas due to human activities. Nat. Geosci. 2009, 2, 681–686. [Google Scholar] [CrossRef]
- Kondolf, G. M.; Schmitt, R. J. P.; Carling, P. A.; et al. Save the Mekong delta from drowning. Science 2022, 376, 583–585. [Google Scholar] [CrossRef] [PubMed]
- Wang, S.; Wang, X. Impact of large reservoirs on runoff and sediment load in the Jinsha River Basin. Water 2023, 15, 3266. [Google Scholar] [CrossRef]
- Xu, Q.; Shi, G.; Chen, Z. Analysis of recent changing characteristics and tendency runoff and sediment transport in the upper reach of Yangtze River. Advances in Water Science 2004, (4), 420–426. (in Chinese).
- Yan, H.; Zhang, X.; Xu, Q. Unprecedented sedimentation in response to emerging cascade reservoirs in the upper Yangtze River Basin. Catena 2022, 209, 105833. [Google Scholar] [CrossRef]
- Yang, X.; Lu, X. X. Estimate of cumulative sediment trapping by multiple reservoirs in large river basins: an example of the Yangtze River basin. Geomorphology 2014, 227, 49–59. [Google Scholar] [CrossRef]
- Yang, S. L.; Xu, K. H.; Milliman, J. D.; et al. Decline of Yangtze River water and sediment discharge: impact from natural and anthropogenic changes. Scientific Reports 2015, 5, 12581. [Google Scholar] [CrossRef] [PubMed]
- Zhu, L.; Dong, X.; Chen, Z. Sediment deposition of cascade reservoirs in the lower Jinsha River and its impact on Three Gorges Reservoir. Journal of Yangtze River Scientific Research Institute 2016, 34, 1–7. (in Chinese). [Google Scholar]
- Lu, C.; Dong, X.; Tang, J.; et al. Impacts of large cascade reservoirs on runoff and sediment load variations in Jinsha River Basin. Sci. Soil Water Conserv 2019, 17, 36–43. (in Chinese). [Google Scholar]
- Qin, L.; Dong, X.; Du, Z.; et al. Processes of water-sediment and deposition in cascade reservoirs in the lower reach of Jinsha River. Journal of Sediment Research 2019, 44, 24–30. (in Chinese). [Google Scholar]
- Liu, S.; Zhang, X.; Xu, Q.; et al. Transport characteristics and contributing factors of suspended sediment in Jinsha River in recent 50 years. Journal of Sediment Research 2020, 45, 30–37. (in Chinese). [Google Scholar]
- Xie, Y.; Deng, A.; Dong, X.; et al. Study on the spatial-temporal variations of runoff and sediment in the lower reach of Jinsha River. Journal of Hydraulic Engineering 2023, 54, 1309–1322. (in Chinese). [Google Scholar]
- Zhu, L.; Chen, C.; Zhang, J. Study on variations of runoff and sediment and effect to the lower Jinsha River. Journal of Sediment Research 2016, 41, 20–27. (in Chinese). [Google Scholar]
- Zhu, L.; Chen, D.; Yang, C.; et al. Sediment deposition of cascade reservoirs in the lower Jinsha River and scouring of river channel under dam. J. Lake Sci. (in Chinese). 2023; 35, 1097–1110. [Google Scholar]
- Yu, S.; Chen, S.; Dong, X.; et al. Hydrological and sediment monitoring and research of cascade hydropower stations in the lower reaches of the Jinsha River. Beijing: China Water Power Press, 2022.
- Liu, F.; Gao, H.; Li, Z.; et al. Terraces development and their implications for valley evolution of the Jinsha River from Qiaojia to Menggu. Acta Geographica Sinica 2020, 75, 1095–1105. (in Chinese). [Google Scholar]
- Chen, S.; Zhang, O.; Chen, Z.; et al. Variations of runoff and sediment load of the Jinsha river. Advances in Water Science, (in Chinese). 2008; (4), 475–482. [Google Scholar]
- Feng, S.; Deng, A.; Wang, D.; et al. Characteristics analysis of sediment deposition in the Xiluodu Reservoir. Journal of Sediment Research 2021, 46, 16–22. (in Chinese). [Google Scholar]
- Du, Z.; Dong, X.; Zhang, F.; et al. Study on runoff and sediment characteristics and reservoir deposition in Xiluodu Reservoir of the Jinsha River. Journal of Sediment Research 2022, 47, 22–25. (in Chinese). [Google Scholar]
- Zhang, G.; Deng, A.; Chen, J. Study on the sediment interception by reservoirs in the lower Jinsha River Basin. Journal of Sediment Research, 2024; 49, 50–57. [Google Scholar]
- Yin, Y.; Wang, D.; Feng, S.; et al. Sedimentation characteristics in reservoir area of Xiangjiaba Hydropower Station. Water Resources and Power 2021, 39, 71–75. (in Chinese). [Google Scholar]
- Feng, Z. ;Deng, A.; Qin, L.; et al. Formulae for sediment transport rate of pebble bed load in Sanduizi reach of Jinsha River downstream. Journal of Hydraulic Engineering 2024, 55, 35–47. (in Chinese). [Google Scholar]
- Dong, Y.; Sun, Z.; Qin, L.; et al. Erosion and deposition characteristics of navigable waters near Xiangjiaba Hydro-project in recent years. Port & Waterway Engineering, (in Chinese). 2023; (8), 85–89. [Google Scholar]
Figure 1.
Locations of cascade reservoirs/dams, main tributaries, and typical cross-sections in the lower Jinsha River (WDD, BHT, XLD, and XJB represent Wudongde, Baihetan, Xiluodu, and Xiangjiaba dams/reservoirs, while TZL, PZH, and SDZ refer to the hydrological stations of Sanduizi, Panzhihua, and Tongzilin, respectively).
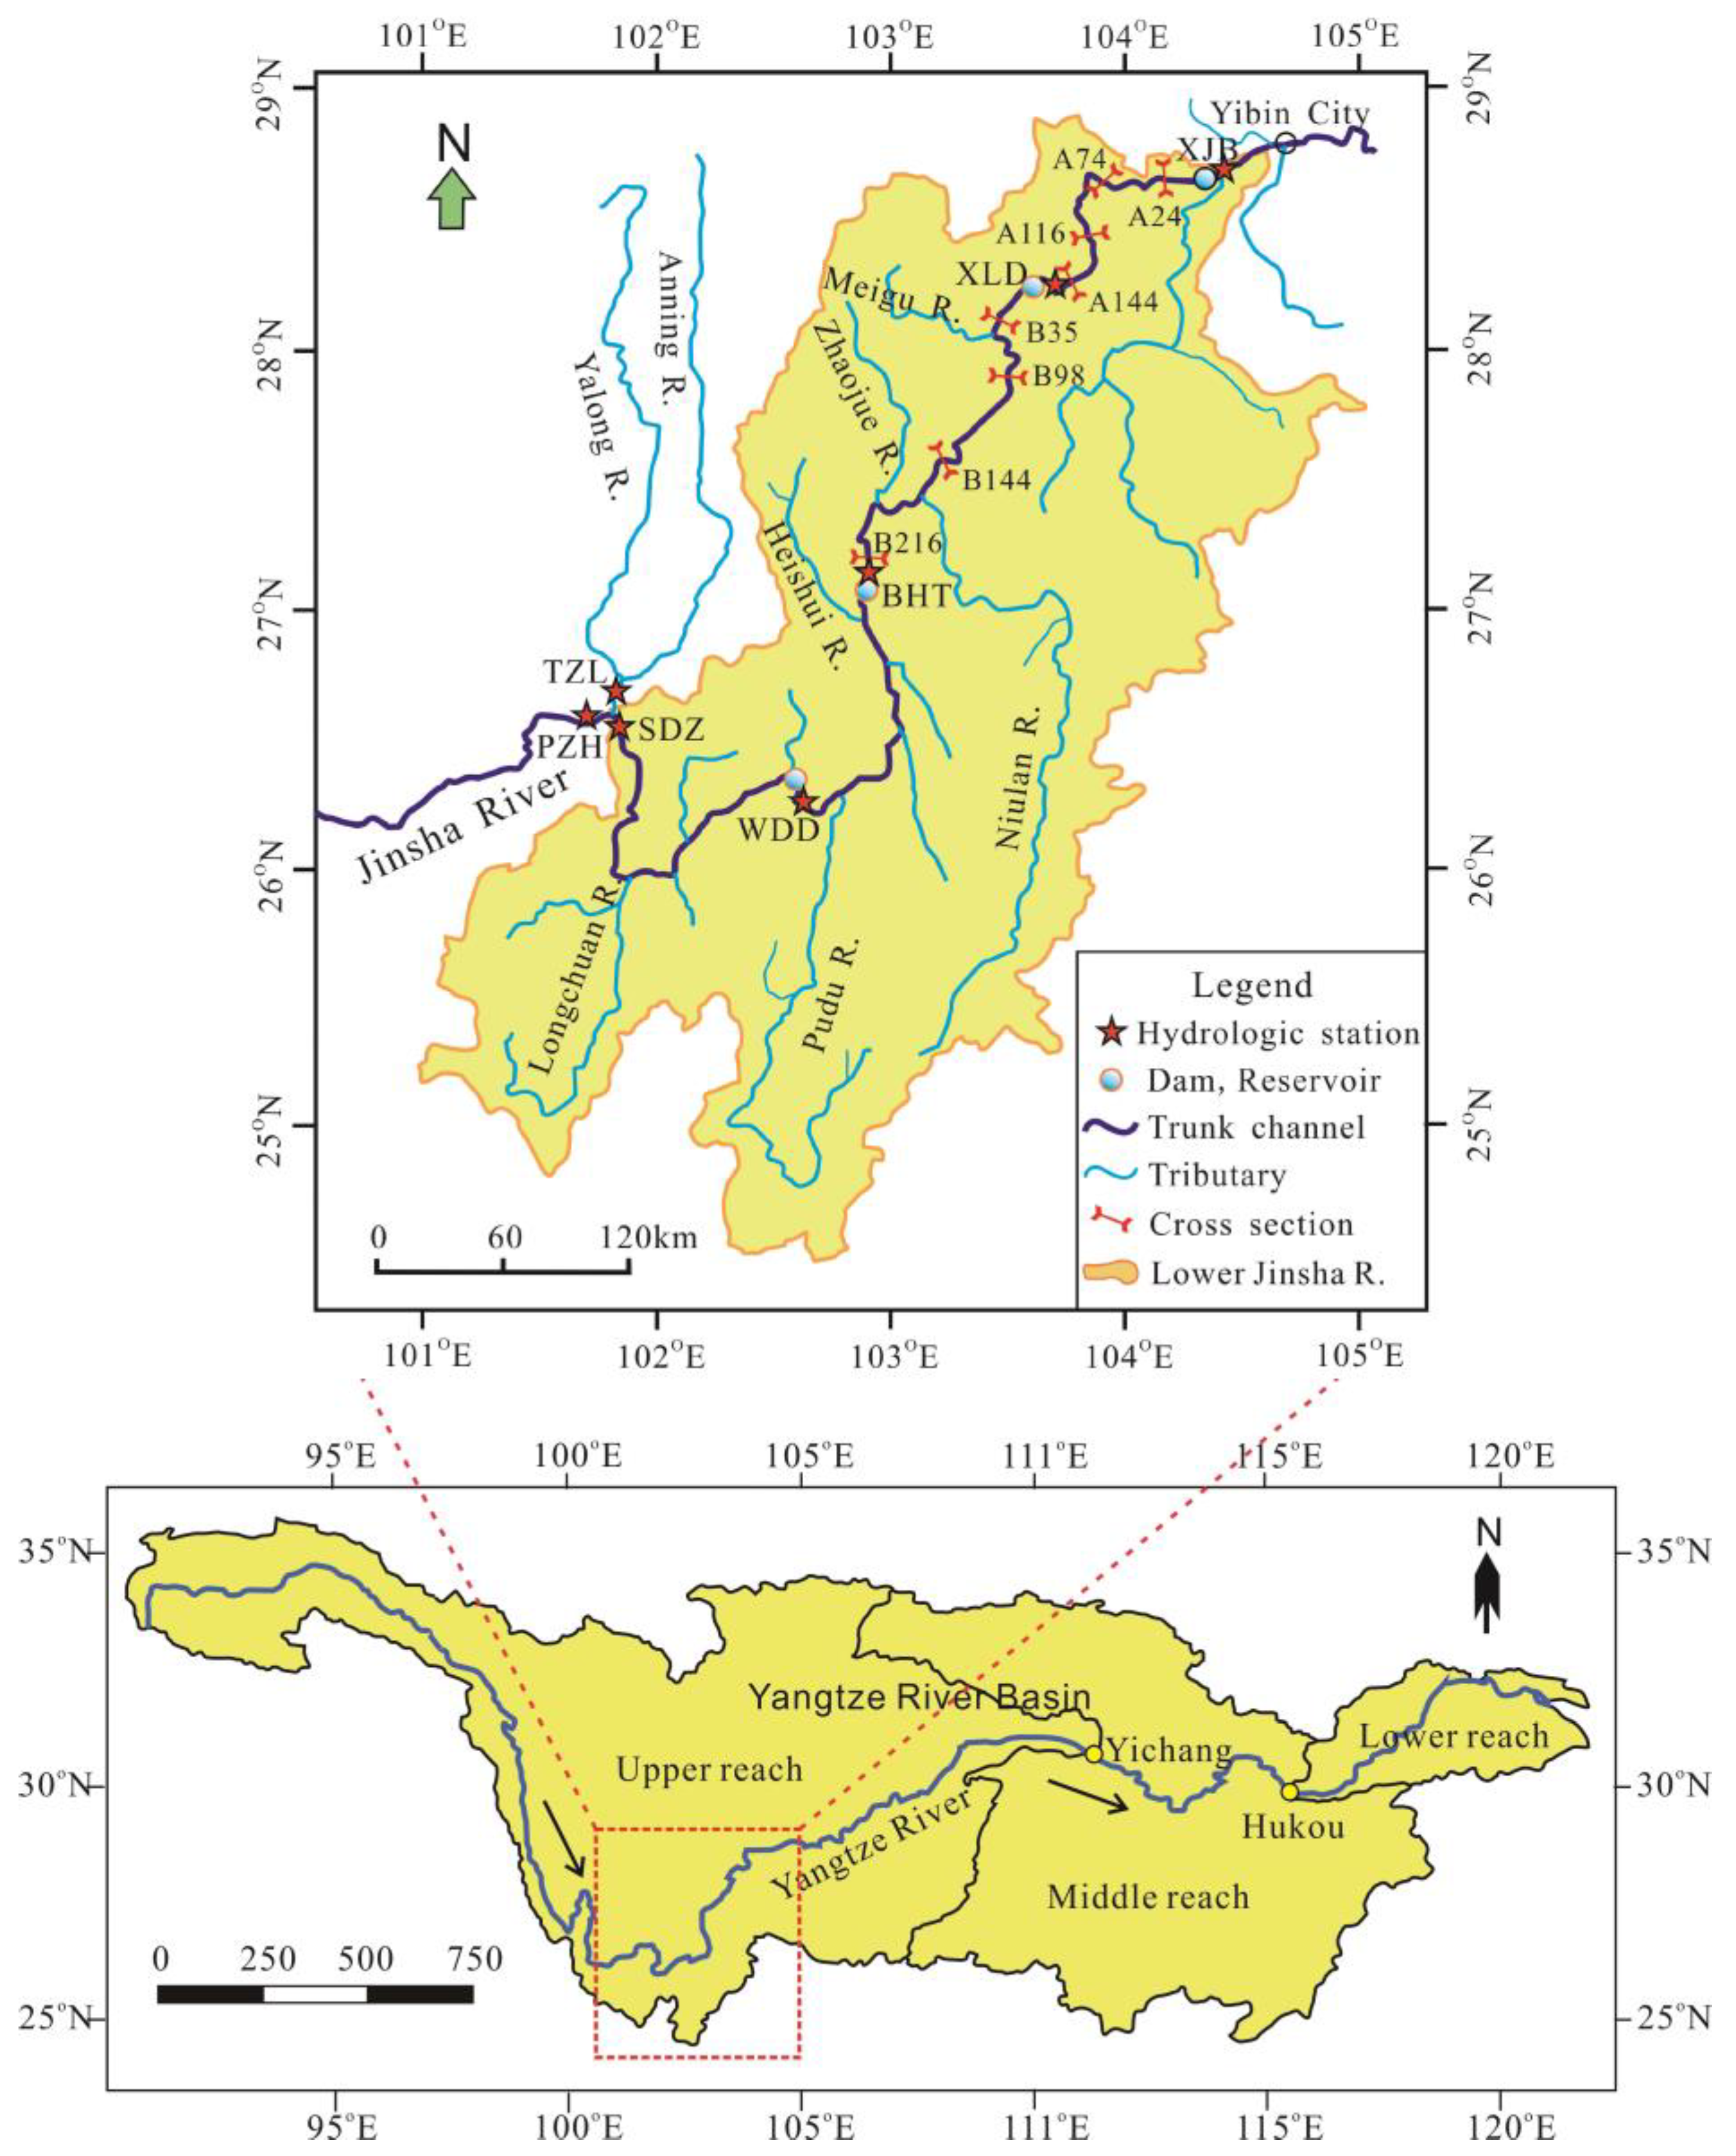
Figure 2.
Spatiotemporal variations in the average erosion and deposition depth and average sedimentation rate along channel thalweg line in the Xiangjiaba Reservoir.
Figure 2.
Spatiotemporal variations in the average erosion and deposition depth and average sedimentation rate along channel thalweg line in the Xiangjiaba Reservoir.
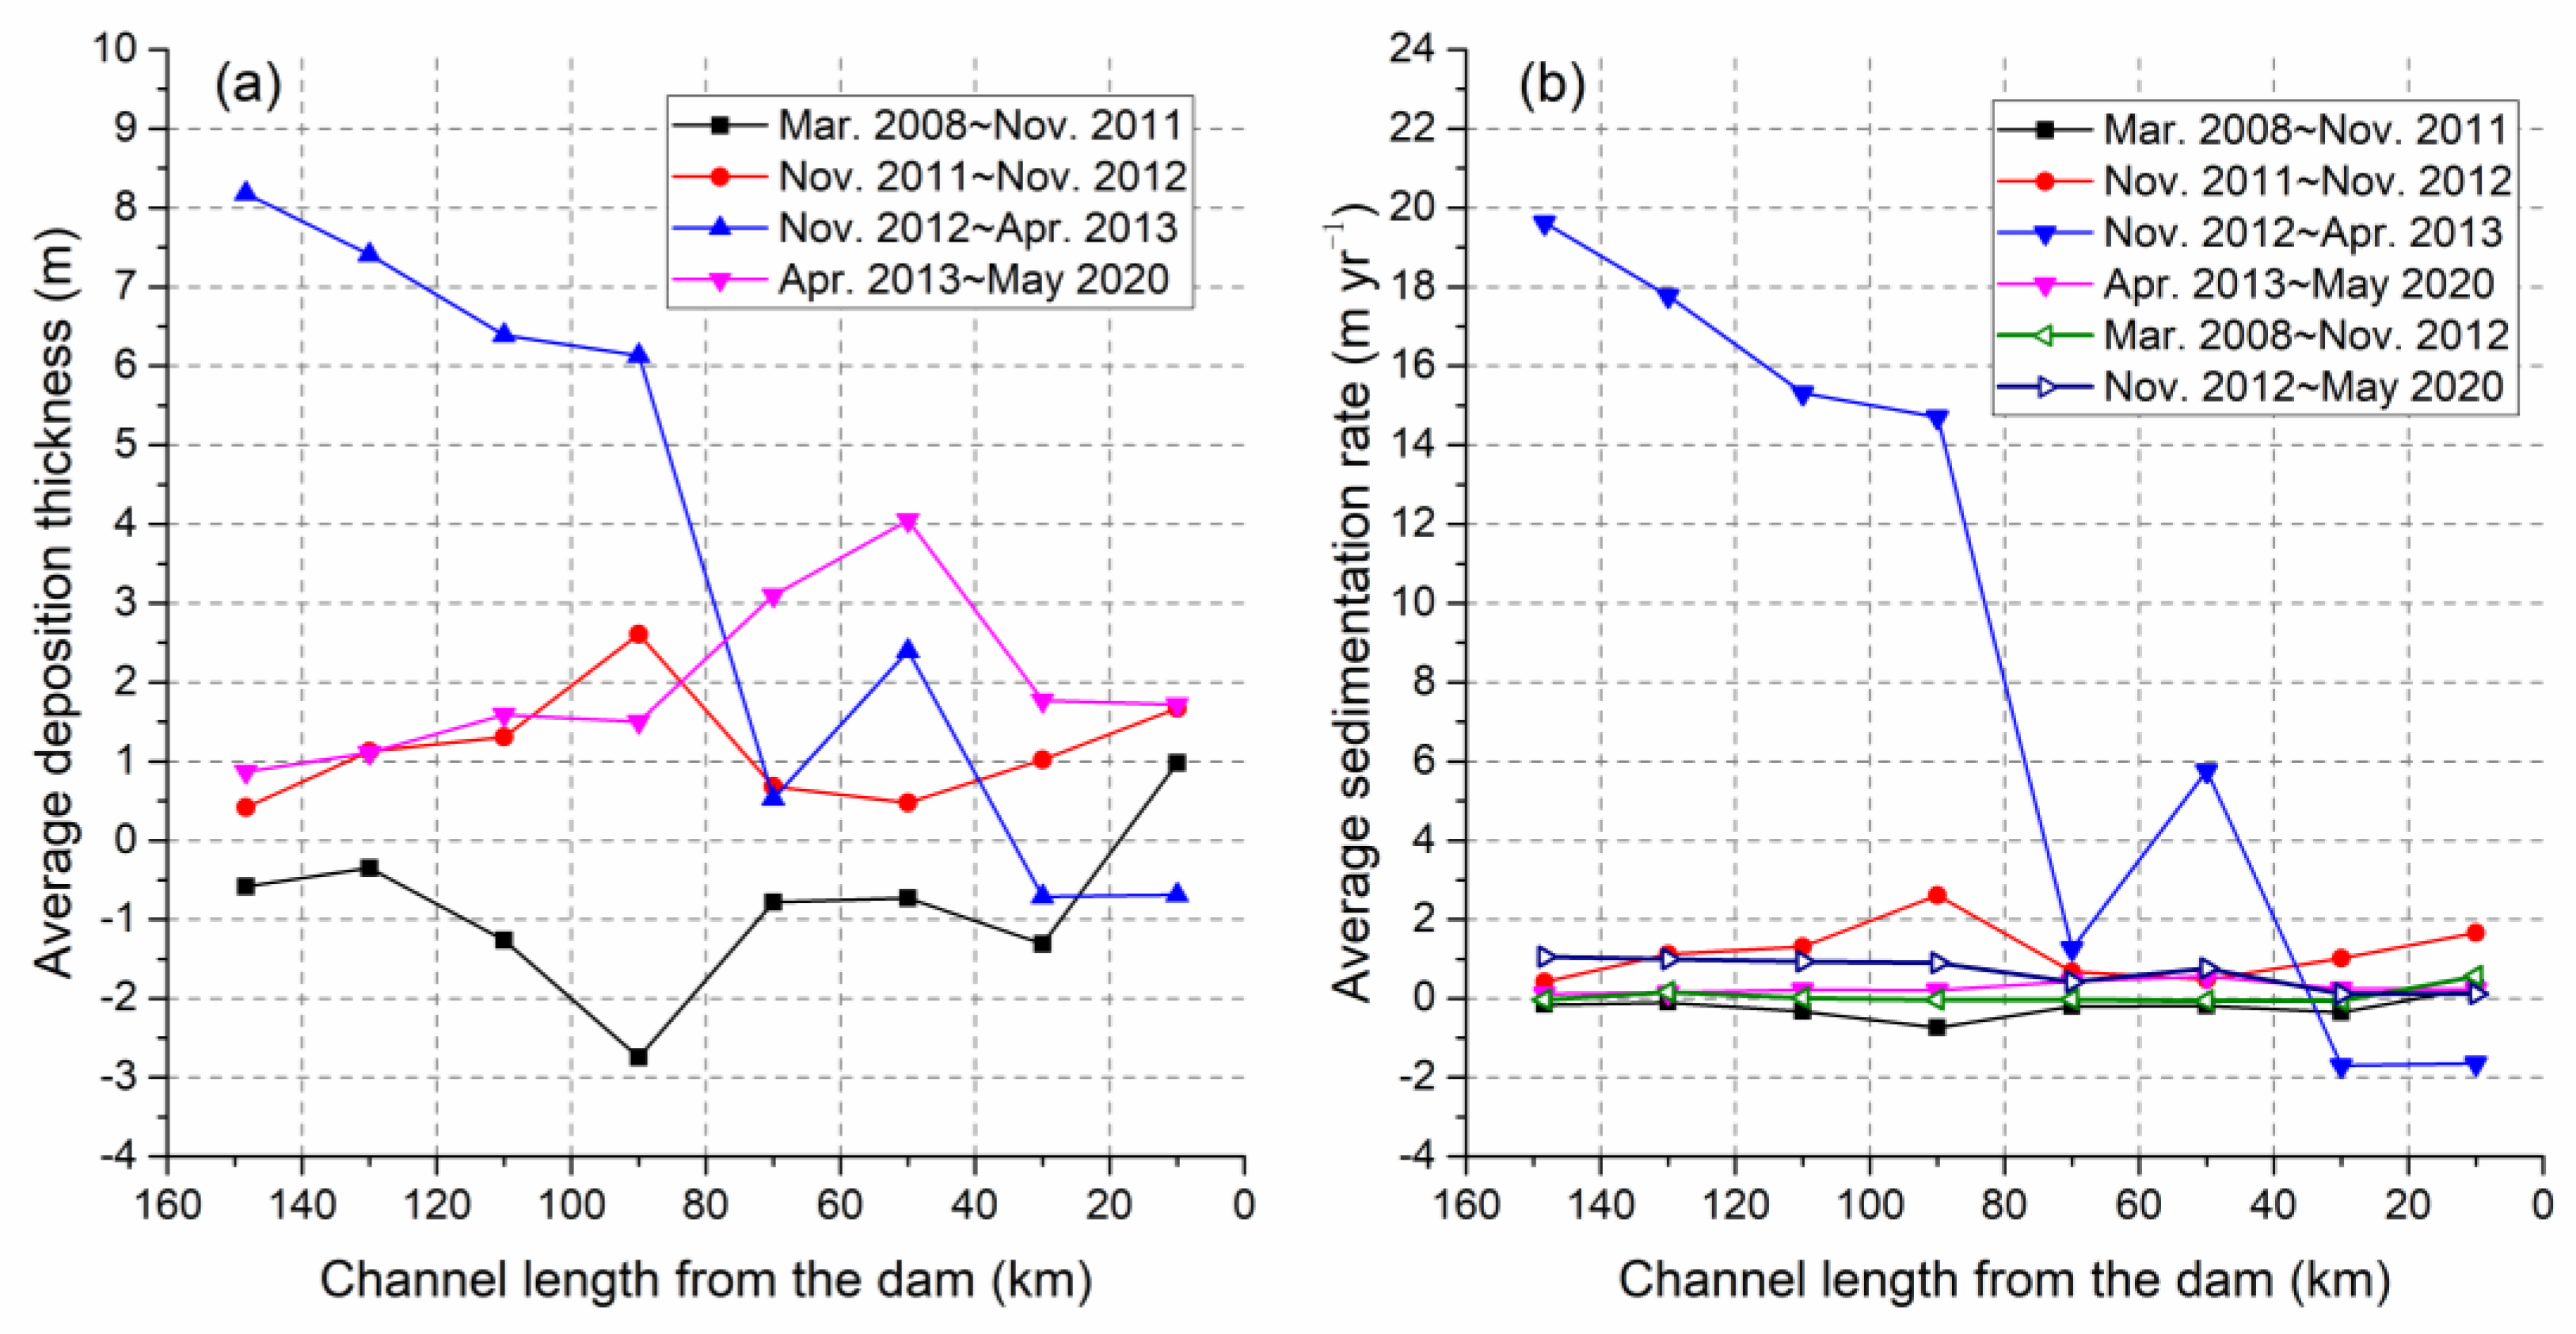
Figure 3.
Spatiotemporal variations in average scouring and sedimentation thickness and average sedimentation rate along channel thalweg line in the Xiluodu Reservoir.
Figure 3.
Spatiotemporal variations in average scouring and sedimentation thickness and average sedimentation rate along channel thalweg line in the Xiluodu Reservoir.
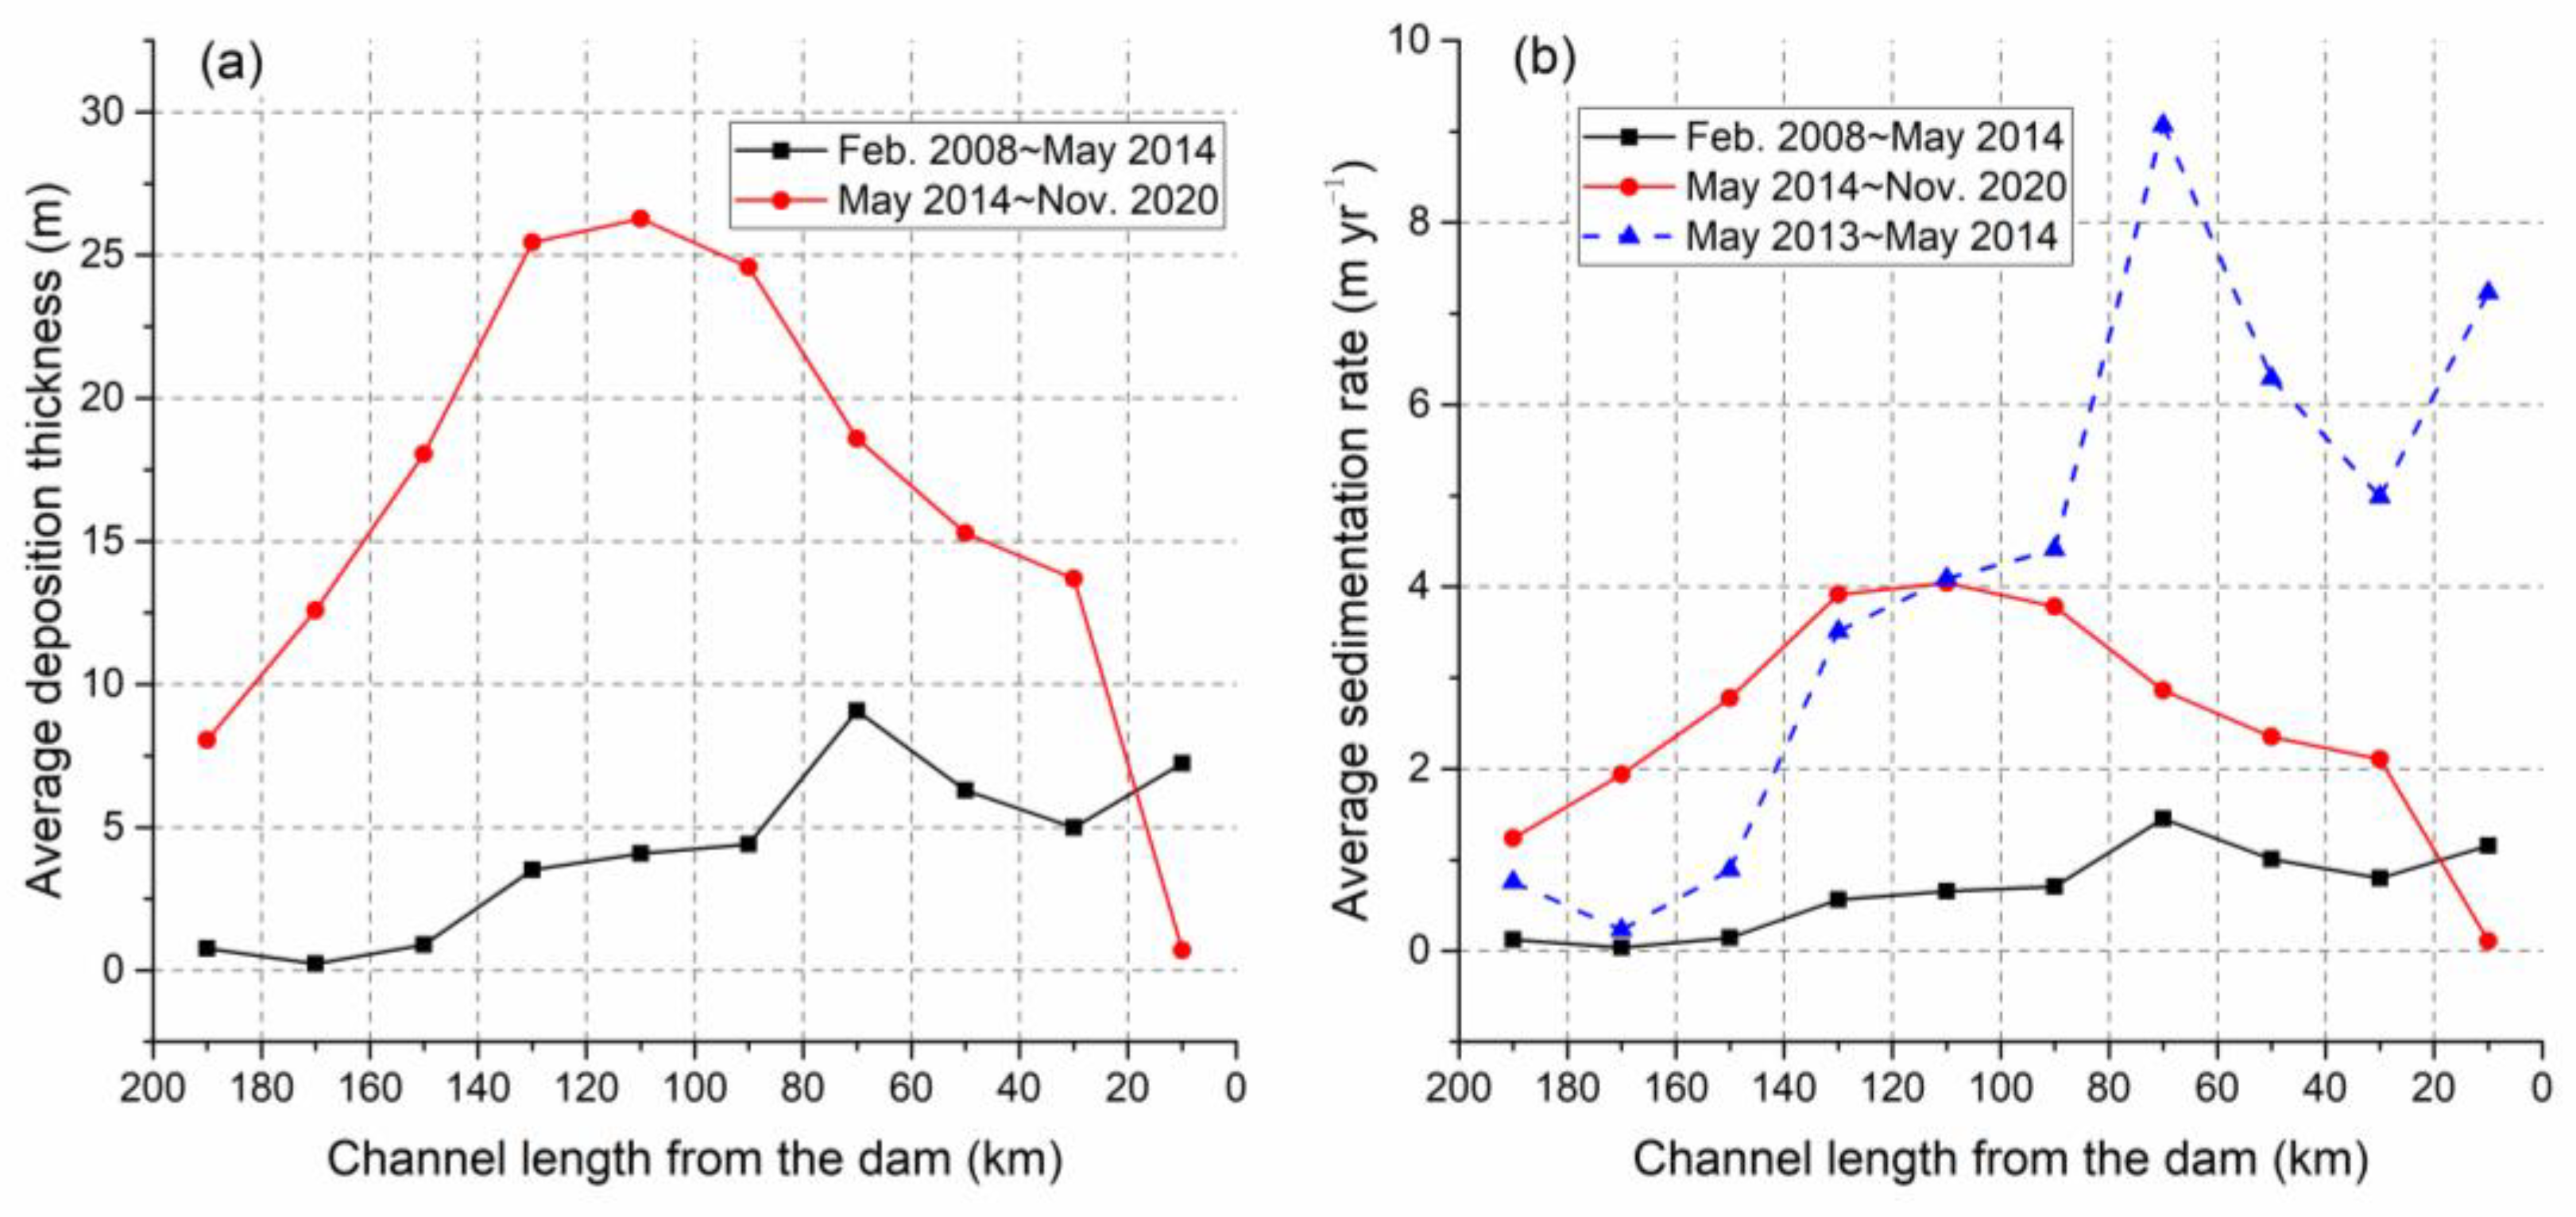
Figure 4.
Changes in the thalweg elevation and gradient before and after the dam completion in the Xiangjiaba Reservoir.
Figure 4.
Changes in the thalweg elevation and gradient before and after the dam completion in the Xiangjiaba Reservoir.
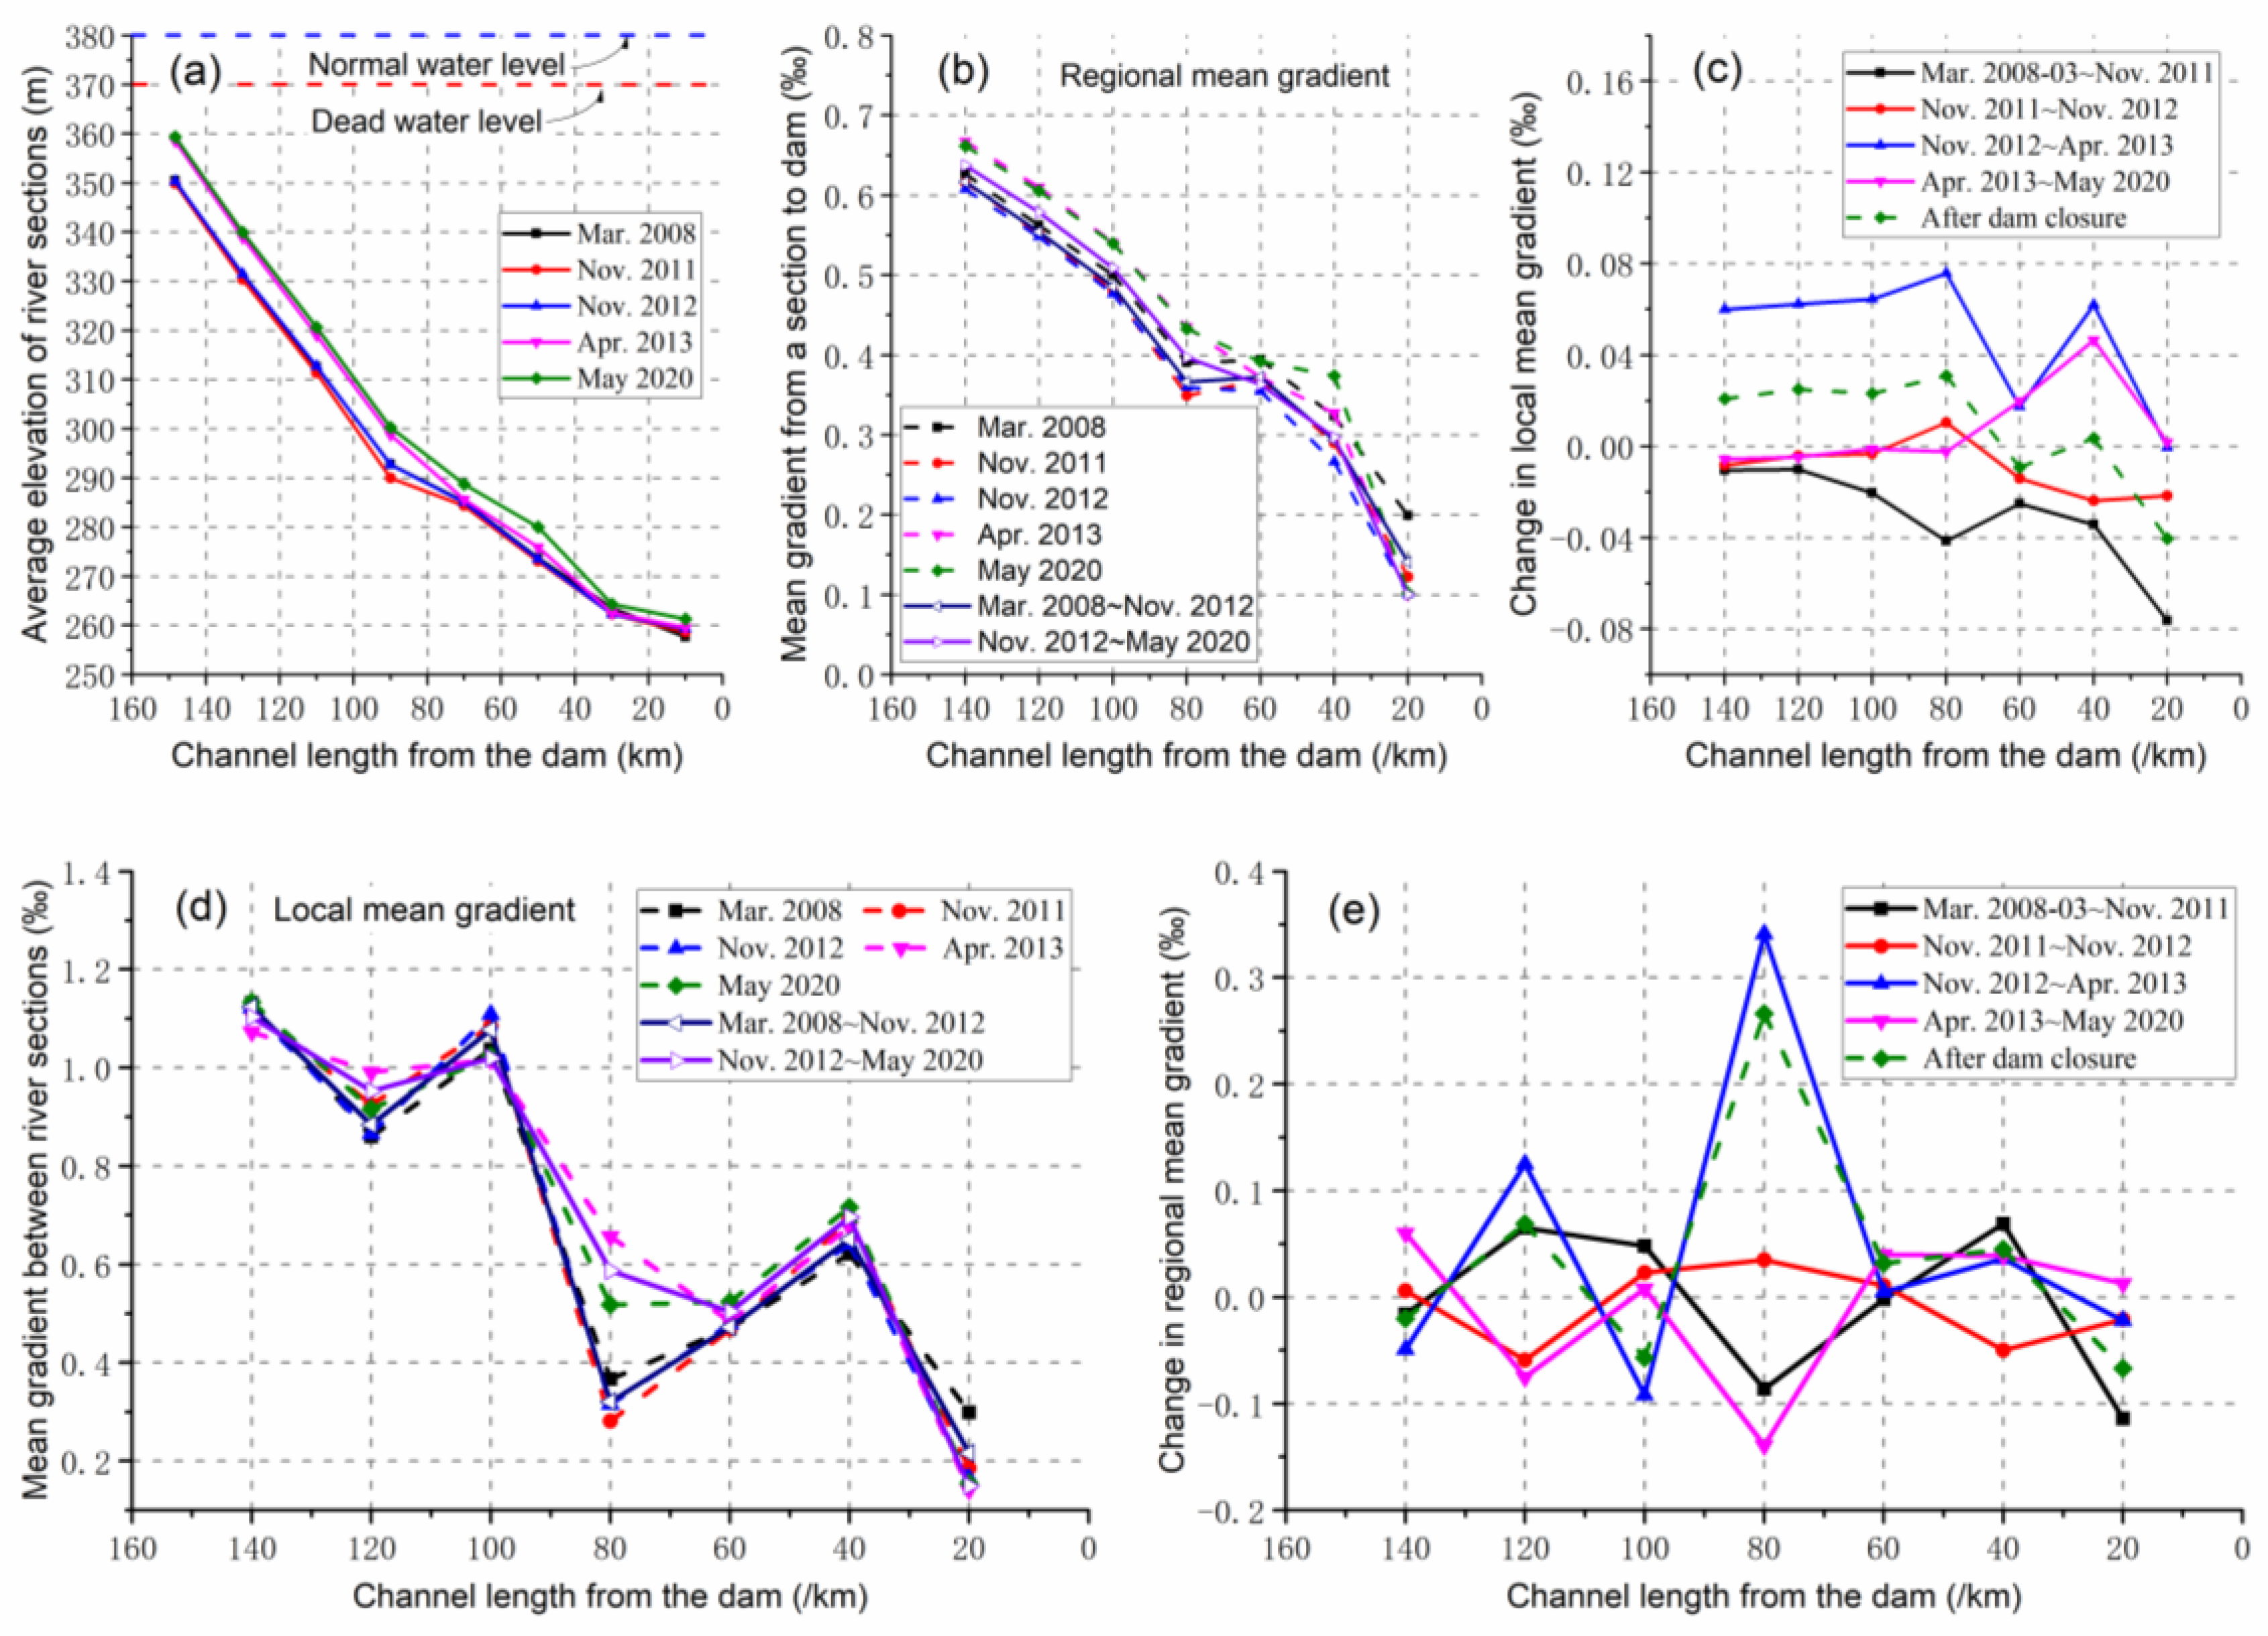
Figure 5.
Changes in the thalweg elevation and gradient before and after the dam completion in the Xiluodu Reservoir.
Figure 5.
Changes in the thalweg elevation and gradient before and after the dam completion in the Xiluodu Reservoir.
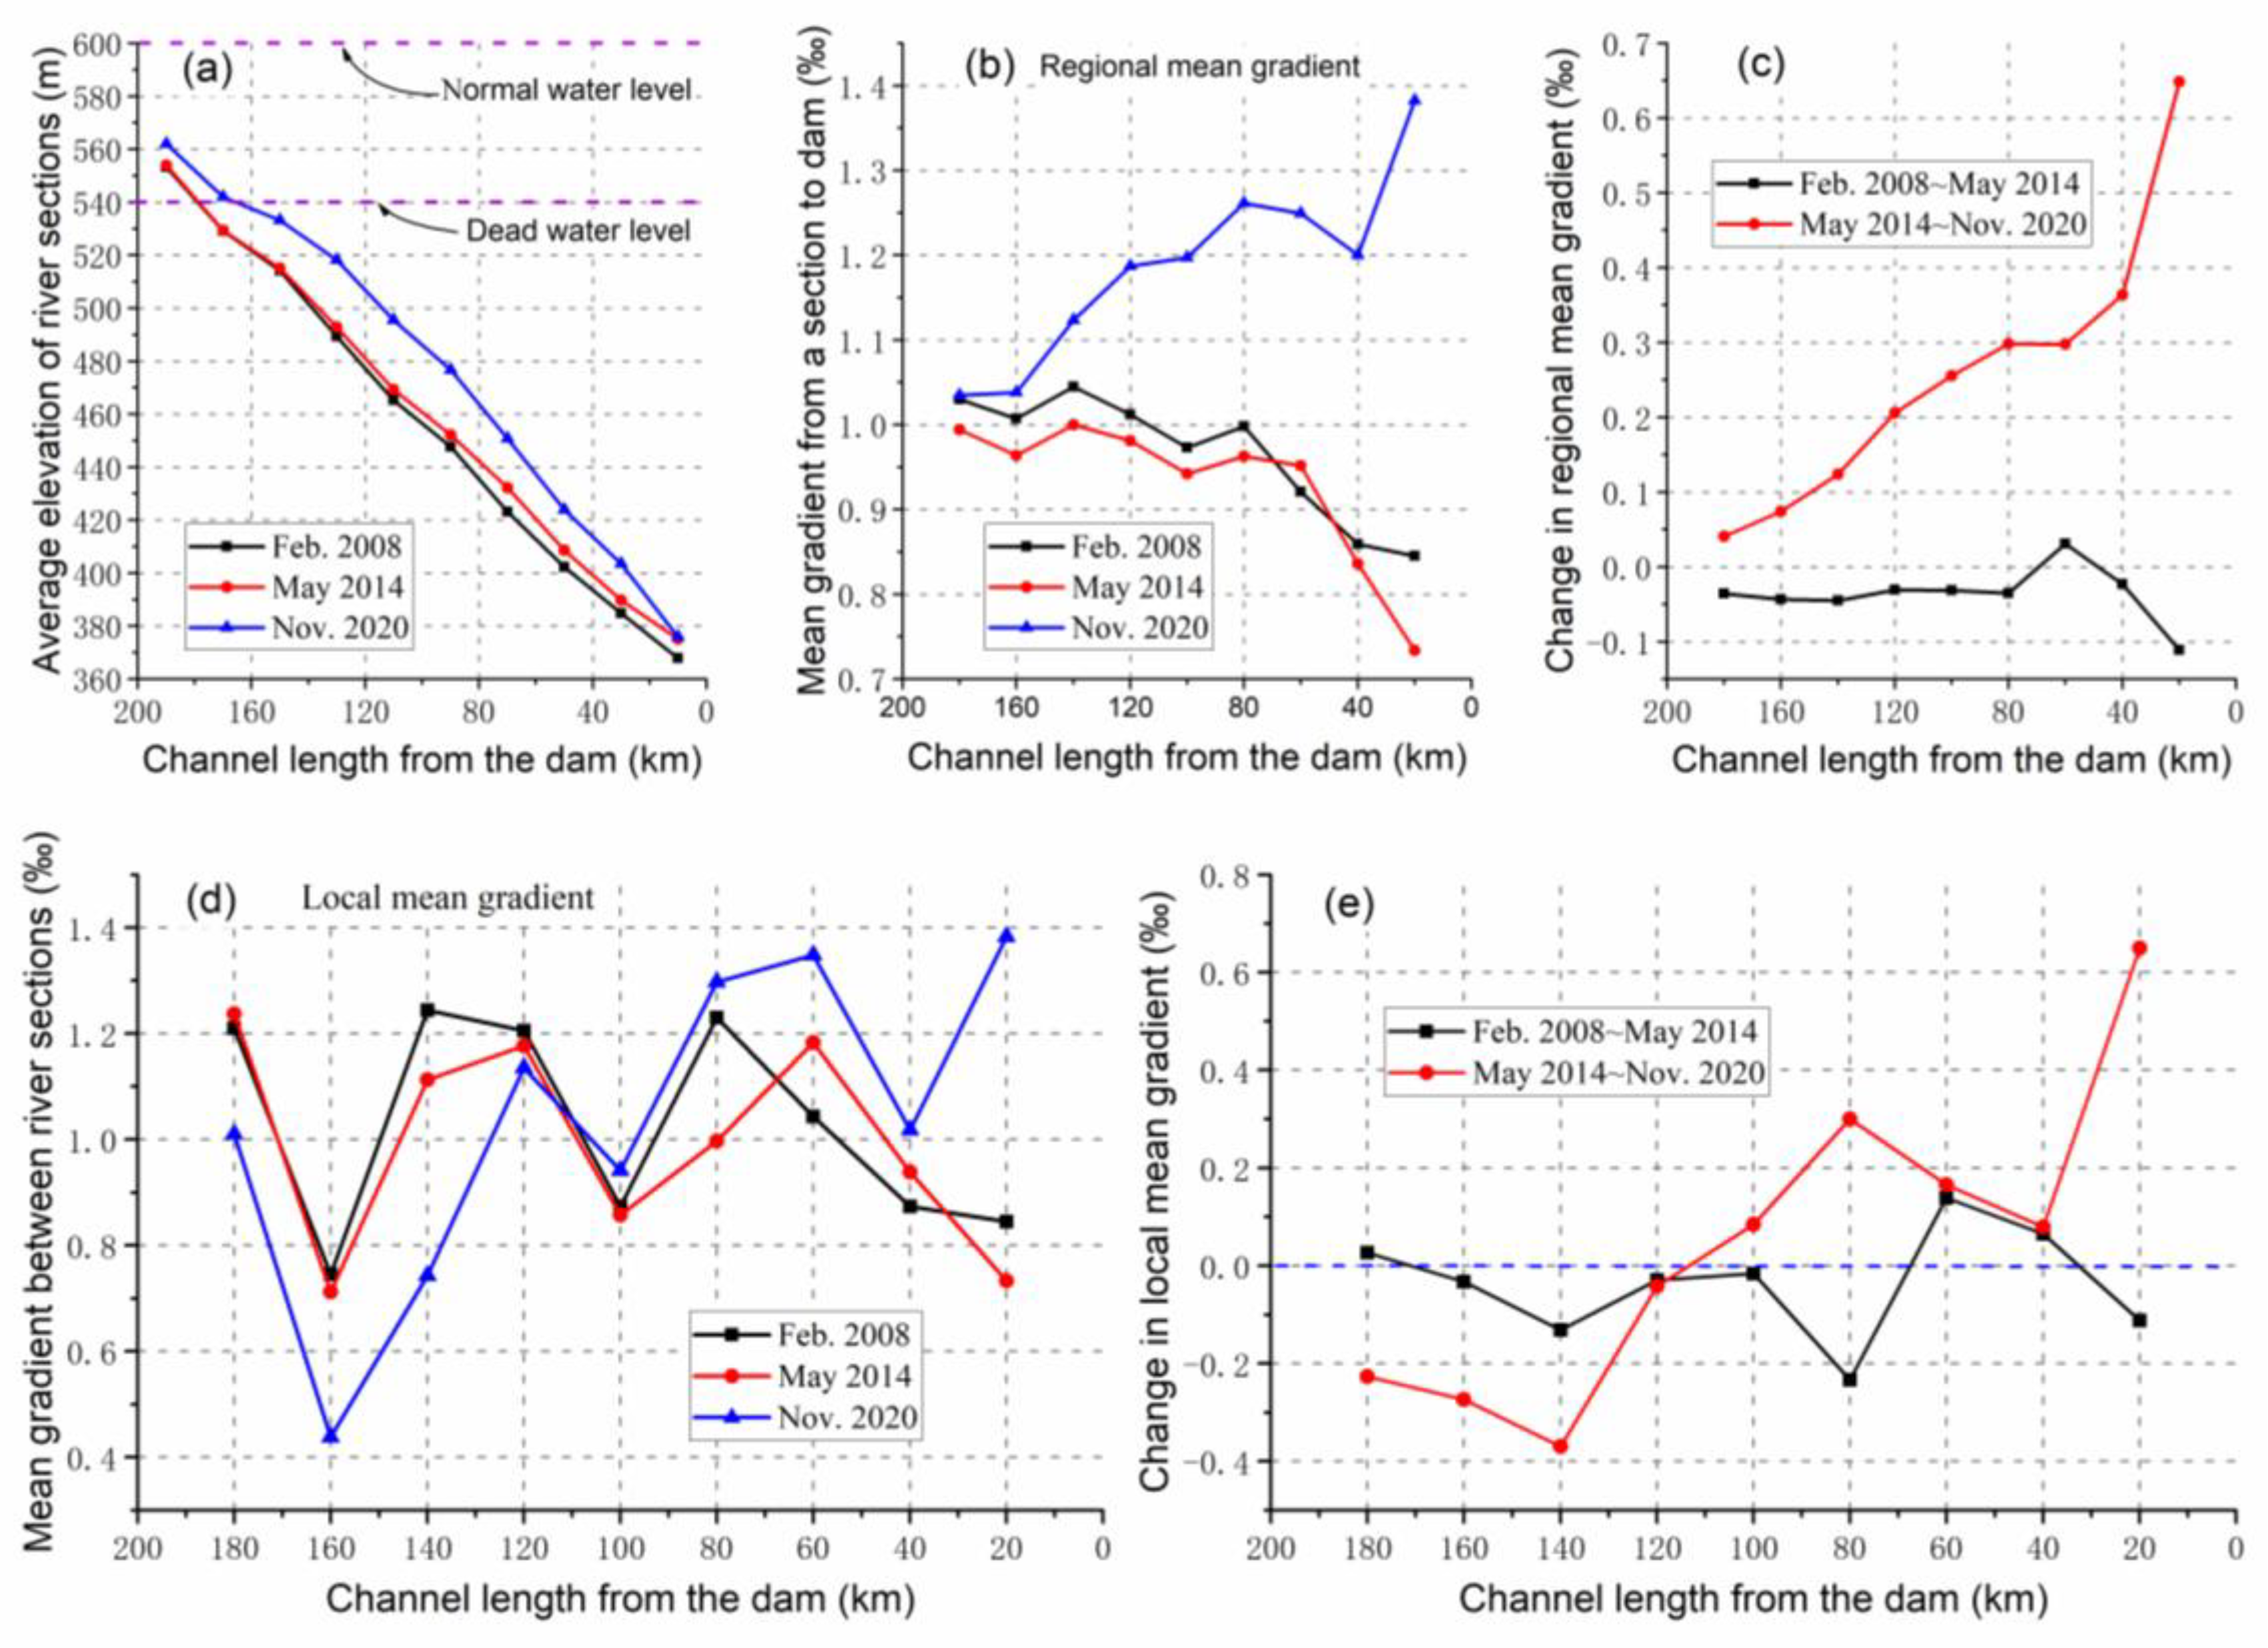
Figure 6.
Comparison of typical cross-sectional morphological characteristics in cascade reservoir sections.
Figure 6.
Comparison of typical cross-sectional morphological characteristics in cascade reservoir sections.
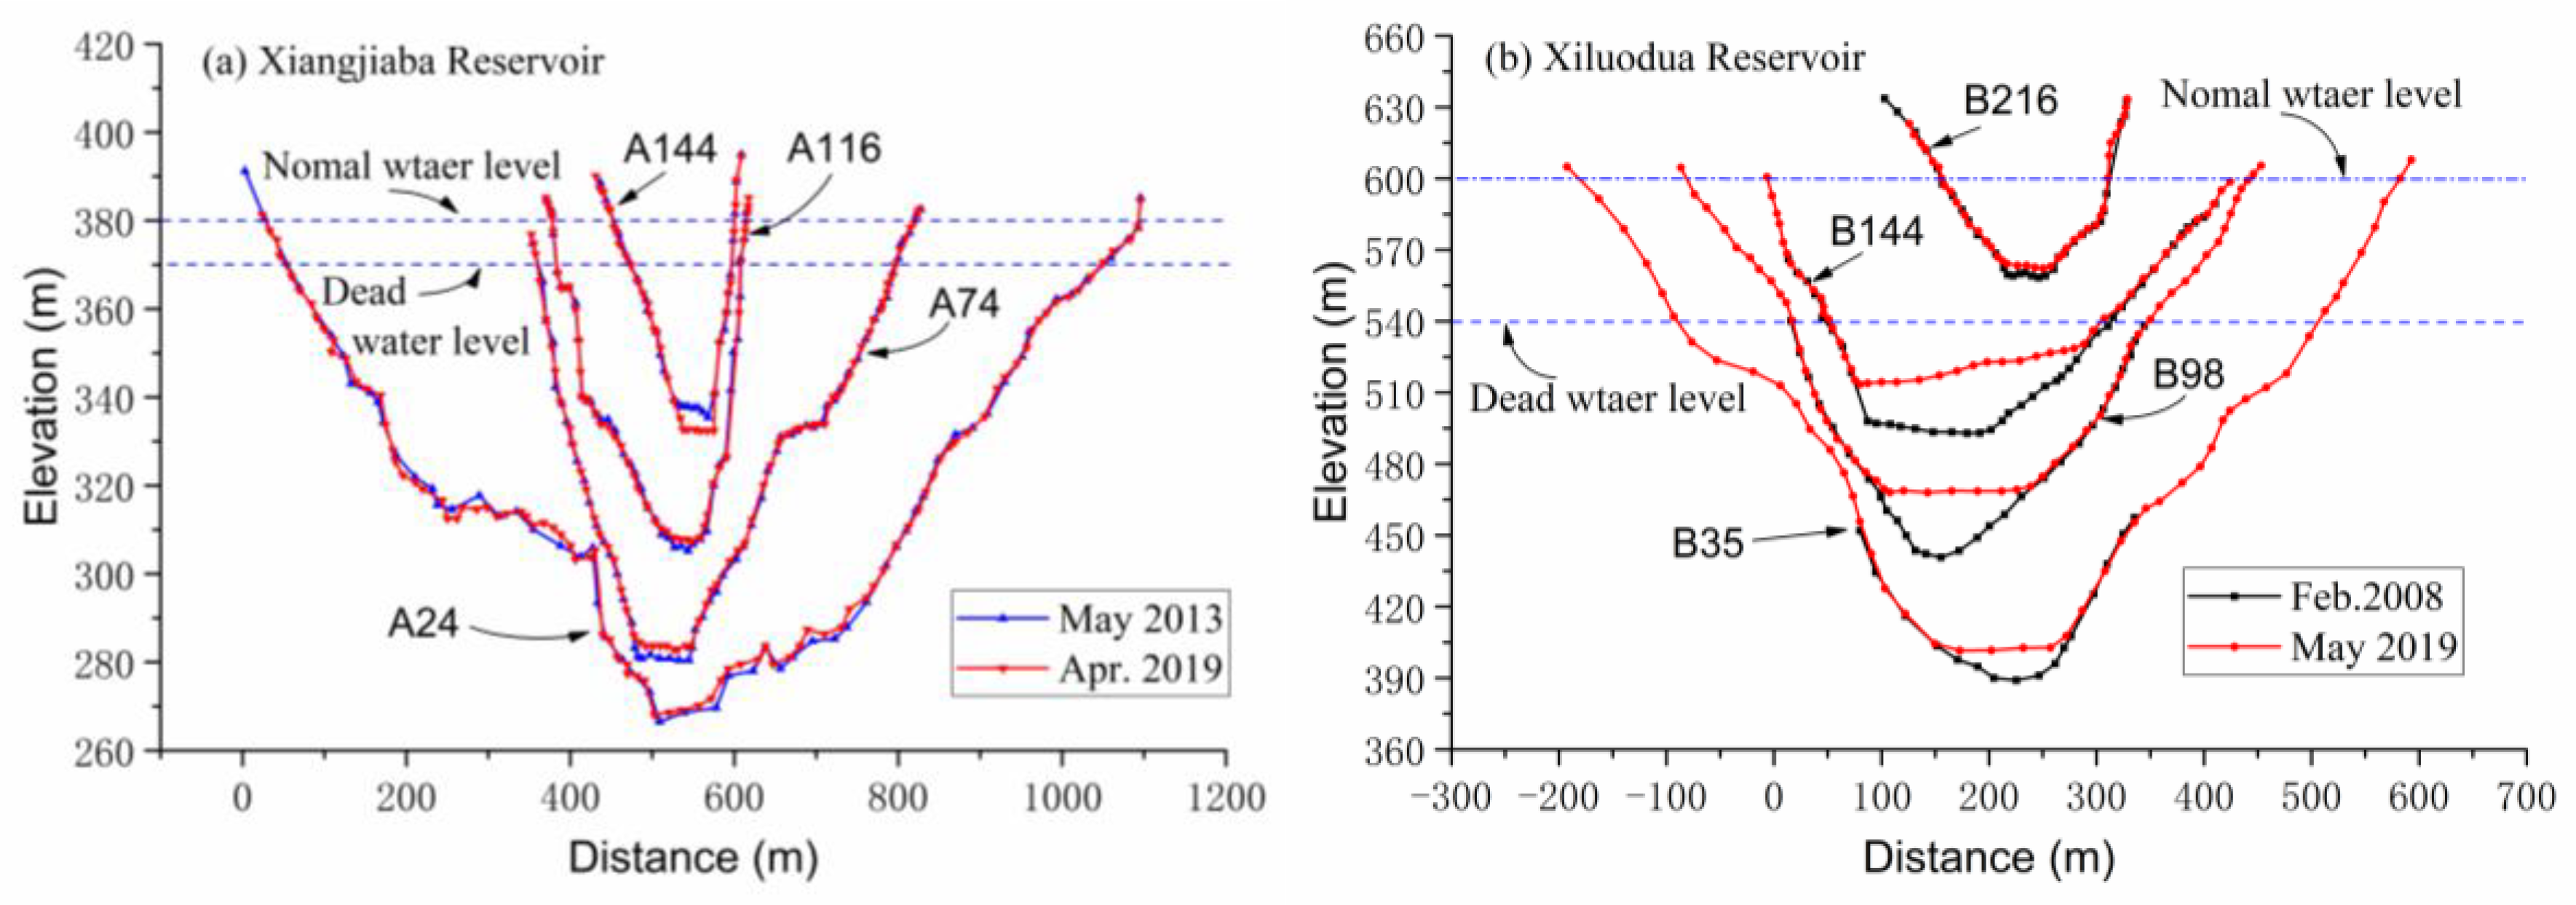
Figure 7.
Changes in width–depth ratio of typical cross-sections in cascade reservoirs.
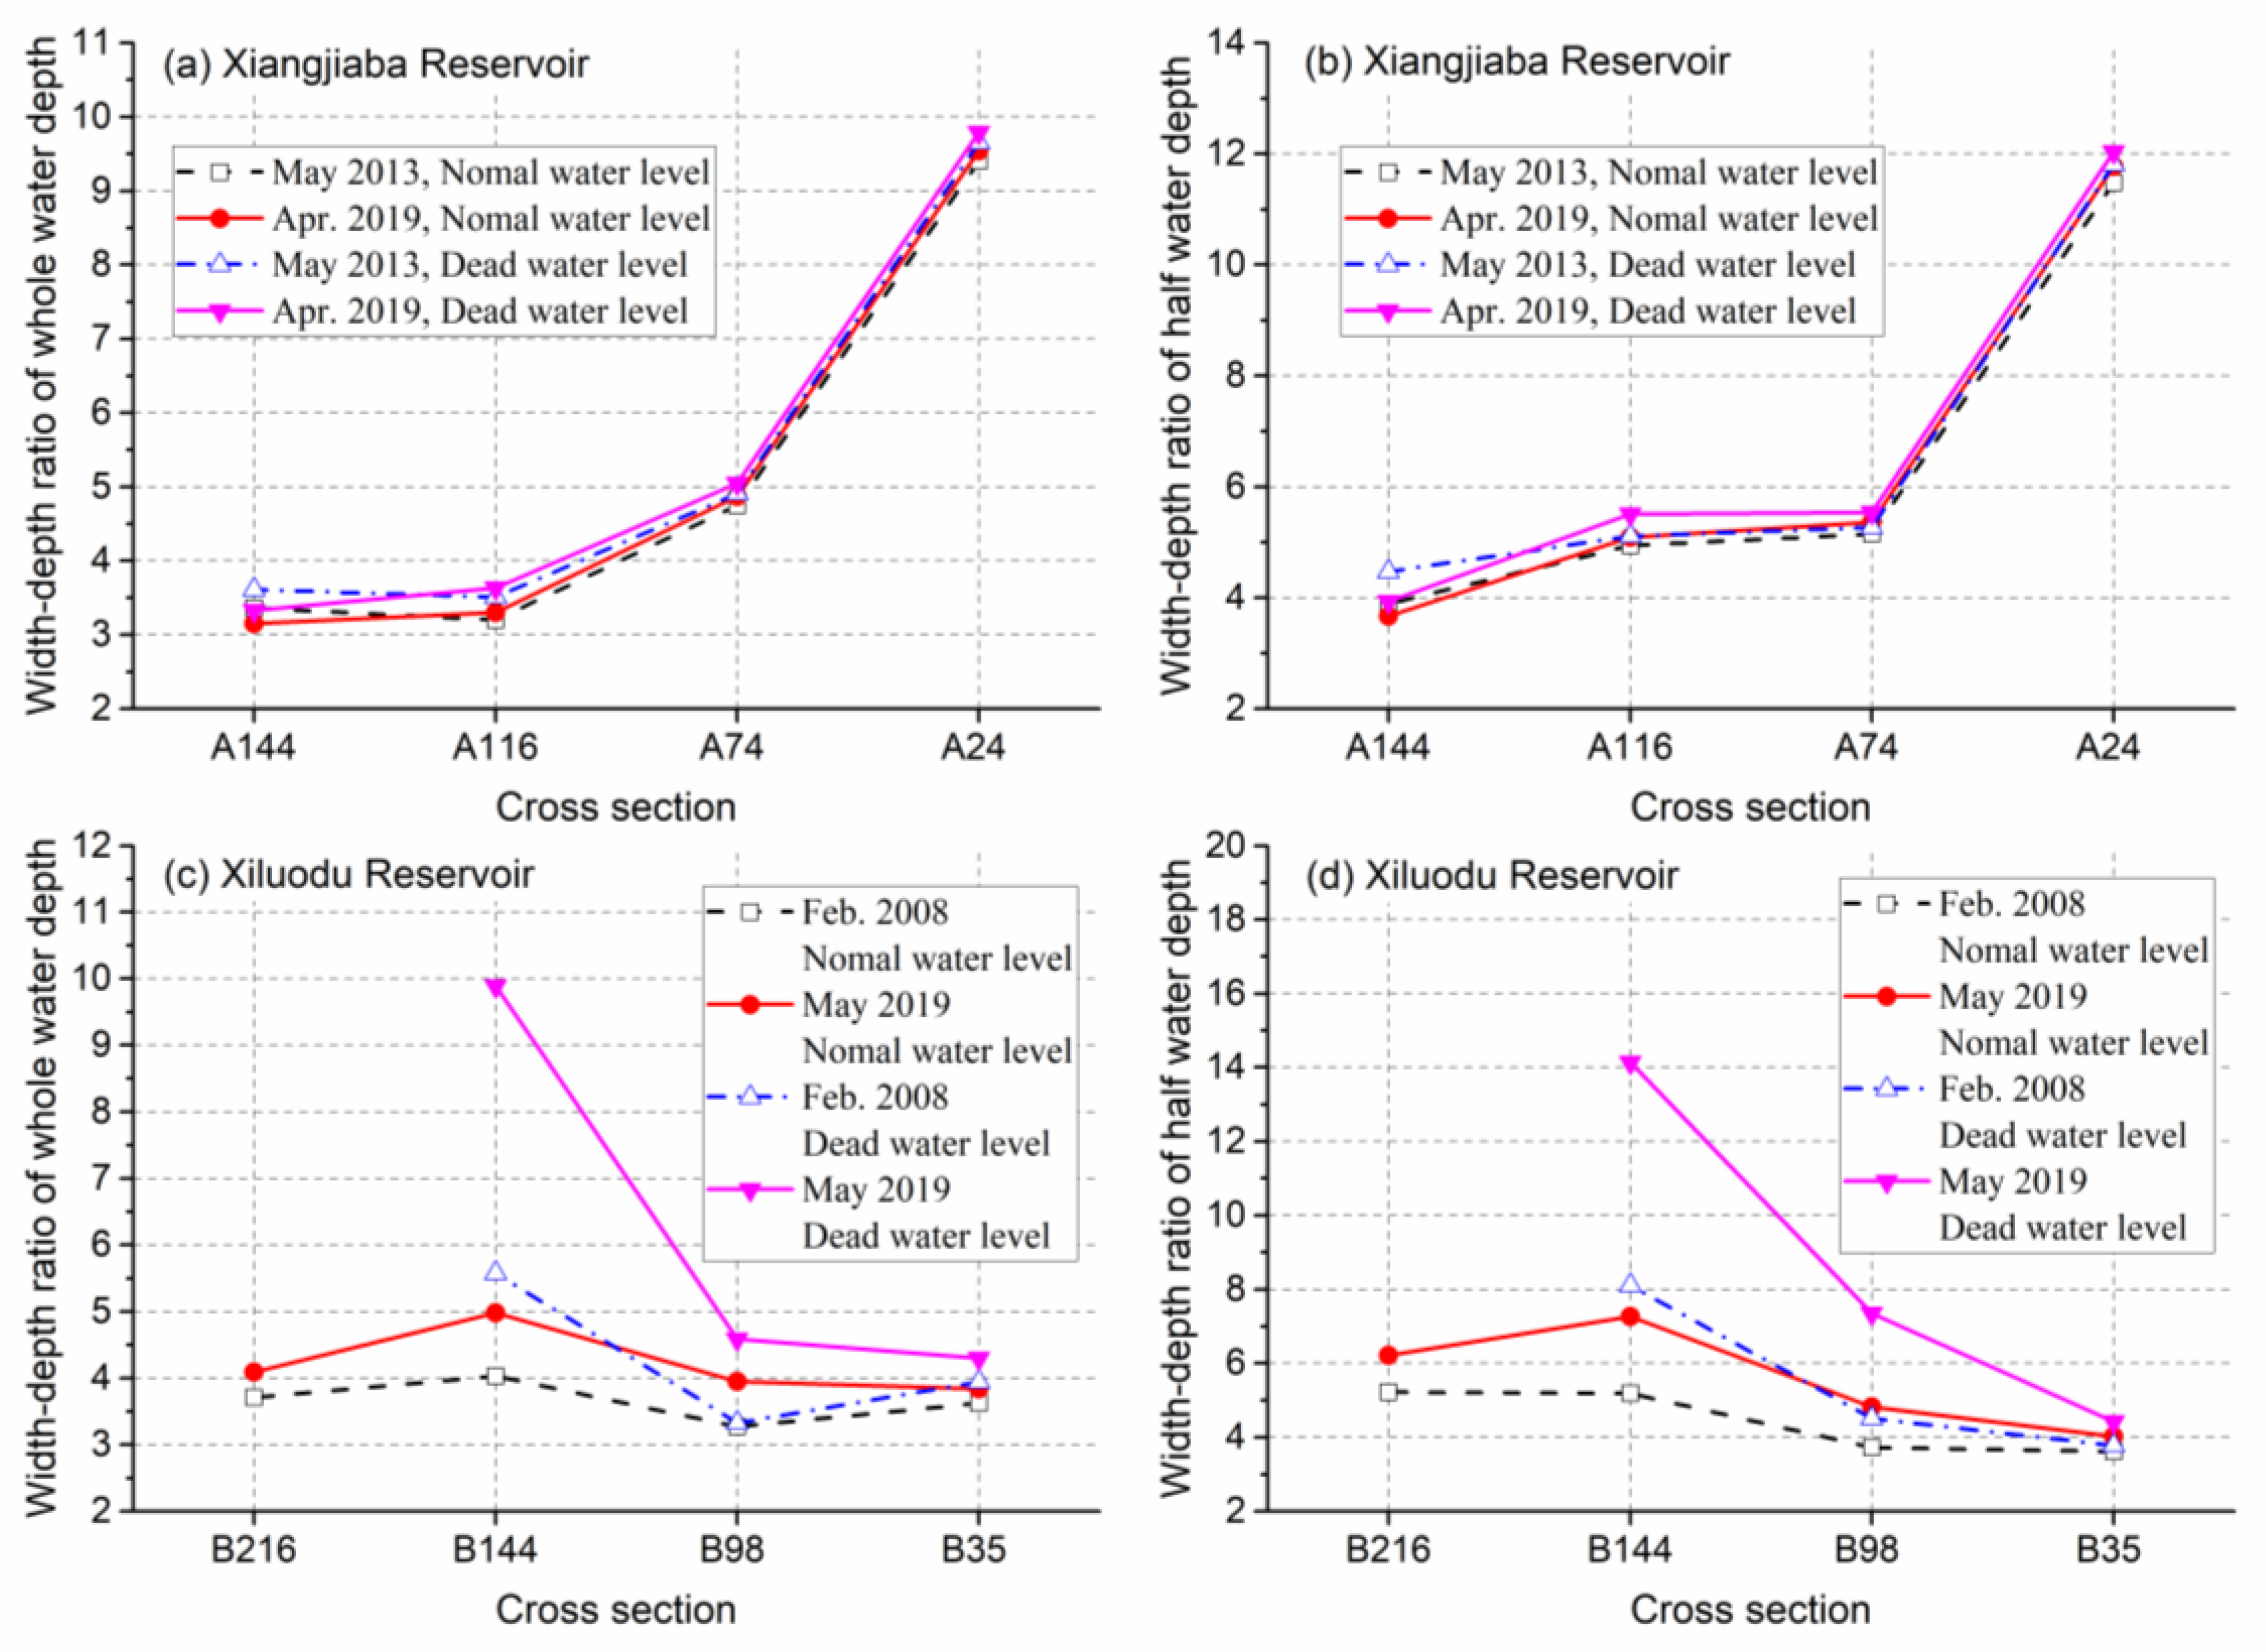
Figure 8.
characteristics of thalweg gradient between adjacent typical cross-sections in cascade reservoirs.
Figure 8.
characteristics of thalweg gradient between adjacent typical cross-sections in cascade reservoirs.
Disclaimer/Publisher’s Note: The statements, opinions and data contained in all publications are solely those of the individual author(s) and contributor(s) and not of MDPI and/or the editor(s). MDPI and/or the editor(s) disclaim responsibility for any injury to people or property resulting from any ideas, methods, instructions or products referred to in the content. |
© 2025 by the author. Licensee MDPI, Basel, Switzerland. This article is an open access article distributed under the terms and conditions of the Creative Commons Attribution (CC BY) license (https://creativecommons.org/licenses/by/4.0/).
Copyright: This open access article is published under a Creative Commons CC BY 4.0 license, which permit the free download, distribution, and reuse, provided that the author and preprint are cited in any reuse.


