
Submitted:
02 December 2024
Posted:
03 December 2024
You are already at the latest version
Abstract
Agricultural land resources are essential for food production, and thus it is vital to examine the spatiotemporal changes in these resources and their impacts on land suitability to optimize resource allocation. In this study, we investigated the spatial evolution of cropland resources through land use change analysis by utilizing four periods of land use data from 1990 to 2020 in the black soil region of Northeast China (BSRNC). Employing niche theory, we developed a cultivability evaluation model tailored to the BSRNC, which was used to assess the impact of spatial changes in cropland patterns over the past 30 years on land suitability. Our key findings are as follows. (1) Cropland resources have generally tended to expand in the BSRNC, with an increase of 7.16 × 10³ km2 in the cultivated area and a northeastward shift of the cropland center by 52.94 km, indicating significant changes in the spatial configuration of land. (2) The region's cultivable land resources are substantial, covering 694.06 × 10³ km2, or 55.78 % of the total area, with notable spatial variability influenced by the regional climate and topography. (3) The land cultivability has slightly improved, as shown by a 0.10 increase in the cultivability index, but a significant declining trend in the cultivability of cropland was observed after 2000. Our findings provide valuable insights to help accurately assess land productivity in the BSRNC and facilitate the sustainable use and conservation of black soil.
Keywords:
Spatial pattern evolution of cropland
; Land cultivability evaluation
; Niche-fitness model
; Black soil region of Northeast China (BSRNC)
1. Introduction
Arable land is the fundamental basis for agricultural production and it is directly related to economic development, human well-being, and social progress [1]. Transforming the spatial configuration of arable land can lead to changes to site factors, such as climate, terrain, and soil, thereby influencing land suitability and introducing uncertainty into sustainable land use and food security [2,3]. The black soil region of Northeast China (BSRNC) is among the three most favorable black soil belts for cultivation in the Northern Hemisphere and one of the key areas for food production in China [4,5]. Thus, it is crucial to understand the changes in cropland resources within the BSRNC and investigate the variations in land suitability to facilitate the rational utilization and conservation of black soil, thereby safeguarding food security in China.
Due to urban sprawl, climate change, and shifts in production systems, arable land is continuously transformed into other land use types [6], thereby leading to significant changes in the spatial configuration of cultivated land. Most previous studies of changes in arable land were based on increases or decreases in the area of arable resources, particularly the evolution of spatial cultivated land patterns [7,8,9], such as overall trends and the characteristic transformations between arable land and other land types. These studies were predominantly conducted within the context of land use/land cover changes by employing established research methodologies and a standardized research paradigm [10]. More recently, some studies have investigated how changes in the spatial configuration of cultivated land might affect its productivity and ecological conditions. Research has shown that over the past few decades, the arable land in China has tended to migrate toward the northwest, with significant conversion of arable land from plains to hilly regions, leading to varying degrees of decline in factors such as sunlight, temperature, water resources, and terrain within the arable land system [11,12,13]. Moreover, these studies mainly focused on whether changes occur in one or several components of the arable land system before and after migration, as well as the direction and degree of these changes. However, few studies have comprehensively considered the dynamic changes in land suitability related to various natural geographical factors, such as climate, terrain, and soil. Recent national land survey findings indicate that new arable land in China is mainly distributed across the Northeast region, especially in provinces such as Heilongjiang, Jilin, and Inner Mongolia. As the urbanization process continues to advance, the pressure to protect arable land in the BSRNC will increase [14]. Zhang et al. (2023) analyzed the spatiotemporal changes in arable land resources in typical black soil regions of China [15] and showed that specific changes have occurred in the arable land pattern, as well as various changes in the components of the arable land system. However, the overall evolution of the spatial configuration of the arable land pattern in the BSRNC and its response in terms of land suitability to spatial changes remain unclear, thereby constraining the effective regulation of land policies by managers in this region at a macro-level.
Arable land suitability is an important component of land suitability assessments and commonly understood as the sustainability of arable land use, with the aim of achieving sustainable and optimal land utilization while maximizing productivity [16]. The "Land Capability Classification System" proposed by the US Department of Agriculture is an innovative assessment scheme for large agricultural lands [17], which classifies land into several ordinal classes based on the strength of natural limiting factors for crop growth. In 1976, the Food and Agriculture Organization of the United Nations released the "Framework for Land Evaluation" [18] to propose a principles-based framework for land assessment that integrates data interpretation with land quality classification. Both systems have significantly influenced the development of global land evaluation frameworks and provided templates for land assessment in numerous countries, such as the national project by the Chinese Academy of Sciences to asses the land resource quality and potential, which led to the creation of the "1:1,000,000 Land Resource Map of China" [19]. These established land assessment systems share two main features: (i) the evaluation process relies heavily on expert judgment and it is often qualitative; and (ii) the central evaluation principle is grounded in the contradictory unity of land limitations and suitability. Progressing from qualitative diagnostics to broader quantitative analyses in evaluations has long been a goal of the academic community. The key requirement of arable land suitability evaluation is establishing the relationships between suitability scores and associated factors [20]. Thus, recent studies have employed various modeling and mathematical approaches to establish the mapping relationships between evaluation indicators and suitability, including fuzzy mathematics, multi-criteria decision models, and suitability functions [20,21,22,23]. However, the evaluation process continues to be affected by subjective elements, particularly during the assignment of weights to indicators in the analytic hierarchy process [24]. Recently, due to advances in artificial intelligence, machine learning techniques, including random forests, deep learning, and maximum entropy models, have increasingly been utilized in land evaluation [25,26,27], but these "black box" models can be significantly affected by noise and exhibit poor interpretability, which complicates the clear presentation of evaluation outcomes [28]. Consequently, there is an urgent need to develop a more straightforward, scientifically robust, and practical system for assessing land suitability. Niche models are based on the ecological niches of species or land use in the environment, and they can predict land suitability through environmental variables that effectively capture complex ecological relationships, and they are also suitable for various habitat types [29]. This type of model allows robust interpretability, requires minimal data, and exhibits excellent spatial adaptability, and it has been successfully utilized in land evaluation [12,30,31,32]. Furthermore, traditional research predominantly targets current arable land or reserve arable resources, thereby hindering the accurate representation of the amount and spatial distribution of land available for cultivation within a region, which hinders studies of how changes in spatial arable land patterns affect suitability. Niche models can effectively combine current arable land with reserve arable land to view arable land as a dynamic system and identify ecologically suitable positions for cultivation within the area, and thus directly assess the appropriateness of the existing spatial arrangement of arable land and identify the distribution of potential cultivable land [30]. This approach provides robust support to enhance land use decision-making and management strategies.
Therefore, in the present study, we selected the BSRNC as the study area and conducted the following research. (i) Utilizing multi-temporal land use classification data, we systematically analyzed changes in the quantity and spatial migration characteristics of arable land resources in the area. (ii) Employing ecological niche models, we constructed a land suitability evaluation framework tailored for the BSRNC to assess the spatial distribution and quantity of arable land within the region. (iii) We investigated the effects of changes in arable land spatial patterns on land suitability. The findings obtained in this study may provide a scientific basis for the formulation and optimization of arable land protection policies in the BSRNC, as well as for the rational use and protection of black soil resources.
2. Materials
2.1. Study Area
The BSRNC (115°52′E–135°09′E, 38°72′N–53°56′N) is a relatively complete and independent natural geographical unit. Based on factors, such as the water and heat conditions, topography, soil types, and planting methods, the BSRNC can be divided into six types of regions: the Songnen Plain Region (SNP), Sanjiang Plain Region (SJP), Liaohe Plain Region (LHP), Changbaishan and Eastern Liaoning Region (CMEL), Western Sandy Region (WS), and Daxing'an and Xiaoxing'anling Region (DXXAL) (Figure 1a). The BSRNC encompasses the provinces of Liaoning, Jilin, Heilongjiang, and the eastern part of Inner Mongolia, including Hulunbuir City, Xingan League, Tongliao City, and Chifeng City (Figure 1b), with a total area of approximately 125 × 104 km2. This area is situated in the temperate monsoon climate zone, with annual active accumulated temperatures ranging from 1500 ℃ to 3800 ℃ and average annual precipitation between 450 and 850 mm. The region experiences concurrent rainfall and heat, with significant diurnal temperature variations, making it suitable for the growth of single-crop annual plants. The soil types include black soil, black calcareous soil, silt soil, meadow soil, brown soil, and dark brown soil (named according to the Chinese soil classification system) (Figure 1c). Due to the favorable resource conditions, the BSRNC has become an important grain production base in China, where the grain output accounts for about one-quarter of the national total and the commodity grain output is about one-third of the national total [33].
2.2. Data source and Processing
The core data sets required for this study were sourced from open websites or publicly available research results, and detailed information about the data employed is shown in Table 1. To analyze the impact of cultivation use, we focused only on the soil characteristics in the topsoil layer (0–30 cm) [34]. The soil texture, organic carbon content, and pH data were obtained for three vertical soil layers (0–5 cm, 5–15 cm, and 15–30 cm), and weighted average calculations were performed based on the soil layer thickness. In addition, the organic carbon content was converted into soil organic matter (SOM) using the Van Bemmelen coefficient (constant: 1.724). Soil textures were classified based on the USDA standards. Slope data were calculated using elevations as inputs and the slope extraction tool in ArcMap 10.3. All data sets were resampled to a grid with a resolution of 1 km.
3. Methodology
3.1. Cropland Gravity Center Model
The cropland gravity center model was used to explore the overall trends in spatial shifts in cropland. The cropland gravity center refers to the point on the spatial plane where the cropland area within a region achieves moment equilibrium at a certain time. Its movement direction and speed effectively characterize the spatial dynamic changes in cropland resources [36]. In this study, the cropland area was used as the weight and the geometric center of cropland patches as the gravity center. The migration of the cropland gravity center was represented by combining the coordinates of the patch gravity center with weight factors, according to the following formulae:
where Xt and Yt represent the latitude and longitude coordinates of the cropland gravity center in year t, respectively, Cti represents the area of the i-th cropland patch in year t, and Xi and Yi represent the latitude and longitude coordinates of the cropland gravity center in the i-th year, respectively.
3.2. Ecological niche model
3.2.1. Ecological niche connotations of cultivable land
The niche model was applied in this study to assess land cultivability (i.e., cropland suitability). The niche concept was first applied in species biology to refer to the spatial position of an organism in its habitat and its functional role in the biological community [37], known as the "hypervolume niche." This definition provides the theoretical foundation for systematically describing how organisms utilize environmental resources. In regional development, resources form a multidimensional demand space referred to as the "demand niche." The degree of matching between the existing resource space in a region and the demand niche of arable land is the basis for evaluating land cultivability.
In the niche model, evaluation factors are classified into three categories. The first category includes positive factors (Equation 3) that require meeting a minimum threshold, where higher values are advantageous until diminishing returns occur beyond a certain point, such as precipitation and accumulated temperature. The second category consists of intermediate factors (Equation 4) with an optimal range that become limiting factors if values fall below or exceed certain thresholds, such as soil pH. The third category includes negative factors (Equation 5) that must remain below a specified limit, where lower values are preferable, such as slope.
In Equations (3) to (5), Ci denotes the suitability index for evaluation factor i, Xi is the current value of evaluation factor i, Diopt denotes the optimal value of factor i, Dimin is the lower limit for factor i, and Dimax denotes the maximum threshold for factor i.
A vector composed of the current values of evaluation factors represents the actual niche of the land, and the indicators that influence land cultivability form an n-dimensional resource space. Land cultivability attains its optimal state when all evaluation factors reach their ideal values in a state defined as the "optimal niche" for land cultivability. The degree to which the actual niche approximates the optimal niche defines the niche suitability for land cultivability, where deviations in any factor impact the land's overall cultivability. Consequently, the model for evaluating land cultivability is represented in Equation (6).
In Equation (6), C represents the land cultivability index and Ci denotes the suitability index for each factor.
3.2.2. Selection of Factors for Cultivable Land Evaluation
The demand niche often spans multiple dimensions, and conducting a comprehensive analysis of all "resource dimensions" poses practical difficulties. Consequently, analyses typically prioritize key resources that are likely to serve as constraints and tailored to regional resource features. The BSRNC region mainly experiences problems such as low-temperature cold hazards, drought-induced sandstorms, soil erosion, thinning soil layers, acidification, and reduced organic matter content [38]. Based on the dialectical balance between land-use limitations and suitability, we formulated an index system for land cultivability evaluation, where the model parameters were set according to pertinent national or industry standards and references (Table 2). Within the evaluation framework, soil texture functions as a discrete indicator, whereas pH is categorized as an intermediate indicator. To streamline data processing, pH was reclassified into a discrete indicator, and scores were assigned to discrete indicators to compute the cultivability index (Table 3).
4. Results
4.1. Evolution of Spatial Pattern of Cropland in the BSRNC from 1990 to 2020
4.1.1. Changes in Cropland Quantity
The cropland area statistics at various time points (Table 4) indicated a non-symmetrical pattern in the BSRNC, where the cropland area increased initially, before then decreasing and subsequently increasing again. In the last three decades, the overall cropland area in the BSRNC expanded from 446.62 × 10³ km2 in 1990 to 453.78 × 10³ km2 in 2020, with an average annual increase of 0.24 × 10³ km2, corresponding to a yearly growth rate of 0.05 %. In particular, the cropland area in the BSRNC declined between 2000 and 2010, but recovered from 2010 to 2020, although the growth rate was lower compared with that during 1990–2000.
Prior to 2000, China experienced considerable food supply pressure but the cropland reserves were ample in the BSRNC region due to extensive land reclamation [15]. After 2000, the Chinese agricultural sector shifted toward sustainable intensification, resulting in lower agricultural profits. Combined with substantial population outmigration from the northeastern region and the implementation of policies such as "ecological land retirement," this caused a decline in the cropland area [39,40]. Post-2010, previously untapped cropland reserves were reclaimed or repurposed due to the Chinese government's heightened focus on development in the northeastern region and the introduction of policies such as the "Northeast Revitalization Strategy" [41], as well as land reclamation initiatives and the promotion of conservation tillage technologies [42], thereby facilitating a recovery in the cropland area.
4.1.2. Spatial Changes in Cropland Pattern
From 1990 to 2020, the cropland gravity center in the BSRNC consistently remained within the Songnen Plain, with a general northeastward shift, reflecting notable changes in spatial cropland patterns (Figure 2). In 1990, the cropland gravity center was situated in Nong'an County, Changchun City, Jilin Province (124°48′58′′E, 44°30′9′′N). By 2020, the cropland gravity center had moved to Fuyu City, Songyuan City, Jilin Province (125°14′8′′E, 44°52′9′′N), with a total northeastward migration of 52.94 km, averaging 1.76 km annually. There were notable differences in the direction and speed of the cropland gravity center’s migration during different phases. During 1990–2000 and 2010–2020, the migration speeds of the gravity center were relatively high, averaging 3.11 km and 2.78 km per year, respectively, with a northeastward trend during both periods. By contrast, the cropland gravity center exhibited a modest northwestward shift during 2000–2010, with a migration distance of just 7.42 km.
To detect cropland change hotspots, we applied the Create Fishnet tool in ArcMap 10.3 to generate a 10 km × 10 km grid for the BSRNC, which was overlaid with cropland spatial data to calculate the change rate within each grid cell. The hotspot regions for cropland change are illustrated in Figure 3. From 1990 to 2020, the hotspot areas for cropland expansion in the BSRNC were mainly concentrated around the arc-shaped zones of the SNP, DXXAL, and CMEL, as well as the eastern SJP and central WS, covering regions such as Heihe, Hulunbuir, Jiamusi, Harbin, and Xing'an. Conversely, cropland contraction hotspots were found in the southern WS and southwestern SNP, mainly in regions such as Tongliao, Chifeng, and Daxing.
4.2. Cultivable land in the BSRNC
Using the comprehensive frequency distribution of cultivability scores, the frequency curve method was applied to classify land cultivability in the BSRNC according to four levels: uncultivable [0], marginally cultivable [0, 74.35], moderately cultivable [74.35, 84.15], and highly cultivable [84.15, 100]. The land cultivability classification results are presented in Figure 4. In terms of the spatial distribution, cultivable land was mainly located in a parallelogram-shaped region surrounded by the Greater Khingan, Lesser Khingan, and Changbai Mountains, as well as the Sanjiang Plain. The geomorphic structure was a key determinant of the spatial distribution pattern of cultivable land in the BSRNC. Highly cultivable land was primarily distributed in the central regions of the SNP, SJP, and LHP; moderately cultivable land in the border zone between the SNP and WS, western LHP, and the southern banks of the Heilong River; and marginally cultivable land in the south-central WS and southwestern LHP. In terms of quantity, the total area of cultivable land in the BSRNC was 694.06 × 10³ km2, accounting for 55.78% of the region's total area, where highly cultivable, moderately cultivable, and marginally cultivable land covered areas of 293.90 × 10³ km2, 300.80 × 10³ km2, and 99.36 × 10³ km2, respectively, accounting for 23.62%, 24.17%, and 7.99% of the region's total area.
The land cultivability varied significantly across different zones, and the factors that limited agricultural land use differed accordingly (Table 5). Based on their average cultivability scores, the zones were ranked as follows: SNP (83.06) > SJP (75.23) > LHP (58.24) > WS (43.29) > CMEL (36.97) > DXXAL (22.54). SNP had the highest land cultivability, with no apparent constraints on agricultural development and contiguous cropland. SJP has extensive bleached Beijiang soils, with a compact, grayish-white subsurface layer beneath the humus, where the relatively thin effective soil layers limit the agricultural potential [43]. LHP is located far from the core black soil region and natural conditions are unfavorable for the formation of fertile black soil, resulting in low organic matter contents. The WS, CMEL, and DXXAL zones were characterized by poor land cultivability, and they accounted for 91.52% of the uncultivable land in the BSRNC. WS is characterized by arid conditions, sparse rainfall, sandy soil textures in some areas, thin soil layers, and overall poor fertility. The CMEL features high altitudes, steep slopes, and is situated in a humid area with ample rainfall, leading to significant soil erosion, thin arable soil layers, frequent frost events, and pronounced cold damage. The DXXAL is located at a high latitude and has the lowest effective accumulated temperature among the six zones, with a high gravel content in the soil and relatively thin soil layers.
4.3. Changes in Cropland Suitability
The continuous evolution of cropland patterns indicated the imbalance in the dynamic changes in cropland resources in the BSRNC, which affected the natural cropland resource endowments. In general, the cropland suitability has improved slightly in the BSRNC (Figure 5), where the cultivability score increased from 78.50 in 1990 to 78.60 in 2020, with a rise of 0.13 %. However, the cropland suitability clearly declined after 2000. In the last three decades, the suitability indices for accumulated temperature and soil layer thickness have decreased continuously. The suitability index for accumulated temperature exhibited the largest decline, dropping from 88.44 in 1990 to 86.70 in 2020, with a decrease of 1.97 %. The soil layer thickness suitability index exhibited a minor reduction, decreasing by a total of 0.66 points. Conversely, the soil organic matter suitability index steadily increased from 61.51 in 1990 to 64.71 in 2020, with a gain of 3.20 points (5.20 %). The precipitation suitability index also increased slightly by 0.71 points overall. The suitability indices for slope, erosion risk, pH, and soil texture largely remained stable.
The cropland center of gravity in BSRNC has moved northeastward, suggesting cropland is gradually transitioning to colder and wetter regions, resulting in reduced thermal suitability but improved precipitation suitability. Prolonged intensive farming has led to the widespread thinning of soil layers in the BSRNC [5]. In terms of cropland pattern changes, expansion has primarily occurred in the SNP, DXXAL, and CMEL regions, characterized by thinner soil layers (Table 3), which has resulted in decreased suitability indices for soil thickness. BSRNC's black soil, known for its rich humus content, is a focus of attention and special conservation efforts. In the region's central and northern areas, prolonged cold winters restrict microbial activity, preventing the full decomposition of plant residues and resulting in the gradual accumulation of fertile black soil layers [44]. The northward shift in cropland dynamics indicates an ongoing expansion into areas with higher organic matter accumulation.
The changes in the cropland areas of different cultivation levels in the BSRNC varied over time. The areas of highly cultivable and uncultivable lands tended to increase, whereas the areas of moderately cultivable and marginally cultivable lands decreased (Figure 6a). In particular, uncultivable land expanded from 33.58 × 10³ km2 in 1990 to 35.19 × 10³ km2 in 2020, with an average annual increase of 1.61 × 10³ km2 and yearly growth rate of 0.24 %. Highly cultivable land expanded from 228.32 × 10³ km2 in 1990 to 239.61 × 10³ km2 in 2020, with an average annual growth of 0.56 × 10³ km2 and yearly increase of 0.25 %. Conversely, the moderately cultivable and marginally cultivable land areas shrank from 148.98 × 10³ km2 and 35.74 × 10³ km2 in 1990, respectively, to 145.75 × 10³ km2 and 33.11 × 10³ km2 in 2020, with annual reductions of 0.16 × 10³ km2 and 0.13 × 10³ km2, and decreases of 0.10 % and 0.37 % per year.
Analysis of the main factors related to the unsuitability of current cropland for cultivation (Figure 6b) showed that the key factors associated with some cropland becoming unsuitable for farming were soil erosion, active accumulated temperature, and soil texture. In particular, the area of non-arable land attributable to inadequate active accumulated temperature increased yearly from 5.63 × 10³ km2 in 1990 to 9.16 × 10³ km2 in 2020, with an average annual increase of 0.12 × 10³ km2 and yearly growth rate of 0.07 %. Conversely, the area of non-arable land attributable to poor soil texture and insufficient annual precipitation tended to decrease from 4.27 × 10³ km2 and 0.53 × 10³ km2 in 1990, respectively, to 2.51 × 10³ km2 and 0.35 × 10³ km2 in 2020, with annual reductions of 0.06 × 10³ km2 and 0.006 × 10³ km2, and annual declines of 1.37 % and 1.13 %. It should be noted that soil pH was not a major limiting factor for cropland use at any time point, possibly due to the scale of this study. Previous studies of soil acidification in the BSRNC mostly focused on the plot scale [45], and localized small-scale changes may be partially masked at larger scales.
5. Discussion
5.1. Assessment of the land cultivability model
Land evaluation is a vital tool in land management and its accuracy significantly affects farmland management practices and the formulation of land policies. The relationships between actual crop yields and simulated suitability scores are often employed to verify the accuracy of land suitability assessments. In general, when the linear correlation coefficient between the two parameters exceeds 0.6, the simulation results are considered to be highly accurate [46,47]. Due to the lack of grid-level grain yield data, the validation scale in this study was expanded to the city level. The China Agricultural Statistical Yearbook (2010–2020) was utilized to collect grain yield data for 40 municipal administrative units in the BSRNC. Correlation analysis was conducted between the average grain yields over multiple years and the land cultivability scores for these cities (Figure 7). Good correlations were found between the actual crop yields and land cultivability scores (correlation coefficient = 0.659 > 0.6), thereby demonstrating that the BSRNC land cultivability model is both applicable and reliable for evaluations.
Some specific aspects of the land cultivability evaluation method based on the niche model require further elaboration. First, arable systems are among the most complex human–land systems. The present study focused on evaluating the support of natural land attributes for cultivation, with a limited focus on human agency. However, from an input–output perspective, when a natural factor does not support or limits agricultural production, more labor and capital inputs are inevitably required, and thus operating costs exceed benefits, thereby rendering the land unsuitable or less suitable for cultivation [48]. In addition, our evaluation method is based on current scientific theories and technological advancements, incorporating relevant national or industry standards and extensive previous research to determine thresholds for limiting factors, with the lowest cultivability level defined as "uncultivable." In practice, this land should be regarded as "temporarily unsuitable for cultivation." As technology advances and society progresses, land that is currently deemed unsuitable for cultivation may eventually become a valuable resource.
5.2. Suggestions for Protecting Cropland in the BSRNC
During the rapid urbanization process in China, the cropland protection policy based on the cropland occupation and replenishment balance has served as a crucial regulator of land use/land cover changes [49,50]. This policy is governed by the principle that approved non-agricultural projects occupying cropland must compensate with cropland of equivalent quantity and quality to ensure the total balance. Over the last three decades, the BSRNC has achieved a near-dynamic equilibrium in cropland quantity and quality under the guidance of this policy (refer to Table 5; Figure 5a and Figure 6a). However, by 2020, considering approved construction and ecological land, 65.38% of the cultivable land in the region had already been converted into cropland. According to the Ministry of Natural Resources' notice on the national reserve cropland survey, we used the 2020 land cover map, excluding construction land, rivers, and other current land-use types, to assess the stock of crop land reserves in the BSRNC (Figure 8). Our findings indicated that 90.19 % of the cultivable land reserves consisted of forest land, medium to high coverage grassland, and wetlands, and 86.59 % of the highly cultivable land was also categorized under these ecological land types. Converting this ecologically functional land into cropland [51] could substantially threaten the region's ecological environment. In summary, the development of cropland in the BSRNC has reached its limits.
This paper proposes the following recommendations for farmland protection in BSRNC, considering changes in its spatial pattern and suitability. (i) Prevent further large-scale cropland expansion and expand cropland protection to cover all cultivable lands. For decades, BSRNC has been one of the few regions in China to witness significant growth in cropland area, greatly contributing to national food security and social stability. The migration of the farmland center in this region has resulted in a marked decrease in natural suitability, emphasizing the need to curb excessive reclamation. Furthermore, farmland protection fundamentally aims at safeguarding land productivity; unexploited cultivable lands should be equally protected as existing farmland through spatial planning. Urban expansion should prioritize less cultivable or marginal lands to achieve a balance between farmland development and urbanization. (ii) Adopt tailored farmland protection policies to improve suitability effectively. Farmland with high cultivability and superior resource conditions should receive priority protection, strictly preventing its non-grain or non-agricultural use. Farmland with moderate cultivability, while facing minor constraints, should be prioritized for development, focusing on projects like land leveling, organic matter improvement, and agricultural infrastructure. Farmland with marginal cultivability, constrained by significant limitations and low productivity, should be used cautiously with controlled intensity and appropriate utilization methods to ensure its protection. Land that is unsuitable for farming has significant limitations and high transformation costs, and improper utilization may lead to ecological problems. Such lands should be transitioned out of cultivation following the principle of "forest where suitable, grass where appropriate, and wetland where necessary."
5.3. Uncertainty analysis
The present study did not consider the last 30 years of climate change in the BSRNC, and thus further investigation is required into the interplay between cropland spatial pattern shifts and climatic influences on cultivability. In our evaluation of cultivable land, we only selected the annual average precipitation as an evaluation indicator. Incorporating surface and groundwater distributions in future studies would enhance the scientific validity and rigor of the results. In addition, the drainage capacity, a common land quality evaluation indicator, was not included in this study, mainly due to data limitations and the focus of the evaluation objectives. Land cultivability evaluations aim to identify land areas that are suitable for agricultural activities, including rain-fed and irrigated agriculture, but some areas with poor drainage capacities may still be suitable for paddy field cultivation [24]. Therefore, there is the possibility of further development in suitability evaluations for different agricultural uses or crop types.
6. Conclusions
In this study, we quantitatively assessed the dynamic changes in cropland suitability using the niche model based on the evolution of cropland spatial patterns in the BSRNC over the past 30 years. Our main conclusions are summarized as follows. (1) Over the past 30 years, the cropland area has generally increased in the BSRNC, where the center has shifted toward the northeast, indicating the gradual expansion of cropland use into cold and humid regions. (2) We developed a land cultivability evaluation model that is suitable for the BSRNC. The region has abundant cultivable land resources, where highly cultivable land is concentrated in flat areas, such as the Songnen Plain and Sanjiang Plain, and medium and low-grade cultivable land is found in arid regions with thinner soil layers. (3) Under changes in the cropland spatial patterns, the overall suitability of cropland improved slightly in the BSRNC, but declines in suitability occurred in some areas due to limiting factors such as the temperature and soil thickness, especially in expansion areas. Moreover, the increased soil organic matter contents and improved suitability of precipitation partially mitigated some adverse factors. The findings obtained in this study provide scientific support to facilitate the enhancement of farmland management efficiency and refinement of land-use policy frameworks.
Author Contributions
Conceptualization, K.W; methodology, L.K.; software, L.K.; validation, L.K.; formal analysis, L.K.; investigation, L.K.; resources, K.W.; data curation, L.K.; writing—original draft preparation, L.K.; writing—review and editing, K.W.; visualization, L.K.; supervision, K.W.; project administration, K.W.; funding acquisition, K.W. All authors have read and agreed to the published version of the manuscript.
Funding
This work was supported by the National Key Technology R&D Program of the Ministry of Science and Technology of China (Grant No. 2023YFD1500104), the National Natural Science Foundation of China (Grant No. 42430705), and 2023 Graduate Innovation Fund Project of the China University of Geosciences, Beijing (Grant No. ZD2024YC020).
Data Availability Statement
The datasets used and/or analyzed during the current study are available from the corresponding author on reasonable request.
Conflicts of Interest
The authors declare no conflict of interest.
References
- FAO, IFAD, UNICEF, WFP, WHO, 2020. In Brief to the State of Food Security and Nutrition in the World 2020. Rome, Italy.
- Ju, H.; Zhang, H.; Yan, Y. Spatial pattern changes of urban expansion and multi-dimensional analysis of driving forces in the Guangdong-Hong Kong-Macao Greater Bay Area in 1980-2020. Acta Geographica Sinica, 2022, 77, 1086–1101. [Google Scholar]
- Zhang, K.; Yu, Z.; Li, X.; Zhou, W.; Zhang, D. Land use change and land degradation in china from 1991 to 2001. Land Degradation & Development, 2007, 18, 209–219. [Google Scholar]
- Song, G.; Zhang, H. Cultivated land use layout adjustment based on crop planting suitability: a case study of typical counties in northeast china. Land, 2021, 10, 107. [Google Scholar] [CrossRef]
- Wang, Y.; Jiang, Y.; Zhu, G. Spatio-temporal evaluation of multi-scales cultivated land system resilience in black soil region from 2000 to 2019: a case study of liaoning province, northeast china. Chinese Geographical Science 2023. [Google Scholar] [CrossRef]
- Zhang, T.; Zhang, F.; Huang, J.; Li, C.; Zhang, B. Spatial pattern evolution of abandoned arable land and its influencing factor in industrialized region. Transactions of the Chinese Society of Agricultural Engineering, 2019, 35, 246–255. [Google Scholar]
- Ye, S.; Song, C.; Shen, S.; Gao, P.; Cheng, C.; Cheng, F.; Wan, C.; Zhu, D. Spatial pattern of arable land-use intensity in china. Land Use Policy, 2020, 99, 104845. [Google Scholar] [CrossRef]
- Dong, X.; Liu, M. Relationships among LUCC, ecosystem services and human well-being. Journal of Beijing Normal University(Natural Science), 2022, 58, 465–475. [Google Scholar]
- Chen, J.; Liu, M.; Chen, X.; Li, Z. Spatio-temporal evolution, driving mechanisms, and simulation of land use and cover in china from 2000 to 2060. Applied Spatial Analysis and Policy, 2024, 17, 1631–1652. [Google Scholar] [CrossRef]
- Yang, Y.; Ma, E.; Liao, L.; Wu, M. Land use change in a typical transect in northern china and its impact on the ecological environment. Sustainability, 2024, 16, 9291. [Google Scholar] [CrossRef]
- Shi, R.; Yang, X. Research on the climate background in arable land changed areas of China. Journal of Geo-information Science, 2010, 12, 309–314. [Google Scholar] [CrossRef]
- Huang, H.; Wen, L.; Kong, X.; Chen, W.; Sun, X. The Impact of Spatial Pattern Evolution of Cultivated Land on Cultivated Land Suitability in China and Its Policy Implication. China Land Science 2021, 35, 61–70. [Google Scholar]
- Li, X.; Wu, K.; Hao, S.; Zhang, Y.; Zhao, R.; Ma, J. Mapping cropland suitability in china using optimized maxent model. Field Crops Research, 2023, 302, 109064. [Google Scholar] [CrossRef]
- Zhou, Y. Cultivated land loss and construction land expansion in china: evidence from national land surveys in 1996, 2009 and 2019. Land Use Policy, 2023, 125, 106496. [Google Scholar] [CrossRef]
- Zhang, R.; Du, G.; Zhang, S. Spatiotemporal changes and the driving factors of cultivated land resources of the typical black soil region in Northeast China from 1986 to 2020. Resources Science, 2023, 45, 939–950. [Google Scholar] [CrossRef]
- Akpoti, K.; Kabo-Bah, A.T.; Zwart, S.J. Review - agricultural land suitability analysis: state-of-the-art and outlooks for integration of climate change analysis. Agricultural Systems, 2019, 173, 172–208. [Google Scholar] [CrossRef]
- Steiner, F.; Dunford, R.; Dosdall, N. The use of the agricultural land evaluation and site assessment system in the united states. Landscape and Urban Planning, 1987, 14, 183–199. [Google Scholar] [CrossRef]
- FAO A Framework for Land Evaluation; Food and Agriculture Organization of the United Nations: Rome, Italy, 1976.
- Shi, Y. Land resource classification system of the three 1:1,000,000 land resource maps in Northeast China. Natural Resources 1979, 1979, 77–90. [Google Scholar]
- Yao, M.; Shao, D.; Lv, C.; An, R.; Gu, W.; Zhou, C. Evaluation of arable land suitability based on the suitability function - a case study of the qinghai-tibet plateau. Science of The Total Environment, 2021, 787, 147414. [Google Scholar] [CrossRef]
- Zhang, G.; Wu, Y.; Zhao, Y. Physical suitability evaluation of reserve resources of cultivated land in China based on SOTER. Transactions of the Chinese Society of Agricultural Engineering, 2010, 26, 1–8. [Google Scholar]
- Zhang, Q.; Li, B.; Zhang, Y.; Wang, S. Suitability evaluation of crop variety via graph neural network. Computational Intelligence and Neuroscience, 2022, 2022, 5614974. [Google Scholar] [CrossRef]
- Agrawal, N.; Govil, H.; Kumar, T. Agricultural land suitability classification and crop suggestion using machine learning and spatial multicriteria decision analysis in semi-arid ecosystem. Environment, Development and Sustainability 2024. [Google Scholar] [CrossRef]
- Qian, J.; Zhao, H.; Wang, X.; Wang, T.; Feng, Z.; Cao, C.; Li, X.; Zhang, A. Declining suitability for conversion of drylands to paddy fields in northeast china: impact of future climate and socio-economic changes. Geography and Sustainability 2024. [Google Scholar] [CrossRef]
- Sadeghfam, S.; Rahmani, M.S.; Moazamnia, M. Mapping climate suitability index for rainfed cultivation of medicinal plants by developing an ai-based probabilistic framework. Scientific Reports, 2024, 14, 20413. [Google Scholar] [CrossRef]
- Shevchenko, V.; Lukashevich, A.; Taniushkina, D.; Bulkin, A.; Grinis, R.; Kovalev, K. Climate change impact on agricultural land suitability: an interpretable machine learning-based eurasia case study. IEEE Access, 2024, 12, 15748–15763. [Google Scholar] [CrossRef]
- Wang, Y.C.; Lu, Y.H.; Chiang, L.C.; Hsu, C.C. Assessing crop suitability of rice, wheat, and maize on agricultural lands in taiwan. Natural Resources Research, 2023, 32, 813–834. [Google Scholar] [CrossRef]
- Yates, K.L.; Bouchet, P.J.; Caley, M.J.; et al. Outstanding challenges in the transferability of ecological models. Trends in Ecology & Evolution, 2018, 33, 790–802. [Google Scholar]
- Ouyang, Z.Y.; Wang, R.; Fu, G. Ecological niche suitability model and itsapplication in land suitability assessment. Acta Ecologica Sinica 1996, 1996, 113–120. [Google Scholar]
- Chen, H.; Yang, R.; Ye, Y. Cultivability evaluation and conservation strategies of land resources in China. Transactions of the Chinese Society of Agricultural Engineering 2023, 39, 192–200. [Google Scholar]
- Zhao, S.; Niu, H.; Zhang, H.; Zhang, X. Construction and application of obstacle diagnosis model based on ecological niche on well- facilitied farmland. Transactions of the Chinese Society for Agricultural Machinery, 2018, 49, 194–202. [Google Scholar]
- Zhao, S.; Niu, H.; Zhang, H.; Zhang, H.; Zhang, X. Suitability evaluation on high quality capital farmland consolidation based on niche-fitness model. Transactions of the Chinese Society of Agricultural Engineering, 2016, 32, 220–228. [Google Scholar]
- Sun, H.; Yang, Z.; Li, X.; Hang, Y.; Gao, M.; Yang, Y.; Meng, X.; Zhu, L. Assessment of the cultivated land quality in the black soil region of northeast china based on the field scale. Environmental Monitoring and Assessment, 2023, 195, 1508. [Google Scholar] [CrossRef] [PubMed]
- Qijun Yang, Ute Wollschläger, Hans-Jörg Vogel, Zhe Feng, Kening Wu. Assessing soil biodiversity potentials in china: a multi-attribute decision approach. Agronomy, 2023, 13, 2822. [Google Scholar] [CrossRef]
- Li, J.; He, H.; Zeng, Q.; Chen, L.; Sun, R. A chinese soil conservation dataset preventing soil water erosion from 1992 to 2019. Scientific Data, 2023, 10, 319. [Google Scholar] [CrossRef]
- Lu, D.; Wang, Z.; Su, K.; Zhou, Y.; Li, X.; Lin, A. Understanding the impact of cultivated land-use changes on china’s grain production potential and policy implications: a perspective of non-agriculturalization, non-grainization, and marginalization. Journal of Cleaner Production, 2024, 436, 140647. [Google Scholar] [CrossRef]
- Qiao, H.; Peterson, A.T.; Myers, C.E.; Yang, Q.; Saupe, E.E. Ecological niche conservatism spurs diversification in response to climate change. Nature Ecology & Evolution, 2024, 8, 729–738. [Google Scholar]
- Xu, Y.; Pei, J.; Li, S.; Zhou, H.; Wang, J.; Zhang, J. Main Characteristics and Utilization Countermeasures for Black Soils in Different Regions of Northeast China. Chinese Journal of Soil Science, 2023, 54, 495–504. [Google Scholar]
- Jia, G.; Hu, W.; Zhang, B.; Li, G.; Shen, S.; Gao, Z.; Li, Y. Assessing impacts of the ecological retreat project on water conservation in the yellow river basin. Science of The Total Environment, 2022, 828, 154483. [Google Scholar] [CrossRef]
- Qi, W.; Liu, S.; Jin, F. Calculation and Spatial Evolution of Population Loss in Northeast China. Scientia Geographica Sinica, 2017, 37, 1795–1804. [Google Scholar]
- Li, Z.; Lv, X.; Yang, Y.; Chen, X.; Niu, S. Evolution Process and Characteristics of Protection Policy for Black Soils in China. Chinese Journal of Soil Science, 2022, 53, 998–1008. [Google Scholar]
- He, C.; Niu, J.R.; Xu, C.T.; Han, S.W.; Bai, W.; Song, Q.L.; Dang, Y.P.; Zhang, H.L. Effect of conservation tillage on crop yield and soil organic carbon in northeast china: a meta-analysis. Soil Use and Management, 2022, 38, 1146–1161. [Google Scholar] [CrossRef]
- Dong, F.; Zhang, Z.; Jiang, F.; Wang, J.; Wang, Q.; Li, L.; Peng, X. Spatial distribution of the buried depth and thickness of albic soil albic layer in sanjiang plain and its influencing factors. Acta Pedologica Sinica 2024, 2024, 1–15. [Google Scholar]
- Liu, B.; Zhang, G.; Xie, Y.; Shen, B.; Gu, Z.; Ding, Y. Delineating the black soil region and typical black soil region of northeastern China. Chin Sci Bull, 2021, 66, 96–106. [Google Scholar] [CrossRef]
- Xu, Z.; Zhang, T.; Wang, S.; Wang, Z. Soil ph and c/n ratio determines spatial variations in soil microbial communities and enzymatic activities of the agricultural ecosystems in northeast china: jilin province case. Applied Soil Ecology, 2020, 155, 103629. [Google Scholar] [CrossRef]
- Bagherzadeh, A.; Gholizadeh, A. Modeling land suitability evaluation for wheat production by parametric and topsis approaches using gis, northeast of iran. Modeling Earth Systems and Environment, 2016, 2, 126. [Google Scholar] [CrossRef]
- Motuma, M.; Suryabhagavan, K.V.; Balakrishnan, M. Land suitability analysis for wheat and sorghum crops in wogdie district, south wollo, ethiopia, using geospatial tools. Applied Geomatics, 2016, 8, 57–66. [Google Scholar] [CrossRef]
- Mugiyo, H.; Chimonyo VG, P.; Sibanda, M.; Kunz, R.; Masemola, C.R.; Modi, A.T.; Mabhaudhi, T. Evaluation of land suitability methods with reference to neglected and underutilised crop species: a scoping review. Land, 2021, 10, 125. [Google Scholar] [CrossRef]
- Chen, W.; Ye, X.; Li, J.; Fan, X.; Liu, Q.; Dong, W. Analyzing requisition–compensation balance of farmland policy in china through telecoupling: a case study in the middle reaches of yangtze river urban agglomerations. Land Use Policy, 2019, 83, 134–146. [Google Scholar] [CrossRef]
- Liu, C.; Song, C.; Ye, S.; Cheng, F.; Zhang, L.; Li, C. Estimate provincial-level effectiveness of the arable land requisition-compensation balance policy in mainland china in the last 20 years. Land Use Policy, 2023, 131, 106733. [Google Scholar] [CrossRef]
- Bi, W.; Dang, X.; Ma, H.; Deng, M.; Li, P.; Cao, X.; Shi, P. Evaluation of arable land suitability and potential from the perspective of “Food Crop Production Strategy based on Farmland Management” in northwest China. Transactions of the Chinese Society of Agricultural Engineering, 2021, 37, 235–243. [Google Scholar]
Figure 1.
Location (a), administrative subdivisions (b), and soil types (c) in the black soil region of Northeast China (BSRNC).
Figure 1.
Location (a), administrative subdivisions (b), and soil types (c) in the black soil region of Northeast China (BSRNC).
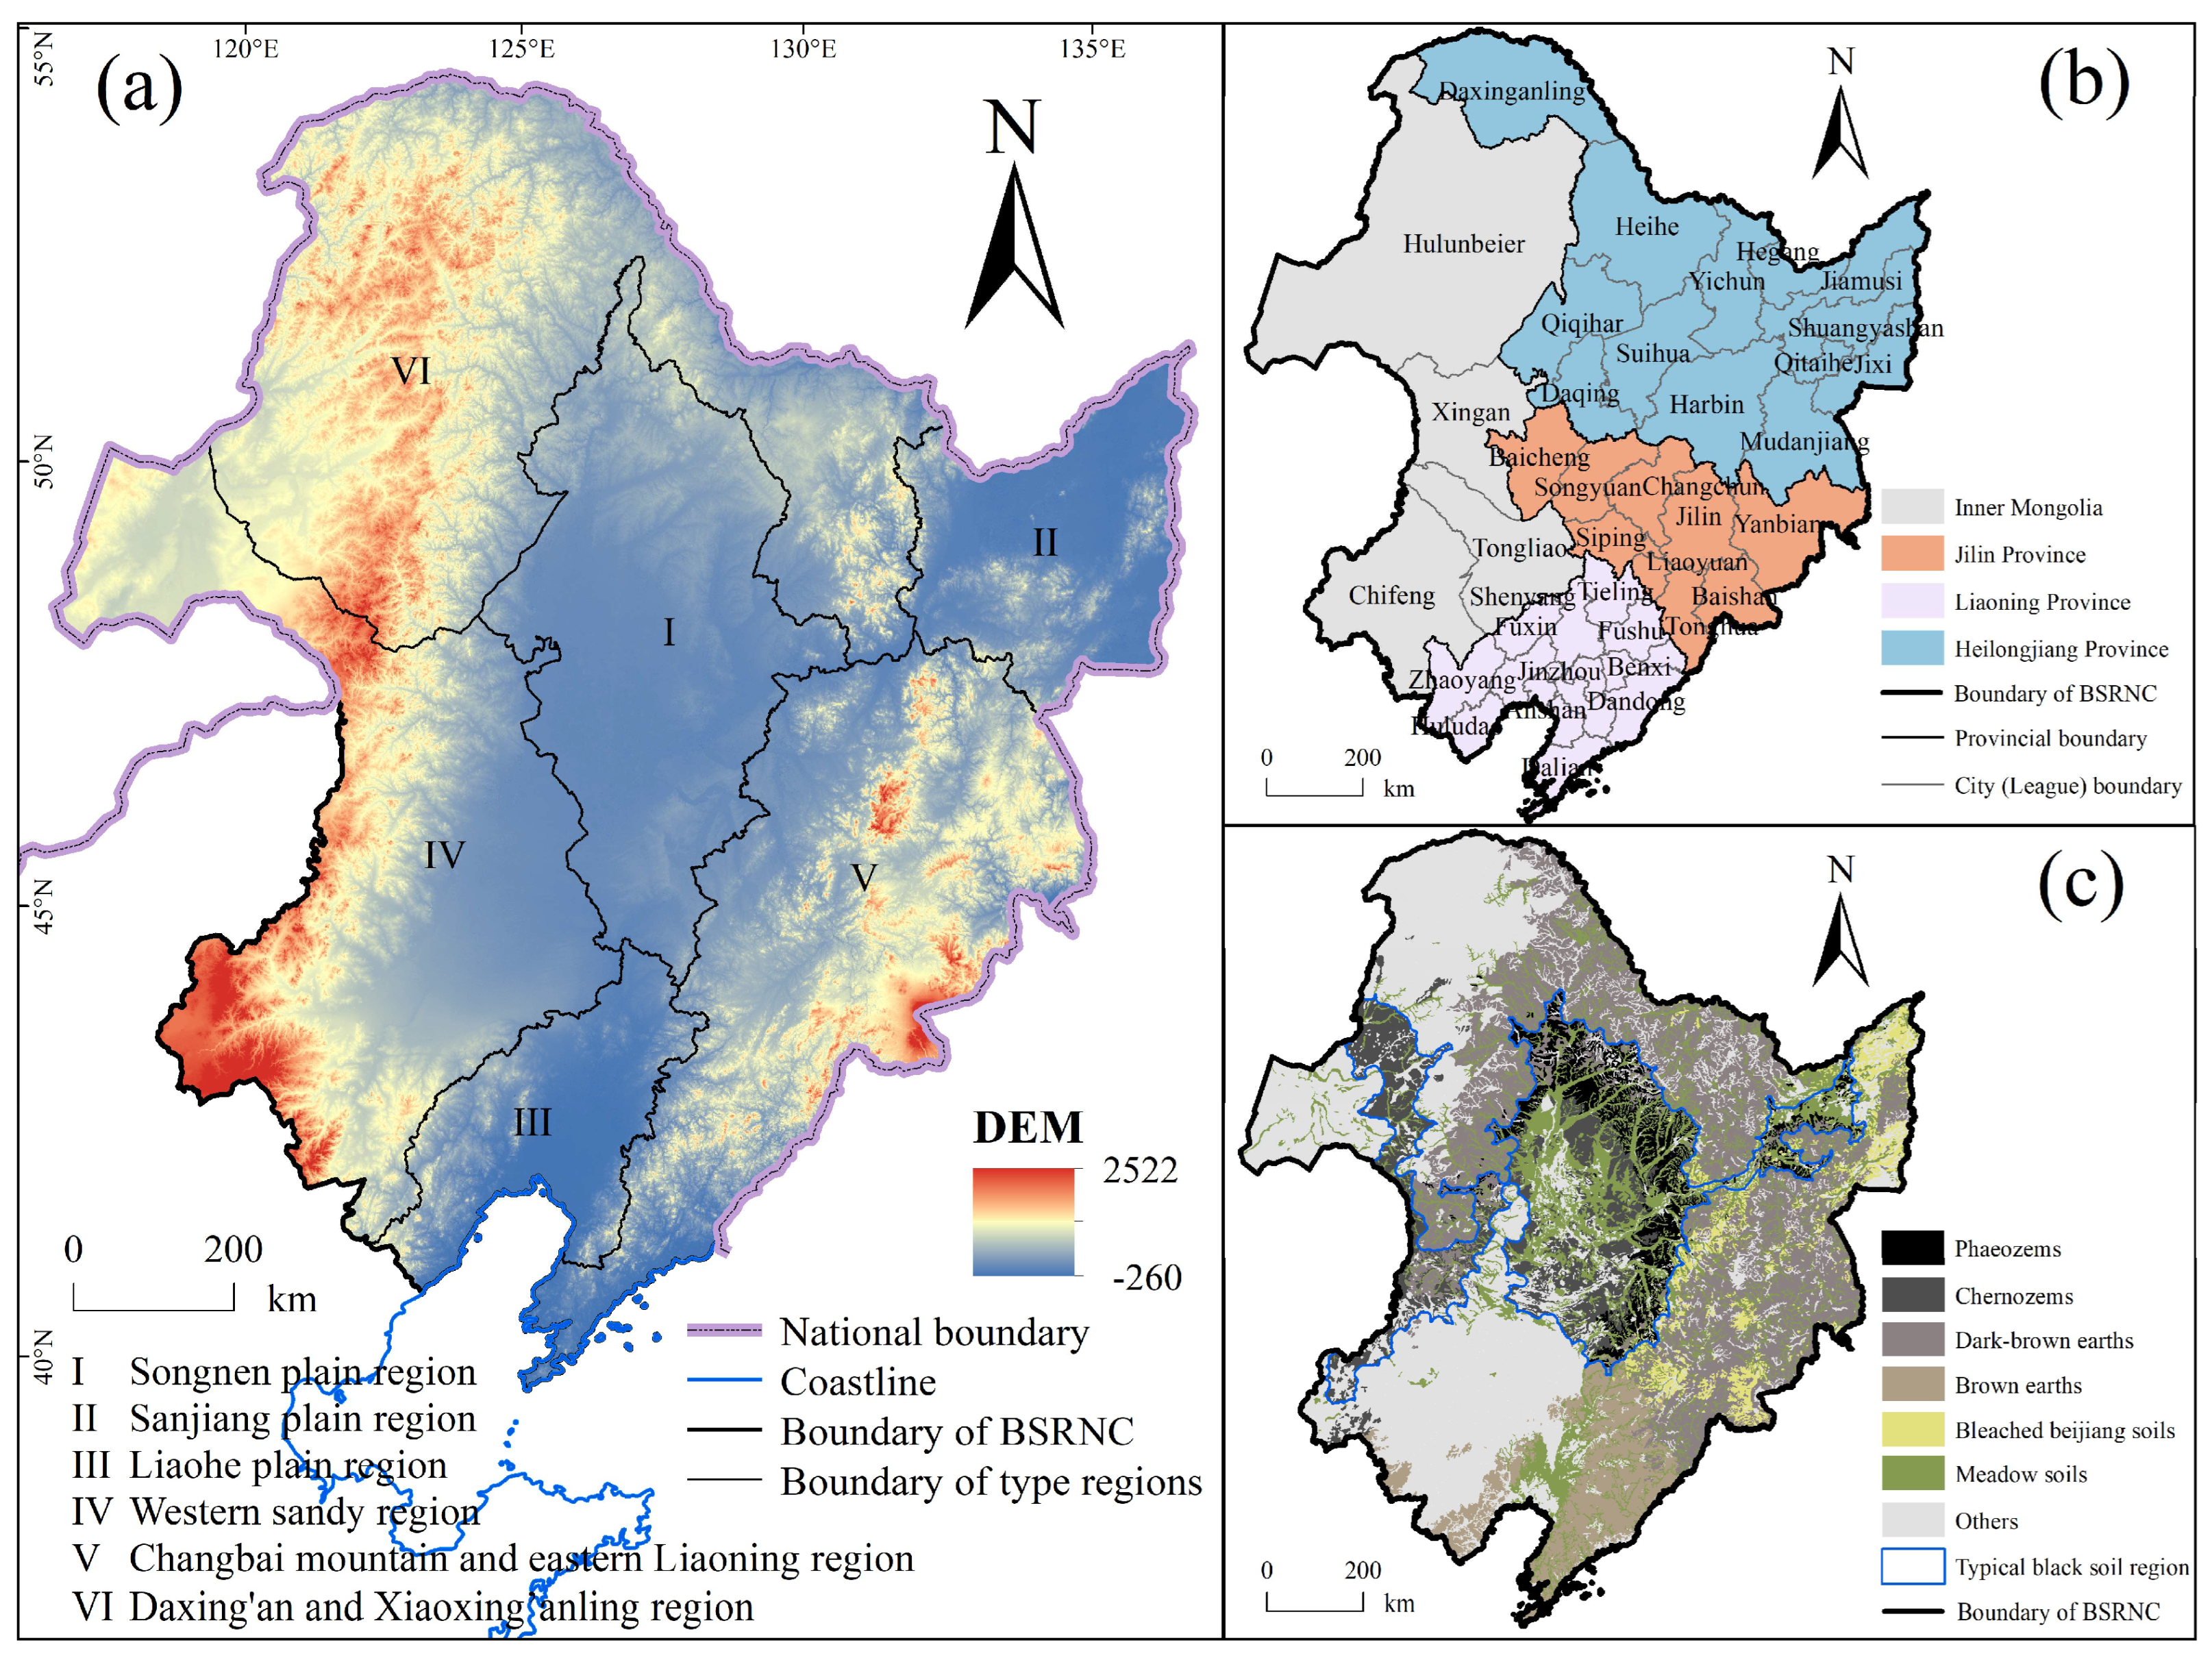
Figure 2.
Spatial changes in cropland gravity center.
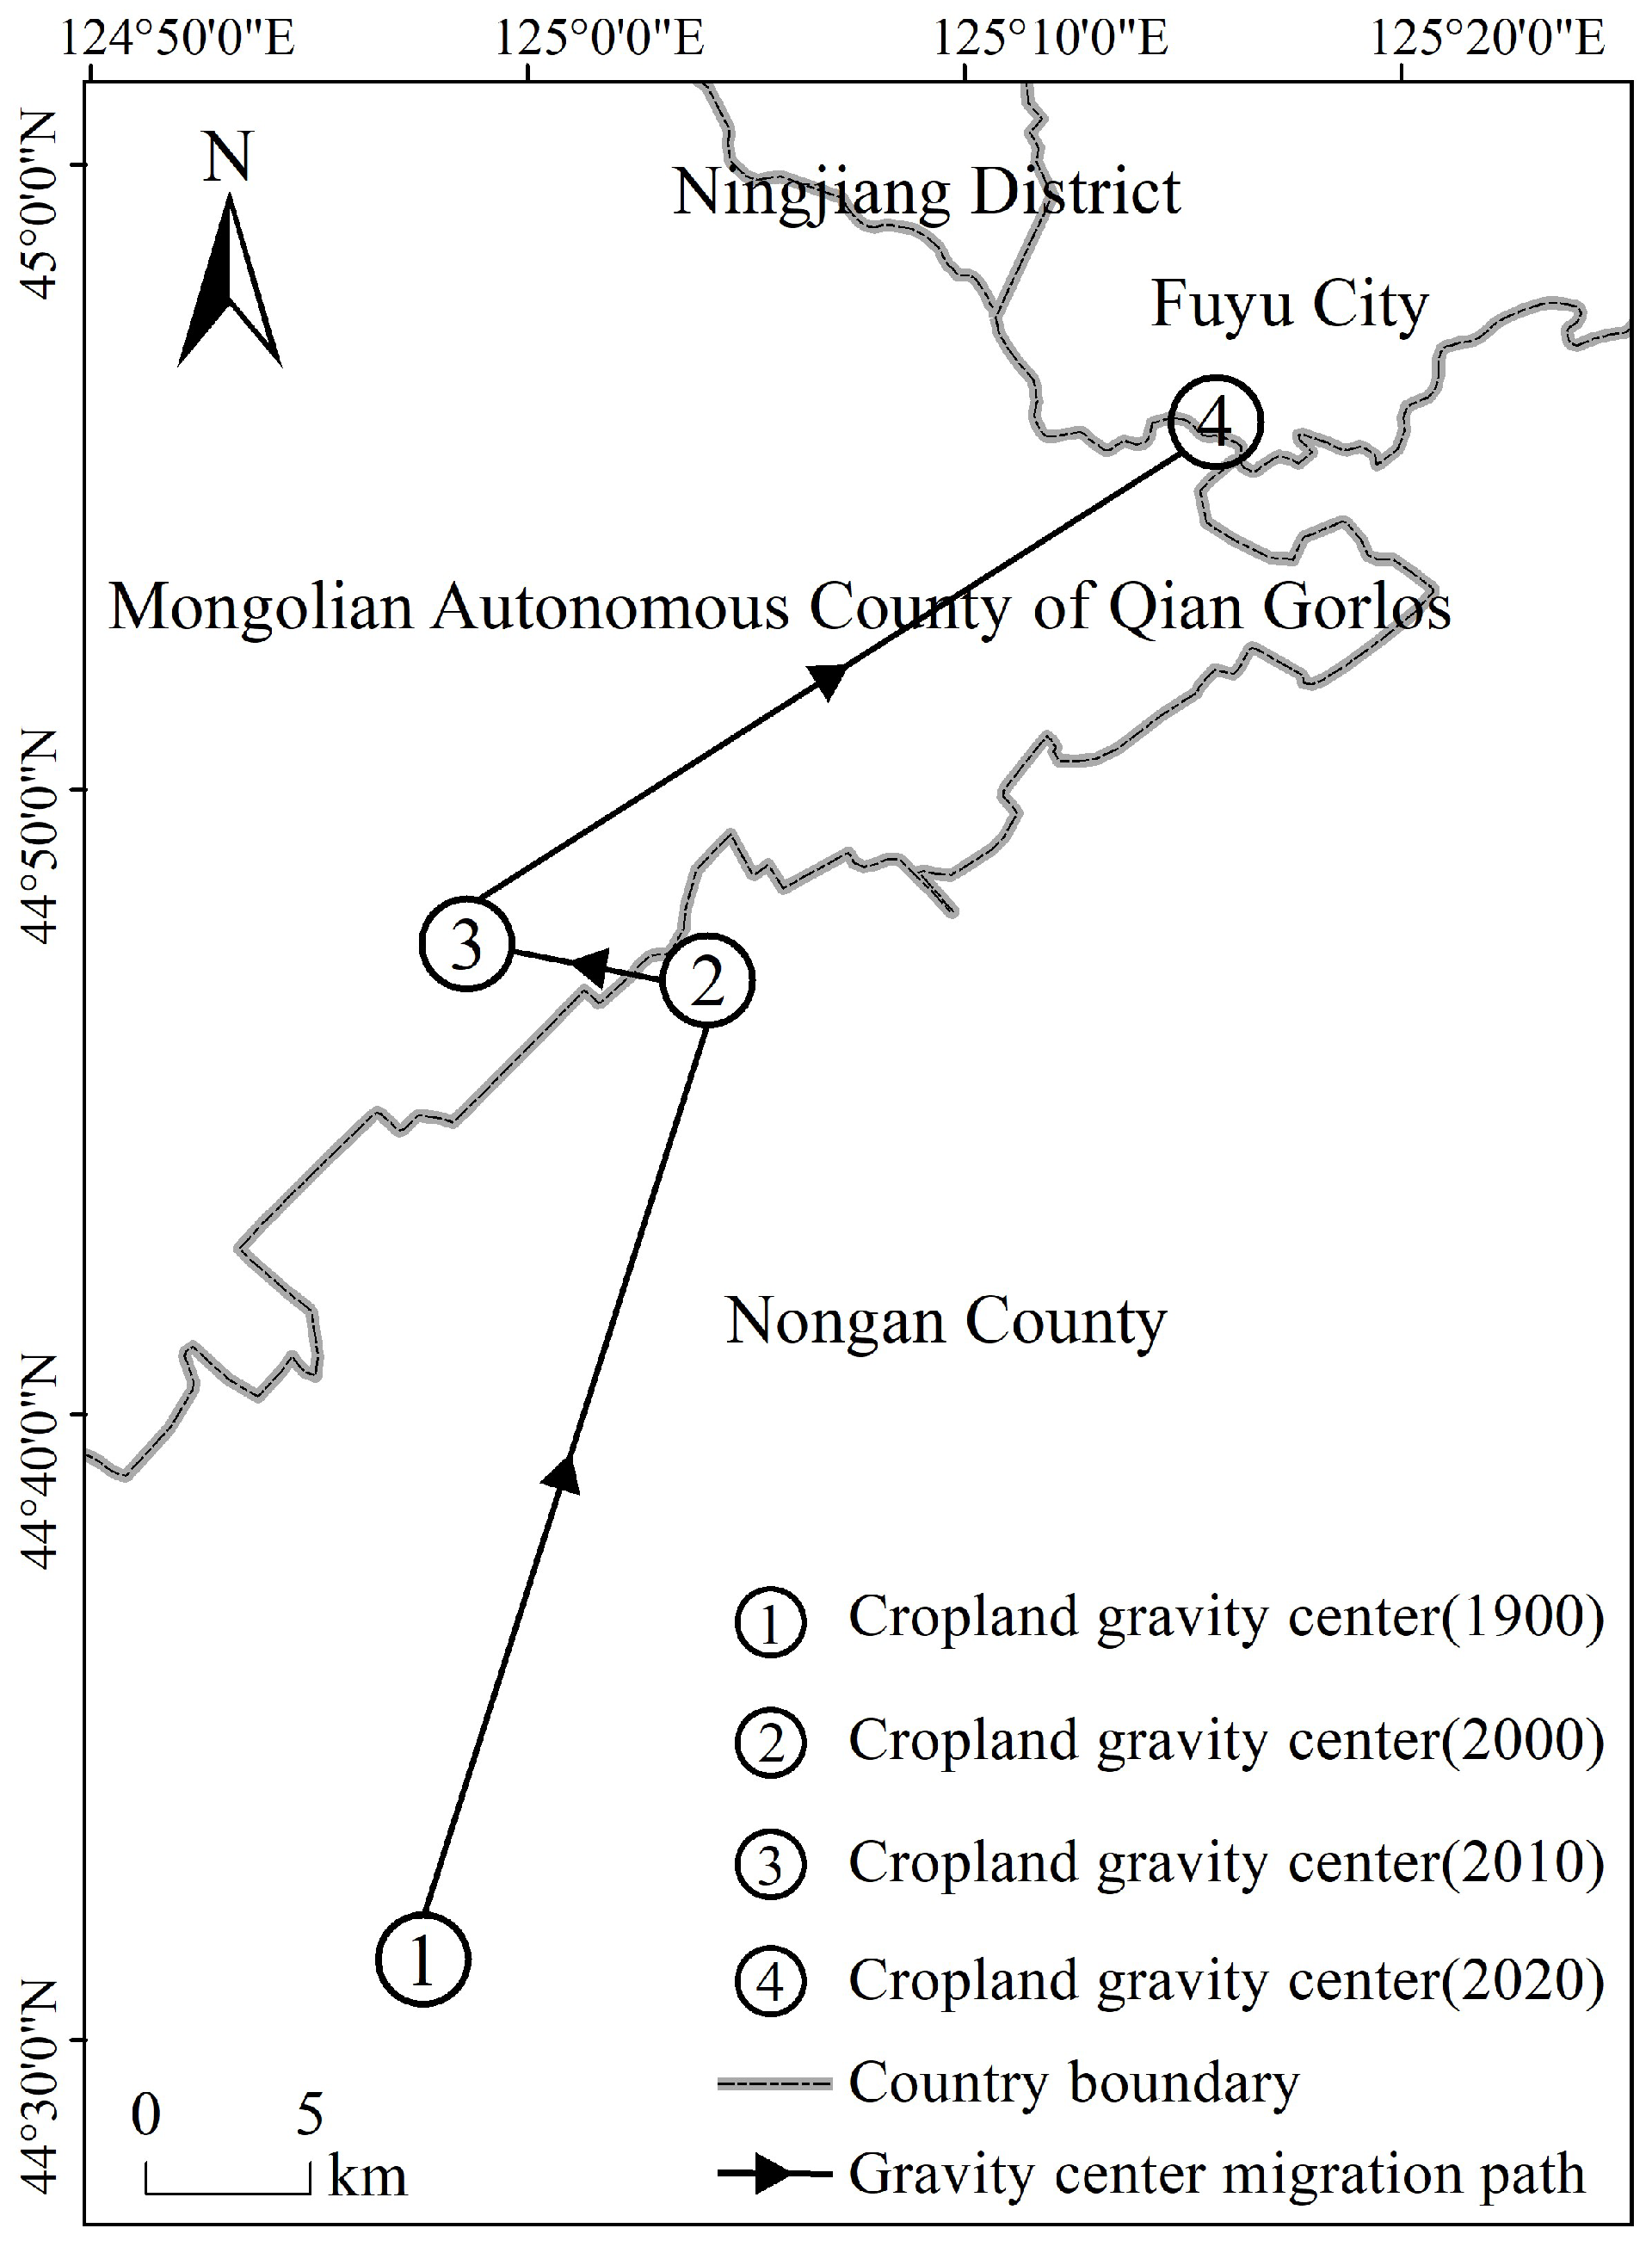
Figure 3.
Hotspots for cropland change from 1990 to 2020.
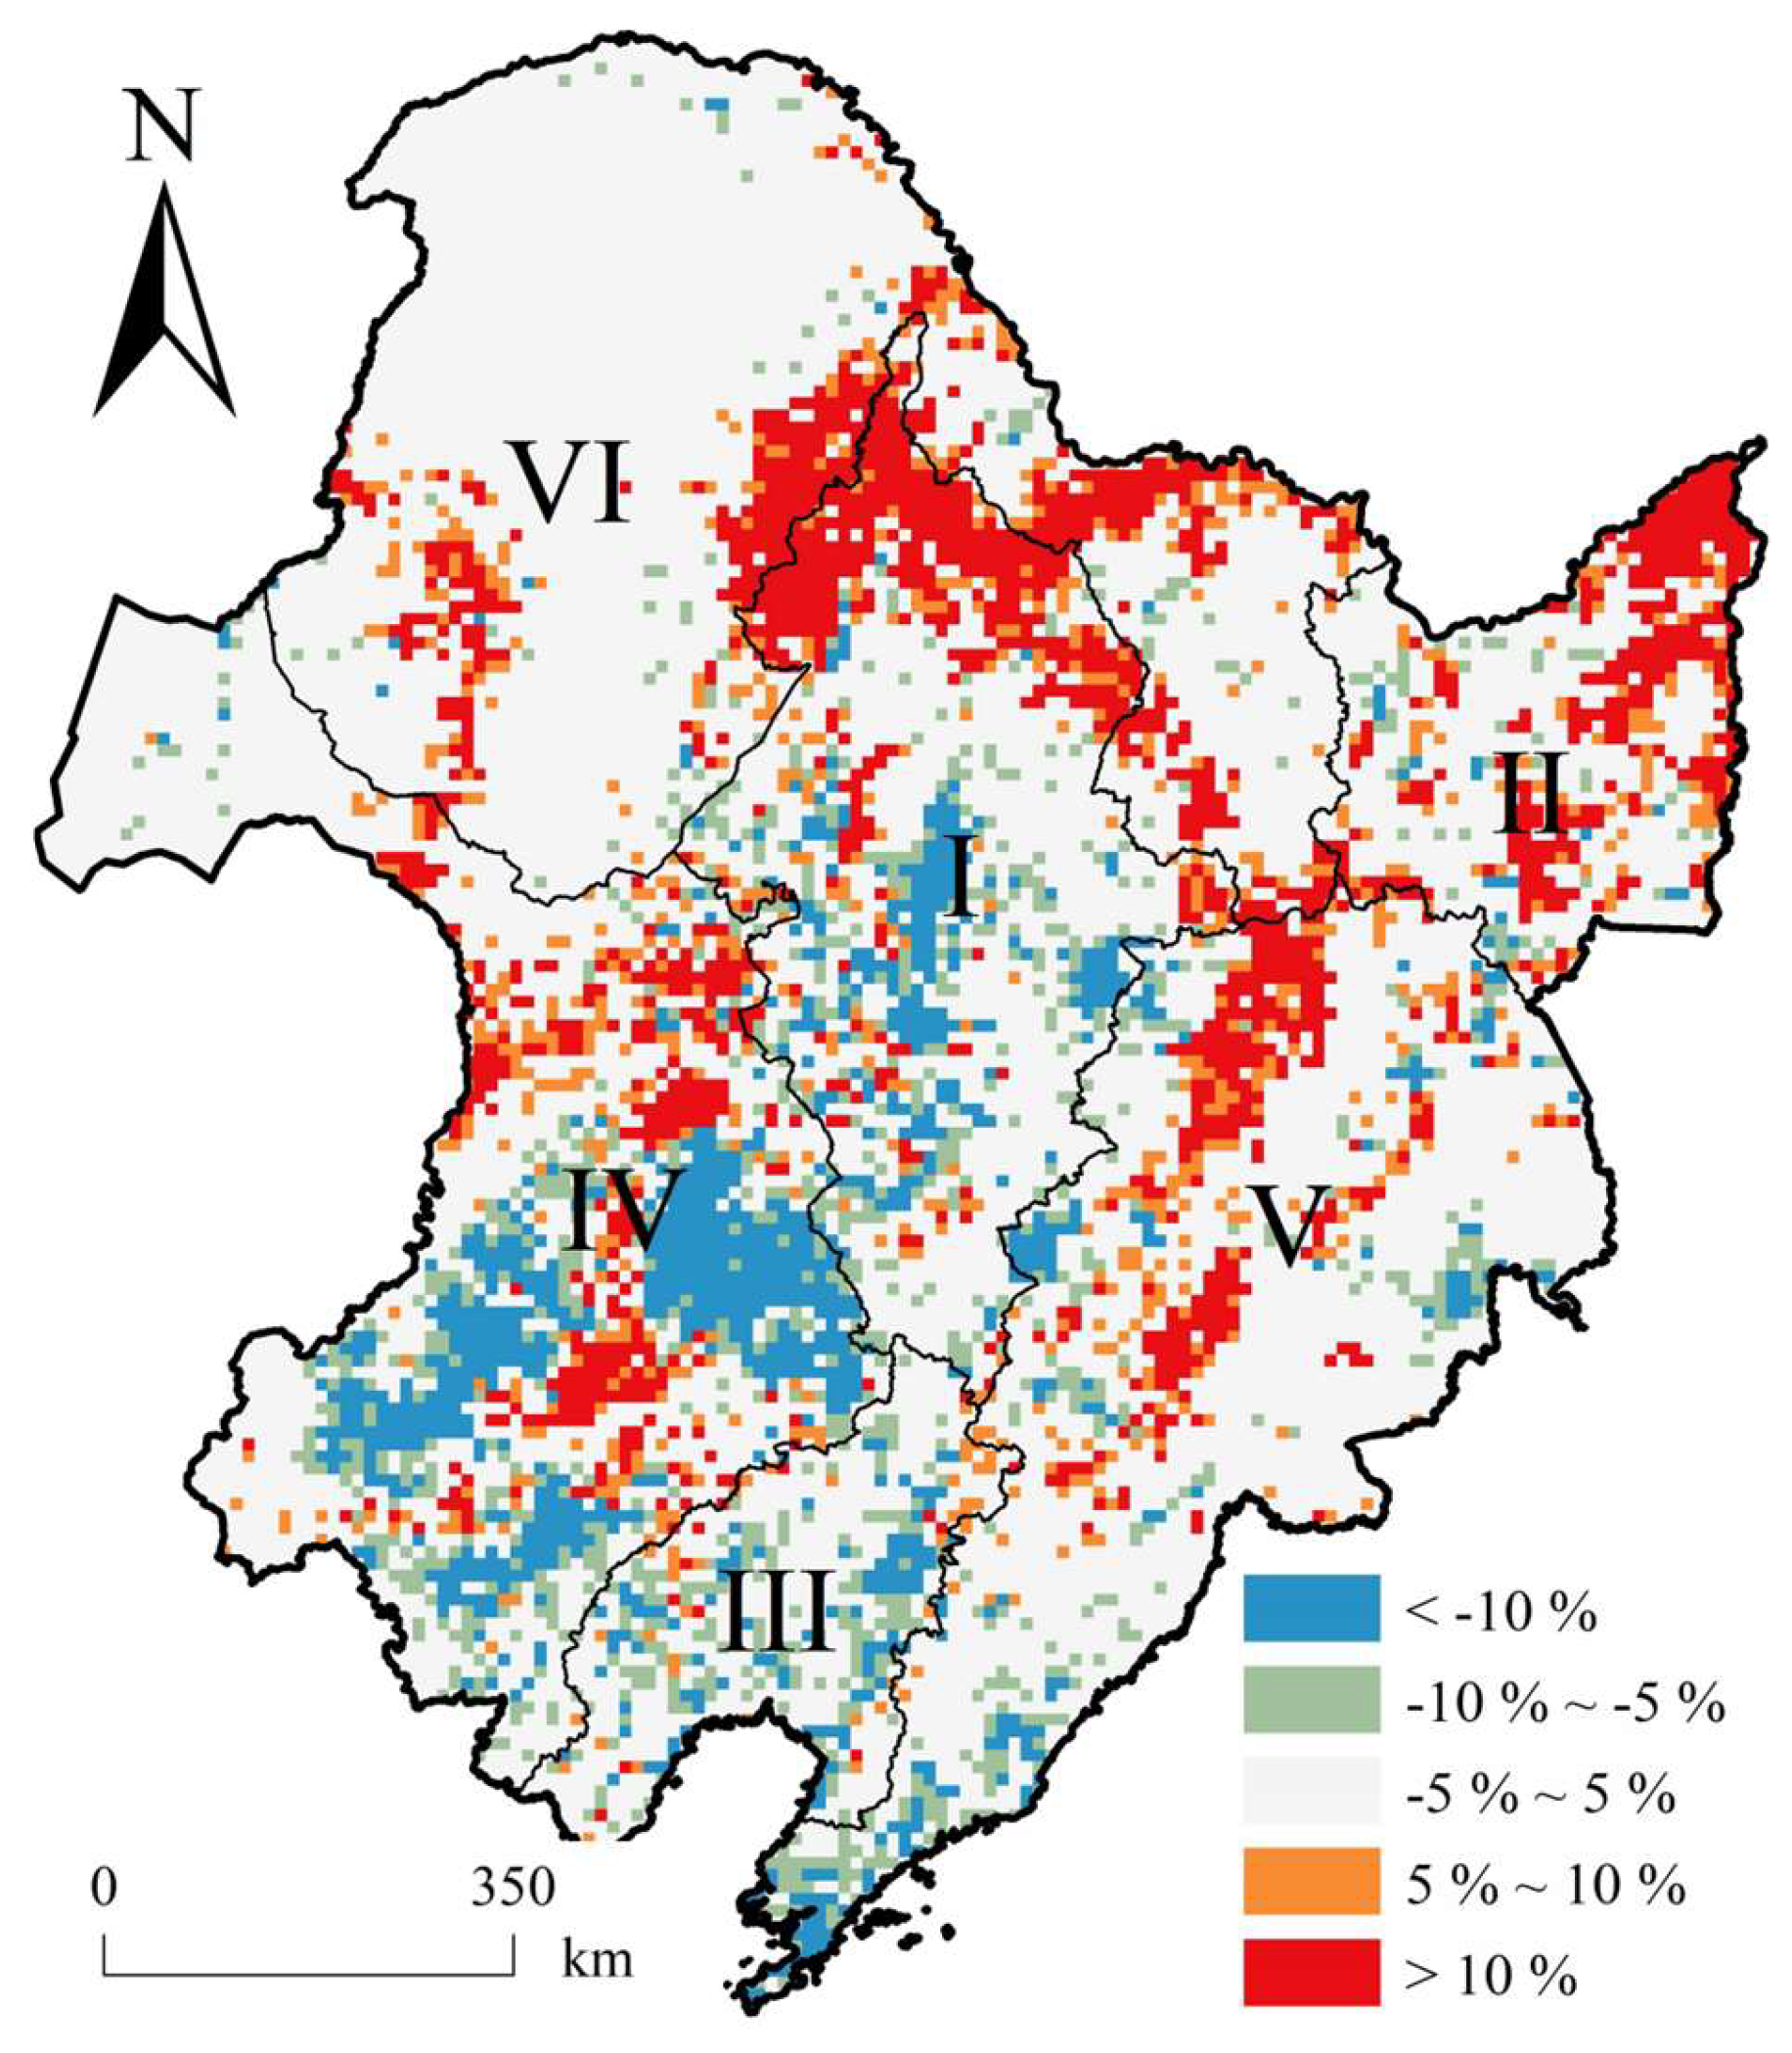
Figure 4.
Spatial distribution of cultivable land in the BSRNC.
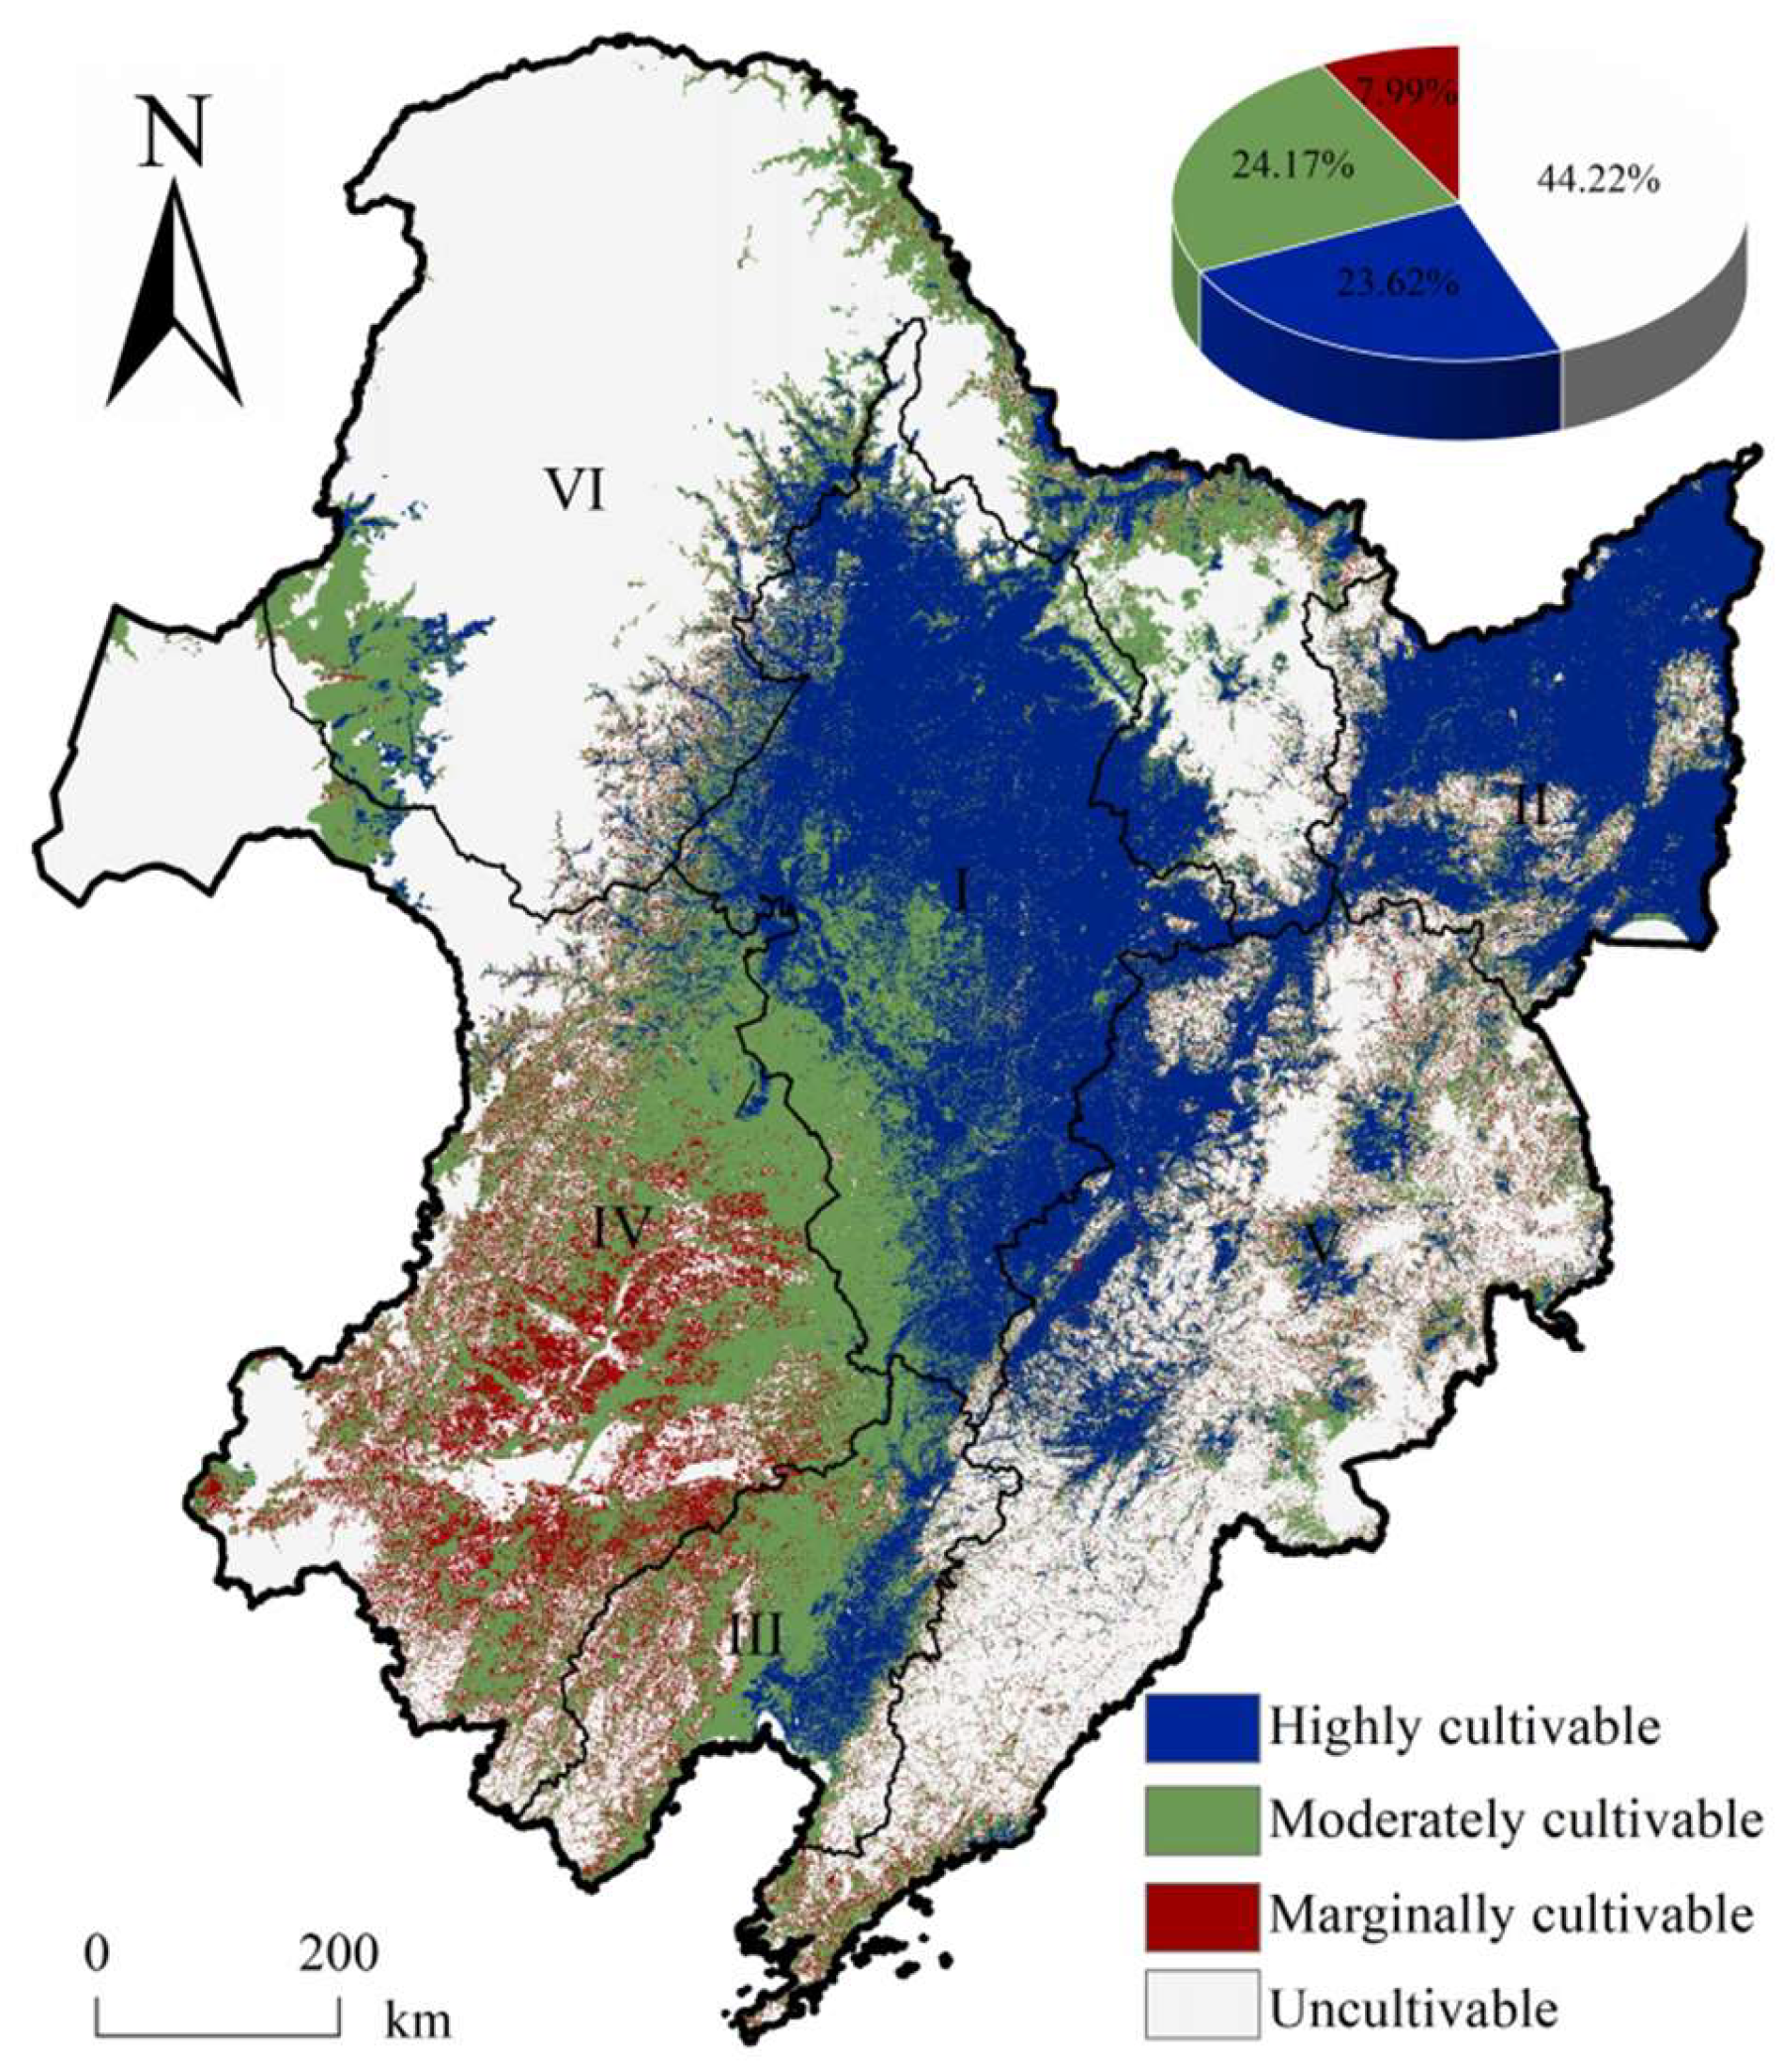
Figure 5.
Suitability of cropland resources in the BSRNC (a) and changes in single-factor suitability (b).
Figure 5.
Suitability of cropland resources in the BSRNC (a) and changes in single-factor suitability (b).
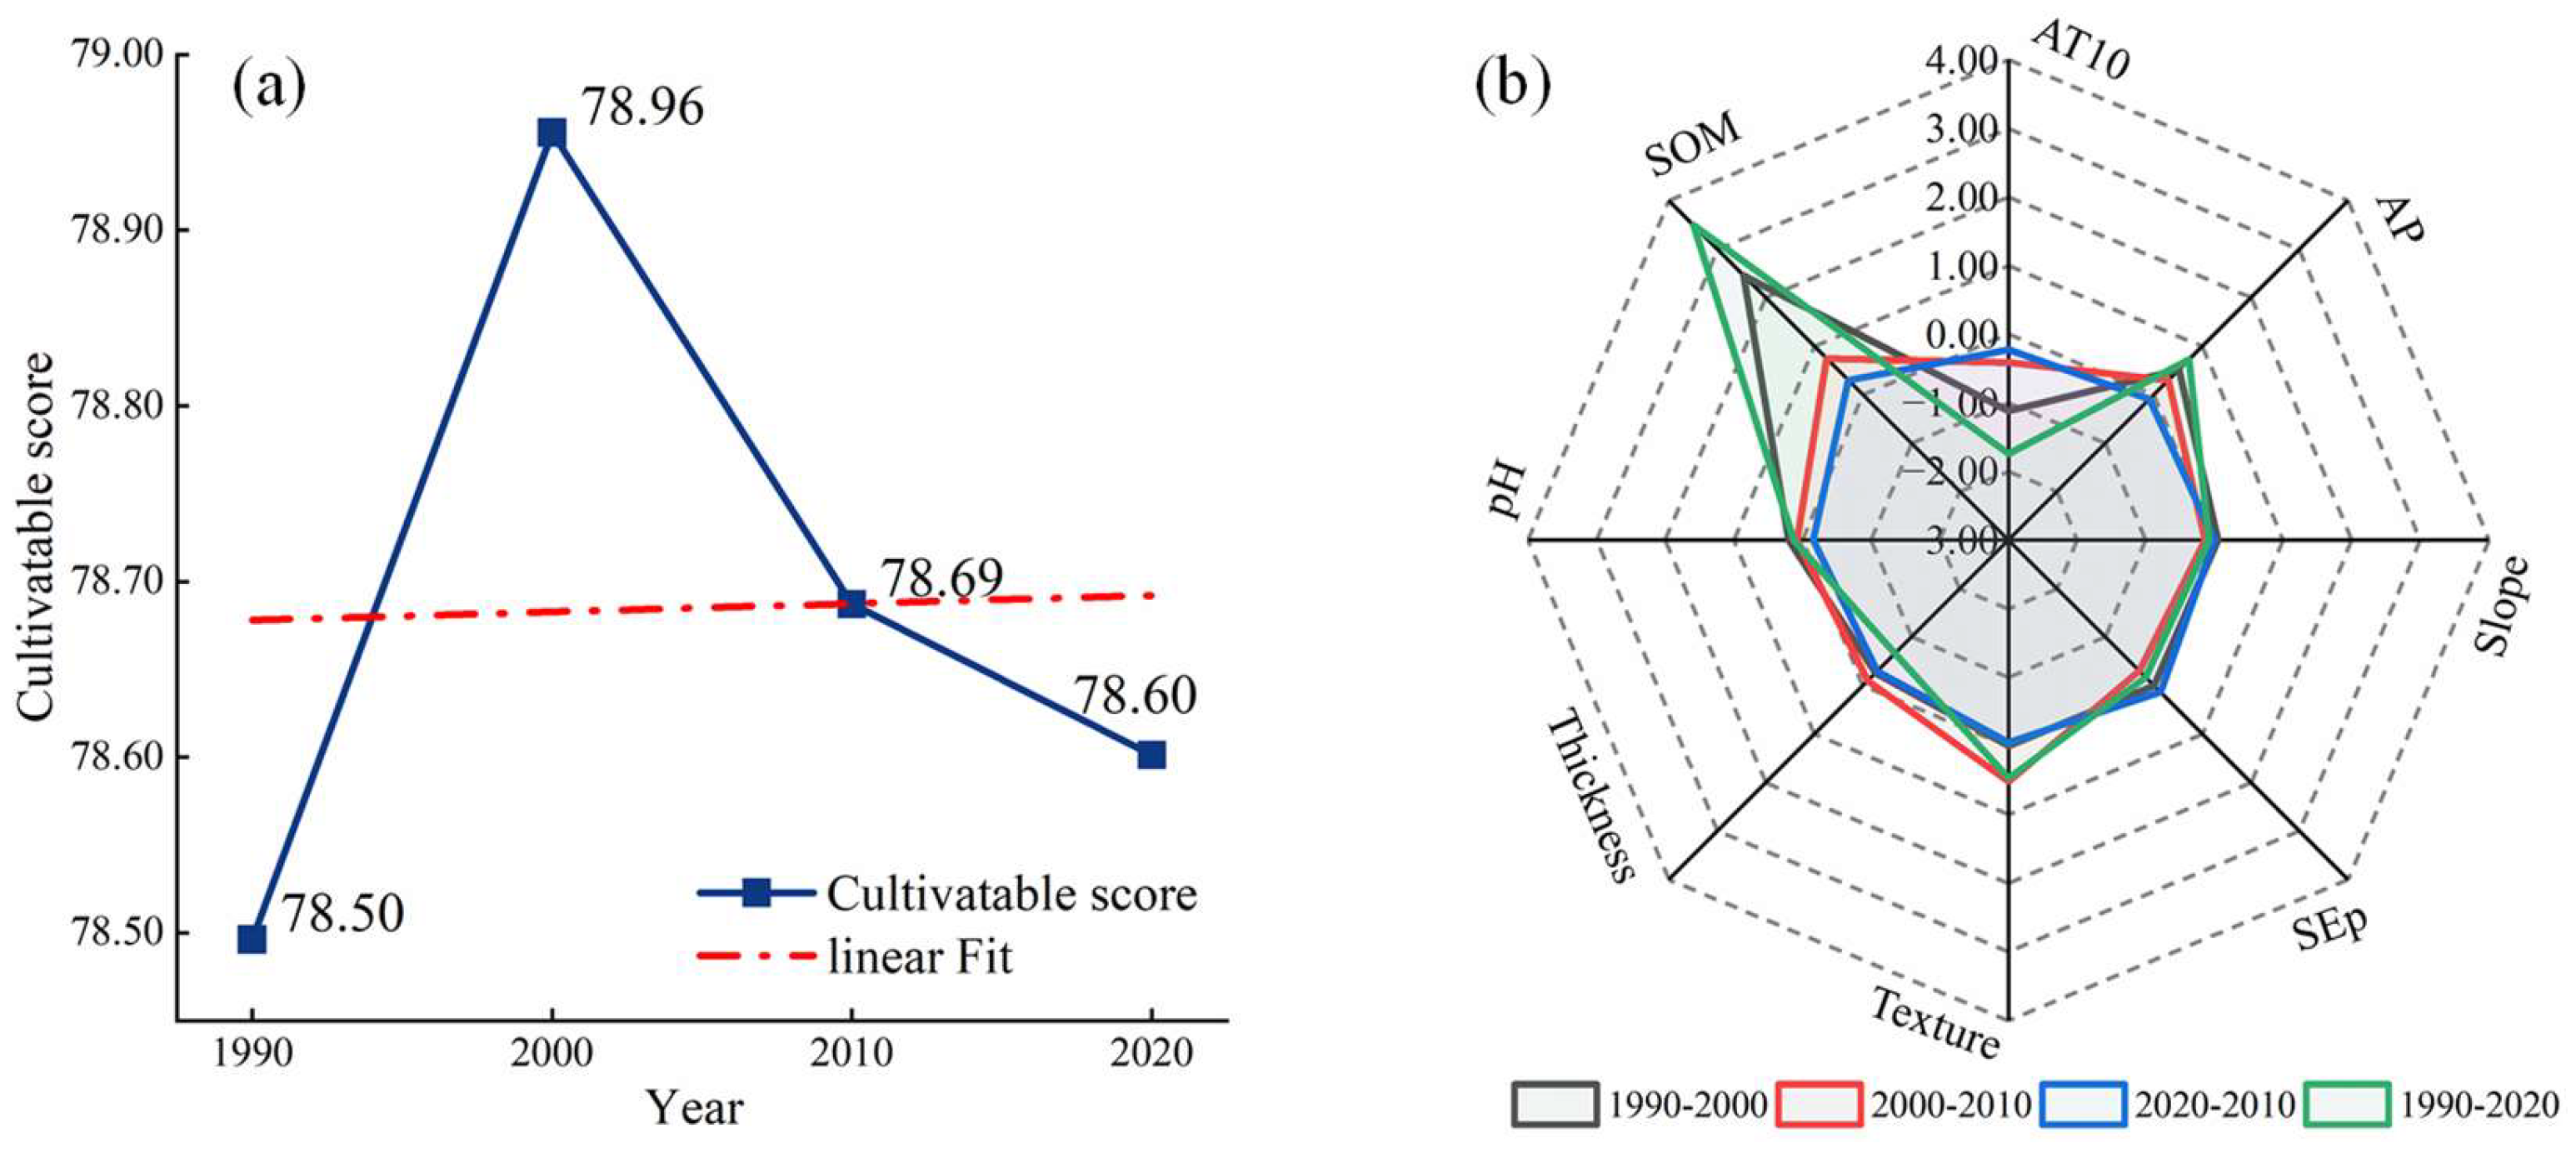
Figure 6.
Cropland cultivation levels across years (a) and factors contributing to unsuitability for cultivation in the BSRNC.
Figure 6.
Cropland cultivation levels across years (a) and factors contributing to unsuitability for cultivation in the BSRNC.
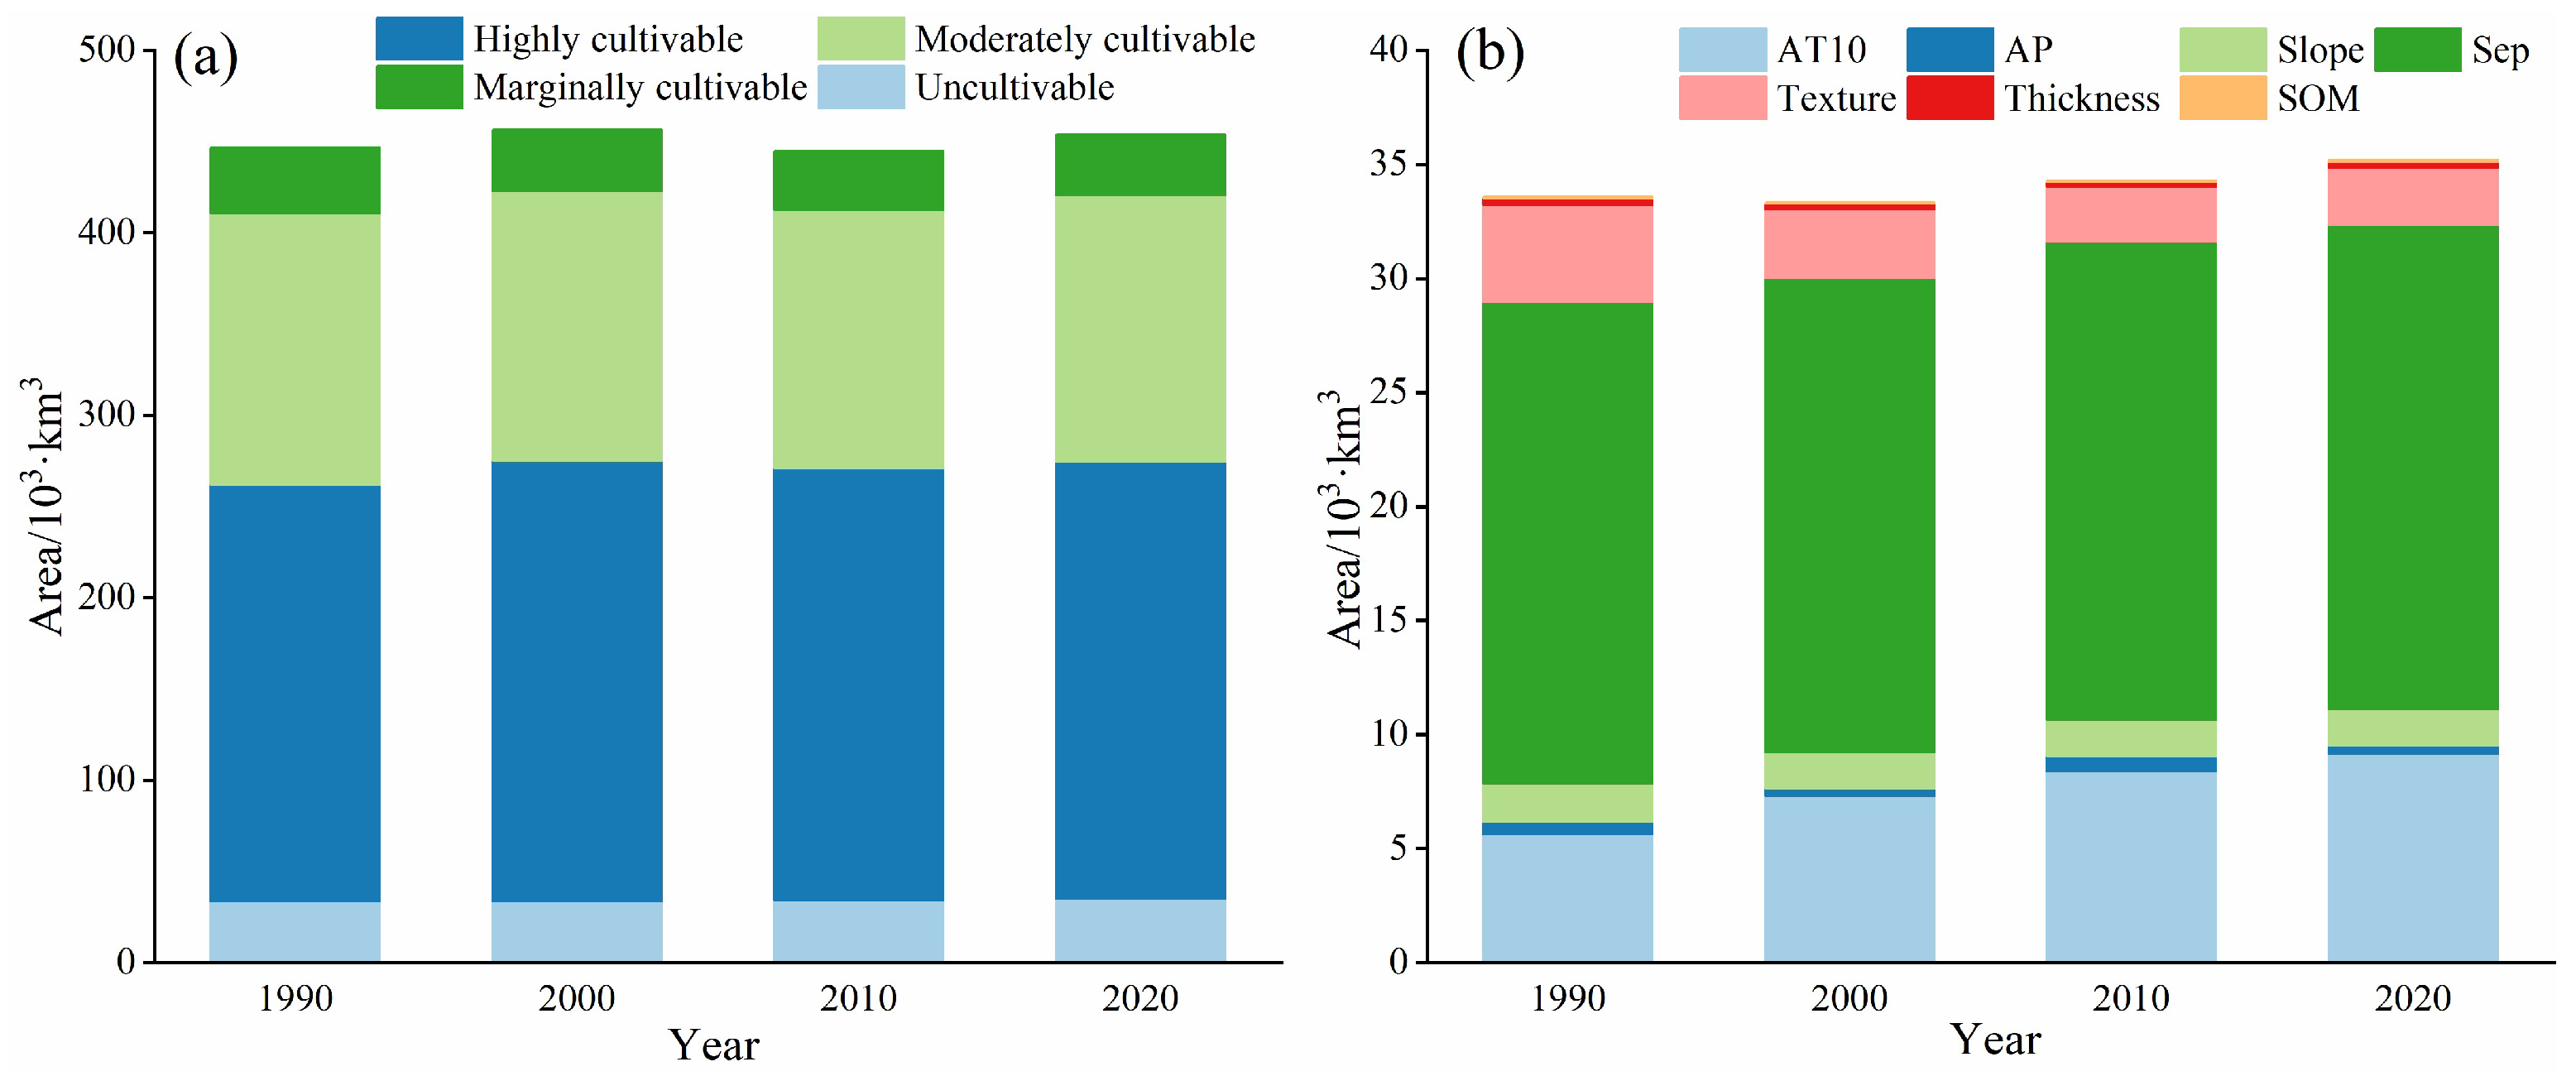
Figure 7.
Relationships between actual crop yields and simulated cultivability scores for different cities in the BSRNC.
Figure 7.
Relationships between actual crop yields and simulated cultivability scores for different cities in the BSRNC.
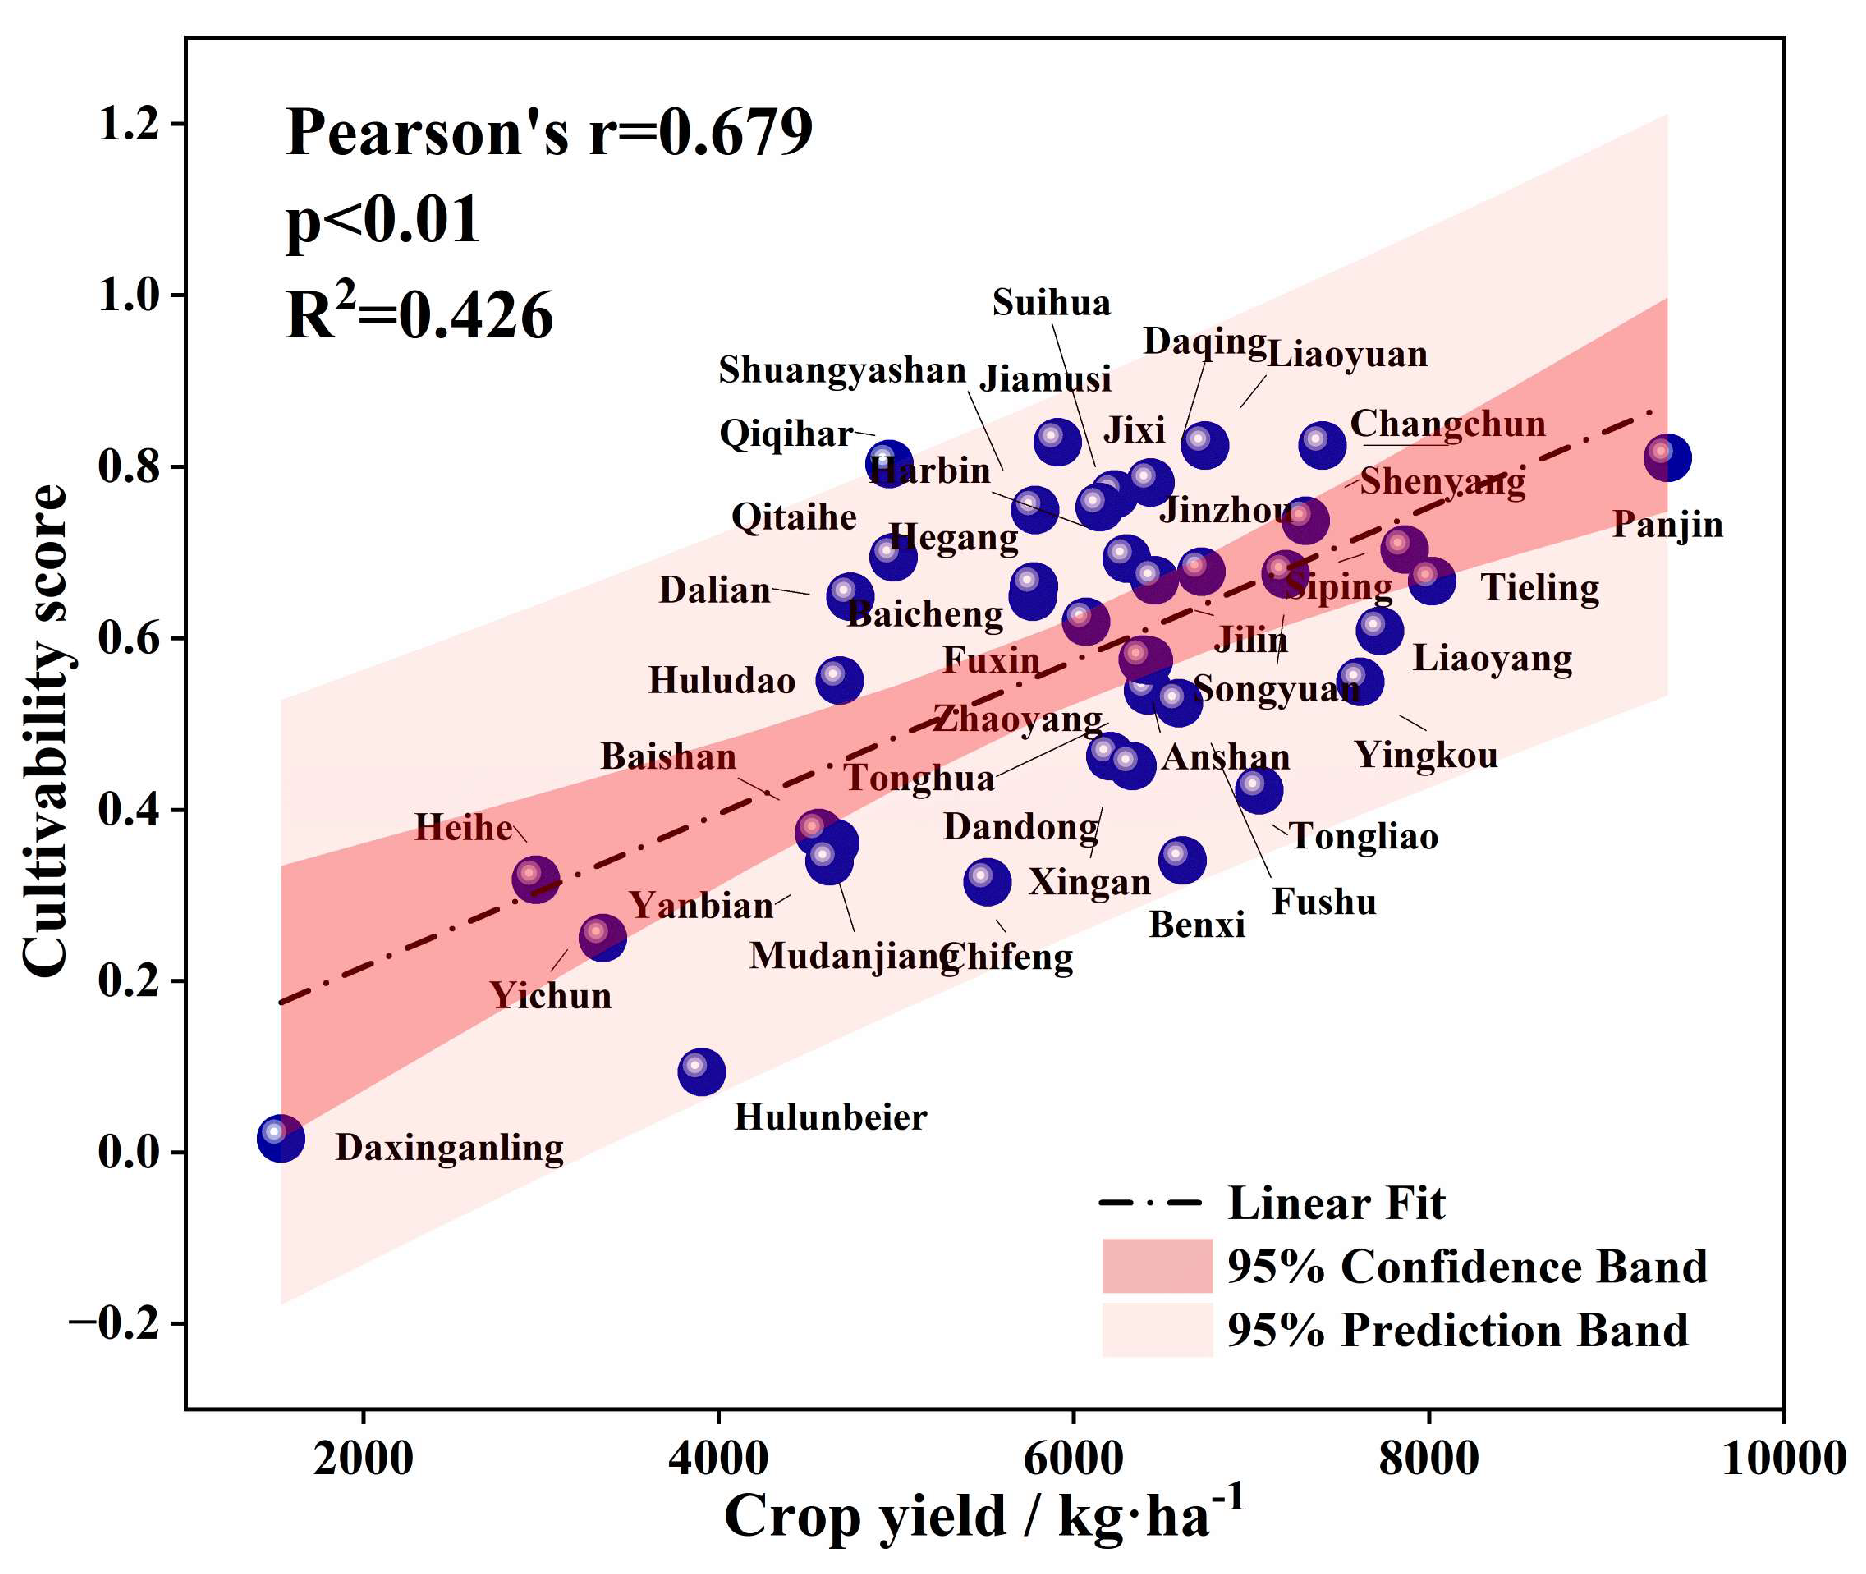
Figure 8.
Spatial distribution of cropland reserves in the BSRNC (a) and coupling of reserves with current land use across various cultivability levels (b).
Figure 8.
Spatial distribution of cropland reserves in the BSRNC (a) and coupling of reserves with current land use across various cultivability levels (b).
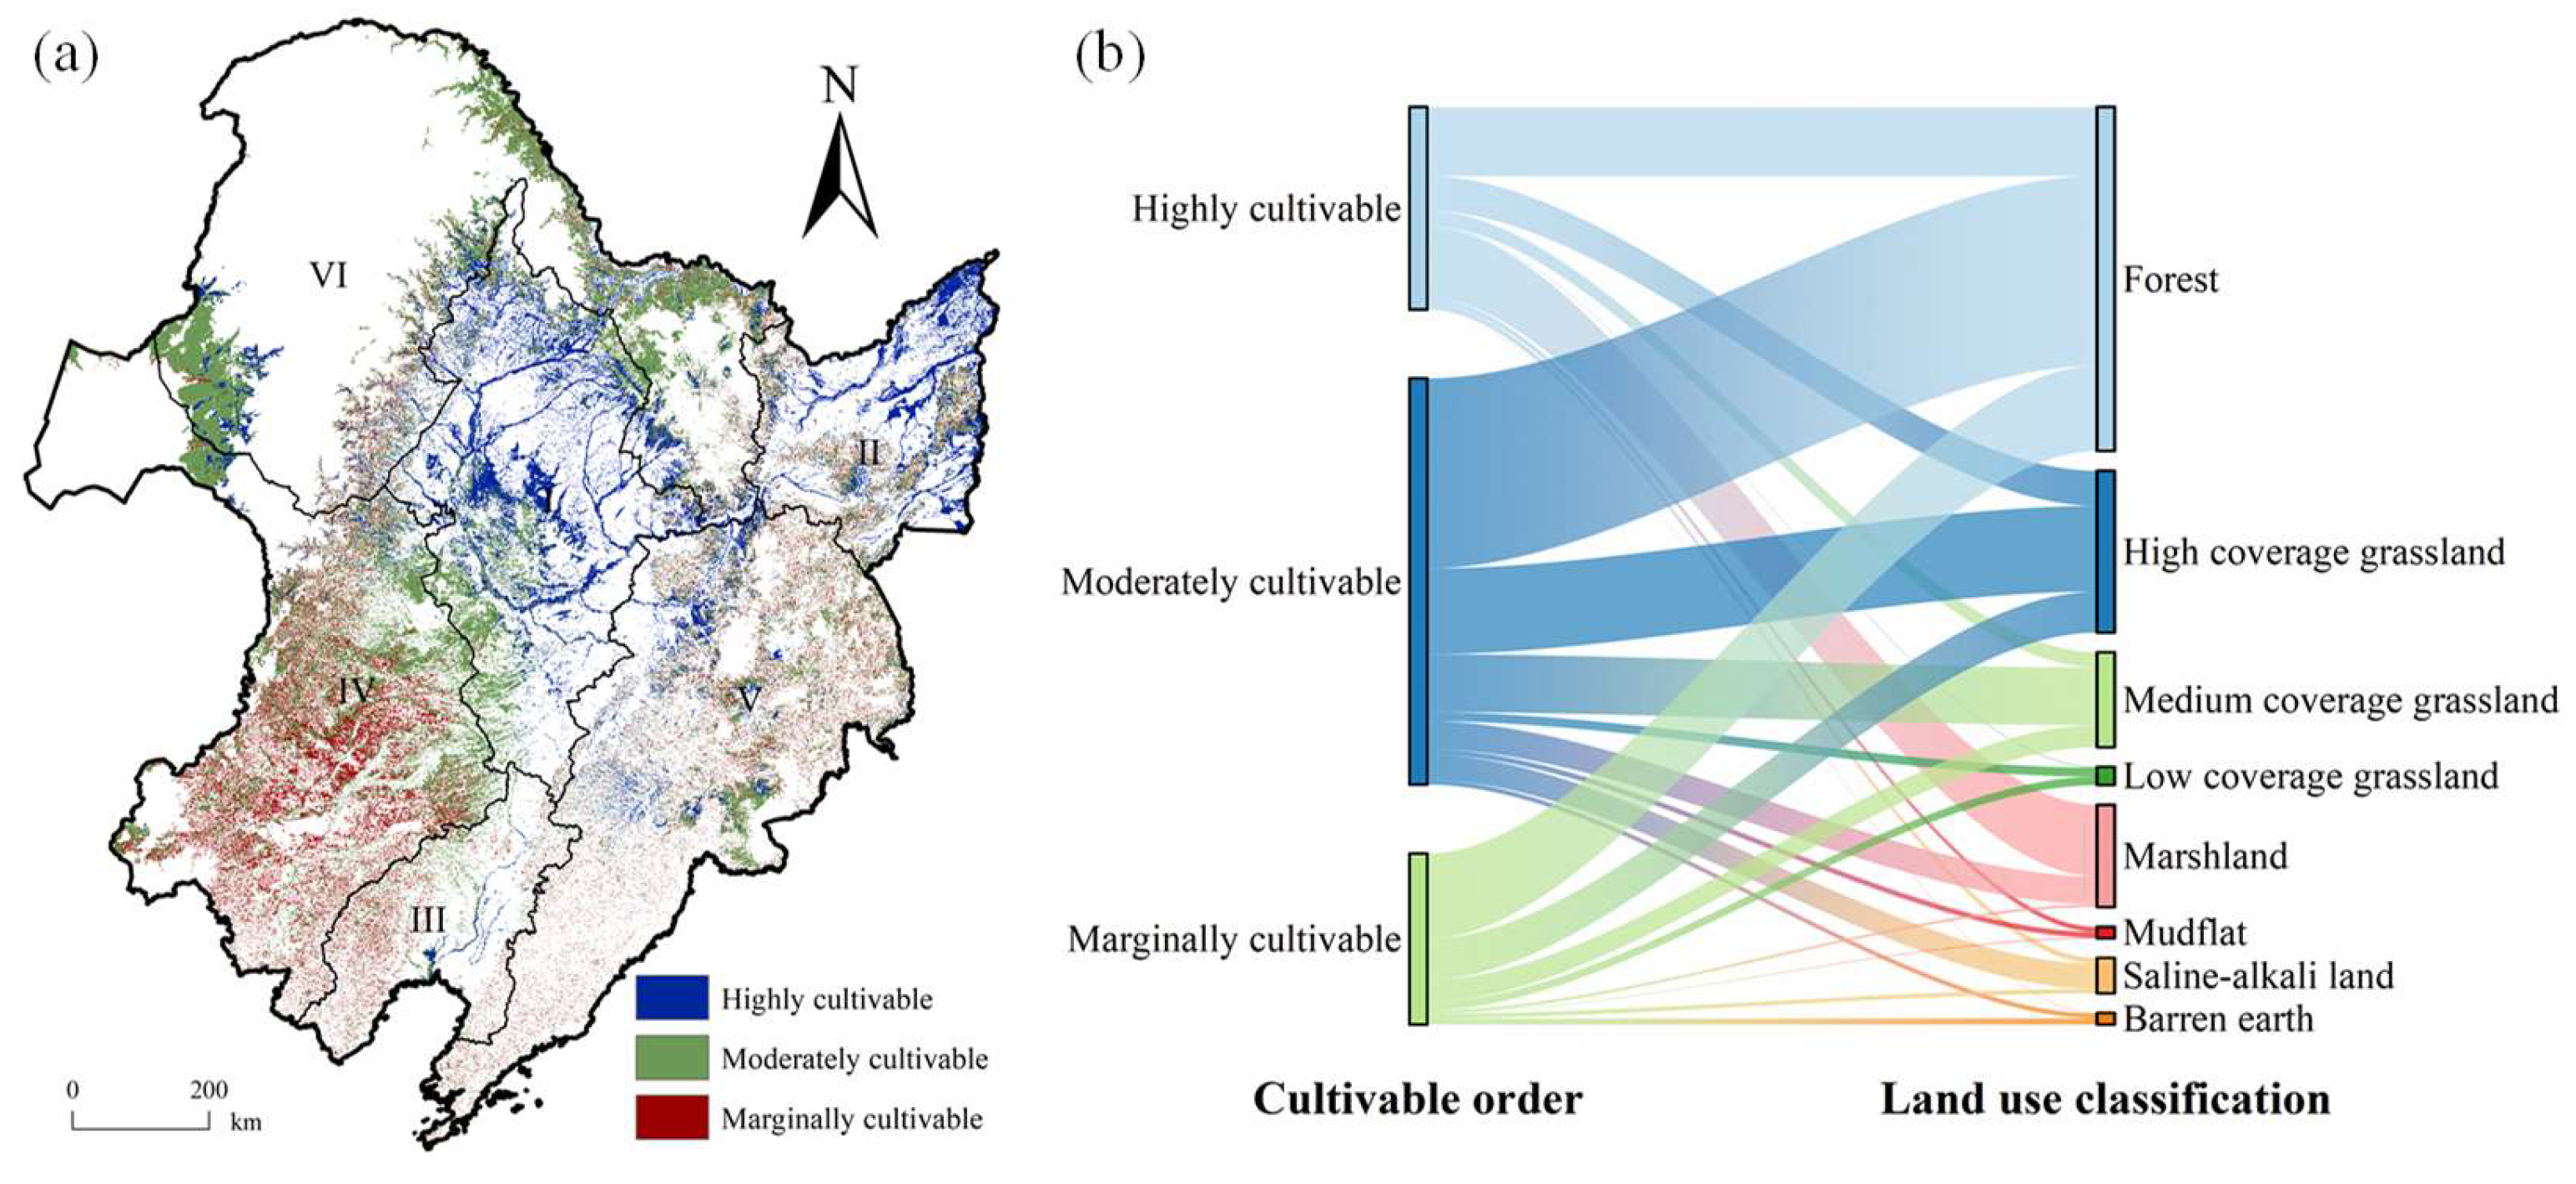

Table 1.
Data applied in the present study and data sources.
| Data | Time resolution | Space resolution | Format | Data source |
|---|---|---|---|---|
| ≥10 °C active accumulated temperature (AT) | 1971–2000 | 1 km | Raster | http://www.nesdc.org.cn |
| Annual precipitation (AP) | 1980–2018 | 1 km | Raster | www.gis5g.com |
| ASTER GDEM | \ | 30 m | Raster | http://www.gscloud.cn |
| Potential annual soil erosion (SEp) | 1999–2019 | 1 km | Raster | Li et al. (2023) [35] |
| Thickness | 2010–2018 | 1 km | Raster | http://www.geodata.cn |
| Soil organic carbon | 2010–2018 | 1 km | Raster | |
| Soil pH | 2010–2018 | 1 km | Raster | |
| Soil texture | 2010–2018 | 1 km | Raster | |
| Land use | 1990, 2000, 2010, 2020 | 30 m | Raster | www.resdc.cn |
Table 2.
Land cultivability evaluation system and ecological niche model parameters.
| Indicators | Indicator types | Optimum value | Limit value | Basis for parameterisation |
| ≥10 °C active accumulated temperature (AT) | I | ≥ 3200 ℃ | ≤ 1800 ℃ | Standards of surveying and evaluating reserved land resource for cultivation (standard no. TD / T 1007 - 2003) |
| Annual precipitation (AP) | I | ≥ 650 mm | ≤ 350 mm | |
| Potential annual soil erosion (SEp) | III | 50 t·ha-1·a-1 | 300 t·ha-1·a-1 | Standards for classification and gradation of soil erosion (standard no. SL 190 - 2007) |
| Slope | III | ≤ 2° | > 25° | Regulations for classification on agriculture land (standard no. GB / T 28405 - 2012); Cultivated land quality grade (standard no. GB / T 33469 - 2016) |
| Soil thickness | I | ≥ 150 cm | ≤ 60 cm | |
| Soil texture | I | Slit, sandy loam, loam, silt loam, sandy clay loam, clay loam, silty clay loam | Sand | |
| Soil pH | II | 6.0 ≤ pH <7.9 | pH < 4.5, pH ≥ 9.5 | |
| Soil organic matter (SOM) | I | ≥ 4 % | ≤ 0.6 % |
Table 3.
Discrete indicator scores for land cultivability.
| Indicators | Indicator classification | Score |
|---|---|---|
| Soil texture | Slit, sandy loam, loam, silt loam, sandy clay loam, clay loam, silty clay loam | 100 |
| Clay, silty clay, sandy clay | 80 | |
| Loamy sand | 60 | |
| sand | 0 | |
| Soil pH | 6.0 ≤ pH <7.9 | 100 |
| 5.5 ≤ pH < 6.0, 7.9 ≤pH < 8.5 | 90 | |
| 5.0 ≤ pH < 5.5, 8.5 ≤ pH < 9.0 | 80 | |
| 4.5 ≤ pH < 5.0, 9.0 ≤ pH < 9.5 | 60 | |
| pH < 4.5, pH ≥ 9.5 | 0 |
Table 4.
Changes in cropland area in the BSRNC during 1990–2020.
| 1990 | 2000 | 2010 | 2020 | 1990—2020 | |
| Cropland area / 103 km2 | 446.62 | 456.60 | 444.81 | 453.78 | — |
| Area proportion / % | 35.93 | 36.74 | 35.79 | 36.51 | — |
| Amount of area change / 103 km2 | — | 9.97 | -11.78 | 8.97 | 7.16 |
| Rate of area change / % | — | 2.23 | -2.58 | 2.02 | 1.60 |
Table 5.
Land cultivability and effects of constraints in different zones in the BSRNC.
| Type regions | cultivability score | AT10 | AP | SEp | Slope | Texture | Thickness | pH | SOM |
|---|---|---|---|---|---|---|---|---|---|
| SNP | 83.06 | 83.44 | 79.58 | 94.55 | 90.88 | 99.79 | 90.37 | 96.82 | 71.24 |
| SJP | 75.23 | 80.43 | 92.09 | 79.50 | 85.87 | 94.24 | 67.85 | 99.43 | 94.18 |
| LHP | 58.24 | 99.59 | 86.90 | 61.75 | 83.24 | 99.27 | 81.29 | 99.80 | 33.80 |
| WS | 43.29 | 75.12 | 57.09 | 78.33 | 84.63 | 89.85 | 71.92 | 95.62 | 44.63 |
| CMEL | 36.97 | 75.32 | 97.79 | 37.02 | 67.43 | 99.57 | 54.48 | 95.99 | 82.33 |
| DXXAL | 22.54 | 23.54 | 81.15 | 71.20 | 76.22 | 99.76 | 45.35 | 93.82 | 96.60 |
Disclaimer/Publisher’s Note: The statements, opinions and data contained in all publications are solely those of the individual author(s) and contributor(s) and not of MDPI and/or the editor(s). MDPI and/or the editor(s) disclaim responsibility for any injury to people or property resulting from any ideas, methods, instructions or products referred to in the content. |
© 2024 by the authors. Licensee MDPI, Basel, Switzerland. This article is an open access article distributed under the terms and conditions of the Creative Commons Attribution (CC BY) license (http://creativecommons.org/licenses/by/4.0/).
Copyright: This open access article is published under a Creative Commons CC BY 4.0 license, which permit the free download, distribution, and reuse, provided that the author and preprint are cited in any reuse.


