Preprint
Article

This version is not peer-reviewed.

Does Hypertension Mediate the Association of the Serum Uric Acid-to-Albumin Ratio with Mortality in U.S. Adults? A Prospective Cohort Study

Submitted:

02 December 2024

Posted:

03 December 2024

You are already at the latest version

Abstract

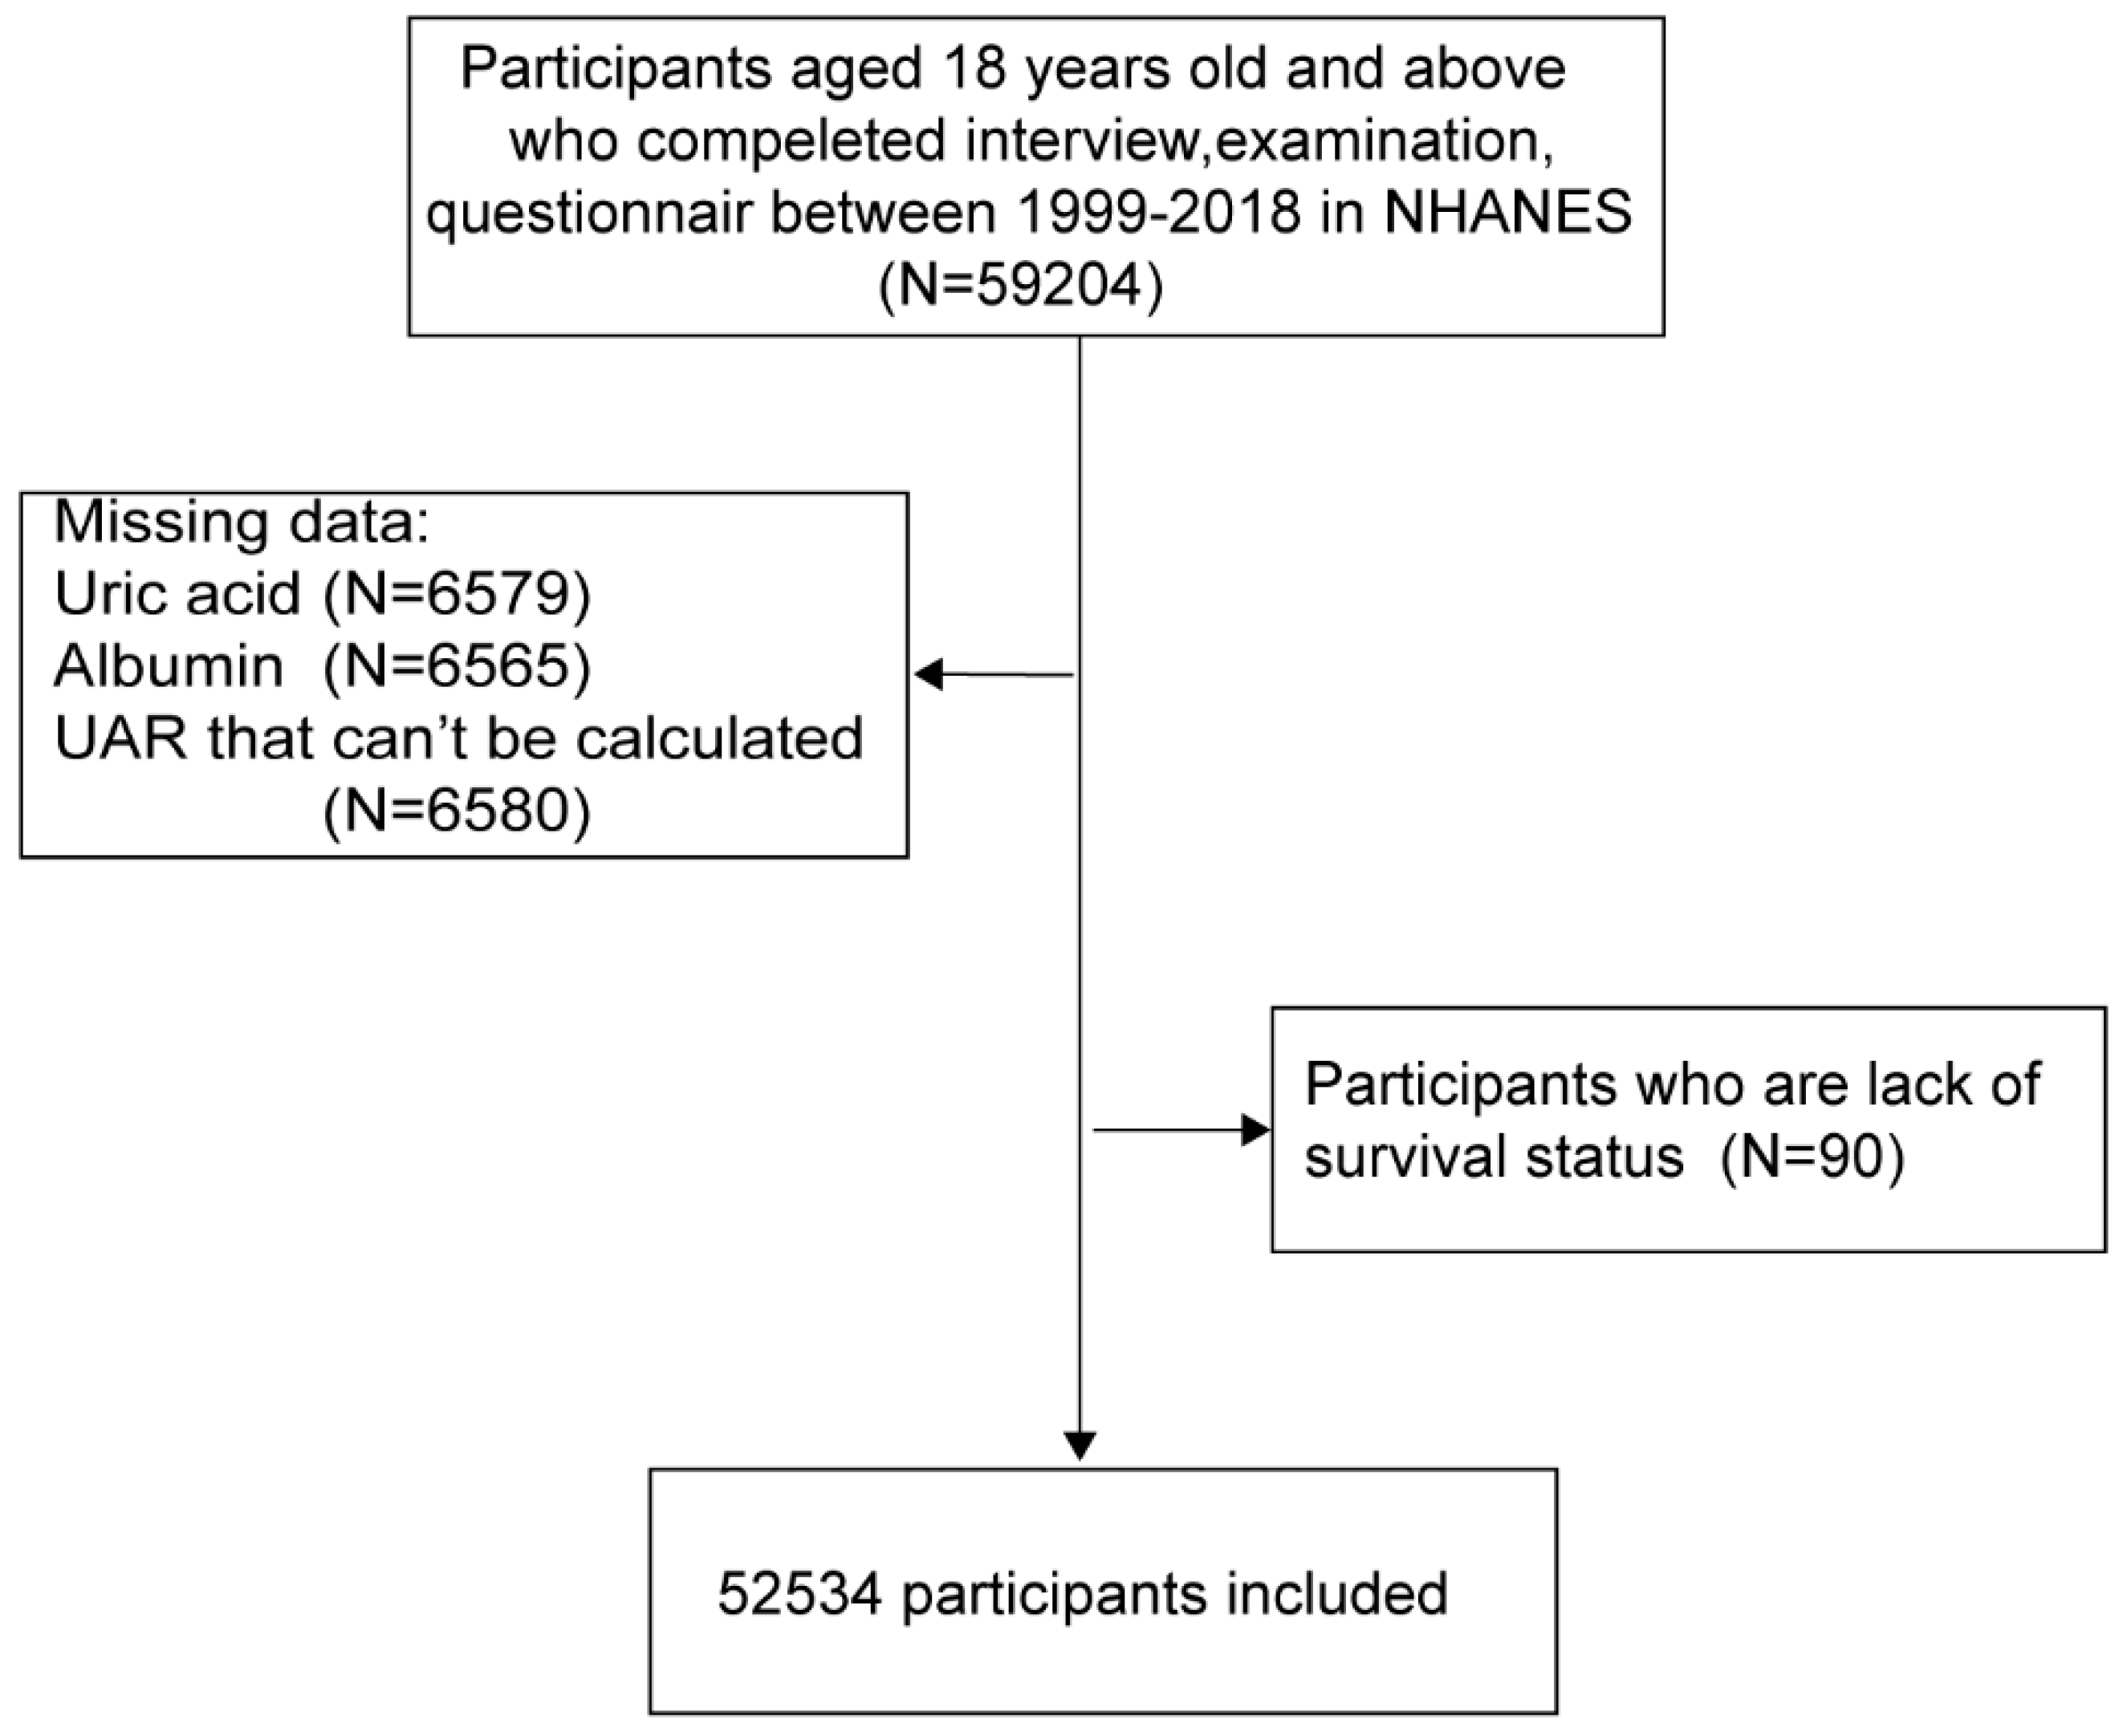
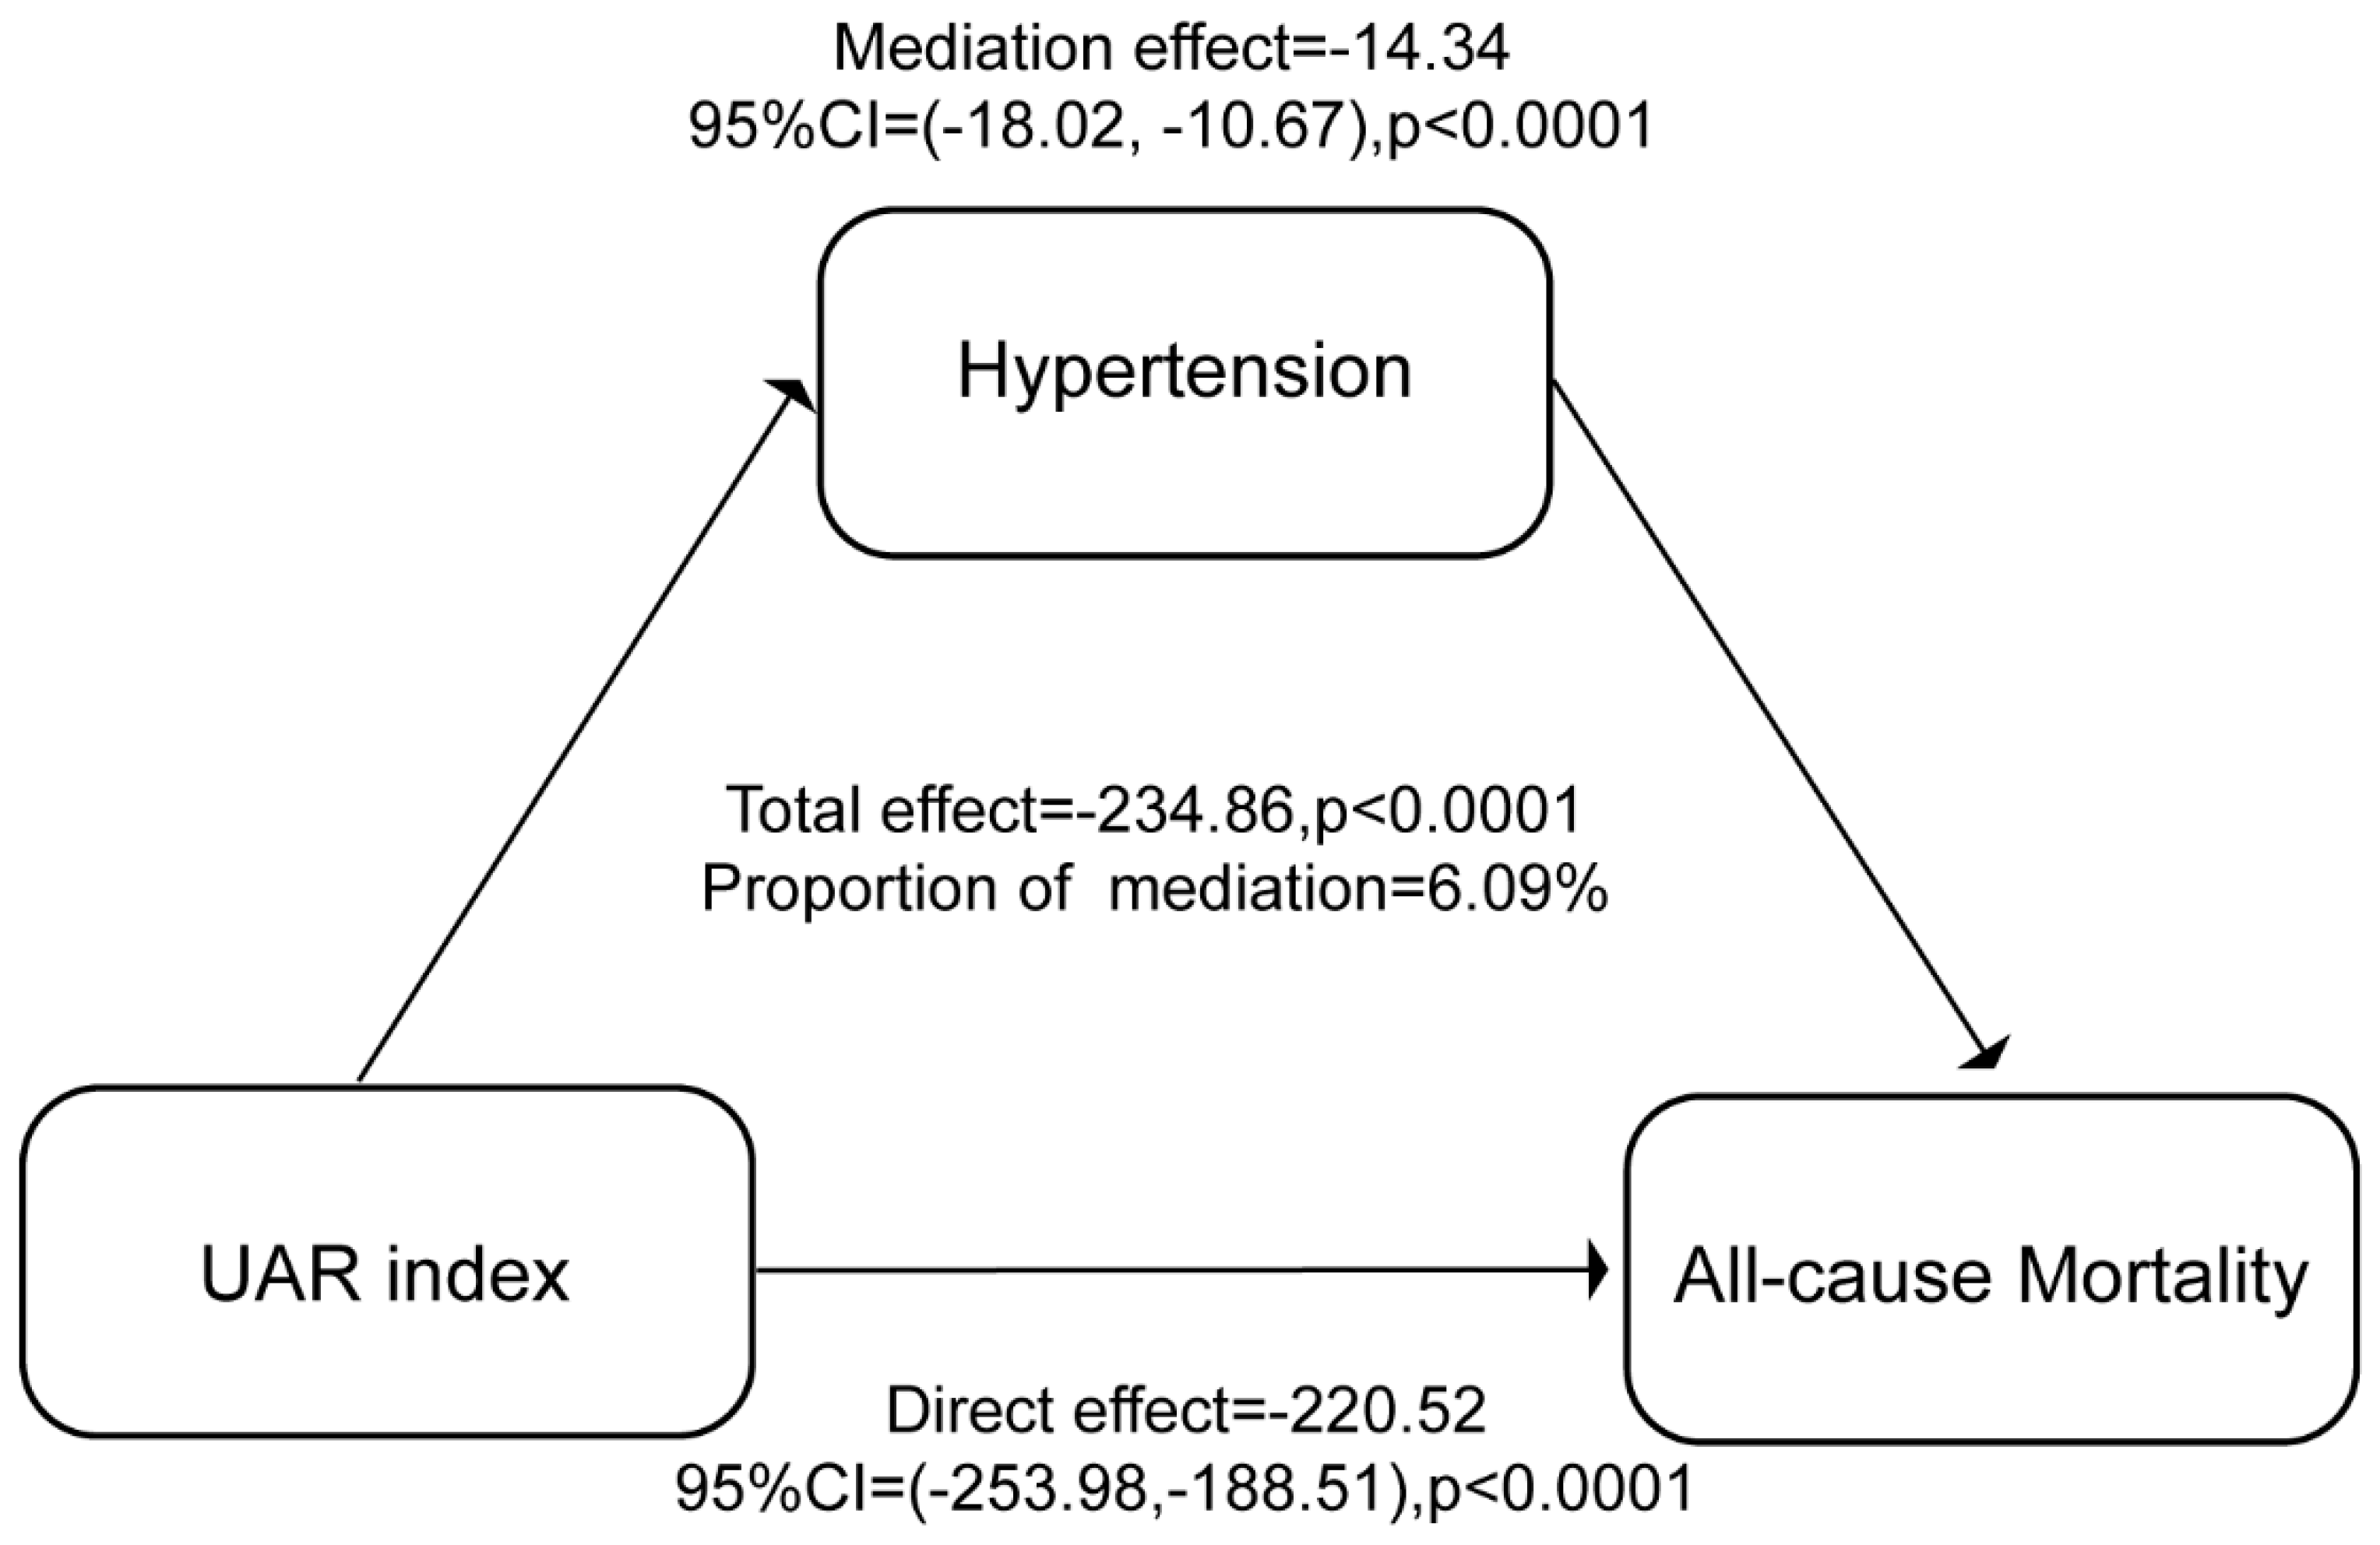
(1) Background: The uric acid-to-albumin ratio (UAR) has emerged as a potential inflammation and oxidative stress biomarker for cardiovascular health; however, its association with mortality risk in the general population and the mediating role of hypertension remain understudied. (2) Methods: The data set comprised 52,534 participants aged 18 years and older from the National Health and Nutrition Examination Survey (NHANES) database, collected between 1999 and 2018. UAR was calculated as the ratio of uric acid (mg/dL) to albumin (g/dL). Covariates included demographic factors, lifestyle variables, and health conditions. The primary outcome was all-cause mortality, with specific-cause mortality as a secondary outcome. Cox proportional hazard models and restricted cubic spline regression (RCS) were used to assess the correlation between UAR levels and risk of death, and mediation analysis was performed to evaluate the role of hypertension in the UAR-mortality relationship.(3) Results: Higher UAR levels were significantly associated with an increased risk of all-cause mortality (hazard ratio [HR], 1.91; 95% confidence interval [CI], 1.77-2.05) and specific cause-related mortalities, particularly heart disease and nephropathy. A strong association was observed between hypertension and mortality (HR, 1.44; 95% CI, 1.36-1.53). The results of the mediation analysis indicated that hypertension played a role in mediating the relationship between UAR and mortality. The mediation effect estimate was -14.34 (95% CI: -18.02, -10.67), p<0.0001, and the proportion mediated by hypertension was 6.09%. This suggests that UAR has a direct impact on mortality, independent of its effect on hypertension. (4) Conclusions: The results of our study indicate a significant correlation between UAR, hypertension, and mortality. This suggests that UAR may serve as a potential biomarker for early risk identification and an antioxidant target for further clinical interventions.

Keywords: 
;  ;  ;  ;  

1. Introduction

The identification of novel biomarkers for the early detection of increased mortality risk represents a significant unmet need in the field of biomedical research. The pursuit of such biomarkers is driven by the potential to improve disease prevention strategies and enhance early interventions, which could ultimately lead to a reduction in morbidity and mortality rates. The limitations of traditional risk assessment tools, which rely on clinical parameters and a restricted set of baseline biomarkers, are evident in their inability to fully capture the intricate biological processes underlying diseases. This underscores the significance of this research [1]. The pursuit of simple and effective biomarkers is of paramount importance for enhancing our ability to predict, prevent, and manage a range of health conditions, thereby improving public health outcomes.
Uric acid (UA), the final product of purine metabolism, has been linked to endothelial dysfunction and heightened chronic inflammatory responses. Consequently, UA is regarded as a risk factor for atherosclerosis and coronary artery disease (CAD) [2] . A substantial body of evidence from numerous studies has demonstrated a direct causal relationship between serum uric acid levels and blood pressure [3,4]. Serum albumin, the most abundant protein in the human body, plays a role in anti-inflammatory processes and the elimination of free radicals [5,6]. The uric acid-to-albumin ratio (UAR) is a biomarker that reflects the balance between uric acid and serum albumin levels and is associated with various pathological conditions, including inflammation and oxidative stress, both of which are known factors contributing to hypertension and its related complications [2,7,8]. A high uric acid-to-albumin ratio (UAR) may serve as a predictive marker for the severity of hypertension, indicating that it may reflect underlying pathophysiological changes that predispose individuals to adverse cardiovascular events [9]. Recent studies have underscored its predictive value for mortality in patients with ST-elevation myocardial infarction (STEMI) and non-ST-elevation myocardial infarction (NSTEMI) [7,8]. It has the potential to serve as a prognostic indicator for long-term cardiac mortality in patients with unstable angina and those undergoing percutaneous coronary intervention (PCI) 9 . Furthermore, elevated UAR values have been linked to impaired collateral circulation in patients with non-ST-elevation myocardial infarction [10,11]. In sum, the prognostic role of UAR in cardiovascular disease has been firmly established.
However, no studies have reported an association between UAR and mortality risk in the general population, nor has the potential mediating effect of hypertension on the relationship between UAR and mortality been investigated. In light of the aforementioned knowledge gap, the present study seeks to elucidate the potential association between UAR and all-cause and cause-specific mortality risk in the general population. To this end, data from the National Health and Nutrition Examination Survey (NHANES) from 1999 to 2018 will be employed. Furthermore, the study will explore the mediating role of hypertension in this relationship.

2. Research population and methods

2.1. Participants characteristics

The characteristics of the participants in this cohort study were derived from the NHANES database (1999-2018). This database is a cross-sectional study that collected health and nutrition information related to representative demographic statistics, physical examinations, disease questionnaires, and survival follow-up. The study included 52,534 participants aged 18 years and older with complete serum albumin, uric acid, and follow-up data on death. (Figure 1)

2.2. Variables and outcomes

In this study, UAR was defined as the ratio of uric acid (mg/dL) to albumin (g/dL). Covariates included demographic factors such as age, race and ethnicity, gender, poverty income ratio (PIR) and education level; lifestyle factors such as body mass index (BMI, kg/m²), smoking status (former or never), and physical activity; and health questionnaires on hypertension, diabetes, hypercholesterolemia, heart disease, stroke, and cancer. All variables are publicly available on the NHANES website. The primary outcome was all-cause mortality, while specific-cause mortality constituted the secondary outcome. The follow-up period for survival was from the date of the interview to December 31, 2019.

2.3. Statistical analysis

1. The mean ± standard deviation (SD) and percentage were calculated for continuous and categorical variables, respectively. 2. The relationship between UAR levels or hypertension and the risk of mortality was evaluated using Cox proportional hazard models. 3. Subgroup analyses were conducted to investigate the relationship between UAR and all-cause mortality, stratified by age, gender, BMI, race and ethnicity, education level, PIR, physical activity, and smoking status. The P-value for the interaction is determined through a logarithm likelihood ratio test. 4.To assess the non-linear association between UAR and the hazard of all-cause death, restricted cubic spline (RCS) regression was employed, and the Kaplan-Meier curve was used for the overall survival. 5. The causal mediation analysis enables the calculation of the number of mediated effects produced by hypertension. All results were statistically significant with a p-value less than 0.05 (two-tailed). The data were analyzed using the statistical software packages R (version 4.2.0) and EmpowerStats.

3. Results

3.1. Basic characteristics of the population

In Table 1, a total of 52,534 participants were classified into three groups based on the UAR tertiles. The mean age across all groups was 47.50 years, with the oldest group observed in T3 (51.82 years). There was a notable male predominance, particularly in T3, where 65.82% of participants were male. Significant differences in the distribution of race and ethnicity were observed across the UAR tertiles, with the highest proportion of Non-Hispanic Blacks observed in T3 (24.36%). Significant differences were observed in poverty income ratio and education level across the groups.
The mean BMI and UAR values were significantly higher in T3, with mean BMI values of 31.23 kg/m² and mean UAR values of 1.64. The prevalence of smoking, hypertension, diabetes, heart disease, stroke, cancer, and high cholesterol exhibited a progressive increase across UAR tertiles, with the highest rates observed in T3. It is noteworthy that the mean uric acid level was 6.79 mg/dL in T3, which was significantly higher than the other groups. Conversely, the mean albumin levels were lowest in T3 (4.16 g/dL).

3.2. Logistic regression analyses

Table 2 presents the hazard ratios (HR) for mortality associated with UAR levels and hypertension. In the fully adjusted Model 3, a significant positive association was observed between higher UAR and increased mortality risk, with an HR of 1.91 (95% CI, 1.77-2.05) for the overall UAR. The highest UAR tertile (T3) exhibited the highest HR of 1.37 (95% CI, 1.27-1.49) in comparison to the reference tertile (T1). Furthermore, hypertension demonstrated a robust correlation with mortality, with an HR of 1.44 (95% CI, 1.36-1.53) in Model 3.
The appendix table provides a detailed examination of the relationship between UAR and mortality, both overall and in specific causes. Table A1 demonstrates that after adjusting for numerous potential confounding factors in Model 3, there is a statistically significant association between UAR and all-cause mortality, with an HR of 1.91 (95% CI, 1.77-2.05). This relationship is also observed for several cause-specific mortalities, with UAR demonstrating a particularly strong link to heart disease and nephropathy, where the HRs are 1.52 (95% CI, 1.33-1.73) and 2.44 (95% CI, 1.59-3.77), respectively. The association between malignant neoplasm and diabetes also remains significant, with hazard ratios of 1.28 (95% confidence interval, 1.09-1.51) and 1.59 (95% confidence interval, 1.17-2.16), respectively. Furthermore, we have included data on the hazard ratios for cause-specific mortality by UAR tertiles. (Table A2).
Table 3 illustrates the robust correlation between UAR and hypertension. In the unadjusted Model 1, elevated UAR was associated with an increased risk of hypertension, with an odds ratio (OR) of 4.61 (95% confidence interval [CI], 4.36-4.87). After adjusting for demographic factors in Model 2 and further for lifestyle and metabolic variables in Model 3, the association remained significant, with odds ratios of 3.73 (95% confidence interval, 3.50-3.97) and 2.69 (95% confidence interval, 2.49-2.92), respectively. The odds of hypertension increased progressively across UAR tertiles, with the highest tertile (T3) showing the strongest association in Model 3 (OR, 2.03; 95% CI, 1.89-2.18).

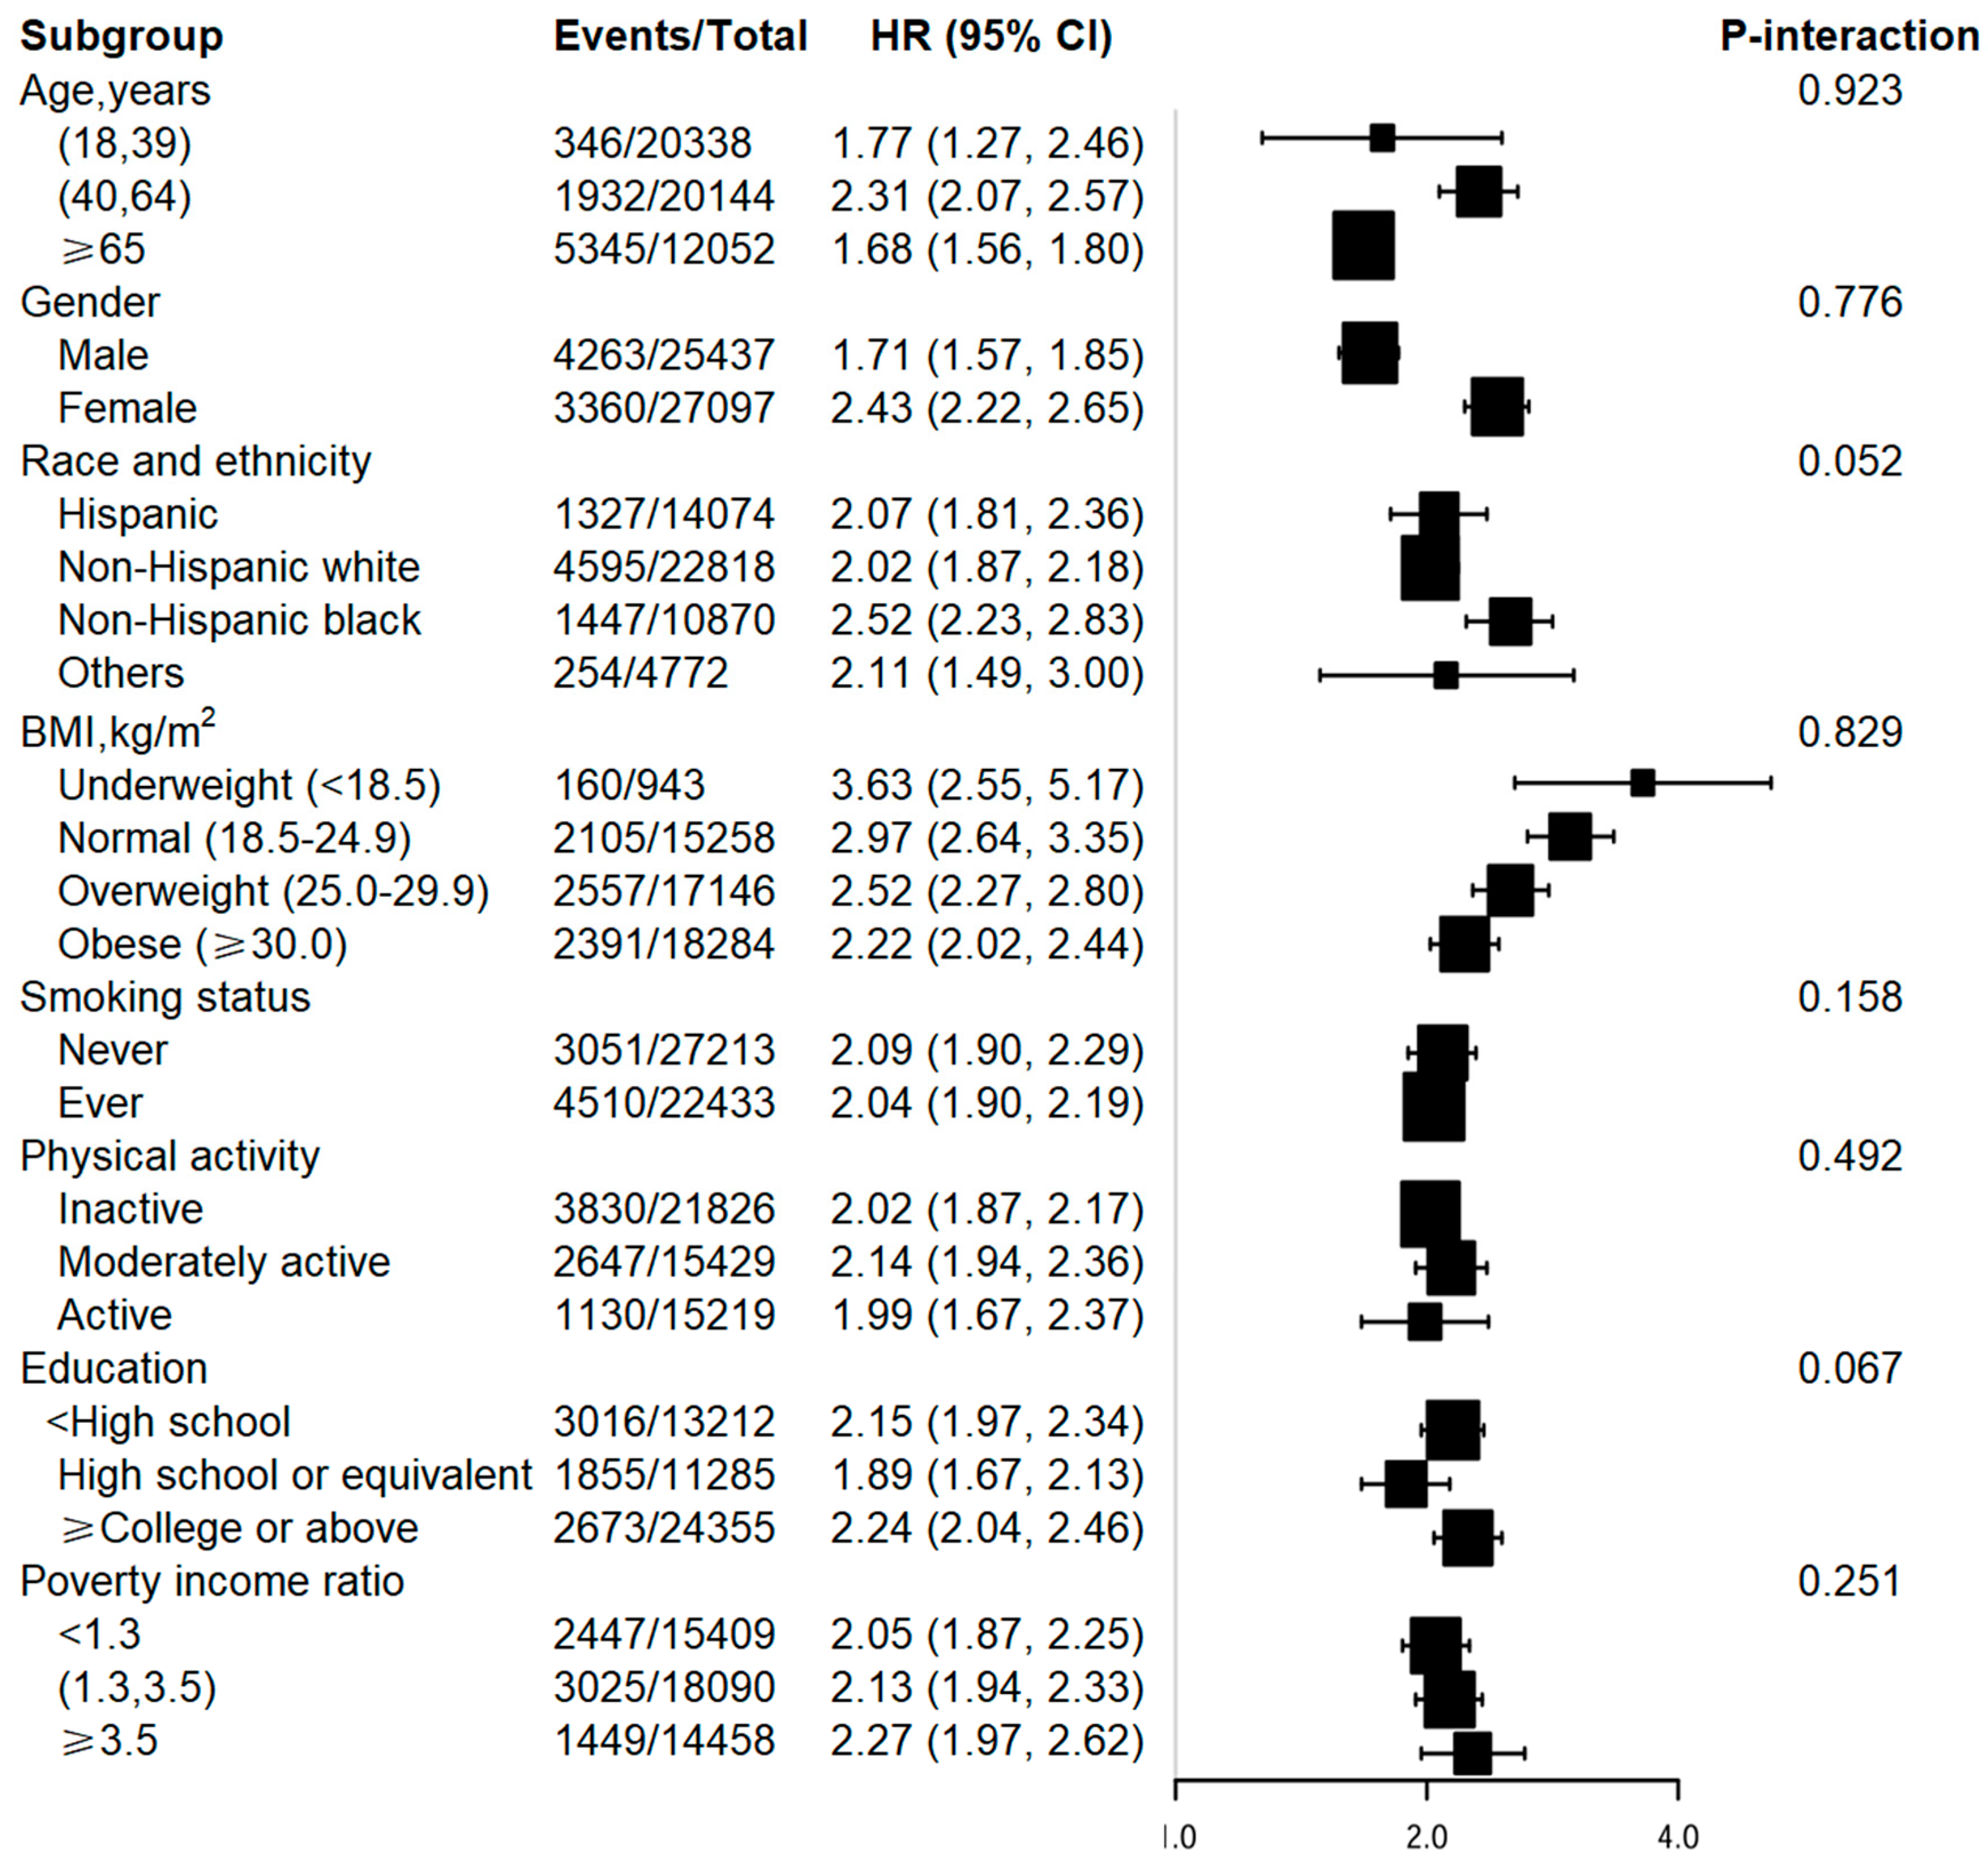
3.3. Stratified analyses and interaction tests

As shown in Figure 2, the stratified analysis verified that the UAR level was positively correlated with all-cause death, and all p-values for interaction>0.05, indicating that the association between the UAR level and all-cause death was not affected by confounding factors.

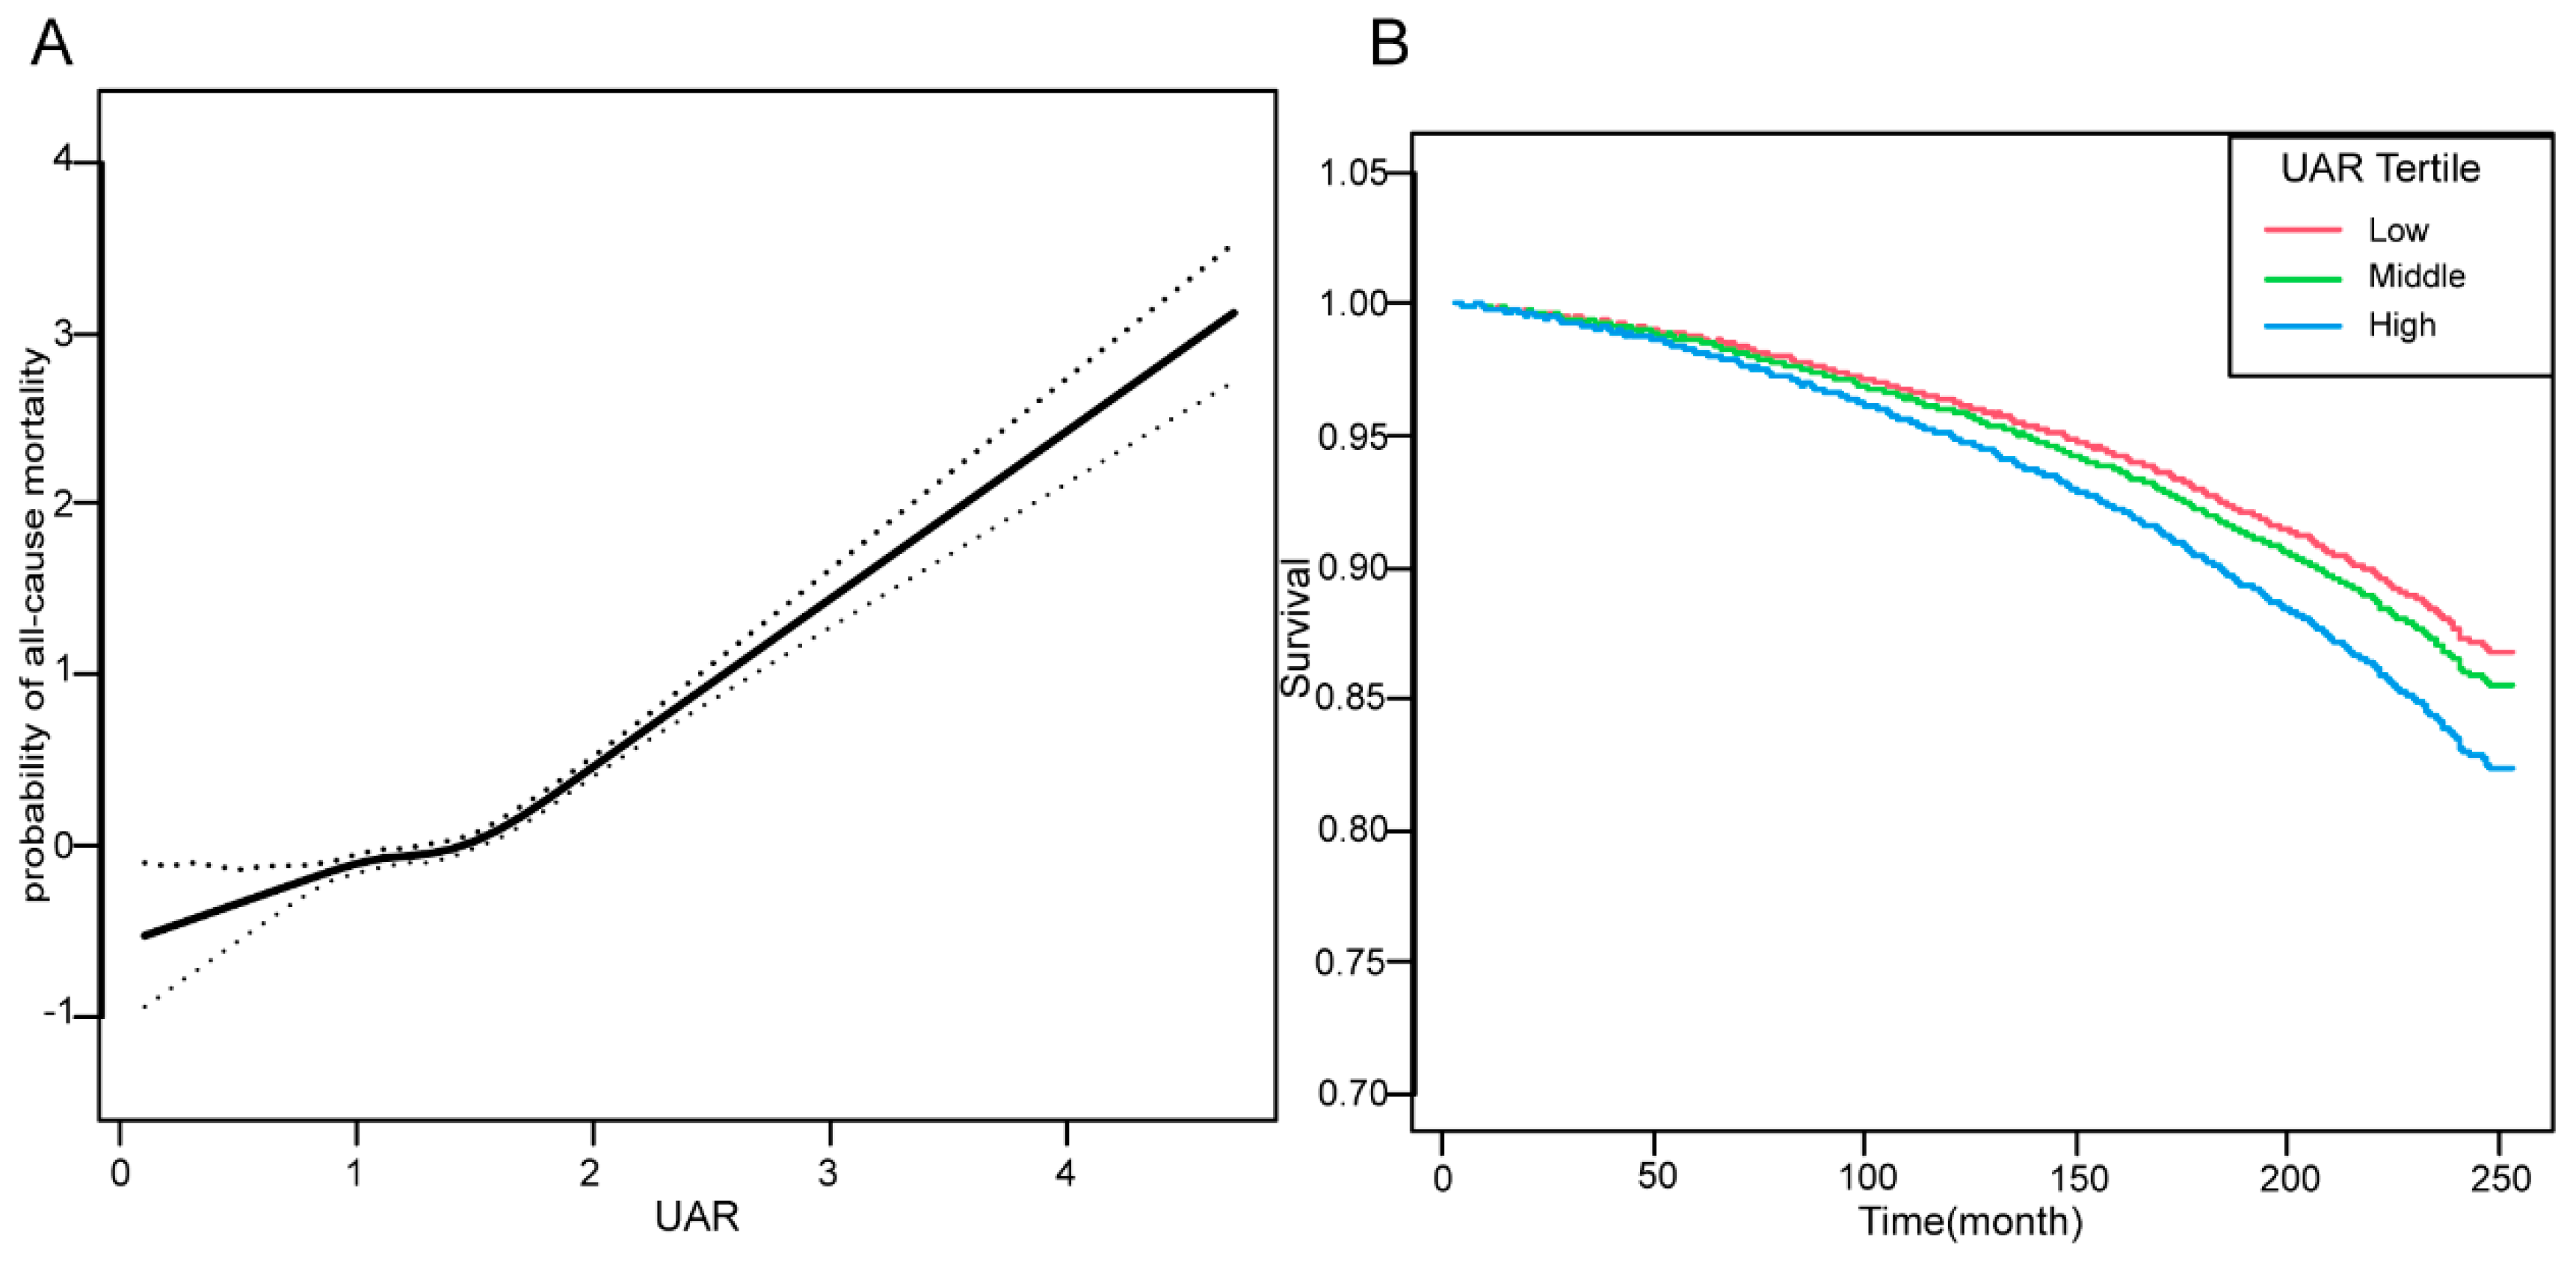
3.4. Dose‒response and Kaplan-Meier curves

In Figure 3, A nonlinear relationship between UAR and the risk of all-cause mortality was identified using the Cox model with restricted cubic spline analysis(A). Kaplan-Meier curves for overall survival according to UAR tertiles are presented (B).

3.5. Mediation analysis of hypertension

Table 4 presents the results of the mediation analysis examining the role of hypertension in the relationship between UAR and all-cause mortality. The total estimate effect of UAR on mortality was found to be -234.86 (95% CI: -269.03, -202.50), indicating a strong association. Hypertension partially mediated this effect, with a mediation effect estimate of -14.34 (95% CI: -18.02, -10.67). The direct effect of UAR, independent of hypertension, was also significant, with an estimate of -220.52 (95% CI: -253.98, -188.51). The proportion of the effect mediated by hypertension was 6.09% (95% CI: 4.68%, 7.72%), indicating that while hypertension contributes to the UAR-mortality link, the majority of the effect is direct. The analysis was adjusted for a number of confounding variables, including age, gender, race and ethnicity, BMI, smoking status, physical activity, education, poverty income ratio, high cholesterol, and diabetes. This adjustment serves to strengthen the validity of the observed associations. The model utilized for the mediation analysis is illustrated in Figure 4.

4. Discussion

The relationship between uric acid to albumin ratio (UAR) and mortality has received increasing attention in recent years, particularly as researchers seek to identify novel biomarkers that may aid in the early detection of individuals at risk for adverse health outcomes. Our study provides compelling evidence of the relationship between UAR, hypertension and mortality, demonstrating that higher UAR levels are significantly associated with an increased risk of all-cause mortality and specific cause-related mortality, particularly heart disease and nephropathy. This finding is consistent with previous research that has established UAR as a potential prognostic marker in cardiovascular health.
A number of studies have demonstrated the role of UAR in predicting cardiovascular outcomes. For example, Kalkan et al. reported that elevated UAR is associated with increased mortality in patients with ST-elevation myocardial infarction (STEMI) [8],and Yin et al. demonstrated that elevated UAR is an independent predictor of poorly developed coronary collateral circulation in patients with non-ST-elevation myocardial infarction (NSTEMI) [12], suggesting that UAR may serve as a valuable prognostic indicator in acute coronary syndromes. Similarly, Zhang et al. reported that UAR serves as a novel predictor of coronary slow-flow phenomenon in patients with chronic coronary syndromes, further supporting the role of UAR in cardiovascular risk assessment [2]. In addition, Li et al. identified UAR as an independent predictor of long-term cardiac mortality in patients with unstable angina after percutaneous coronary intervention (PCI) [9],and Sultana et al. evaluated UAR as a marker of coronary artery disease severity in acute coronary syndrome, suggesting its potential utility in identifying high-risk patients [13]. These findings highlight the potential of UAR as a biomarker that reflects the underlying pathophysiological processes associated with cardiovascular disease.
Hypertension is a well-established risk factor for cardiovascular disease and mortality, and its interplay with UAR is worthy of particular note. Our findings reinforce the notion that UAR could serve as a valuable tool for risk stratification in clinical practice, as they underscore the graded relationship between UAR tertiles and hypertension risk. This is particularly significant in light of the shortcomings of conventional risk assessment instruments, which may not fully encompass the intricate biological mechanisms underlying disease pathogenesis. The identification of UAR as a potential biomarker for the early identification of individuals at higher risk of adverse health outcomes could facilitate targeted interventions aimed at reducing cardiovascular risk. The present study revealed a robust correlation between hypertension and mortality, with a hazard ratio of 1.44, indicating that individuals with hypertension are at a markedly elevated risk of mortality. This finding is consistent with the results reported by Liu et al., who identified UAR as a significant factor associated with quantitative flow ratio, a measure of coronary artery function, in patients with suspected coronary artery disease [14]. The mediation analysis conducted in the present study demonstrated that hypertension plays a partial mediating role in the relationship between UAR and mortality, with a mediation effect estimate of -14.34 and a proportion mediated of 6.09%. This suggests that UAR may influence mortality risk through both hypertension-dependent and -independent pathways. This finding is consistent with the work of Özgür et al., who identified UAR as a predictive marker of short-term mortality in patients with acute kidney injury, thereby highlighting its relevance beyond cardiovascular contexts [10] .
The mechanisms underlying the association between uric acid levels, hypertension, and mortality are complex and likely involve inflammatory processes, oxidative stress, and endothelial dysfunction. Uric acid is recognized for its pro-inflammatory properties. Elevated uric acid levels have been demonstrated to contribute to endothelial dysfunction and increased vascular resistance, which are key factors in the development of hypertension and subsequent cardiovascular events [3,15,16]. Furthermore, albumin possesses antioxidant properties and plays a crucial role in maintaining vascular integrity. Low serum albumin levels can indicate systemic inflammation and poor nutritional status, further complicating the clinical picture [17,18,19]. The uric acid-to-albumin ratio (UAR) is a biomarker that reflects the balance between uric acid and serum albumin levels and is associated with various pathological conditions, including inflammation and oxidative stress, both of which are known factors contributing to hypertension and its related complications, thereby reinforcing the association between inflammation, oxidative stress and the mortality relationship.
It is essential to contextualize the findings of our study within the framework of its inherent strengths and limitations. A significant advantage is the large sample size of general population and the comprehensive adjustment for potential confounding variables, which enhances the generalizability of the findings. Nevertheless, as with any observational study, we are unable to establish causality and must consider the possibility of residual confounding despite our extensive adjustments. Furthermore, the focus of our study on a single population may restrict the generalizability of our findings to other demographic groups.

5. Conclusions

The results of our study indicate a significant correlation between UAR, hypertension, and mortality, suggesting that UAR may serve as a potential biomarker for early risk identification. This highlights the necessity for further investigation into UAR-targeted antioxidant interventions for the improvement of clinical outcomes.

Author Contributions

YZY and MQC designed the study, FDJ and SCM performed the literature search, and YZY and MQC collected and organized the data. YZY and MQC performed the data analysis and interpretation. All authors finalized the manuscript.

Funding

This research received no external funding.

Ethics approval and consent

The NHANES was approved by the National Institute of Health Research Ethics Review Board. All the participants signed and provided informed consent.

Data Availability Statement

Details of all variables and data are publicly available on the NHANES website, https://wwwn.cdc.gov/nchs /nhanes/Default.aspx

Acknowledgments

Not applicable.

Conflicts of Interest

The authors declare no conflicts of interest.

Appendix A

Table A1. Hazard ratios for mortality by UAR.
Mortality No. of events Model 1 Model 2 Model 3
HR (95%CI) p-value HR (95%CI) p-value HR (95%CI) p-value
All-cause 7623 3.65 (3.47, 3.85) <0.0001 1.99 (1.88, 2.12) <0.0001 1.91 (1.77, 2.05) <0.0001
Cause-specific
Malignant Neoplasm 1646 1.38 (1.22, 1.56) <0.0001 1.25 (1.10, 1.42) 0.0007 1.28 (1.09, 1.51) 0.0023
Heart Disease 1962 1.48 (1.33, 1.63) <0.0001 1.49 (1.34, 1.66) <0.0001 1.52 (1.33, 1.73) <0.0001
Respiratory Disease 412 1.52 (1.19, 1.94) 0.0007 1.43 (1.11, 1.84) 0.0058 1.27 (0.90, 1.79) 0.1814
Cerebrovascular Disease 434 1.68 (1.31, 2.16) <0.0001 1.44 (1.10, 1.89) 0.0089 1.47 (1.04, 2.06) 0.0278
Alzheimer Disease 283 1.14 (0.80, 1.63) 0.4593 1.23 (0.84, 1.80) 0.2797 1.45 (0.83, 2.54) 0.196
Diabetes 277 1.48 (1.18, 1.84) 0.0006 1.53 (1.21, 1.93) 0.0003 1.59 (1.17, 2.16) 0.0032
Nephropathy 165 2.25 (1.62, 3.12) <0.0001 2.78 (1.96, 3.93) <0.0001 2.44 (1.59, 3.77) <0.0001
Other cause 2444 3.79 (3.43, 4.18) <0.0001 2.08 (1.87, 2.32) <0.0001 2.03 (1.77, 2.32) <0.0001
Abbreviations: UAR, serum uric acid to albumin ratio; HR, hazard ratio; 95% Cl, 95% confidence interval. Model 1 adjust for None. Model 2 adjusted for: Age, Sex, Race and ethnicity. Model 2 adjusted for: Age, Sex, Race and ethnicity, BMI, Smoking status, Physical activity, Education, Poverty income ratio, High Cholesterol, Diabetes.
Table A2. Hazard ratios for cause-specific mortality by UAR tertiles.
Cause-specific
mortality
No. of events Model 1 Model 2 Model 3
HR (95%CI) p-value HR (95%CI) p-value HR (95%CI) p-value
Malignant Neoplasm 1646
 T1 296 Ref. Ref. Ref.
 T2 517 1.05 (0.93, 1.20) 0.4215 0.99 (0.87, 1.12) 0.8438 1.01 (0.86, 1.17) 0.9376
 T3 833 1.26 (1.12, 1.42) 0.0001 1.14 (1.00, 1.28) 0.0442 1.13 (0.97, 1.32) 0.126
Heart Disease 1962
 T1 317 Ref. Ref. Ref.
 T2 513 1.05 (0.94, 1.18) 0.3619 1.02 (0.91, 1.15) 0.6753 1.04 (0.90, 1.19) 0.6096
 T3 1132 1.27 (1.14, 1.42) <0.0001 1.25 (1.12, 1.40) <0.0001 1.26 (1.10, 1.44) 0.0008
Respiratory Disease 412
 T1 99 Ref. Ref. Ref.
 T2 112 1.08 (0.84, 1.40) 0.5271 1.05 (0.81, 1.36) 0.6864 0.89 (0.64, 1.24) 0.5014
 T3 201 1.24 (0.99, 1.56) 0.0669 1.19 (0.93, 1.51) 0.1599 1.00 (0.73, 1.37) 0.9874
Cerebrovascular Disease 434
 T1 77 Ref. Ref. Ref.
 T2 129 0.96 (0.75, 1.23) 0.7583 0.85 (0.66, 1.10) 0.2097 0.87 (0.63, 1.22) 0.4286
 T3 228 1.27 (1.00, 1.61) 0.0495 1.01 (0.78, 1.31) 0.9437 1.07 (0.77, 1.49) 0.6853
Alzheimer Disease 283
 T1 73 Ref. Ref. Ref.
 T2 101 0.98 (0.73, 1.33) 0.9146 0.97 (0.71, 1.32) 0.835 1.27 (0.85, 1.91) 0.2392
 T3 109 0.98 (0.73, 1.33) 0.9165 0.95 (0.69, 1.31) 0.773 1.03 (0.68, 1.58) 0.8789
Diabetes 277
 T1 42 Ref. Ref. Ref.
 T2 71 1.03 (0.77, 1.37) 0.861 1.04 (0.78, 1.40) 0.7708 1.22 (0.84, 1.78) 0.3011
 T3 164 1.60 (1.20, 2.15) 0.0016 1.73 (1.28, 2.34) 0.0004 1.89 (1.27, 2.79) 0.0015
Nephropathy 165
 T1 22 Ref. Ref. Ref.
 T2 32 1.25 (0.83, 1.90) 0.2817 1.57 (1.01, 2.42) 0.0433 1.12 (0.62, 2.04) 0.6985
 T3 111 2.43 (1.66, 3.57) <0.0001 2.99 (1.98, 4.53) <0.0001 3.35 (2.01, 5.57) <0.0001
Other cause 2444
 T1 469 Ref. Ref. Ref.
 T2 718 1.33 (1.19, 1.50) <0.0001 0.99 (0.88, 1.12) 0.8847 1.14 (0.99, 1.32) 0.0726
 T3 1257 2.40 (2.16, 2.67) <0.0001 1.33 (1.19, 1.49) <0.0001 1.41 (1.22, 1.63) <0.0001
Abbreviations: UAR, serum uric acid to albumin ratio; HR, hazard ratio; 95% Cl, 95% confidence interval. Model 1 adjust for None. Model 2 adjusted for: Age, Sex, Race and ethnicity. Model 2 adjusted for: Age, Sex, Race and ethnicity, BMI, Smoking status, Physical activity, Education, Poverty income ratio, High Cholesterol, Diabetes.

References

  1. You J, Guo Y, Zhang Y, et al. Plasma proteomic profiles predict individual future health risk. Nature communications. 2023;14(1):7817. [CrossRef]
  2. Zhang XJ, Hou AJ, Luan B, Wang CF, Li JJ. Uric acid to albumin ratio as a novel predictor for coronary slow flow phenomenon in patients with chronic coronary syndrome and non-obstructive coronary arteries. BMC cardiovascular disorders. 2024;24(1):358. [CrossRef]
  3. Borghi C, Agnoletti D, Cicero AFG, Lurbe E, Virdis A. Uric Acid and Hypertension: a Review of Evidence and Future Perspectives for the Management of Cardiovascular Risk. Hypertension (Dallas, Tex : 1979). 2022;79(9):1927-1936. [CrossRef]
  4. Lanaspa MA, Andres-Hernando A, Kuwabara M. Uric acid and hypertension. Hypertension research : official journal of the Japanese Society of Hypertension. 2020;43(8):832-834.
  5. Quinlan GJ, Martin GS, Evans TW. Albumin: biochemical properties and therapeutic potential. Hepatology (Baltimore, Md). 2005;41(6):1211-1219.
  6. Roche M, Rondeau P, Singh NR, Tarnus E, Bourdon E. The antioxidant properties of serum albumin. FEBS letters. 2008;582(13):1783-1787. [CrossRef]
  7. Çakmak E, Bayam E, Çelik M, et al. Uric Acid-to-Albumin Ratio: A Novel Marker for the Extent of Coronary Artery Disease in Patients with Non-ST-Elevated Myocardial Infarction. Pulse (Basel, Switzerland). 2021;8(3-4):99-107. [CrossRef]
  8. Kalkan S, Cagan Efe S, Karagöz A, et al. A New Predictor of Mortality in ST-Elevation Myocardial Infarction: The Uric Acid Albumin Ratio. Angiology. 2022;73(5):461-469. [CrossRef]
  9. Li S, Chen H, Zhou L, Cui H, Liang S, Li H. The uric acid to albumin ratio: a novel predictor of long-term cardiac mortality in patients with unstable angina pectoris after percutaneous coronary intervention. Scandinavian journal of clinical and laboratory investigation. 2022;82(4):304-310. [CrossRef]
  10. Özgür Y, Akın S, Yılmaz NG, Gücün M, Keskin Ö. Uric acid albumin ratio as a predictive marker of short-term mortality in patients with acute kidney injury. Clinical and experimental emergency medicine. 2021;8(2):82-88. [CrossRef]
  11. Wang X, Deng C, Guo F, Zhong L, Gao H. The Preoperative Uric Acid-to-Albumin Ratio as a New Indicator to Predict Long-Term Prognosis After Surgery for Patients with Acute Type A Aortic Dissection. The heart surgery forum. 2023;26(1):E001-e008. [CrossRef]
  12. Yin R, Ye Z, You H, Wu Y, Chen W, Jiang T. Elevated uric acid/albumin ratio as a predictor of poor coronary collateral circulation development in patients with non-ST segment elevation myocardial infarction. Clinical cardiology. 2024;47(1):e24215.
  13. Sultana S, K MS, Prakash VR, et al. Evaluation of Uric Acid to Albumin Ratio as a Marker of Coronary Artery Disease Severity in Acute Coronary Syndrome: A Cross-Sectional Study. Cureus. 2023;15(11):e49454. [CrossRef]
  14. Liu J, Wei H, Zhu X, Liu H, Jin L. Contrasting the relationship of serum uric acid/albumin ratio on quantitative flow ratio with other multiple composite parameters in patients with suspected coronary artery disease. BMC cardiovascular disorders. 2024;24(1):146. [CrossRef]
  15. Copur S, Demiray A, Kanbay M. Uric acid in metabolic syndrome: Does uric acid have a definitive role? European journal of internal medicine. 2022;103:4-12.
  16. Kimura Y, Tsukui D, Kono H. Uric Acid in Inflammation and the Pathogenesis of Atherosclerosis. International journal of molecular sciences. 2021;22(22). [CrossRef]
  17. Dong Y, Xu W, Liu S, Xu Z, Qiao S, Cai Y. Serum albumin and liver dysfunction mediate the associations between organophosphorus pesticide exposure and hypertension among US adults. The Science of the total environment. 2024;948:174748. [CrossRef]
  18. Jiang H, Lan X, Zhou L, Xie X. Association between albumin-corrected anion gap and kidney function in individuals with hypertension - NHANES 2009-2016 cycle. Renal failure. 2024;46(2):2416719. [CrossRef]
  19. Manolis AA, Manolis TA, Melita H, Mikhailidis DP, Manolis AS. Low serum albumin: A neglected predictor in patients with cardiovascular disease. European journal of internal medicine. 2022;102:24-39. [CrossRef]
Figure 1. Flowchart of study population.
Preprints 141490 g001
Figure 2. Relationships between UAR and all-cause mortality according to stratified analysis.
Preprints 141490 g002
Figure 3. The nonlinear relationship between UAR and all-cause mortality was found in restricted cubic spline regression model (RCS), solid rad line represents the smooth curve fit between variables, dotted line represents the 95% of confidence interval from the fit(A); Kaplan-Meier curve for overall survival according to UAR tertile. All models adjusted for Age, Sex, Race and ethnicity, BMI, Smoking status, Physical activity, Education, Poverty income ratio, High Cholesterol, Diabetes, Hypertension(B).
Preprints 141490 g003
Figure 4. The causal mediation analysis model for the 52534 adult participants in the 1999–2018 National Health and Nutrition Survey. UAR is the exposure factor, all-cause mortality is the outcome and hypertension is the mediator.
Preprints 141490 g004
Table 1. Baseline characteristics of the participants by UAR tertiles.
Variables Total T1(0.1-1.0) T2(1.1-1.3) T3(1.4-4.7) P-value
Number 52534 14441 17944 20149
Age, year 47.50(19.23) 42.92(18.22) 46.35(19.06) 51.82(19.17) <0.001
Sex (Male) 25437 (48.42%) 3256 (22.55%) 8918 (49.70%) 13263 (65.82%) <0.001
Race and ethnicity <0.001
Hispanic 14074 (26.79%) 4591 (31.79%) 5106 (28.46%) 4377 (21.72%)
Non-Hispanic white 22818 (43.43%) 6030 (41.76%) 7764 (43.27%) 9024 (44.79%)
Non-Hispanic black 10870 (20.69%) 2522 (17.46%) 3439 (19.17%) 4909 (24.36%)
Others 4772 (9.08%) 1298 (8.99%) 1635 (9.11%) 1839 (9.13%)
Poverty income ratio <0.001
<1.3 15409 (32.13%) 4468 (33.99%) 5246 (31.98%) 5695 (30.94%)
(1.3,3.5) 18090 (37.72%) 4759 (36.21%) 6167 (37.59%) 7164 (38.92%)
≥3.5 14458 (30.15%) 3917 (29.80%) 4991 (30.43%) 5550 (30.15%)
Education <0.001
<High school 13212 (27.04%) 3386 (25.84%) 4507 (27.24%) 5319 (27.70%)
High school or equivalent 11285 (23.10%) 2776 (21.18%) 3789 (22.90%) 4720 (24.58%)
College or above 24355 (49.85%) 6943 (52.98%) 8247 (49.85%) 9165 (47.72%)
BMI, kg/m² 28.74(6.80) 25.83(5.40) 28.33(6.17) 31.23(7.32) <0.001
Smoking status (ever) 22433 (45.19%) 5095 (38.04%) 7534 (44.76%) 9804 (50.48%) <0.001
Physical activity <0.001
Inactive 21826 (41.59%) 5539 (38.40%) 7050 (39.32%) 9237 (45.90%)
Moderately active 15429 (29.40%) 4679 (32.44%) 5277 (29.43%) 5473 (27.20%)
Active 15219 (29.00%) 4205 (29.15%) 5602 (31.25%) 5412 (26.90%)
Hypertension 17074 (32.65%) 2960 (20.59%) 5136 (28.77%) 8978 (44.74%) <0.001
Diabetes 5919 (11.50%) 1222 (8.57%) 1743 (9.90%) 2954 (15.06%) <0.001
Heart disease 2145 (4.39%) 293 (2.24%) 581 (3.51%) 1271 (6.62%) <0.001
Stroke 1840 (3.77%) 310 (2.36%) 533 (3.22%) 997 (5.19%) <0.001
Cancer 4429 (9.06%) 960 (7.32%) 1434 (8.67%) 2035 (10.59%) <0.001
High Cholesterol 15283 (37.8%) 3257 (30.9%) 4999 (36.8%) 7027 (43.1%) <0.001
Uric acid, mg/dL 5.40(1.46) 3.82 (0.62) 5.12(0.57) 6.79 (1.09) <0.001
Albumin, g/dL 4.24(0.37) 4.31(0.35) 4.27(0.36) 4.16(0.38) <0.001
UAR 1.28(0.36) 0.88 (0.12) 1.20 (0.08) 1.64 (0.27) <0.001
Notes: Continuous and categorical variables were presented as mean ± SD or percentages. Abbreviations: UAR, serum uric acid to albumin ratio; BMI, body mass index.
Table 2. The hazard ratios of mortality according to UAR and hypertension.
Exposure No. of events HR (95%CI), P-value
Model 1 Model 2 Model 3
UAR 7623 3.65 (3.47, 3.85) <0.0001 1.99 (1.88, 2.12) <0.0001 1.91 (1.77, 2.05) <0.0001
UAR Tertile
T1 1395 Reference Reference Reference
T2 2193 1.35 (1.26, 1.44) <0.0001 0.99 (0.93, 1.06) 0.8085 1.11 (1.02, 1.20) 0.0156
T3 4035 2.46 (2.31, 2.61) <0.0001 1.32 (1.24, 1.41) <0.0001 1.37 (1.27, 1.49) <0.0001
p for trend <0.0001 <0.0001 <0.0001
Hypertension
No 3196 Reference Reference Reference
Yes 4387 3.57 (3.41, 3.74) <0.0001 1.44 (1.38, 1.51) <0.0001 1.44 (1.36, 1.53) <0.0001
Abbreviations: UAR, serum uric acid to albumin ratio; HR, hazard ratio; 95% Cl, 95% confidence interval. Model 1 adjust for None. Model 2 adjusted for: Age, Sex, Race and ethnicity. Model 2 adjusted for: Age, Sex, Race and ethnicity, BMI, Smoking status, Physical activity, Education, Poverty income ratio, High Cholesterol, Diabetes, Hypertension.
Table 3. The association between UAR and hypertension.
Exposure No. of events OR (95%CI), P-value
Model 1 Model 2 Model 3
UAR 17074 4.61 (4.36, 4.87) <0.0001 3.73 (3.50, 3.97) <0.0001 2.69 (2.49, 2.92) <0.0001
UAR Tertile
T1 2960 Reference Reference Reference
T2 5136 1.56 (1.48, 1.64) <0.0001 1.50 (1.41, 1.59) <0.0001 1.31 (1.22, 1.40) <0.0001
T3 8978 3.12 (2.97, 3.28) <0.0001 2.71 (2.56, 2.87) <0.0001 2.03 (1.89, 2.18) <0.0001
p for trend <0.0001 <0.0001 <0.0001
Abbreviations: UAR, serum uric acid to albumin ratio; OR, odds ratio; 95% Cl, 95% confidence interval. Model 1 adjust for None. Model 2 adjusted for: Age, Sex, Race and ethnicity. Model 2 adjusted for: Age, Sex, Race and ethnicity, BMI, Smoking status, Physical activity, Education, Poverty income ratio, High Cholesterol, Diabetes.
Table 4. Mediation analysis for the associations between UAR and all-cause mortality.
Effect Estimate (95% CI) P-value
Total effect -234.86(-269.03, -202.50) <0.0001
Mediation effect (Hypertension) -14.34(-18.02, -10.67) <0.0001
Direct effect (UAR) -220.52(-253.98, -188.51) <0.0001
Proportion mediated (%) 6.09(4.68, 7.72) <0.0001
Abbreviations: UAR, serum uric acid to albumin ratio; 95% Cl, 95% confidence interval. Adjusted for: Age, Sex, Race and ethnicity, BMI, Smoking status, Physical activity, Education, Poverty income ratio, High Cholesterol, Diabetes.
Disclaimer/Publisher’s Note: The statements, opinions and data contained in all publications are solely those of the individual author(s) and contributor(s) and not of MDPI and/or the editor(s). MDPI and/or the editor(s) disclaim responsibility for any injury to people or property resulting from any ideas, methods, instructions or products referred to in the content.
Copyright: This open access article is published under a Creative Commons CC BY 4.0 license, which permit the free download, distribution, and reuse, provided that the author and preprint are cited in any reuse.
Prerpints.org logo

Preprints.org is a free preprint server supported by MDPI in Basel, Switzerland.

Subscribe

Disclaimer

Terms of Use

Privacy Policy

Privacy Settings

© 2025 MDPI (Basel, Switzerland) unless otherwise stated