1. Introduction
In the 2024/25 harvest year, over 794 million tons of wheat were grown and processed worldwide by the leading industrial nations alone [
1]. A large proportion of this amount is used for the production of wheat flour, which is mainly processed into food by bakeries and other manufacturers. The main components of wheat flour are starch, which makes up approx. 75-80% of the dry matter, and protein, which accounts for approx. 10-15% of the dry matter [
2]. The protein content of wheat flour correlates directly with the resulting baked goods volume [
3,
4]. The protein content of wheat flour is therefore a decisive quality factor and the basis for price determination [
5,
6]. The composition of the wheat, as well as the protein content, is subject to regional and seasonal fluctuations as well as climate change [
7]. As a result of recently arising stricter national regulations over the use of fertilizer, the produced flour already shows a decrease in protein content, as less nitrogen gets incorporated into the soil and therefore less protein can be formed in the wheat grain [
8]. In addition, inconsistent protein contents in the millers industry must be balanced to ensure consistent output quality. For this reason, it is important to be able to adjust the protein content of wheat flour using simple separation processes during the milling. Existing methods are mixing different flour batches and adjustment of the protein content by subsequent air classification after milling. Here, flour is further comminuted, which breaks up the solid structure of the grain into smaller particles, partially resulting in separate protein and starch particles in the flour [
9]. The mostly smaller protein particles can then be separated by air classification based on the particle size, which allows the protein content to be enriched [
10]. However, this method is only used to a limited extent in practice due to high costs and low separation efficiency due to similar particle size distributions of the starch and protein particles [
11]. A new method that would enable the inline adjustment of the protein content during milling is the triboelectric separation of wheat flour. The separation characteristic is the charge of the particles instead of the size or the density. Here, the particles in the flour are electrostatically charged by the triboelectric effect, whereby starch particles usually become negatively and protein particles usually become positively charged during a contact between each other [
12,
13,
14]. The triboelectric effect is based on an exchange of charge of two surfaces brought into contact and being separated again. The contact can take place through a collision or through a sliding movement of the surfaces. During this contact, charge is transferred between the surfaces, which then remains on the surface [
15,
16]. Oppositely charged particles can then be separated in an electric field [
17].
The actual separation process consists of particles being attracted to or deflected in the direction of the oppositely charged electrode due to their charge in an electric field, whereby the electric field strength, mass of the particles and their charge as well as the residence time are decisive influencing factors [
14,
17]. In addition to the separation setup, the charging section in which the particles are charged plays a central role in the separation performance. Different setups are used here: In addition to a tube and a chute as a charging section, a distinction is also made between rotating systems [
18,
19,
20]. These differ primarily in the way the particles are charged. While in rotating systems, such as cyclones, powders are primarily charged by particle-particle collisions [
21], the powder in a chute is mainly charged by particle-wall interactions [
22]. In tubes, particle charging occurs through both particle-wall and particle-particle collisions [
19,
23]. The triboelectric separation process is already used for mineral processing and plastics recycling on an industrial scale [
24]. However, the triboelectric separation of fine organic raw materials is still in its infancy and not yet used on an industrial scale. In previous studies it has been shown that triboelectric separation can be employed to concentrate protein in bean, soybean and sunflower powder [
25,
26]. For example, the protein content of bean and soy powder could be enriched by over 25%. Although it is known that the separation performance is highly product-dependent, to date, only limited data are available on the enrichment of protein in wheat flour. For inline standardization of the protein content during milling, a shift of the protein content of 1-2% would be sufficient. However, the influence of the process parameters on triboelectric separation of wheat flour is not yet understood. The scientific main aim is to get more insight into the factors influencing the feeding of the flour, the charging of the particles and the separation of the particles in the separator. In the triboelectric separation of lupins, researchers have identified the design and conditions in the charging section as the most important factor influencing the triboelectric separation result [
12,
26]. Therefore, in this work, the influence of process and machine parameters of the charging section on the triboelectric separation of wheat flour is examined and discussed in detail. The aim of this work is to investigate the influence of the key parameters of the charging section and the mass flow rate on the separation performance and to draw conclusions from this.
2. Materials and Methods
2.1. Materials and Equipment
In all experiments, a single-variety wheat flour of the Altdorfer Mühle GmbH (Altdorf, Germany), type 550, variety Asory, which was milled on 23.09.2021, was used with a protein content of approx. 12% (db).
2.2. Methods
2.2.1. Structure and Function of the Separator
The separator which is described in detail in [
14] was used in the experiments and is shown in
Figure 1. The separator setup was modified to fit the requirements of the experiments for wheat flour.
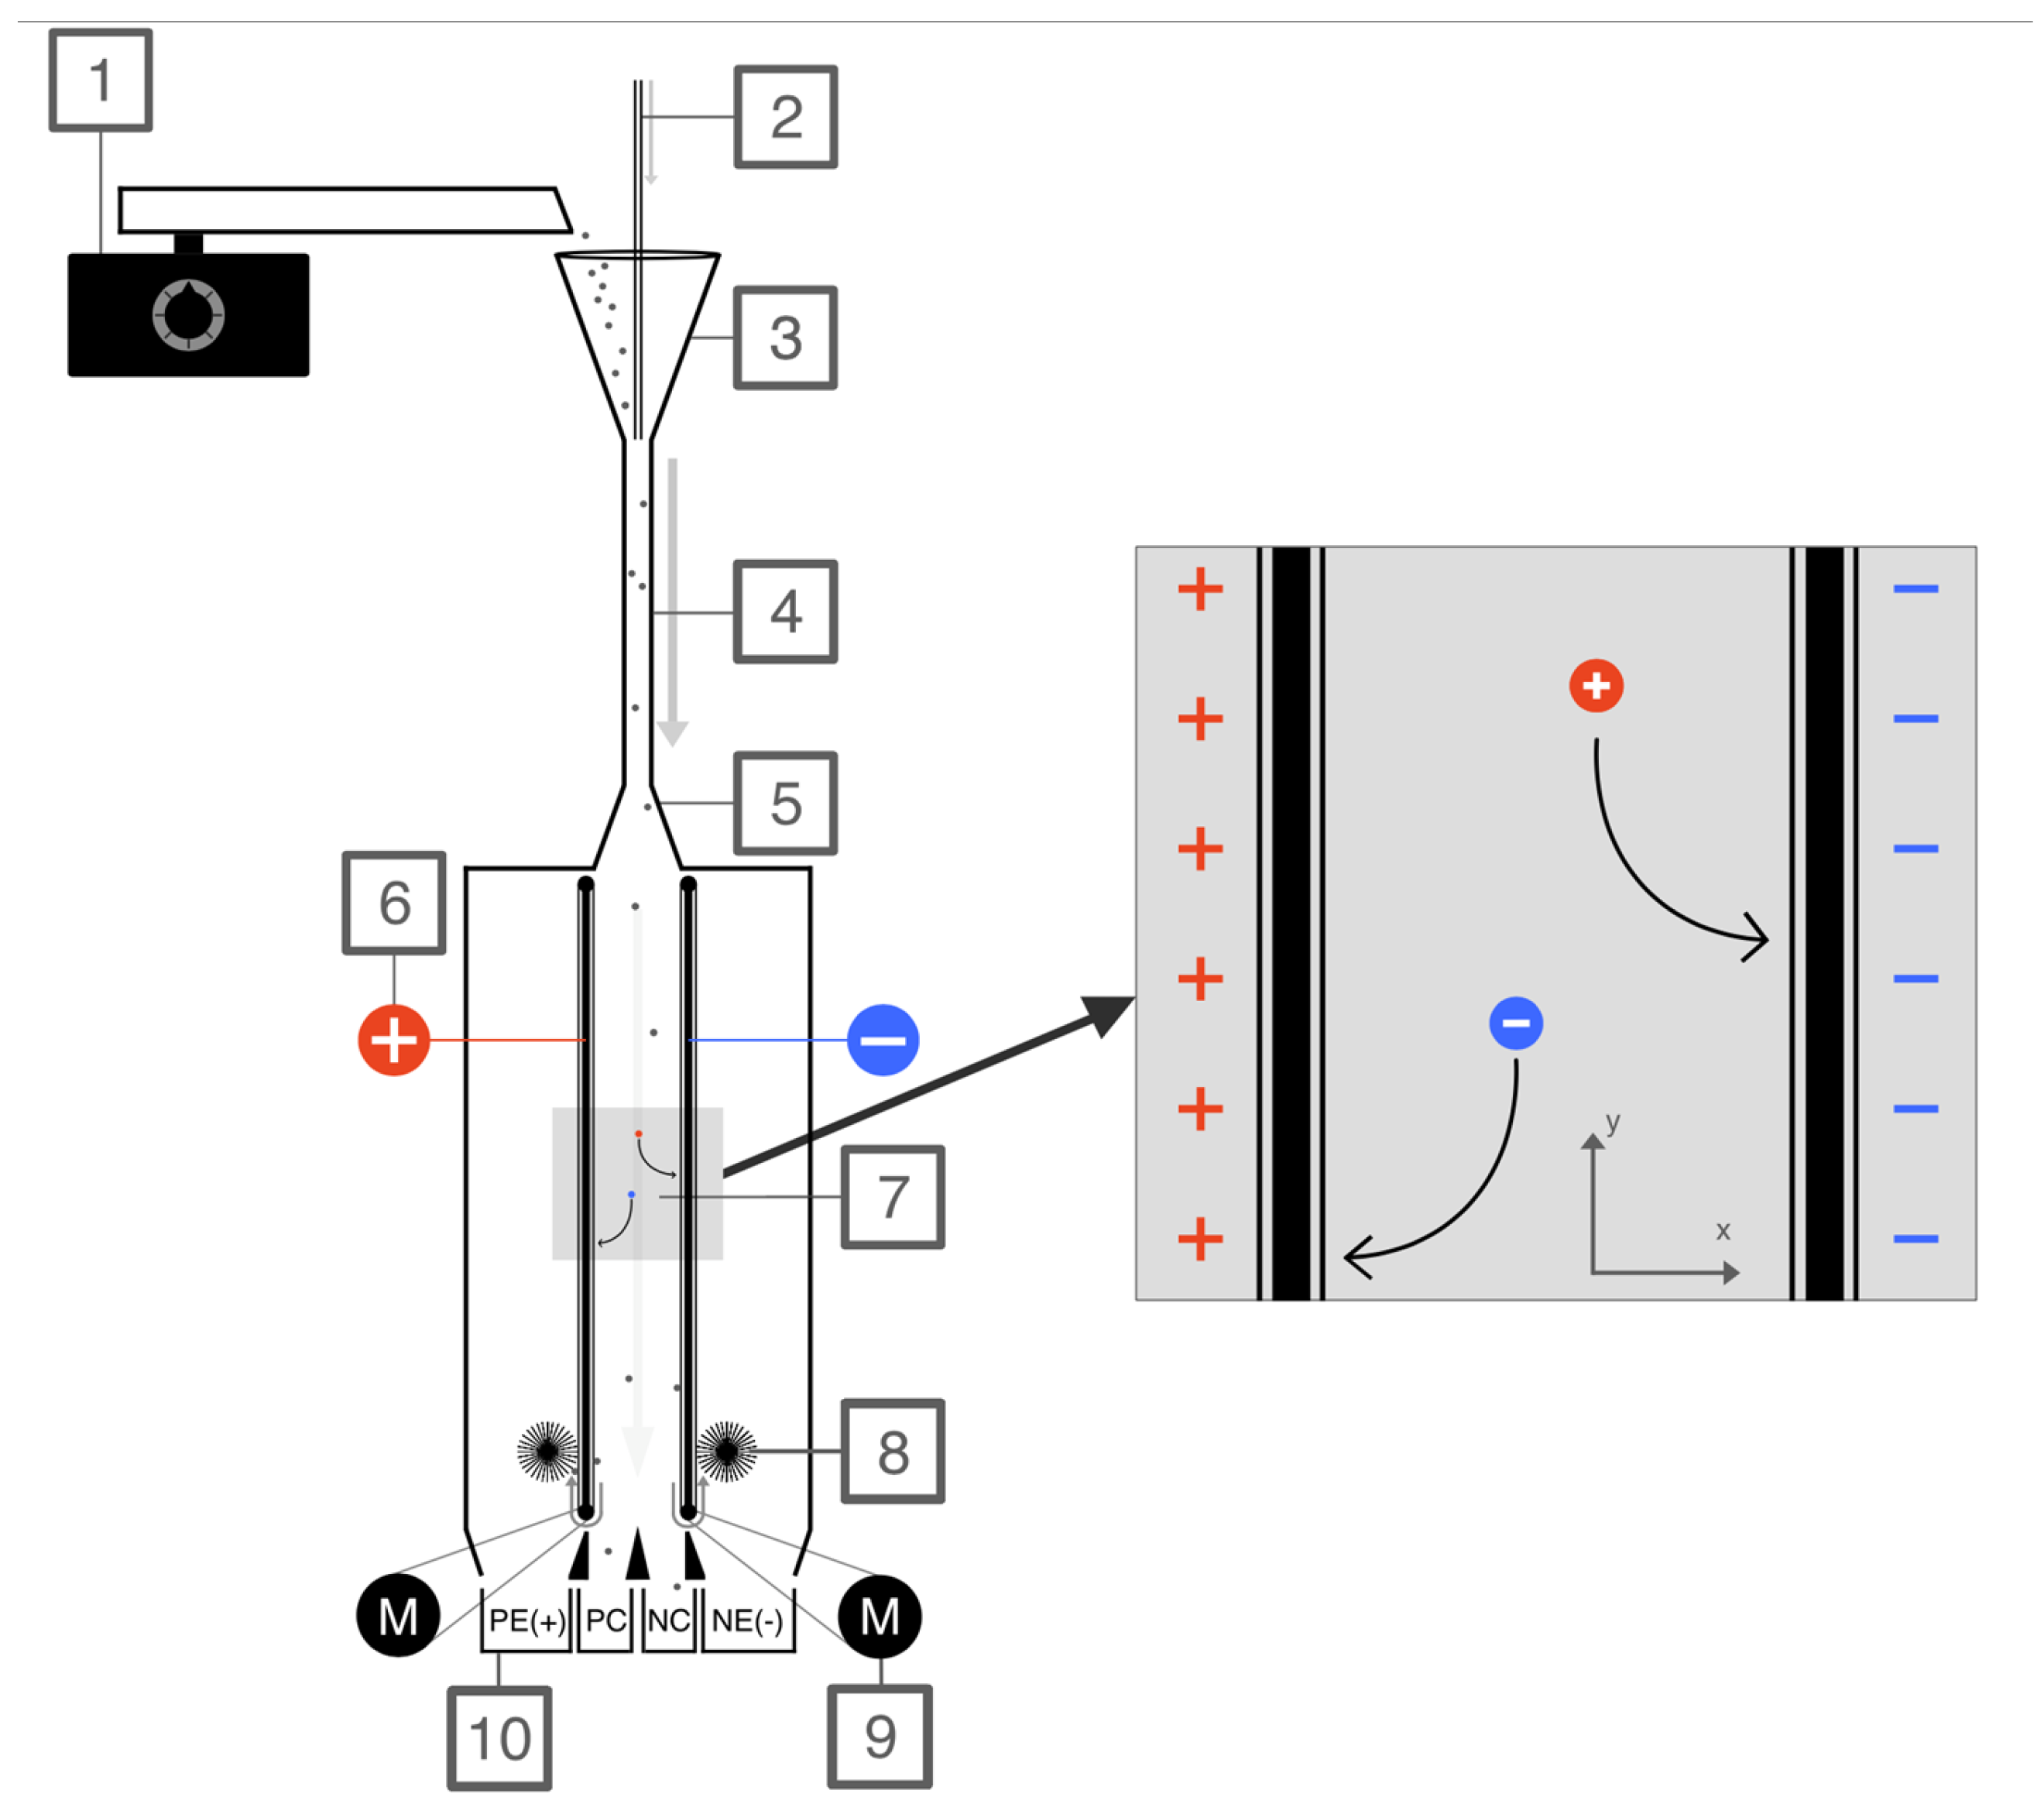
The powder is fed into the funnel with mass flows listed in Table 2 below via a vibrating conveyor (24.002, Fritsch GmbH, Idar-Oberstein, Germany). A grid is fitted at the outlet of the conveyor to ensure that no large lumps of powder are fed. Dry air with a volume flow of 2 m3*h-1 is fed into the funnel through a 6 mm diameter stainless steel pipe coaxial to the charging tube to disperse the powder. The powder is dispersed in the funnel using the air flow and conveyed to the charging section below. In the charging section, which is made of a PVC tube, the particles of the powder are triboelectrically charged by particle-wall and/or particle-particle contacts. The inlet represents the transition between the charging section and the separating section. The voltage source (HCE7-12500, FuG Elektronik GmbH, Schechen, Germany), which is connected to the positive electrode (+), induces a voltage of 12.5 kV. The negative electrode (-) is grounded via the voltage source. The electrodes are designed as parallel aluminum plates with a distance of 20 mm leading to an electrical field strength of 625 kV/m. The electrodes are covered with PVC belts (1.5 mm thickness) on the electrodes, which are driven by electric motors (919D Series, MFA Como Drills Ltd, Felderland, UK) using pulleys above and below the electrode and a belt connection coupled to the lower pulley. With the help of the pulleys, the belts rotate and the deposited powder can be continuously removed with the help of brushes which are located at the backside of the electrodes. The outlet finally separates the powder into four fractions. The external fractions (PE +, NE -) contain the powder that has been removed from the electrodes by the brushes. The powder that does not reach the electrodes is collected at the end of the gap and divided into two fractions, accounting for the left and right part of the gap between the electrodes (PC, NC).
2.2.2. Experimental Design
The length and the diameter of the charging section were varied in order to investigate the influence of the flow characteristics in the charging section on the target variable, protein shift
[wt%] (weight percent) (see Eq. 6). Parameters such as charging section material (PVC), flow rate of dry air (2 m
3*h
-1), mass flow of the flour (80 g*h
-1) and belt speed (0.01 m*s
-1) were kept constant to ensure comparability of the results. In previous experiments, a charging section with a length of 210 mm and a diameter of 8 mm was established. In addition, different mass flow rates of the flour were examined in order to be able to evaluate the influence of this.
Table 1 shows the key parameters which were varied or kept constant in the experiments.
In order to determine the influence of the length of the charging section a charging section with a length of 105 mm, with 210 mm, and a test without charging section was carried out (see
Table 2). The diameter was kept constant at 8 mm. Shortening the charging section means that the powder has a shorter residence time, thus reducing the frequency of particle-particle and particle-wall contacts.
In order to determine the influence of the diameter and thus the Reynolds number and residence time, charging sections with diameters of 6 and 10 mm were investigated in addition to the standard diameter of 8 mm (see
Table 2). The length of the charging section was kept constant at 210 mm.
In addition, the feed mass flow rate was varied by setting the values to 40, 80, 160 and 320 g*h-1. The fix parameters of the charging section were a length of 210 mm and a diameter of 8 mm. In order to make a statement about the influence of the individual parameter changes, we decided to vary only one parameter at a time. For each variation at least a double determination was carried out.
2.2.3. Moisture Content Determination
The moisture content of the samples was determined using the drying oven method. First, glass crucibles with lids were dried for 30 min at 130 °C in a drying oven and then cooled to room temperature in a desiccator for a further 30 min. Then approx. 1 g of sample was weighed into each glass crucible with a precision balance (TLE204, Mettler Toledo, Columbus, USA) which has a specified uncertainty of ±0.1 mg. The samples were then dried at 130 °C for 2 h in a drying oven. At the end of the drying time, the jars were resealed with the lid to prevent moisture absorption from the ambient air. They were then cooled to room temperature in a desiccator for 30 min.
The moisture content
[wt%] (weight percent) was calculated from the mass of the wet sample
[g] and the dry sample
[g] using equation (1):
A double determination was carried out for each sample and the mean value of the two measurements was calculated.
2.2.4. Protein Content Determination
The protein content of the samples was determined using the Dumas method [
27]. The organic elemental analyzer (vario MAX, Elementar Analysesysteme GmbH, Langenselbold, Germany) was used for the measurement (Method: Starch Powder). From the calculated absolute element content
[g] and the sample weight
[g], the element concentration
[wt%] of the sample can then be calculated using the daily factor
according to the following equation (2) (direct adaptation from the operating instructions of the organic elemental analyzer):
From the resulting element concentration of nitrogen
c, the protein concentration
[wt%] was determined using a specific protein factor
, which for wheat flour is 5.83 [
28]. The protein concentration
[wt%] is defined by equation (3):
During triboelectric separation the flour may be subject to drying, mainly due to the dry air used for dispersion. This effect must be taken into account in the calculations of protein content. The dry protein content
[wt%] of a sample is thus using the moisture content
[wt%] and the protein concentration of the wet sample
[wt%] to ensure comparability between samples and the starting material. Dry protein content
[wt%] is defined by equation (4):
2.2.4. Particle Size Distribution
The particle size distribution was determined using laser diffractometer (Helos R-Series KR, Sympatec, Clausthal, Germany). For this purpose, approx. 3-5 g of the powder to be examined was analyzed. The lenses of the type R3 and R5 were used in combination in each measurement. The powder was first analyzed with the R3 and then with the R5 lens and the measurement data was then combined. A measuring range of 0.5 to 875 µm is possible through this combination.
2.2.4. Parameters for Characterization of Separation
In order to characterize the triboelectric separation process, the most important parameters are defined below. As the water content changes during triboelectric separation, all values refer to dry weight. During the process, the added flour (standard or feed material, index "
0") is separated into several fractions (index "
i": two electrode fractions (PE +, NE -) and two fractions between the electrodes (PC, NC), see
Figure 1). The mass yield
α [wt%] of a fraction
i is defined by the mass of the standard material
[g] and the mass of the fraction
[g] given in equation (5):
In order to be able to estimate and evaluate the results after triboelectric separation, the protein shift
[wt%] is calculated from the dry protein content of the sample to be analyzed
[wt%] and the dry protein content of the standard (feed material)
[wt%] using equation (6):
3. Results and Discussion
3.1. Influence of Length of Charging Section
The mass yield
as well as the protein shift
∆ of the experiments with different charging section lengths are shown in
Figure 2.
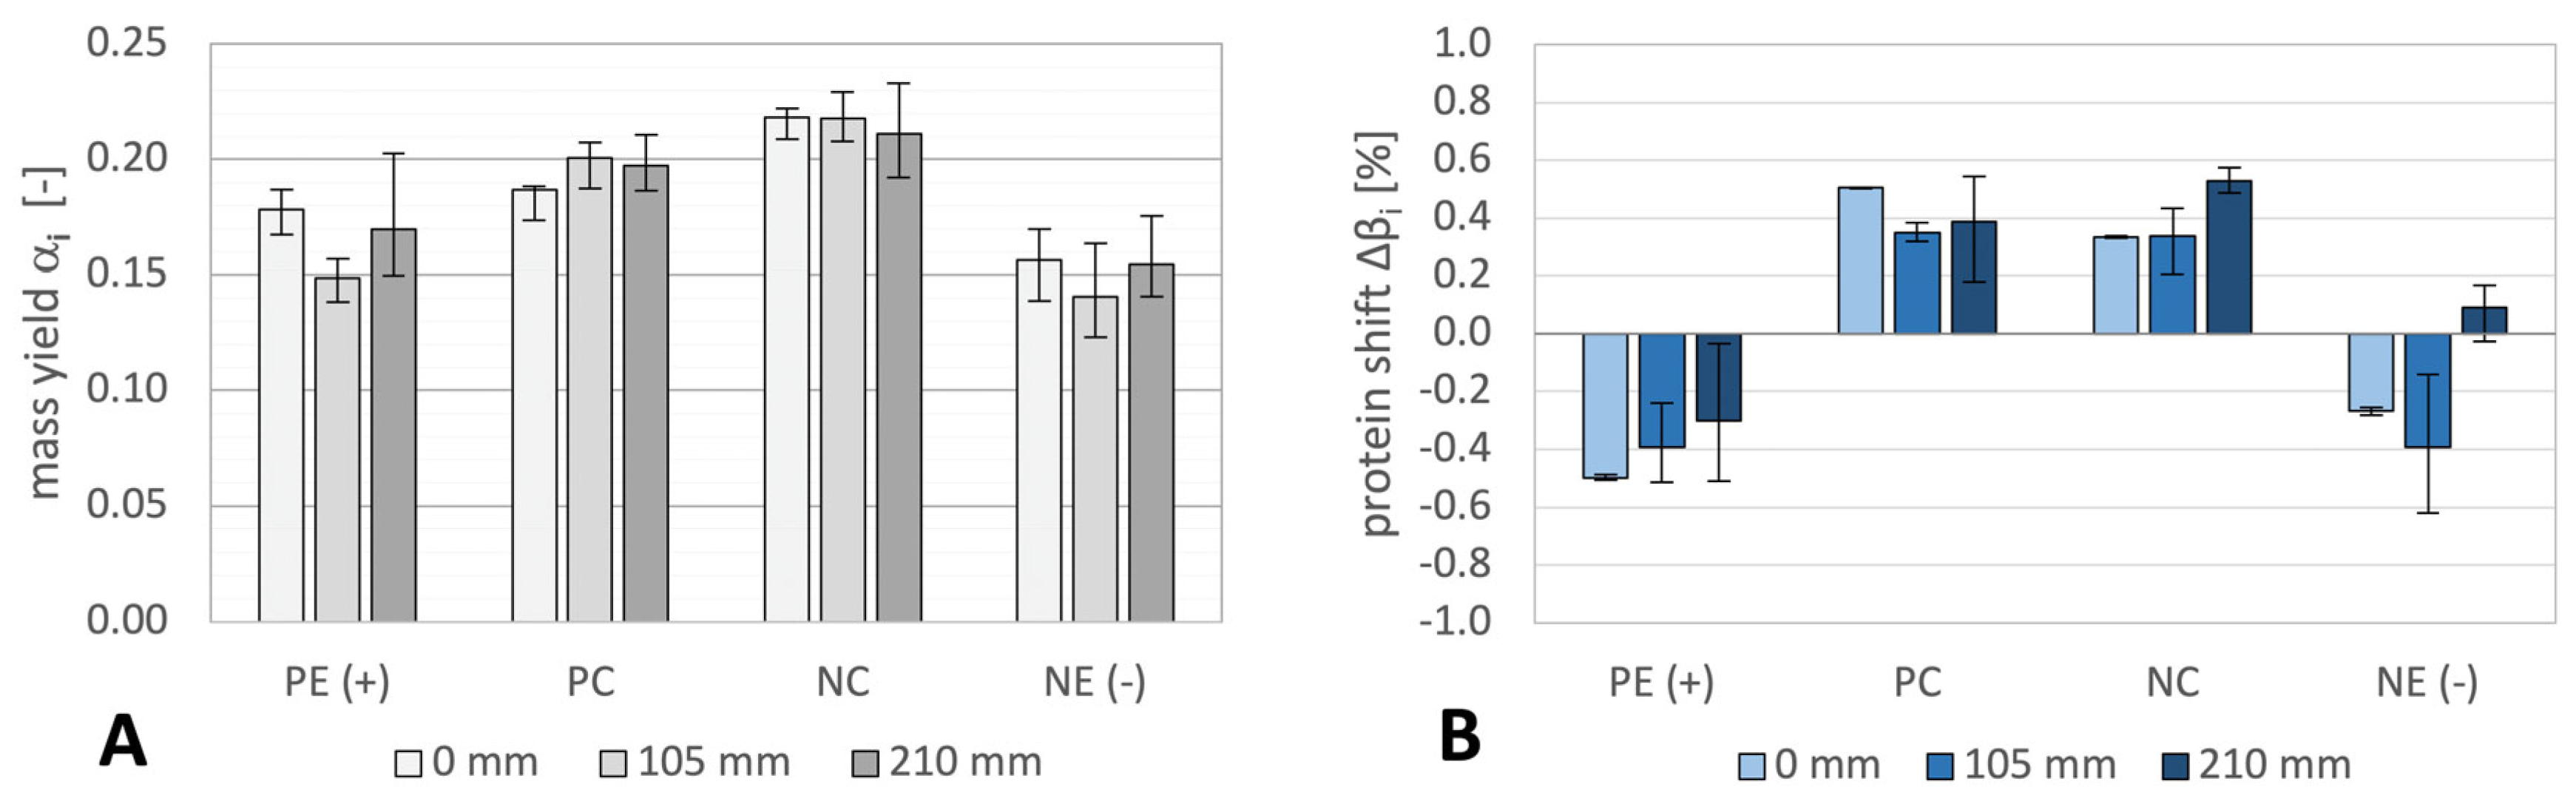
When looking at mass yield (
Figure 2 A), it is noticeable that the mass is distributed over all fractions, whereas slightly more flour was collected in the cups (PC, NC) than on the electrodes for all charging section lengths. A relationship between the distribution of the mass and the length of the charging section cannot be seen.
When looking at the protein shift of the different fractions (
Figure 2 B), it is noticeable that the protein content was reduced at the positive electrode for all configurations. In the positive cup (PC), the flour was enriched in protein for all charging section lengths. Enrichment was also consistent in the negative cup (NC), whereby a slightly higher enrichment the longer the charging section was achieved. The protein shift at the negative electrode, on the other hand, showed a mixed picture. While in the experiment without the use of a charging section the protein content was reduced, with a length of 105 mm an even greater reduction was observed, in the experiment with a length of 210 mm the protein content was not changed.
It can be observed that with increasing length of the charging section, there is a slightly increasing accumulation of the protein fraction in the negative cup. This could be explained by a stronger positive charging behavior of the protein fraction, due to the longer residence time in the charging section and thus also the increasing number of contacts between particles and wall [
29].
However, protein content was depleted at both electrodes for nearly all lengths of charging section (besides 210 mm at NE). This could be explained by an insufficient charging behavior of the protein fraction that leads to a charge-to-mass ratio that is too low for being deflected onto the electrodes (see
Figure 1). This suggests either that the protein is mainly embedded in the larger agglomerates that fall into the cup or that the charge is too low. Only for the longest charging section, the protein is not depleted at NE. Also, in the negative cup (NC), the protein enrichment becomes slightly larger with increasing length. This is plausible, because with increasing length, both, the collision number and the residence time of the particles increase and agglomeration between oppositely charged particles becomes more likely. It is also interesting that even without a charging section, the particles exhibit sufficient charge for protein shift. This charge can arise either already in the vibrating conveyor through contact between the particles and the particles with the conveyor, or during the phase when the particles fall into the funnel.
The risk of agglomeration of oppositely charged particles is particularly high with increasing residence time in the charging section, as the particles are dispersed close together and the electric field between the particles can have a correspondingly strong effect. Only approx. 12% (db) protein is present in the initial flour. An agglomeration of previously oppositely charged starch and protein particles, assuming the same charge tendency, leads on the one hand to a charge equalization (neutralization) and on the other hand to an increased protein content of the new agglomerate formed compared to the original flour. It can also be assumed that the charge of the protein fraction is higher or more protein particles are charged, when the length is increased [
29], which makes agglomerate formation more likely due to stronger attraction of the oppositely charged particles. It should also be noted that starch particles in flour are usually larger and therefore have more impact surface area than protein. This could increase the chance of an already formed starch-protein agglomerate becoming negatively charged again during another collision and thus binding another protein particle. It can therefore be said that one main finding was obtained by varying the length of the charging section. A longer charging section leads to a presumably stronger charge of the protein fraction and thus a slightly higher protein content at the negative electrode.
3.2. Influence of Charging Section Diameter
The mass yield
as well as the protein shift
∆ of the experiments with different charging section diameters are shown in
Figure 3.
The diagram of the mass yield (
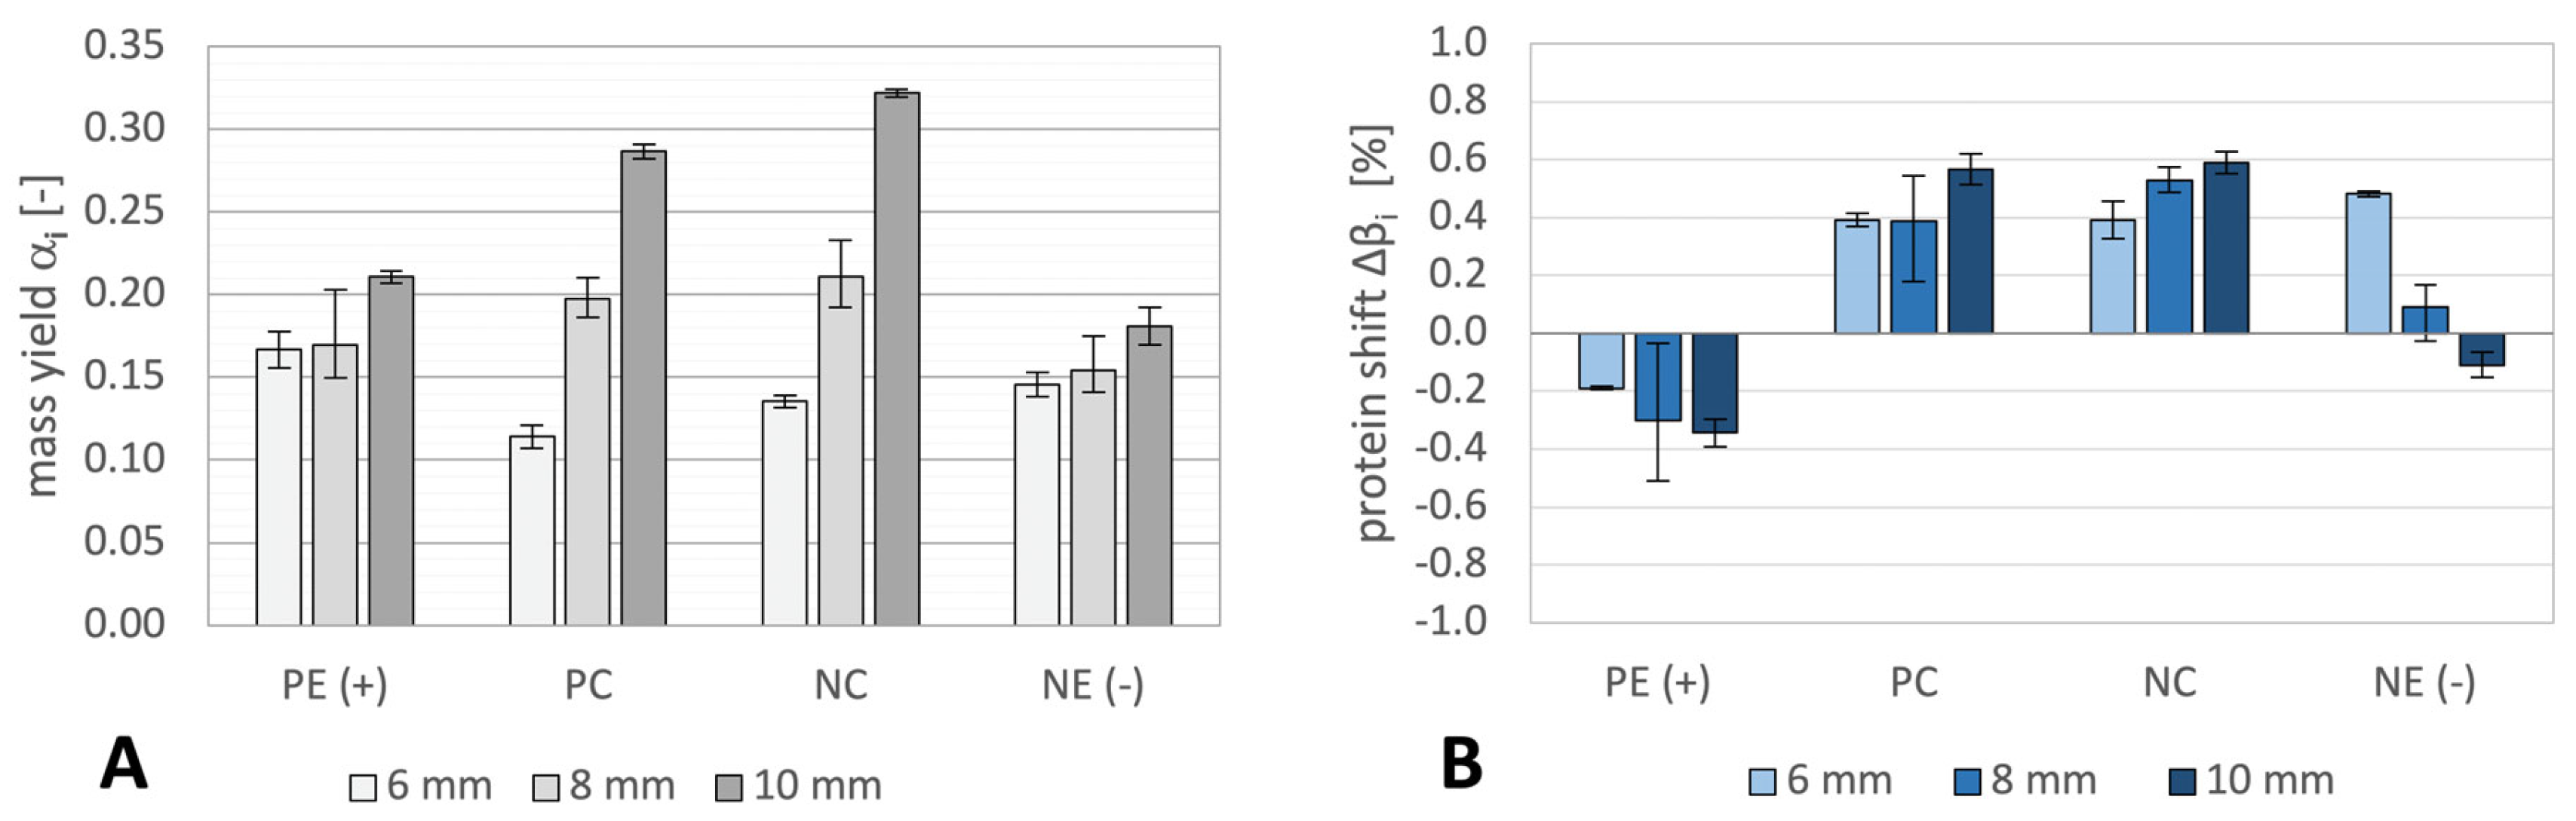
Figure 3A) clearly shows that the distribution of the flour into the different fractions depends on the diameter of the charging section. While for the tube with 6 mm diameter more flour was deposited on the electrodes than in the cups (PC, NC), proportionally less flour is collected on the electrodes as the diameter increases and more flour is collected in the cups. For the 6 mm tube, the mass yield in the cups is lower than that at the electrodes, but contrarily in the 8 mm diameter tube, the mass yield in the cups is greater than at the electrodes and this effect is most pronounced for the 10 mm tube diameter. It should also be mentioned that the loss of mass due to increasing swirling of flour in the funnel grows with decreasing diameter of the charging section.
When looking at the protein shift of the different charging section diameter configurations (
Figure 3B), a trend in the individual fractions becomes apparent. The protein is depleted at the positive electrode in all experiments. There is a tendency to stronger protein depletion with increasing tube diameter. In both the positive and the negative cup protein is enriched for every diameter. There is a slight increase in protein content with increasing diameter. The negative cup with the 10 mm charging section diameter led to the highest enrichment of protein by 0.59%. The protein shift at the negative electrode also appears to be dependent on the diameter. Here, an enrichment of 0.48% can be observed for a diameter of 6 mm, which then decreases with increasing diameter and is even slightly negative at a diameter of 10 mm.
As the diameter decreases, a steady increase in the mass yield at the electrodes and a decrease in the cups can be observed. This suggests that a smaller diameter leads to a stronger charge of the particles, which also seems plausible due to the increased air velocity in the charging section and the associated increased Reynolds number. This also results in a lower probability of agglomeration due to higher turbulence intensity in the charging section. The protein shift at the negative electrode shows that by reducing the diameter, the protein fraction can be charged much more strongly, which leads to better accumulation at this electrode. Here, the smaller the diameter, the more protein was consistently enriched. The assumption of a stronger charge by reducing the diameter is also confirmed when looking at the particle size distribution. The characteristics of the particle size distribution is given in
Table 3. Here it can be seen that in the 6 mm experiment, more larger particles were sufficiently strongly charged and attracted to the electrodes. While mostly smaller particles were detected on the electrodes in the 10 mm test larger particles were attracted in the 6 mm test. The particle size distribution also shows that a reduction in the charging section diameter not only enables a stronger charging of the particles, but also the charging of larger particles leading charge to mass ratio. In contrast to this, the highest protein shift is observed in the cups. The larger the diameter of the charging section, the more protein was enriched in each cup. Increasing the diameter can lead to increased formation of agglomerates by oppositely charged particles. This is also plausible when looking at the particles mean residence time in the charging section. With a diameter of 10 mm, the mean residence time is almost three times as long as in the charging section with a diameter of 6 mm. Due to a longer residence time, lower velocities and the resulting lower turbulence intensity in the charging section, an agglomerate formation of oppositely charged particles is also more likely. High turbulence intensity can break up previously formed agglomerates in the charging section, which could explain the smaller accumulation of protein in the cup for the charging section with 6 mm tube diameter. In addition, the probability of agglomerate formation in the separation chamber is also greater due to a lower entry velocity (at a higher charging section diameter) in the separation section as both sections are connected to each other and consequently have the same volume flow (see
Figure 1). Therefore, the residence time in the separation section is longer for the highest charging section diameter. The entry velocity into the separation section, which describes the speed of the air and the particles after the charging section, is almost three times as high for a charging section with a diameter of 6 mm (19.65 m*s
-1) as for one with a diameter of 10 mm (7.07 m*s
-1). However, it should be noted that the highest positive protein shift was achieved by using the charging section with a diameter of 10 mm. This raises the question of whether the formation of agglomerates during the triboelectric separation of flour should be aimed at or prevented with the goal of maximizing enrichment
However, it should be noted that by reducing the diameter of the charging section, the charge of the particles and thus the accumulation of protein at the negative electrode increases. This is presumably accompanied by a decrease in the formation of agglomerates and a break-up of these by increased turbulent shear stress. This in turn results in a lower accumulation in the cup and a lower maximum accumulation of protein.
3.3. Influence of the Feed Mass Flow Rate
The mass yield
as well as the protein shift
∆ of the experiments with different mass flows of flour are shown in
Figure 4.
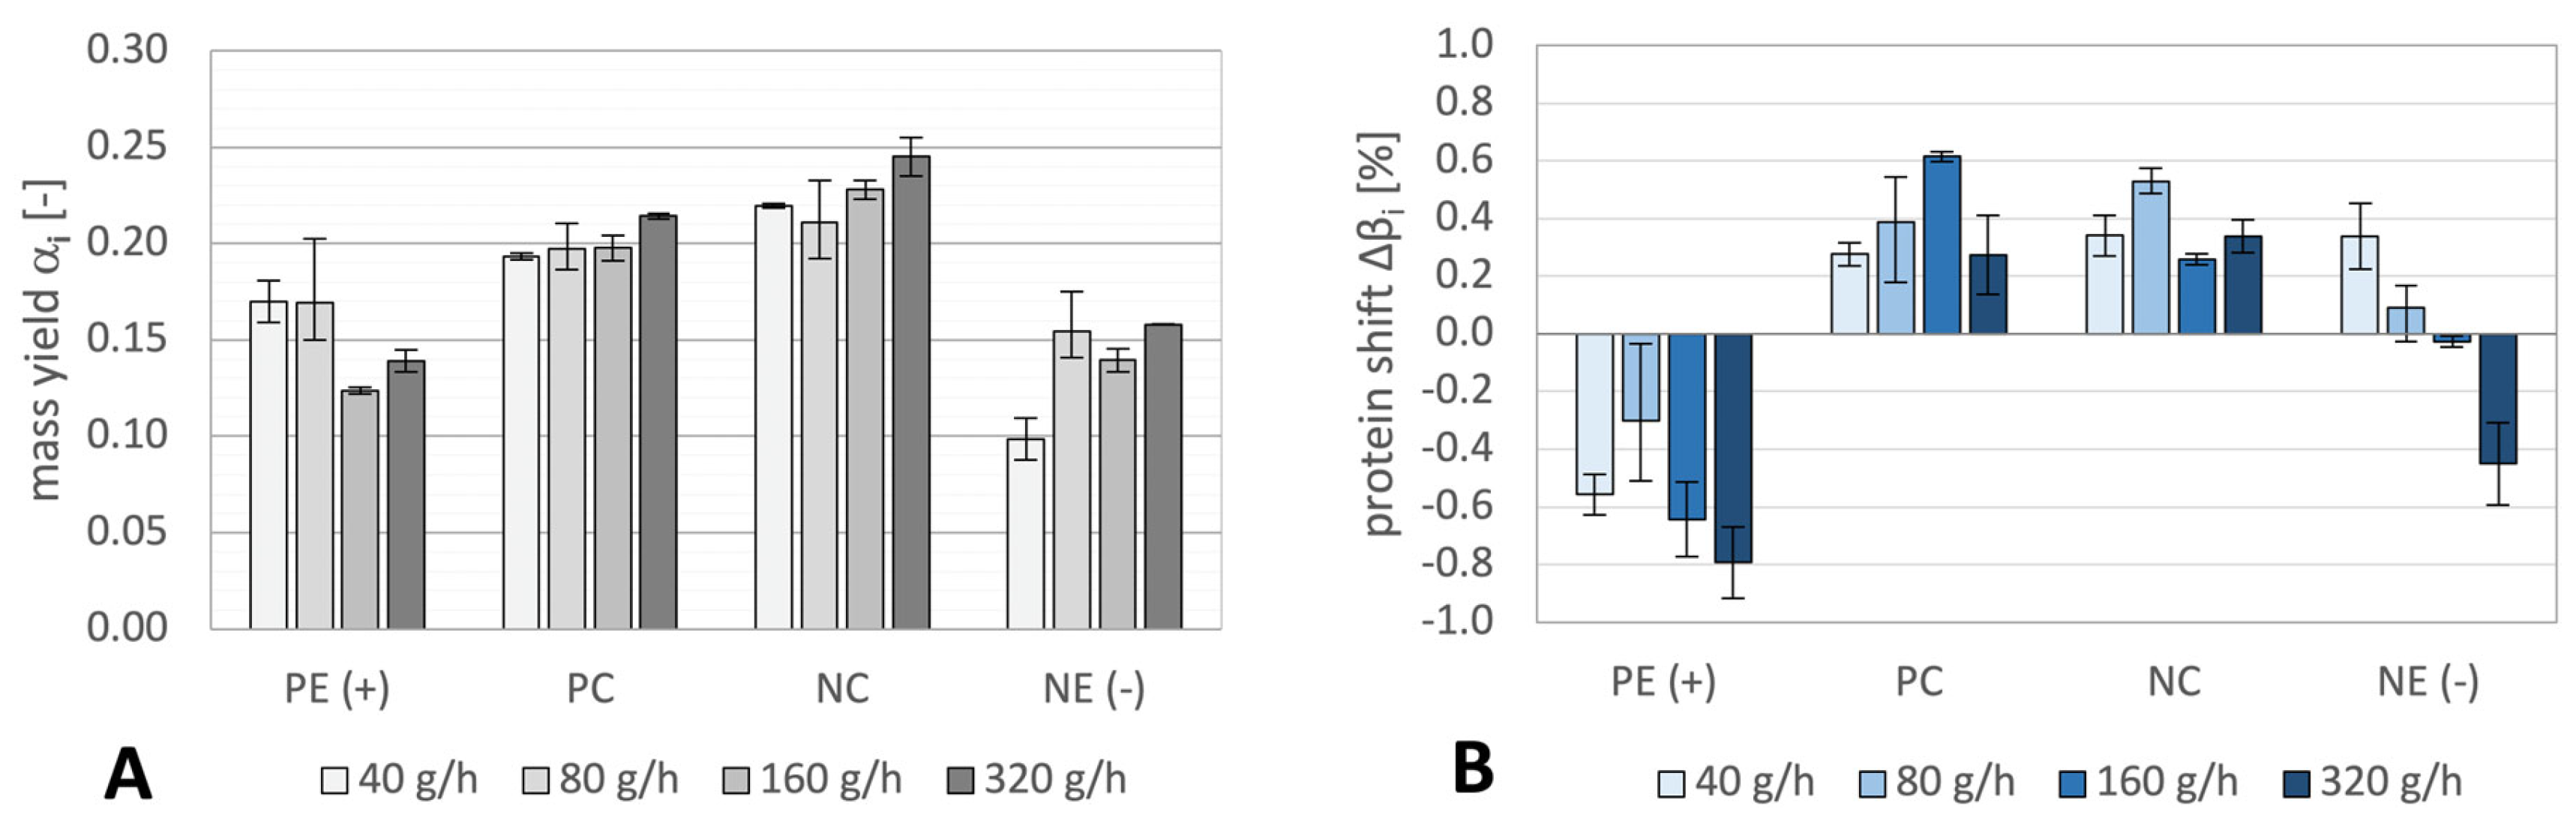
When looking at the mass yield of the individual fractions (
Figure 4A), it is noticeable that for each of the mass flow rates examined, more mass was collected in the cups than on the electrodes. It is also noticeable that slightly more flour was collected in the negative cup than in the positive cup for each of the mass flow rates examined. It can be observed that the proportion of the mass of the flour collected in the cups increases slightly as the mass flow rate increases. It is also noticeable that at a mass flow rate of 40 g*h
-1 the mass yield at the negative electrode was lower than in the other tests.
When looking at the protein shift (
Figure 4B), it can be seen at the positive electrode (PE+) that the greater the mass flow of the added flour, the more protein was depleted. Only in the experiment with 80 g*h
-1 this observation does not apply, although a large error can also be seen here. Protein was enriched in the all cups in every experiment, regardless of the mass flow. A dependency between mass flow and protein enrichment cannot be seen here at first glance. The highest protein enrichment of 0.61% was achieved with a mass flow rate of 160 g*h
-1 in the positive cup (PC). At the negative electrode, on the other hand, a dependence of the protein shift on mass flow rate can be seen. The lower the mass flow, the higher the protein content at the negative electrode. While an enrichment of protein can still be observed at a mass flow of 40 and 80 g*h
-1, the flour is depleted at mass flows of 160 and 320 g*h
-1, albeit only slightly at 160 g*h
-1.
The dependency of protein shift on feed mass flow rate at the negative electrode allows to assume that the protein fraction is more strongly charged at a lower mass flow. The protein content of this fraction decreases steadily with increasing mass flow. A stronger charge of the particles can be explained by a better dispersion of the particles and a longer mean distance between the particles in the air flow for lower concentration, which is achieved by reducing the mass flow. Matsusaka has already shown that a higher particle charge can be achieved by reducing the mass flow of powder fed in [
30]. According to his study, the particle-wall impacts in the charging section increase with a reduction in the mass flow. This contrasts with the contact frequency of the particles, which should increase with increasing mass flow rate due to a smaller mean distance between particles. In practice, however, it is possible that lumps of flour or large agglomerates do not disperse at all or only slightly when the mass flow rate is high, thus worsening the charging behavior of the individual particles due to the resulting smaller total surface area of the particles. This effect is also visible when looking at the particle size distribution in the different fractions (see
Table 4), where it can be seen that a smaller fraction of large particles is attracted to the negative electrode as the mass flow increases. Thus, the x
50 of the particles at the negative electrode decreases steadily with increasing mass flow rate, with the exception of the mass flow rate of 80 g*h
-1. It should also be mentioned here that the particle size distribution at the positive electrode does not change as a function of the mass flow rate.
Also, no clear trend of the protein shift in the containers as a function of the mass flow rate is notable. The shift is lowest at mass flows of 40 and 320 g*h-1 and highest at 80 and 160 g*h-1. The accumulation of protein in the containers could be explained by the formation of agglomerates from previously oppositely charged protein and starch particles. It is interesting to note that agglomerate formation seems to be strongest at mass flows of 80 and 160 g*h-1. This can be recognized by the higher protein enrichment. One possible explanation for this is the dependency of the charge on the dispersion of the powder. With a low mass flow rate, more protein particles could be charged positively because of good dispersion. Due to the lower mass flow and a resulting higher mean distance between the particles in the gas flow, the attraction between charged particles is smaller due to the greater distance between them. The probability of agglomeration is therefore lower despite the higher charge. With a large mass flow, the contact frequency of the particles is high both in the charging and in the separation section, but because of bad dispersion presumably less protein particles get charged. As a result, agglomeration seems less likely in this case. At 80 and 160 g*h-1 a sufficient particle density in the charging and separation section interacts with a sufficient charge of the protein fraction, which leads to a high number of agglomerate formation and the resulting strong protein shift of up to 0.61%.
4. Conclusions
In conclusion, it can be stated that the shown variations of the parameters in the charging section have a major influence on the enrichment of protein.
In all experiments, protein was enriched in the cups (PC, NC) and depleted at the positive electrode. This is in line with the resulting charge regarding to the order of protein and starch in the triboelectric series. The concentration of protein at the negative electrode, on the other hand, was strongly dependent on the process parameters.
A key finding of this work is that during triboelectric flour separation, it is hypothesized that electrostatic agglomerates of oppositely charged starch and protein particles form that strongly influence the protein enrichment. These agglomerates have little to no charge, resulting in minimal deflection in the separation zone, which causes them to end up in the cups at the bottom of the separator (see
Figure 1). Despite this, it appears that these agglomerates contain a higher protein content than the original flour due to the uneven distribution of starch and protein particles within flour. It was shown that the diameter as well as the mass flow have a direct effect on the charging behavior of the particles and therefore on the separation result. The electrostatic agglomeration behavior of the particles is also influenced by the change in diameter and mass flow of flour, which raises the question of whether targeted agglomeration should be aimed for with regard to maximizing the protein shift of one or more fraction(s). An enrichment of protein in the order of magnitude of peas or soy flour, which lies in the range of 10 to 25% could not be achieved in any of the experiments. The reason for this could be the different grain structure and the separability of protein and starch during grinding as well as different grinding methods. However, since the triboelectric separation of wheat flour could be used to standardize the protein content in line, an enrichment of ca. 1-2% may be sufficient to compensate for seasonal or geographical fluctuations and seems achievable with an integrated optimization of the process. In addition, protein content in wheat flour is much smaller than in protein crops such as peas or soy. In order to achieve a reliable shift of more than 1%, the aim must be to investigate further influences and dependencies of the triboelectric separator and to gain more mechanistic insight into this multifactorial process unit. It should also be noted that this work only considered the influences of changes in the charging section. The influences of the separation section and the dispersion of flour were neglected, but could have a positive impact on the separation result. For example, by manipulation of the electrodes (angling, enlarging, or subdivision), both, the conditions regarding aerodynamic flow and electrostatic field strength in the separation section could be changed and thus possibly influencing protein enrichment. The question also arises what the optimal combinations of the parameters of the charging section are in order to achieve a maximum protein shift. Further experiments should be carried out here, whereby the dependence on different parameters can be investigated more precisely with the aim to design an optimal charging section.
Finally, it can be stated that triboelectric separation may be a useful and cost-effective way to standardize wheat flour with regard to the occurring fluctuation of protein content after milling in the future, which can also be implemented directly into the milling process as being a continuous unit operation. Therefore, a deeper insight has to be gained on the combined effect of the different machine and process parameters during triboelectric separation to further increase selectivity and effectivity of separation.
Author Contributions
X.M.: writing—original Manuscript preparation, experimental, software, methodology, visualization, formal analysis; M.S.: conceptualization, methodology, formal analysis, review, revision and editing; P.F.: project administration, funding acquisition, revision and editing, supervision.
Funding
This IGF project of the FEI is supported within the programme for promoting the Industrial Collective Research (IGF) of the German Ministry of Economics and Climate Action (BMWK), based on a resolution of the German Parliament (Research Project 21447 N).
Data Availability Statement
The data that support the findings of this study are available within the article. Further data are available from the corresponding author upon reasonable request.
Conflicts of Interest
The authors declare no conflict of interest. The funders had no role in the design of the study; in the collection, analyses, or interpretation of data; in the writing of the manuscript, or in the decision to publish the results.
References
- USDA (United States Department of Agriculture), World Agricultural Production. Circular Series WAP 10-24, 2024.
- Shewry, P.R. and S.J. Hey, The contribution of wheat to human diet and health. Food Energy Secur., 2015. 4(3): p. 178-202. [CrossRef]
- Thanhaeuser, S.M., H. Wieser, and P. Koehler, Correlation of Quality Parameters with the Baking Performance of Wheat Flours. Cereal Chemistry, 2014. 91(4): p. 333-341. [CrossRef]
- Kuktaite, R., H. Larsson, and E. Johansson, Variation in protein composition of wheat flour and its relationship to dough mixing behaviour. Journal of Cereal Science, 2004. 40(1): p. 31-39. [CrossRef]
- Jekle, M. and T. Becker, Wheat Dough Microstructure: The Relation Between Visual Structure and Mechanical Behavior. Critical Reviews in Food Science and Nutrition, 2015. 55(3): p. 369-382. [CrossRef]
- Roberts, S., et al., The role of quality characteristics in pricing hard red winter wheat. Food Policy, 2022. 108: p. 102246. [CrossRef]
- David, O., et al., Proximate Composition and Some Functional Properties of Soft Wheat Flour. International Journal of Innovative Research in Science, Engineering and Technology, 2015. 4(2). [CrossRef]
- Xue, C., et al., Protein Composition and Baking Quality of Wheat Flour as Affected by Split Nitrogen Application. Frontiers in Plant Science, 2019. 10. [CrossRef]
- Singh, A., M. Izydorczyk, and F. Koksel, Pilot scale air classification of flours from hulled and hull-less barley for the production of protein enriched ingredients. Journal of Cereal Science, 2024. 117. [CrossRef]
- Pérez, S., P.M. Baldwin, and D.J. Gallant, Structural Features of Starch Granules I. Starch Chemistry and Technology. In Starch. Elsevier, 2009: p. 149-192.
- Roa, D.F., et al., Ball Milling of Amaranth Starch-Enriched Fraction. Changes on Particle Size, Starch Crystallinity, and Functionality as a Function of Milling Energy. Food Bioprocess Technology, 2014. 7: p. 2723–2731. [CrossRef]
- Wang, J., et al., Lupine protein enrichment by milling and electrostatic separation. Innovative Food Science and Emerging Technologies, 2016. 33: p. 596-602. [CrossRef]
- Wang, J., et al., Charging and separation behavior of gluten–starch mixtures assessed with a custom-built electrostatic separator. Separation and Purification Technology, 2015. 152: p. 164-171. [CrossRef]
- Landauer, J. and P. Foerst, Triboelectric separation of a starch-protein mixture - Impact of electric field strength and flow rate. Advanced Powder Technology 2018. 29 (1): p. S. 117–123. [CrossRef]
- Lacks, D.J. and R.M. Sankaran, Contact electrification of insulating materials. Journal of Physics D: Applied Physics, 2011. 44 453001. [CrossRef]
- Landauer, J. and P. Foerst, Influence of Particle Contact Number on Triboelectric Separation Selectivity. MDPI Processes, 2019. 7(10). [CrossRef]
- Wu, G., J. Li, and Z. Xu, Triboelectrostatic separation for granular plastic waste recycling: A review. Waste Management, 2013. 33(3): p. 585-597. [CrossRef]
- Gupta, R., D. Gidaspow, and D.T. Wasan, Electrostatic separation of powder mixtures based on the work functions of its constituents. Powder Technology, 1993. 75(1): p. 79-87. [CrossRef]
- Hemery, Y., et al., Potential of dry fractionation of wheat bran for the development of food ingredients, part II: Electrostatic separation of particles. Journal of Cereal Science, 2011. 53: p. 9-18. [CrossRef]
- Sibakov, J., et al., Electrostatic separation combined with ultra-fine grinding to produce β-glucan enriched ingredients from oat bran. Innovative Food Science & Emerging Technologies, 2014. 26: p. 445-455. [CrossRef]
- Mohanta, S.K., et al., Tribo-electrostatic separation of high ash coking coal washery rejects: Effect of moisture on separation efficiency. Powder Technology, 2016. 294: p. 292-300. [CrossRef]
- Atroune, S., et al., Comparative Experimental Study of Triboelectric Charging of Two Size Classes of Granular Plastics. Particulate Science and Technology 2015. 33: p. 652-658. [CrossRef]
- Wang, H., et al., Tribo-charging of binary mixtures composed of coarse and fine particles in gas–solid pipe flow. Particuology Elsevir, 2019. 43: p. 101-109. [CrossRef]
- Dötterl, M., et al., Electrostatic Separation. Ullmann's Encyclopedia of Industrial Chemistry Major Reference Works, 2016s, 2016. [CrossRef]
- Tabtabaei, S., et al., Solvent-free Production of Protein-enriched Fractions from Navy Bean Flour using a Triboelectification-based Approach. Journal of Food Engineering, 2015. 174: p. 21-28. [CrossRef]
- Xing, Q., et al., Protein enrichment of defatted soybean flour by fine milling and electrostatic separation. Innovative Food Science and Emerging Technologies, 2018. 50: p. 42-49. [CrossRef]
- Dumas, J.-B., Recherches de Chimie organique. Annales de chimie et de physique., 1833. 53: p. 164-181.
- ISO 16634-1:2008, Food products - Determination of the total nitrogen content by combustion according to the Dumas principle and calculation of the crude protein content. ISO, 2008. 1.
- Wang, J., et al., Analysis of electrostatic powder charging for fractionation of foods. Elsevier, Innovative Food Science & Emerging Technologies, 2014. 26: p. 360-365. [CrossRef]
- Matsusaka, S., Control of Particle Tribocharging. KONA Powder Technology Foundation, 2011. 29. [CrossRef]
Figure 1.
Schematic representation of the triboelectric separator together with numbering of the individual components (1. Vibrating conveyor 2. air flow pipe 3. funnel 4. charging section 5. separator inlet 6. high voltage source 7. separation section 8. brushes 9. belts and motors 10. outlet and collection container) and representation of the separating property. Arrows indicate the flow direction.
Figure 2.
A: Representation of the collected mass yield αi of the PE (+), PC, NC and NE (-) fractions of the tests with 0, 105, and 210 mm charging section lengths. Error bars indicate maximum and minimum values, bars indicate mean values. (For better illustration, the loss was not included in the figure) B: Comparison of the protein shift ∆βi [%] of the individual fractions PE (+), PC, NC and NE (-) of the tests with 0, 105, and 210 mm charging section length. Error bars indicate maximum and minimum of a test series, the bar indicates the mean value.
Figure 3.
A: Representation of the collected mass yield αi of the PE (+), PC, NC and NE (-) fractions of the tests with 6, 8, and 10 mm charging section diameter. Error bars indicate maximum and minimum of the tests carried out, bars indicate mean values. (For better illustration, the loss was not included in the figure) B: Comparison of the protein shift ∆βi [%] of the individual fractions PE (+), PC, NC, and NE (-) of the tests with 6, 8, and 10 mm charging section diameter. Error bars indicate maximum and minimum of a test series, the bar indicates the mean value.
Figure 4.
A: Representation of the collected mass fraction αi of the PE (+), PC, NC, and NE (-) fractions of the tests with a mass flow of 40, 80, 160, and 320 g*h-1. Error bars indicate maximum and minimum of the tests carried out, bars indicate mean values. (For better illustration, the loss was not included in the figure) B: Comparison of the protein shift ∆βi [%] of the individual fractions PE (+), PC, NC, and NE (-) of the tests with 6 a mass flow of 40, 80, 160, and 320 g*h-1. Error bars indicate maximum and minimum of a test series, the bar indicates the mean value.
Table 1.
Representation of the key parameters which were varied or kept constant for the tests: length of the charging section, diameter of the charging section, and mass flow of flour.
Table 1.
Representation of the key parameters which were varied or kept constant for the tests: length of the charging section, diameter of the charging section, and mass flow of flour.
| |
Length of charging section |
Diameter of charging section |
Mass flow of flour |
| Tests length |
Varied |
Constant |
Constant |
| Tests diameter |
Constant |
Varied |
Constant |
| Tests mass flow |
Constant |
Constant |
Varied |
Table 2.
Representation of the parameters: length of charging section [mm], diameter of charging section [mm], mass flow of flour [g*h-1], residence time [ms], velocity [m*s-1], and Reynolds number [-] for the different tests (length and diameter of the charging section and mass flow of flour).
Table 2.
Representation of the parameters: length of charging section [mm], diameter of charging section [mm], mass flow of flour [g*h-1], residence time [ms], velocity [m*s-1], and Reynolds number [-] for the different tests (length and diameter of the charging section and mass flow of flour).
| |
Length of charging section [mm] |
Diameter of charging section [mm] |
Mass flow of flour [g*h-1] |
Residence time [ms] |
Velocity [m*s-1] |
Reynolds number [-] |
| Tests length |
0 |
8 |
80 |
0 |
11.05 |
5849.77 |
| 105 |
8 |
80 |
9.5 |
11.05 |
5849.77 |
| 210 |
8 |
80 |
19 |
11.05 |
5849.77 |
| Tests diameter |
210 |
6 |
80 |
10.7 |
19.65 |
7799.69 |
| 210 |
8 |
80 |
19 |
11.05 |
5849.77 |
| 210 |
10 |
80 |
29.7 |
7.07 |
4679.82 |
| Tests mass flow |
210 |
8 |
40 |
19 |
11.05 |
5849.77 |
| 210 |
8 |
80 |
19 |
11.05 |
5849.77 |
| 210 |
8 |
160 |
19 |
11.05 |
5849.77 |
| 210 |
8 |
320 |
19 |
11.05 |
5849.77 |
Table 3.
Representation of the median values of the particle size distributions x50 [µm] for the different charging section diameters 6, 8, and 10 mm at a gas volume flow of 2 m3*h-1.
Table 3.
Representation of the median values of the particle size distributions x50 [µm] for the different charging section diameters 6, 8, and 10 mm at a gas volume flow of 2 m3*h-1.
| x50 [µm] |
PE (+) |
PC |
NC |
NE (-) |
| 6 mm |
70.74 |
100.47 |
102.69 |
67.82 |
| 8 mm |
54.54 |
84.05 |
90.23 |
62.59 |
| 10 mm |
52.1 |
84.3 |
94.61 |
57.83 |
Table 4.
Representation of the x50 [µm] for the different mass flows 40, 80 ,160, and 320 g*h-1 at a gas volume flow of 2 m3*h-1.
Table 4.
Representation of the x50 [µm] for the different mass flows 40, 80 ,160, and 320 g*h-1 at a gas volume flow of 2 m3*h-1.
| x50 [µm] |
PE (+) |
PC |
NC |
NE (-) |
| 40 g*h-1
|
53.28 |
82.22 |
83.89 |
75.67 |
| 80 g*h-1
|
54.54 |
84.05 |
90.23 |
62.59 |
| 160 g*h-1
|
51.08 |
86 |
83.13 |
64.44 |
| 320 g*h-1
|
52.69 |
86.77 |
77.96 |
55.79 |
|
Disclaimer/Publisher’s Note: The statements, opinions and data contained in all publications are solely those of the individual author(s) and contributor(s) and not of MDPI and/or the editor(s). MDPI and/or the editor(s) disclaim responsibility for any injury to people or property resulting from any ideas, methods, instructions or products referred to in the content. |
© 2024 by the authors. Licensee MDPI, Basel, Switzerland. This article is an open access article distributed under the terms and conditions of the Creative Commons Attribution (CC BY) license (http://creativecommons.org/licenses/by/4.0/).