Preprint
Article

This version is not peer-reviewed.

Gender-Specific Malnutrition and Muscle Depletion in Gastric and Colorectal Cancer: Role of Dietary Intake in a Jordanian Cohort

Submitted:

07 November 2024

Posted:

11 November 2024

You are already at the latest version

Abstract

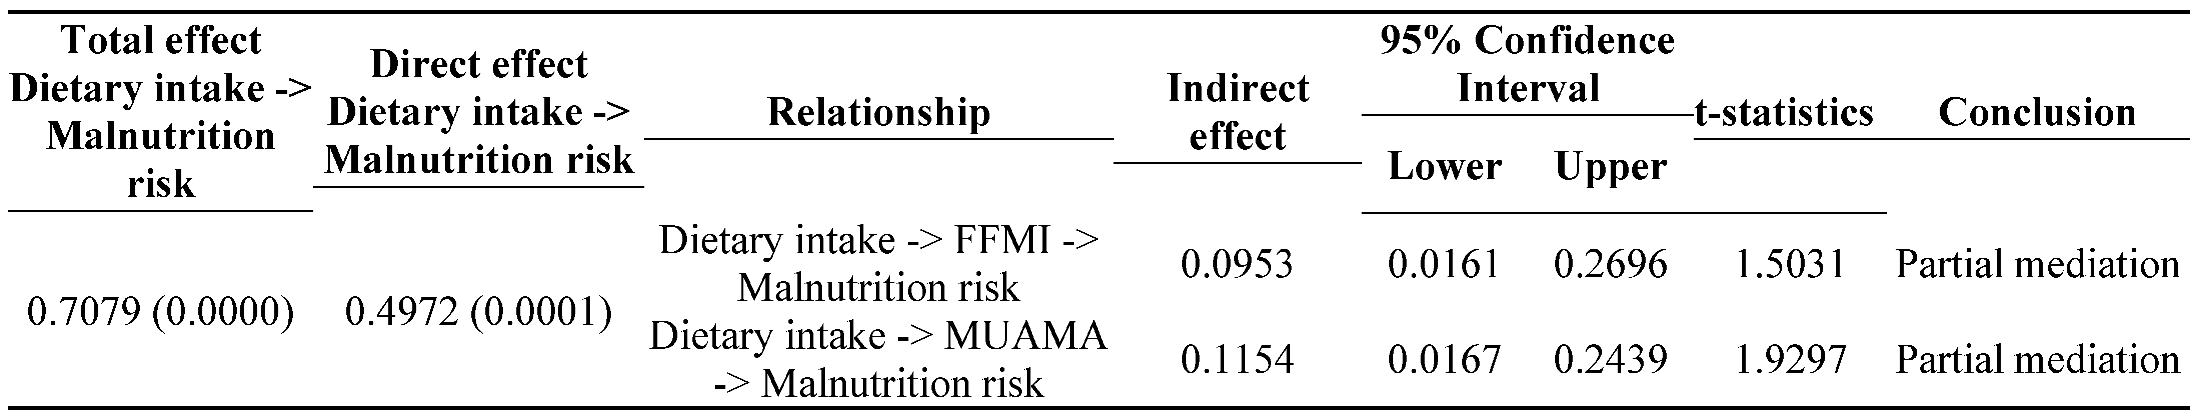
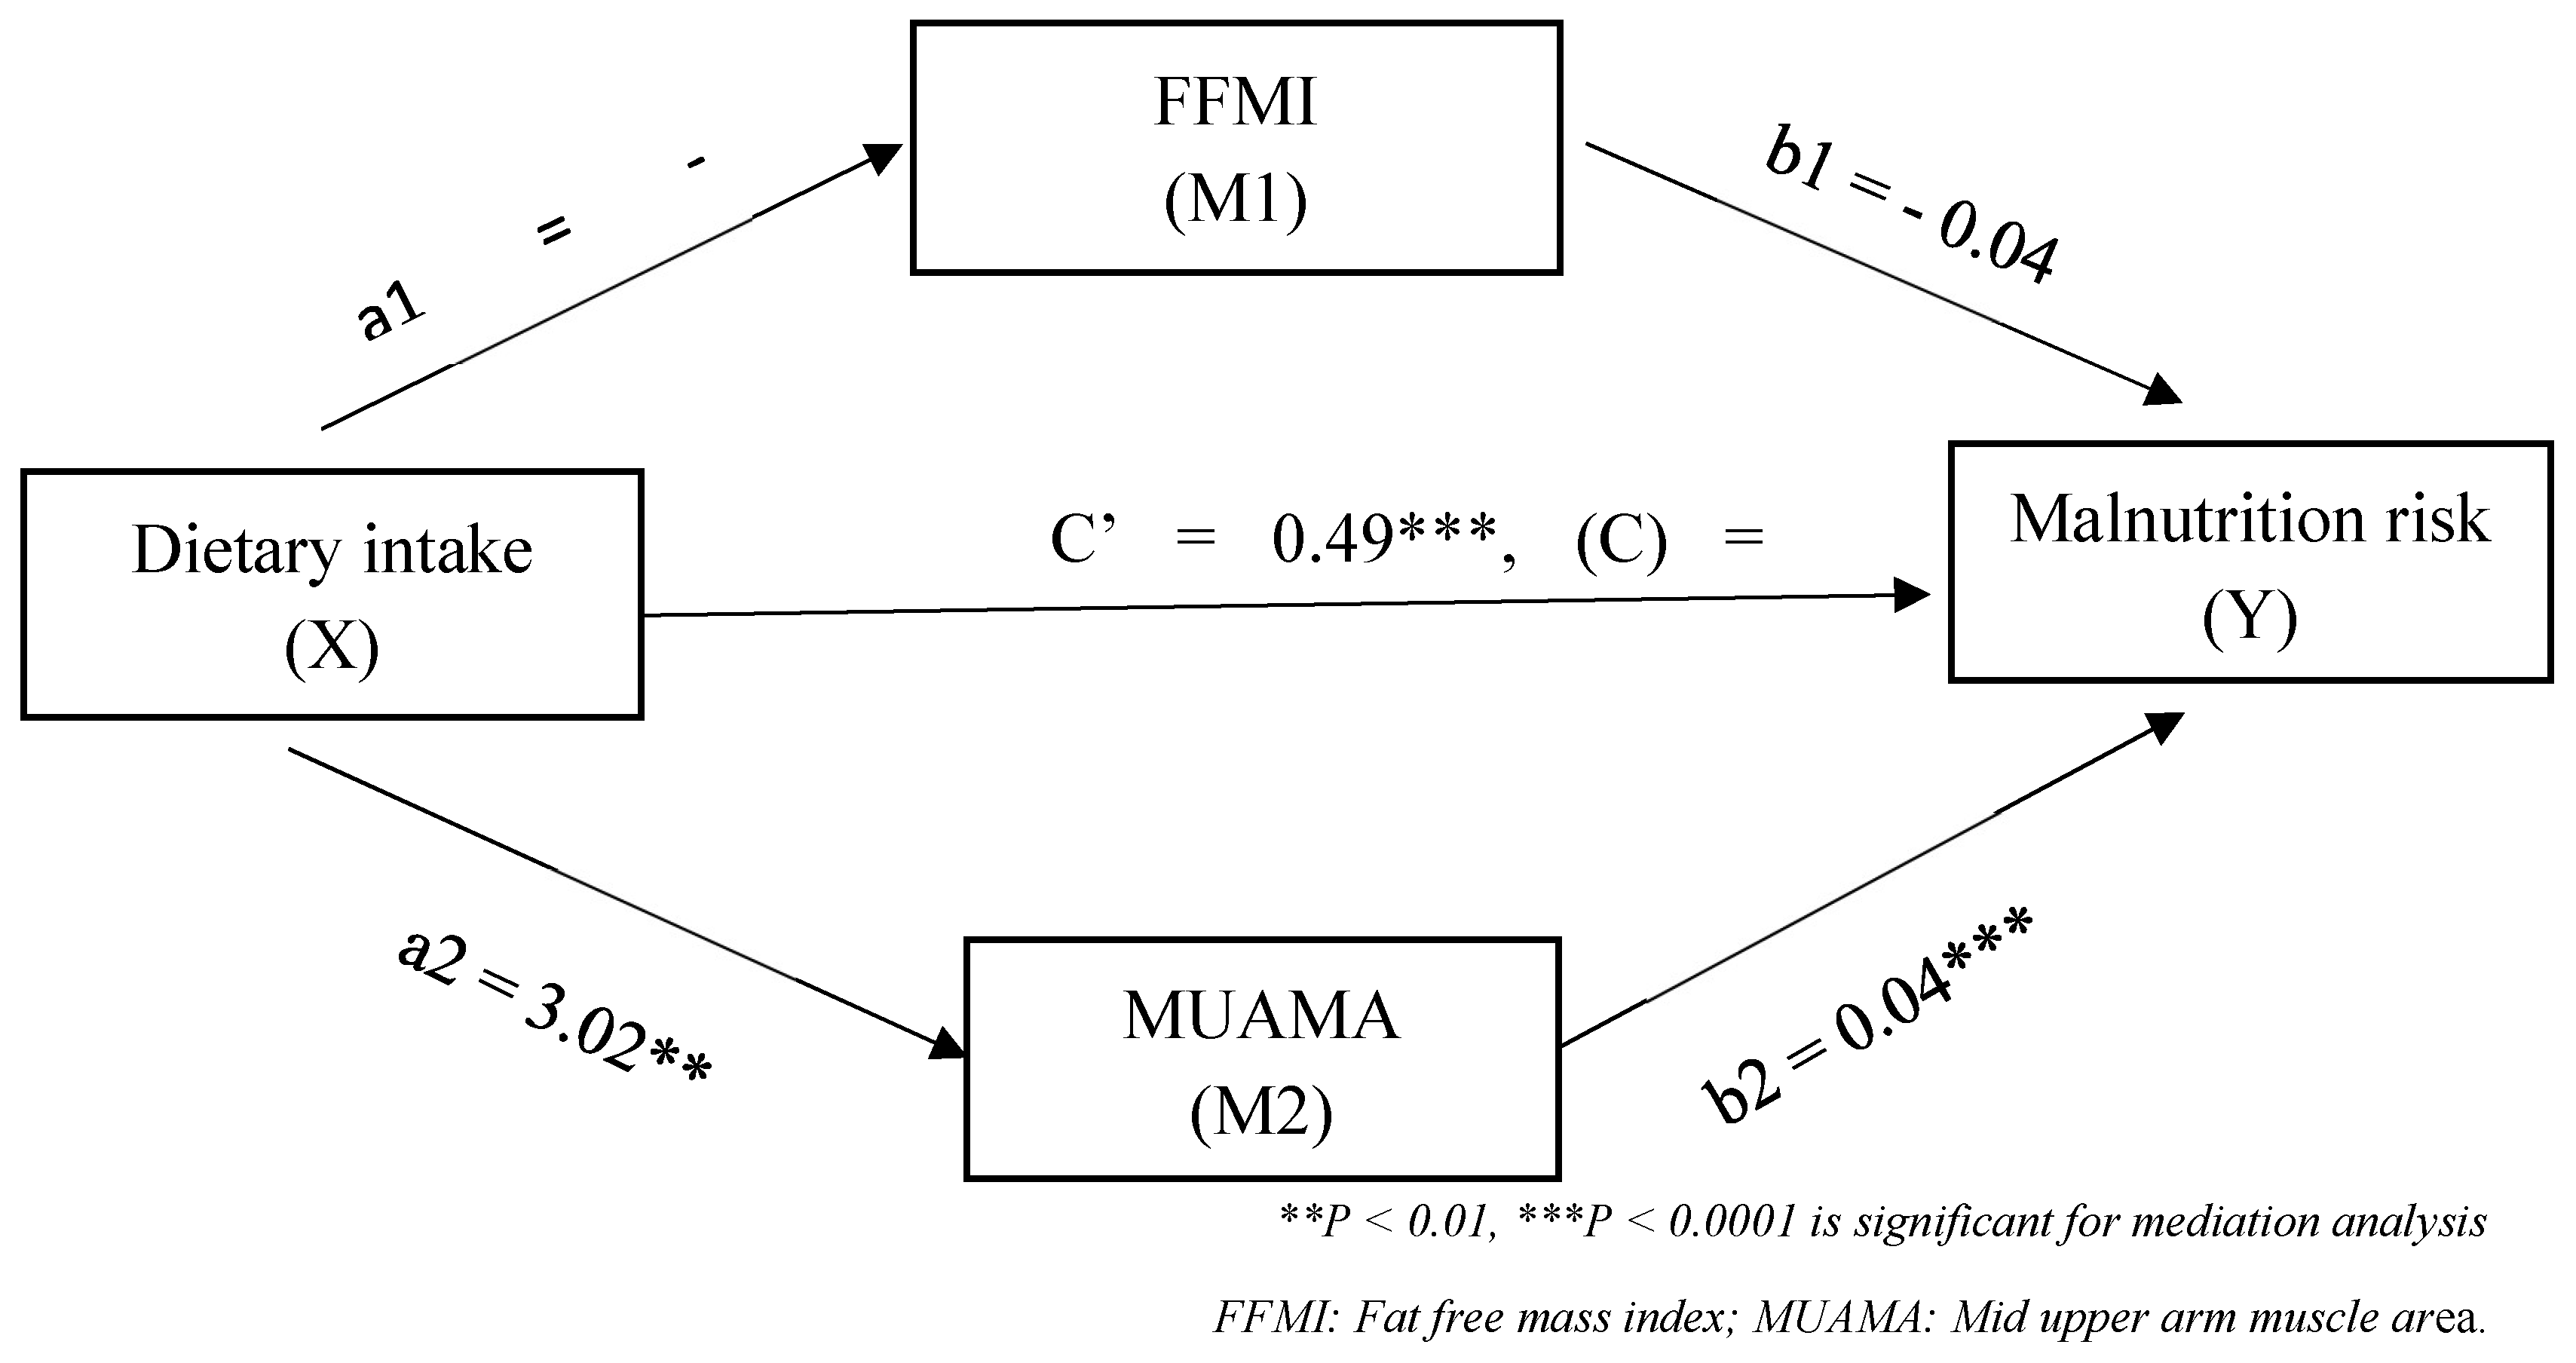
Objectives: This study aims to assess malnutrition and muscle mass depletion risk in gastrointestinal cancer patients, exploring differences between gastric and colorectal cancer, with a focus on gender-specific variations and dietary intake. It also examines whether muscle depletion mediates the relationship between dietary intake and malnutrition risk. Methods: 100 Jordanian pre-operative gastrointestinal cancer patients (60 male, 40 female) with gastric or colorectal cancer were assessed for malnutrition risk using the Malnutrition Universal Screening Tool (MUST) and for muscle depletion using fat-free mass index (FFMI) and mid-upper arm muscle area (MUAMA). Results: the study found that 80% (95% CI: 0.708 - 0.873 ) of patients were at high risk for malnutrition, with over 60% experiencing severe muscle loss. Gastric cancer patients had a higher, though not statistically significant, malnutrition risk (90.2% vs. 72.9%) and muscle depletion compared to colorectal cancer patients. Significant gender-specific differences in muscle depletion via FFMI (P = 0.012) and via MUAMA (P = 0.028) were also noted, especially in females with gastric cancer. Patients' dietary intake was significantly (P < 0.001) below recommended levels for energy, protein, carbohydrates, fiber, and essential fatty acids, which was associated with higher malnutrition risk, muscle depletion, low BMI (<18.5 kg/m²), and significant weight loss (>10%). Low dietary intake was strongly linked to increased malnutrition risk and muscle depletion, with muscle loss partially mediating (b = 0.4972, P < 0.0001) the relationship between poor dietary intake and malnutrition risk. Additionally, higher muscle mass was protective against malnutrition (OR = 16.0, 95% CI: 1.706 – 150.507), and cancer type was a significant predictor of malnutrition risk (OR = 14.4, 95% CI: 1.583 – 130.867). Conclusions: Malnutrition risks and significant muscle loss are common in GI cancer patients, highlighting the urgent need for tailored nutrition care plans and lifestyle modifications.

Keywords: 
;  ;  ;  ;  ;  

Introduction

Malnutrition is a critical issue in cancer care, affecting between 20% and over 70% of cancer patients globally. Alarmingly, 10% to 20% of cancer-related deaths are attributed to malnutrition rather than the malignancy itself [1]. This issue is particularly pronounced among patients with gastrointestinal (GI) cancers, where malnutrition prevalence can reach up to 80% due to the nature of the disease. The progression of the malignancy, side effects of treatment, and direct tumor effects further exacerbate this condition, leading to significant weight loss and skeletal muscle wasting [2,3].
Given the severe impact of malnutrition on patient outcomes, assessing body composition specifically skeletal muscle mass is essential for predicting physical impairment, chemotherapy toxicity, post-operative complications, and mortality in GI cancer patients [4]. Severe muscle mass depletion, often defined as having muscularity below the 5th percentile, can be assessed using techniques such as mid-upper arm area (MUAMA) measurement and bioelectrical impedance to calculate the fat-free mass index (FFMI) [2].
Effective nutrition screening is key to identifying individuals at risk of malnutrition early, ideally before conducting more detailed assessments [5]. Various screening tools, including the Nutrition Risk Index (NRI), Malnutrition Universal Screening Tool (MUST), Malnutrition Screening Tool (MST), and Nutrition Risk Screening 2002 (NRS-2002), have been developed for this purpose [6]. Among these, the MUST has shown the greatest efficacy in identifying malnutrition in elderly patients with GI cancer, as defined by the latest European Society for Clinical Nutrition and Metabolism (ESPEN) diagnostic criteria [7]. Screening for malnutrition with validated risk assessment tools is essential upon hospital admission to quickly identify patients at risk [8]. The MUST has proven to be both accurate and practical for detecting malnutrition risk in hospitalized adults, including GI cancer patients [9].
Research suggests that gender-specific factors can significantly influence the nutritional status and outcomes of cancer patients. Differences in body composition between men and women contribute to varying risks for malnutrition. Men generally have a higher muscle mass, while women tend to have a higher fat mass, which may influence their response to cancer-related malnutrition and treatment [10]. In gastrointestinal cancers, men are more susceptible to muscle mass depletion (sarcopenia), whereas women may experience more fat mass loss, though the effects of malnutrition can vary by gender [4]. Additionally, gender can impact dietary intake patterns and metabolic responses. Studies have shown that men and women may have different energy requirements and dietary needs during cancer treatment, affecting their malnutrition risk [11,12,13]. Women may also exhibit distinct dietary behaviors, possibly influenced by sociocultural factors [14].
In males with colorectal cancer and a patient generated subjective global assessment (PG-SGA) score ≥ 9, significant reductions in weight, FFMI, relative fat mass, and serum albumin were observed, while females showed no significant changes but elevated C-reactive protein levels. This aligns with lung cancer studies indicating malnutrition may be more identifiable in males [11,15].
Al-Shahethi et al. [14] reported a higher prevalence of malnutrition in female cancer patients (16.4%) compared to males (15.5%). In contrast, a study by Yi and Hong [16] revealed that male patients with upper gastrointestinal cancer had a greater risk of malnutrition (71%) than females (29%). These differing results suggest that gender-related malnutrition risk may vary depending on the type of cancer and other influencing factors, highlighting the importance of gender-specific strategies in addressing malnutrition.
Inadequate dietary intake is linked to malnutrition risk, with muscle depletion serving as a key indicator, especially in GI cancer patients [16]. This depletion exacerbates frailty, limiting patients’ ability to shop and prepare meals. Moreover, muscle loss may be driven by malnutrition and the inflammatory processes associated with disease states, further worsening the patient’s nutritional status[16,17,18]. These factors combined contribute to a cycle of malnutrition, frailty, and muscle depletion in GI cancer patients, emphasizing the need for early intervention and nutritional support. Therefore, it is expected that the muscle depletion might mediate the association between dietary intake and malnutrition risk.
Recognizing the profound influence of nutritional status on clinical outcomes, this study aims to assess the risk of malnutrition and muscle depletion among preoperative GI cancer patients. Furthermore, it seeks to explore potential differences in muscle mass depletion between gastric and colorectal cancer patients, with a particular focus on gender-specific and dietary intake variations and to test if FFMI and/or MUAMA mediated the association between dietary intake and malnutrition risk. The findings of this study could guide targeted nutritional interventions and improve the management of malnutrition in this vulnerable population. We hypothesized that female gastric cancer patients are at a higher risk of malnutrition and muscle depletion, with inadequate dietary intake playing a significant role in their malnutrition.

2. Materials and Methods

2.1. Study design and participants

This study followed a cross-sectional design, enrolling a total of 100 Jordanian adults (60 males and 40 females) diagnosed with either gastric or colorectal cancer. The participants were recruited between January 2018 and March 2020.
Eligibility was determined based on the following criteria: participants were between 40 and 80 years of age, held Jordanian nationality, were attending the GI clinics at King Abdullah University Hospital, had a confirmed diagnosis of gastric or colorectal cancer, had not undergone any GI surgery, can be assessed using MUST , and had signed informed consent agreeing to participate.
Those meeting the inclusion criteria were selected through a convenience sampling technique.

2.2. Ethical approval

The study was conducted in accordance with the Declaration of Helsinki, following the review and approval of the study protocol by the Institutional Review Board (IRB) at King Abdullah University Hospital (Approval No. 13/111/2018). All participants were fully informed about the study objectives and provided written consent prior to their enrollment.

2.3. Anthropometric and muscle depletion

Body weight (kg), fat mass (FM), fat-free mass (FFM), FFMI, total body water (TBW), body mass index (BMI, kg/m²), and basal metabolic rate (BMR) were all measured using bioelectrical impedance analysis (BIA) with the Bodystate 1500 MDD Body Composition/Wellness Monitoring Unit. To ensure the accuracy and reliability of the body composition measurements, all preparatory steps were carefully followed. These included standardizing testing conditions such as ensuring participants were well-hydrated and refrained from physical activity or caffeine intake prior to testing. This consistency helped minimize variability in the results, providing the most precise and reliable body composition data.
Height was measured using a stadiometer, with participants barefoot and wearing minimal clothing. They stood with their heels together, arms at their sides, legs straight, shoulders relaxed, and head aligned in the Frankfort horizontal plane [19]. Weight was recorded using a calibrated beam scale, with patient standing unassisted in the center of the scale, barefoot and in minimal clothing, looking straight ahead [19]. BMI was calculated using Quetelet’s formula: weight (kg) divided by height squared (m²) [19]. Waist circumference was measured at the narrowest point between the lowest rib and iliac crest at the end of a normal exhale, while hip circumference was measured at the widest point over light clothing without applying pressure [19].
Triceps skinfold (TSF) thickness was measured using a Holtain skinfold caliper. A trained dietitian pinched a fold of skin and subcutaneous fat about 2 cm above the mid-arm circumference mark. The caliper jaws were positioned over the full skinfold, and the handle was released to apply tension. The thickness was then recorded to the nearest 0.1 mm.
Mid-upper arm circumference (MUAC) was measured using a non-elastic measuring tape. The measurement was taken on the participant’s right arm, specifically at the midpoint between the acromion (tip of the shoulder) and the olecranon (tip of the elbow). This precise placement ensures an accurate assessment of the arm’s circumference, which is a key indicator of muscle mass and nutritional status. All the measurements were taken to the nearest 0.1 centimeters (cm). We also calculated the mid-upper arm muscle circumference (MUAMC) by a standard equation [20]: MUAMC (cm) = MUAC (cm) -π× (TSF thickness [millimeters] ÷ 10). From this calculation we calculated the general mid-upper arm muscle area (MUAMA) and the corrected (CMUAMA) for men and women using the below equations:
General equation: MUAMA (cm)2 = MUAMC (cm)2 ÷ 4 π
For men: CMUAMA (cm)2 = ([MUAMC (cm)]2 – 10) ÷ 4 π
For women: CMUAMA (cm)2 = ([MUAMC (cm)]2 – 6.5) ÷ 4 π
Muscle depletion was defined as a CMUAMA below 32 cm² or a FFMI below 14.6 kg/m2 for men. For women, muscle depletion was indicated by a CMUAMA below 18 cm² or an FFMI below 11.4 kg/m2 [2].

2.4. Malnutrition risk assessment

The study employed the Malnutrition Universal Screening Tool (MUST), a validated, simple, and effective tool widely used for assessing nutritional risk in oncology patients. MUST is recognized for its applicability across various healthcare settings, including cancer care [21].
All participants were assessed for malnutrition risk using this tool, which evaluates three key factors: body mass index (BMI), unintentional weight loss, and the impact of acute illness, such as nothing by mouth for more than five days. Each factor is scored independently on a scale of 0 to 2.
The overall malnutrition risk is classified as low (score = 0), medium (score = 1), or high (score ≥ 2), providing a comprehensive assessment. While each criterion can individually predict clinical outcomes, combining all three offers a more accurate risk prediction [21].

2.5. Assessment of quality of life

To assess the participants’ quality of life, each individual completed a questionnaire adapted from the EORTC QLQ-C30 [22]. This tool evaluates three key domains: functional abilities, symptoms, and overall health status. It covers a range of topics, including “daily activities, pain, fatigue, appetite, breathing, vomiting, constipation, diarrhea, nausea, sleep, tension, worry, depression, overall health, and quality of life”. The questionnaire was administered after participant enrollment, and scores were calculated based on their responses.

2.6. Assessment of dietary intake

Participants’ dietary intake was assessed using a three-day food record, provided to each individual upon enrollment in the study. The data collected were analyzed using ESHA software (version 10.6.3) to evaluate adherence to dietary recommendations, which could affect both macro- and micronutrient intake. The results were compared with the Recommended Dietary Allowances (RDA) for cancer patients. Participants were then categorized into two groups: "adequate" if their intake met the RDA, and "inadequate" if it fell below the RDA [23,24]. Nutrition care was considered available when participants adhered to the dietary recommendations provided by the dietitian.

2.7. Statistical analysis

Data were collected, encoded, and analyzed using SPSS version 25. Descriptive statistics, such as means and standard deviations (SDs), were used to summarize continuous variables, while frequencies and percentages described categorical variables. The Kolmogorov–Smirnov test was employed to assess the normality of continuous data.
To compare actual dietary intake with recommended values, a paired-sample t-test was applied. Dietary intake was classified as adequate or inadequate based on whether it met the RDA for cancer patients. Quality of life scores were categorized as poor if they were 3 or lower and good if above 3. The MUST score was used to classify malnutrition as high risk for scores ≥ 2, medium risk for a score of 1, and no risk for a score of 0. The Chi-square test then was used to analyze differences in the frequencies of dietary intake, quality of life, and malnutrition risk. For skewed data distributions, the Mann–Whitney U test was used for independent samples, and the Wilcoxon signed-rank test for paired samples. Binary logistic regression was performed to identify the significant predictors for malnutrition risk and mediation analysis to assess the mediation role of FFMI and MUAMA on the relationship between dietary intake and the malnutrition risk among the GI cancer patients. A p-value of ≤ 0.05 was considered statistically significant for all tests.

3. Results

3.1. General characteristics of the study subjects

A total of 856 patients were screened for eligibility to participate in this study. Of these, 756 were excluded, leaving 100 patients (60 males and 40 females) who met the inclusion criteria. The mean age of the participants was 59.2 ± 9.8 years. The average weight was 59.8 ± 8.4 kg, height was 1.7 ± 0.09 meters, and the mean BMI was 20.7 ± 2.4 kg/m².
On average, patients experienced a weight loss of 11.9 ± 5.7 kg over 4 months. The mean MUST score was 3.1 ± 1.7, indicating a moderate to high risk of malnutrition in the cohort. Additionally, the mean Waist-to-Hip Ratio (WHR) was 0.97 ± 0.1, MUAC was 23.0 ± 2.9 cm, and TSF was 7.3 ± 6.4 mm.

3.2. Malnutrition risk, muscle depletion, adequacy of dietary intake and quality of life scales

Malnutrition risk, muscle depletion, adequacy of dietary intake , and quality of life were assessed based on the type of GI cancer. Table 1 indicates that approximately 63% of the male participants had colorectal cancer. Among the GI cancer patients, 20% had a BMI below 18.5 kg/m², 85.4% experienced weight loss greater than 10%, and 90% were classified as being at medium to high risk of malnutrition.
Overall, 80% (CI: 0.708 – 0.873) of the study participants were found to be at high risk for malnutrition. However, there were no statistically significant differences (P > 0.05) between gastric and colorectal cancer patients in terms of malnutrition risk, BMI, weight loss, acute disease scores, or muscle depletion as measured by both the FFMI and MUAMA. Additionally, no significant differences were observed in the adequacy of dietary intake or in quality of life scores between the two groups.
Despite this, 60% of the patients reported poor functional status and symptom scale scores, indicating a diminished quality of life.
A comparison of GI cancer patients revealed no statistically significant differences between male and female patients in terms of BMI (P = 0.495) and weight loss (P = 0.157). However, a significant difference was found in their acute disease scores (P = 0.007), with 43.3% of males scoring 2.
Additionally, no statistically significant differences were observed in malnutrition risk (P = 0.203), healthcare scale (P = 0.824), symptom scale (P = 0.082), adequacy of dietary intake (P = 0.298), or the type of GI cancer (P = 0.539) between males and females.
On the other hand, significant differences were detected in the functional scale (P = 0.006), where 75% of males had poor functional scale scores. Muscle depletion indicators also showed significant differences between the sexes. For the FFMI, 75% of males had depleted muscle mass compared to 50% of females (P = 0.018), and for MUAMA, 63% of males had muscle depletion compared to 32.5% of females (P = 0.001).
Table 1. Malnutrition risk, muscle depletion, adequacy of dietary intake and quality of life scales according to the type of gastrointestinal cancer (N = 100).
Variable Type of cancer P-value
All
(N = 100)
Gastric
(n=41)
Colorectal
(n= 59)
n (%) n (%) n (%)
Sex
-  Male
-  Female
 
60 (60.0)
40 (40.0)
 
23 (56.1)
18 (43.9)
 
37 (62.7)
22 (37.3)
 
0.323
BMI score (kg/m2)
-  > 20
-  18.5-20
-  < 18.5
 
51 (51.0)
35 (35.0)
14 (14.0)
 
17 (41.5)
16 (39.0)
8 (19.5)
 
34 (57.6)
19 (32.2)
6 (10.2)
 
0.216
Weight loss score (%)
-  < 5
-  5-10
-  > 10
 
9 (9.0)
15 (15.0)
76 (76.0)
 
1 (2.4)
5 (12.2)
35 (85.4)
 
8 (13.6)
10 (16.9)
41 (69.5)
 
0.103
Acute disease score
-  Zero
-  One
-  Two
 
46 (46.0)
20 (20.0)
34 (34.0)
 
17 (41.5)
8 (19.5)
16 (39.0)
 
29 (49.2)
12 (20.3)
18 (30.5)
 
0.659
Malnutrition risk
-  No risk
-  Medium risk
-  High risk
 
9 (9.0)
11 (11.0)
80 (80.0)
 
1 (2.4)
3 (7.3)
37 (90.2)
 
8 (13.6)
8 (13.6)
43 (72.9)
 
 
0.093
Muscle depletion for
FFMI (kg/m2)
-  Normal
-  Depleted
MUAMA (Cm2)
-  Normal
-  Depleted
 
 
35 (35.0)
65 (65.0)
40 (40.0)
60 (60.0)
 
 
12 (29.3)
29 (70.7)
14 (34.1)
27 (65.9)
 
 
23 (39.0)
36 (61.0)
26 (44.1)
33 (55.9)
 
0.216
 
0.397
 
Dietary intake
-  Adequate
-  Inadequate
 
40 (40.0)
60 (60.0)
 
13 (31.7)
28 (68.3)
 
27 (45.8)
32 (54.2)
 
0.114
Health care scale
-  Good
-  Bad
 
70 (70.0)
30 (30.0)
 
27 (65.9)
14 (34.1)
 
43 (72.9)
16 (27.1)
 
0.296
 
Functional scale
-  Good
-  Bad
 
36 (36.0)
64 (64.0)
 
16 (39.0)
25 (61.0)
 
20 (33.9)
39 (66.1)
 
0.376
Symptoms scale
-  Good
-  Bad

32 (32.0)
68 (68.0)

12 (29.3)
29 (70.7)

20 (33.9)
39 (66.1)

0.395
Data are presented as frequencies (n) and percentages (%). BMI: Body mass index; FFMI: Fat free mass index; MUAMA: Mid upper arm muscle area . Muscle depletion was assessed by determining the FFMI and the MUAMA for both males and females. Muscle depletion was considered if the FFMI < 14.6 kg/m2 and or the MUAMA < 32 cm2 for males and if the FFMI < 11.4 kg/m2 and or the MUAMA < 18 cm2 for females. P-value < 0.05 considered significant for the Chi-square test and Fisher exact test when one of the cells have a number less than 5.
Table 2 presents the malnutrition risk, muscle depletion, dietary intake adequacy, and quality of life scales according to both the type of GI cancer and sex. The results showed no statistically significant differences between male gastric and colorectal cancer patients across these variables.
However, among female patients, significant differences (P < 0.05) were found in BMI, weight loss scores, malnutrition risk, muscle depletion as measured by FFMI and MUAMA, and adequacy of dietary intake. Female patients with gastric cancer exhibited higher frequencies of these adverse outcomes compared to those with colorectal cancer.
Table 2. Malnutrition risk, muscle depletion, adequacy of dietary intake and quality of life scales according to the type of gastrointestinal cancer and sex (N = 100).


Variable
Male
(n = 60)


P-value
Female
(n = 40)


P-value

Type of cancer
 

Type of cancer
 
Gastric
(n = 23)
n (%)
Colorectal
(n = 37)
n (%)
Gastric
(n = 18)
n (%)
Colorectal
(n = 22)
n (%)
BMI score (kg/m2)
-  > 20
-  18.5-20
-  < 18.5
 
11 (47.8)
8 (34.8)
4 (17.4)
 
17 (45.9)
14 (37.8)
6 (16.2)
 
 
1.000
 
6 (33.3)
8 (44.4)
4 (22.3)
 
17 (77.3)
5 (22.7)
0.5 (0.0)^
 
 
0.004
Weight loss score (%)
-  < 5
-  5-10
-  > 10
 
1 (4.3)
3 (13.0)
19 (82.6)
 
2 (5.4)
5 (13.5)
30 (81.1)
 
 
1.000
 
^0.5 (0.0)
2 (11.1)
16 (88.9)
 
6 (27.3)
5 (22.7)
11 (50.0)
 
 
0.016
Acute disease score
-  Zero
-  One
-  Two
 
7 (30.4)
4 (17.4)
12 (52.2)
 
13 (35.1)
10 (27.0)
14 (37.8)
 
 
0.524
 
10 (55.6)
4 (22.4)
4 (22.4)
 
16 (72.7)
2 (22.4)
4 (18.2)
 
 
0.424
Malnutrition risk
-  No risk
-  Medium risk
-  High risk
 
1 (4.3)
1 (4.3)
21 (91.4)
 
2 (5.4)
5 (13.5)
30 (81.1)
 
 
0.633
 
^0.5 (0.0)
2 (11.1)
16 (88.9)
 
6 (27.3)
3 (13.6)
13 (59.1)
 
 
0.039
Muscle depletion for FFMI (kg/m2)
-  Normal
-  Depleted
 
7 (30.4)
16 (59.6)
 
8 (21.6)
29 (78.4)
 
0.320
 
5 (27.8)
13 (72.2)
 
15 (68.2)
7 (31.8)
 
0.012
Muscle depletion for MUAMA (cm2)
-  Normal
-  Depleted
 
8 (43.8)
15 (65.2)
 
11 (29.7)
26 (70.3)
 
0.448
 
6 (33.3)
12 (66.7)
 
15 (68.2)
7 (31.8)
 
0.028
Dietary intake
-  Adequate
-  Inadequate
 
8 (34.8)
15 (65.2)
 
13 (35.1)
24 (64.9)
 
0.601
 
5 (27.8)
13 (72.2)
 
14 (63.6)
8 (36.4)
 
0.025
Health care scale
-  Good
-  Bad
 
15 (65.2)
8 (34.8)
 
26 (70.3)
11 (29.7)
 
0.778
 
12 (66.7)
6 (33.3)
 
17 (77.3)
5 (22.7)
 
0.347
Functional scale
-  Good
-  Bad
 
7 (30.4)
16 (69.6)
 
8 (21.6)
29 (78.4)
 
0.320
 
9 (50.0)
9 (50.0)
 
12 (54.2)
10 (45.5)
 
0.512
Symptoms scale
-  Good
-  Bad

6 (26.1)
17 (73.9)

9 (24.3)
28 (75.7)

0.556

6 (33.3)
12 (66.7)

11 (50.0)
11 (50.0)

0.230
Data are presented as frequencies (n) and percentages (%). BMI: Body mass index; FFMI: Fat free mass index; MUAMA: Mid upper arm muscle area. Muscle depletion was assessed by determining the FFMI and the MUAMA for both males and females. Muscle depletion was considered if the FFMI < 14.6 kg/m2 and or the MUAMA < 32 cm2 for males and if the FFMI < 11.4 kg/m2 and or the MUAMA < 18 cm2 for females. P < 0.05 is significant for Chi-square test and Fisher exact test when one of the cells have a number less than 5.. ^Fisher exact test assuming cell with zero is approximately 0.5.

3.3. Dietary intake

Macronutrient intake was compared to the Recommended Dietary Allowances (RDAs) for all cancer patients. Results presented in Table 3 revealed statistically significant differences between the mean ± SD of actual dietary intake and the RDAs for total energy, protein, carbohydrates, fiber, and omega-3 and omega-6 fatty acids. The intake of these macronutrients among patients was significantly lower than the recommended levels.
Based on the above results, we compared malnutrition risk, muscle depletion, quality of life scales, and the type of GI cancer according to the adequacy of dietary intake and sex. The results presented in Table 4 showed significant differences (P < 0.05) in all variables except for sex, type of GI cancer, and healthcare score.
When comparing these variables based on dietary intake adequacy and sex, significant differences were found in BMI scores, weight loss scores, malnutrition risk, muscle mass depletion (measured by FFMI and MUAMA), and symptom scales. Higher frequencies of these adverse outcomes were observed among both male and female patients with inadequate dietary intake.
In addition, significant differences were detected in the acute disease score and functional scale among male patients, but not among female patients. Specifically, male patients with inadequate dietary intake had higher frequencies of scoring 2 on the acute disease scale and poor functional scale outcomes.
Table 4. Malnutrition risk, muscle depletion, and quality of life scales according to the dietary intake of the gastrointestinal cancer patients and sex (N = 100).
Variable Dietary intake Male Female
Adequate
(n=40)
Inadequate
(n= 60)
P Adequate
(n=21)
Inadequate
(n= 39)
P Adequate
(n=19)
Inadequate
(n= 21)
P
n (%) n (%) n (%) n (%) n (%) n (%)
Sex
-  Male
-  Female
 
21 (52.5)
19 (47.5)
 
39 (65.0)
21 (35.0)
 
0.149
 
NA
 
NA
 
NA
 
NA
 
NA
 
NA
BMI score (kg/m2)
-  > 20
-  18.5-20
-  < 18.5
 
39 (97.5)
1 (2.5)
^0.5 (0.0)
 
12 (20.0)
34 (56.7)
14 (23.3)
 
 
< 0.001
 
21 (100.0)
^0.5 (0.0)
^0.5 (0.0)
 
7 (17.9)
22 (56.4)
10 (25.6)
 
 
< 0.001
 
18 (94.7)
1 (5.3)
^0.5 (0.0)
 
5 (23.8)
12 (57.2)
4 (19.0)
 
 
< 0.001
Weight loss score (%)
-  < 5
-  5-10
-  > 10
 
9 (22.5)
15 (37.5)
16 (40.0)
 
^0.5 (0.0)
^0.5 (0.0)
60 (100.0)
 
 
< 0.001
 
3 (14.3)
8 (38.1)
10 (47.6)
 
^0.5 (0.0)
^0.5 (0.0)
39 (100.0)
 
 
< 0.001
 
6 (31.6)
7 (36.8)
6 (31.6)
 
^0.5 (0.0)
^0.5 (0.0)
21 (100.0)
 
 
< 0.001
Acute disease score
-  Zero
-  One
-  Two
 
26 (65.0)
8 (20.0)
6 (15.0)
 
20 (33.3)
12 (20.0)
28 (46.7)
 
 
0.002
 
13 (61.9)
5 (23.8)
3 (14.3)
 
7 (17.9)
9 (23.1)
23 (59.0)
 
 
0.001
 
13 (68.4)
3 (15.8)
3 (15.8)
 
13 (61.9)
3 (14.3)
5 (23.8)
 
 
0.897
Malnutrition risk
-  No risk
-  Medium risk
-  High risk
 
9 (22.5)
11 (27.5)
20 (50.0)
 
^0.5 (0.0) ^0.5 (0.0)
60 (100.0)
 
 
< 0.001
 
3 (14.3)
6 (28.6)
12 (57.1)
 
^0.5 (0.0)
^0.5 (0.0)
39 (100.0)
 
 
< 0.001
 
6 (31.6)
5 (26.3)
8 (42.1)
 
^0.5 (0.0)
^0.5 (0.0)
21 (100.0)
 
 
< 0.001
Muscle depletion for
FFMI (kg/m2)
-  Normal
-  Depleted
MUAMA (cm2)
-  Normal
-  Depleted
 
 
30 (75.0)
10(25.0)
25 (62.5)
15 (37.5)
 
 
5 (8.3)
55 (91.7)
17 (28.3)
43 (71.7)
 
 
< 0.001
 
0.0007
 
 
13 (61.9)
8 (38.1)
14 (66.7)
7 (33.3)
 
 
2 (5.1)
37 (94.9)
12 (30.8)
27 (69.2)
 
 
< 0.001
 
0.007
 
 
17 (89.5)
2 (10.5)
11 (57.9)
8 (42.1)
 
 
3 (14.3)
18 (85.7)
5 (23.8)
16 (76.2)
 
 
< 0.001
 
0.028
Type of cancer
-  Gastric
-  Colorectal
 
13 (32.5)
27 (67.5)
 
28 (46.7)
32 (53.3)
 
0.114
 
8 (38.1)
13 (61.9)
 
15 (38.5)
24 (61.5)
 
1.00
 
5 (26.3)
14 (73.7)
 
13 (61.9)
8 (38.1)
 
0.031
Health care scale
-  Good
-  Bad
 
32 (80.0)
8 (20.0)
 
38 (63.3)
22 (36.7)
 
0.058
 
17 (81.0)
4 (19.0)
 
24 (61.5)
15 (38.5)
 
0.154
 
15 (78.9)
4 (21.1)
 
14 (66.7)
7 (33.3)
 
0.488
Functional scale
-  Good
-  Bad
 
23 (57.5)
17 (42.5)
 
13 (21.7)
47 (78.3)
 
< 0.001
 
 
10 (47.6)
11 (52.4)
 
5 (12.8)
34 (87.2)
 
0.005
 
13 (68.4)
6 (31.6)
 
8 (38.1)
13 (61.9)
 
0.067
Symptoms scale
-  Good
-  Bad

26 (65.0)
14 (35.0)

6 (10.0)
54 (90.0)

< 0.001
 

13 (61.9)
8 (38.1)

2 (5.1)
37 (94.9)

< 0.001

13 (68.4)
6 (31.6)

4 (19.0)
17 (81.0)

0.003
Data are presented as frequencies (n) and percentages (% BMI: Body mass index; FFMI: Fat free mass index; MUAMA: Mid upper arm muscle area Muscle depletion was assessed by determining the FFMI and the MUAMA for both males and females. Muscle depletion was considered if the FFMI < 14.6 kg/m2 and or the MUAMA < 32 cm2 for males and if the FFMI < 11.4 kg/m2 and or the MUAMA < 18 cm2 for females P < 0.05 is significant for Chi-square test and Fisher exact test when one of the cells have a number less than 5 in the expected value in more than 20% of the cells. ^Fisher exact test assuming cell with zero is approximately 0.5.

3.4. Mediation analysis

This study examined the mediating role of FFMI and MUAMA as indicators of muscle mass depletion in the relationship between dietary intake and malnutrition risk in patients with GI cancer. The findings revealed a significant indirect effect of dietary intake on malnutrition risk via FFMI (b = 0.0953, t = 1.5031). Additionally, a significant indirect effect was observed through MUAMA (b = 0.1154, t = 1.9297).
The direct effect of dietary intake on malnutrition risk, accounting for the mediators (FFMI and MUAMA), was also significant (b = 0.4972, P < 0.0001), indicating partial mediation by both FFMI and MUAMA. Furthermore, sex was found to be a significant covariate, influencing both FFMI (b = -1.4776, t = -3.9999, P = 0.0001) and MUAMA (b = -8.1412, t = -7.4245, P < 0.0001), although its effect on malnutrition risk was not significant (b = -0.1365, t = -1.2932, P = 0.199). A summary of the mediation analysis is provided in Table 5 and Figure 1.
Dietary intake had a significant effect on FFMI (b = -2.4795, t = -6.7121, P < 0.0001), MUAMA (b = 3.0164, t = 2.7509, P = 0.0071), and malnutrition risk (b = 0.4972, t = 4.0438, P = 0.0001). While FFMI did not show a significant effect on malnutrition risk (b = -0.0385, t = -1.4265, P = 0.157), MUAMA significantly impacted malnutrition risk (b = 0.0382, t = 4.211, P = 0.0001). The total effect of dietary intake on malnutrition risk was also significant (b = 0.7079, t = 6.7066, P < 0.0001) (Figure 1).
Table 5. Summary of the mediation analysis results.
Preprints 138855 i001
FFMI: Fat free mass index; MUAMA: Mid upper arm muscle area; C.I: Confidence intervalP < 0.05 is significant for mediation analysis using Hayes Process Macro Model 4 with Multiple Mediators and Covariates.
Figure 1. Regression coefficients from the mediation analysis using Hayes Process Macro Model 4 with two mediators and age as covariate.
Preprints 138855 g001

3.5. Predictors of malnutrition risk

Table 6 presents the results of the logistic regression model, identifying significant predictors for malnutrition risk. Four key variables; sex, energy intake, MUAMA, and the type of GI cancer, showed a statistically significant contribution to the model.
The analysis indicates that females are 14.5 times more likely to be at risk of malnutrition compared to males, after adjusting for the other variables in the model. Energy intake is shown to be a protective factor, as higher daily energy intake is associated with a decreased risk of malnutrition. Additionally, for each unit increase in MUAMA, the odds of malnutrition decrease substantially, with a reduction in risk by approximately 16-fold compared to individuals with normal MUAMA. This suggests that greater muscle mass is a strong protective factor against malnutrition. Furthermore, the type of cancer also plays a critical role in predicting malnutrition risk. Patients diagnosed with gastric cancer are 14.4 times more likely to experience malnutrition compared to those with colorectal cancer. This highlights the higher vulnerability of gastric cancer patients to malnutrition, possibly due to the nature of the disease and its impact on nutrient absorption and digestive function.
In summary, sex, energy intake, MUAMA, and the type of GI cancer are crucial determinants of malnutrition risk. Being female, having lower energy intake and MUAMA, and being diagnosed with gastric cancer significantly increase the likelihood of malnutrition.
Table 6. Binary logistic regression model1 for the malnutrition risk outcome.
Variables in the equation B S.E. P-value OR 95% C.I. for OR
Lower Upper
Sex 2.676 1.260 0.034 14.526 1.229 171.701
Energy intake (Kcal/day) -0.007- 0.003 0.020 0.993 0.987 0.999
MUAMA (cm2) 2.774 1.143 0.015 16.024 1.706 150.507
Type of cancer 2.667 1.126 0.018 14.393 1.583 130.867
1Hosmer and Lemeshow test: χ² = 2.237; df = 8; p-value = 0.973. B: Regression coefficient. S.E.: Standard error of the regression coefficient. CI: Confidence interval. OR: Odd ratio. MUAMA: Mid upper arm muscle area. P-value ≤ 0.05 is statistically significant.

4. Discussion

This study highlights the high prevalence of malnutrition in gastric and colorectal cancer patients, with gastric cancer patients at higher risk of malnutrition and muscle depletion, especially females. Patients’ intake of essential nutrients, including energy and protein, was significantly below recommended levels, worsening malnutrition risk. Inadequate intake was linked to greater muscle loss, lower BMI, and severe weight loss. Muscle depletion partially mediated the relationship between diet and malnutrition risk. Greater muscle mass and energy intake protected against malnutrition, with cancer type and gender influencing risk. The findings emphasize the importance of nutritional interventions for cancer patients.
Malnutrition affects 20–70% of cancer patients globally, with GI cancer patients being particularly at risk [1]. In GI cancers, malnutrition prevalence can reach up to 80–90% [2,25], driven by disease progression, treatment side effects, and tumor impacts on digestion and metabolism, leading to weight loss and muscle wasting [2,3]. This compromises patients’ ability to handle surgical stress and affects postoperative recovery [26]. Factors like inadequate food intake, chronic illness, metabolic changes, psychological stress, and low socioeconomic status contribute to preoperative malnutrition, increasing complications, mortality rates, hospital stays, and healthcare costs [12,13,27].
A recent multicenter study in Spain assessed 469 gastrointestinal cancer patients (85% aged > 40 years) for malnutrition risk using MUST and the Global Leadership Initiative on Malnutrition (GLIM) criteria. It was found 17.9% at moderate risk (MUST score of 1) and 21.1% at high risk (MUST score ≥ 2). Among high-risk patients, 35.3% were moderately and 64.6% severely malnourished per GLIM [18]. Yi and Hong [16] used the Subjective Global Assessment (SGA) tool in 409 upper GI cancer patients in Malaysia, finding 92.1% malnourished. Our study aligns with these findings, showing 80% of GI cancer patients at high risk, with 90.2% of gastric and 73.9% of colorectal cancer patients affected but it is disagreed with Durán et al. [18] findings.
The high prevalence of malnutrition in GI cancer patients is linked to symptoms like poor appetite, nausea, vomiting, dysphagia, dyspepsia, and diarrhea, which affect food intake and nutrient absorption [25]. While this study did not collect detailed data on symptom severity, the used symptom scale revealed a significant association between worsening symptoms and inadequate dietary intake. This suggests that severe symptoms may worsen nutritional intake and increase malnutrition risk. Though lacking precise symptom severity data, the symptom scale offers valuable insights into the relationship between symptoms and malnutrition among GI cancer patients.
Despite the high prevalence of malnutrition in cancer patients, nutritional assessments are not routinely conducted [17,28], and 50% of malnourished patients remain undiagnosed or untreated [29].
Yi and Hong [16] used the Eastern Cooperative Oncology Group scale (ECOG) which is commonly used to assess physical function in oncology [26] and found that 61% of upper GI cancer patients had impaired functional status (ECOG scores of 2-3), linked to muscle loss, poor food intake, and depression. In our study, 64% of GI cancer patients showed poor functional status (EORTC QLQ-C30 scale) [22], with 78.3% having inadequate dietary intake, likely contributing to their functional decline.
Preoperative serum albumin is a useful marker for detecting malnutrition and predicting outcomes, with early intervention in hypoalbuminemia potentially reducing complications [30]. However, in our study, malnutrition risk was assessed using BMI, weight loss, and MUST scores, while muscle depletion was measured by FFMI and MUAMA. Biochemical markers like serum albumin were not included alongside these anthropometric measures and body composition tools, which could have offered a more comprehensive evaluation of malnutrition risk.
A recent study suggests men present more consistent malnutrition symptoms, making diagnosis easier [11]. However, our study found higher malnutrition risk among men (85%) than women (72.5%). Females with gastric cancer showed a significantly higher risk of malnutrition and muscle depletion compared to those with colorectal cancer. While overall dietary intake showed no sex-based differences, females with gastric cancer had a higher prevalence of inadequate intake. Among males, no significant intake differences were seen between cancer types. Despite easier identification of malnutrition in men, women were more likely to be malnourished, likely due to lower fat and muscle mass, as indicated by bioelectrical impedance analysis.
Two studies reported low muscle mass prevalence of 15% to 19.2% in newly diagnosed cancer patients using FFMI from BIA [31,32], lower than in our study, likely due to different cancer types. BIA’s limitations in assessing FFM, especially in metastatic patients, may contribute to inaccuracies [33]. Malnutrition rates of up to 77% have been reported in advanced cancer patients using the GLIM criteria and FFMI [34].
In the UK Biobank cancer cohort, malnutrition was more common than low muscle mass and sarcopenia, all linked to higher mortality [35]. Similarly, our study found higher malnutrition risk (80%) compared to muscle depletion (60-65%), with muscle depletion partially mediating the relationship between dietary intake and malnutrition.
A study on colorectal cancer patients found no significant effect of visceral adipose tissue (VAT) or subcutaneous adipose tissue (SAT), from CT scans on survival, but higher muscle mass improved 5-year survival rates, influenced by age, cancer stage, and surgery [36]. Although we did not assess survival, our analysis showed greater muscle mass protected against malnutrition, which is linked to lower survival.
Previous studies have shown that gastric cancer patients are more prone to malnutrition compared to those with colorectal cancer. This increased risk is often due to insufficient nutrient intake or absorption, leading to significant weight loss, alterations in body composition, and worse clinical outcomes [37]. In line with these findings, our study revealed that 85.4% of gastric cancer patients experienced weight loss greater than 10%, and 68.3% had inadequate dietary intake. In comparison, colorectal cancer patients showed lower rates of both weight loss (69.5%) and inadequate intake (54.2%). This weight loss is likely a result of reduced food consumption, compounded by GI symptoms [27].
A comprehensive dietary assessment, including current and past intake, should be done alongside tools like the SGA. Yi and Hong [16] found GI cancer patients consumed less than 25 kcal/kg/day. Our study also showed energy and protein intake below recommended levels. Malnutrition in GI cancer patients is often driven by mechanical obstructions, cancer cachexia, and anorexia [17,38].
The ESPEN highlights the need for early screening and continuous monitoring of nutrition, muscle mass, and inflammation in cancer patients [28]. Once malnutrition risk is identified, a dietitian’s assessment and multidisciplinary care are essential [12,17]. Preoperative nutritional interventions can improve patient outcomes by enhancing nutritional status and recovery after surgery [39].
The study supports the hypothesis but has limitations, including a small sample size, cross-sectional design, and reliance on BIA and anthropometric measurements instead of more accurate CT scans for muscle depletion. The absence of biochemical markers and not accounting for cancer stage further limit the findings’ accuracy and generalizability.

5. Conclusions

In conclusion, this study reveals a high prevalence of malnutrition and muscle depletion in gastrointestinal cancer patients, especially women with gastric cancer. Poor nutrient intake worsened these risks, leading to weight loss and reduced BMI. Muscle depletion partially mediated the link between diet and malnutrition. Routine nutritional screening and early interventions are vital to improving outcomes and survival rates.

Author Contributions

Conceptualization, methodology, supervision, resources, formal analysis, writing-original draft preparation N.A-B.; Investigation, methodology, resources, data curation, writing-review & editing M.H.; supervision, writing-review & editing A.B. All authors have read and agreed to the published version of the manuscript.

Funding

This research received no external funding

Institutional Review Board Statement

The study was conducted in accordance with the Declaration of Helsinki and approved by the Institutional Review Board (or Ethics Committee) of King Abdullah University Hospital (protocol code 13/111/2018 and date of approval 11 December 2018).

Informed Consent Statement

Written informed consent has been obtained from all subjects involved in the study.

Data Availability Statement

Data will be made available upon special request to the corresponding author.

Acknowledgments

The authors would like to acknowledge all the patients who participated in this study, as well as to the medical team at KAUH for their invaluable cooperation and support in facilitating our research.

Conflicts of Interest

The authors declare no conflicts of interest.

References

  1. Arends, J. Ernährung von Tumorpatienten. Aktuel Ernahrungsmed 2012, 37, 91–106. [CrossRef]
  2. Arends, J.; Bachmann, P.; Baracos, V.; Barthelemy, N.; Bertz, H.; Bozzetti, F.; Fearon, K.; Hütterer, E.; Isenring, E.; Kaasa, S.; Krznaric, Z.; Laird, B.; Larsson, M.; Laviano, A.; Mühlebach, S.; Muscaritoli, M.; Oldervoll, L.; Ravasco, P.; Solheim, T.; Strasser, F.; de van der Schueren, M.; Preiser, J. C. ESPEN guidelines on nutrition in cancer patients. Clin Nutr 2017, 36, 11–48. [CrossRef]
  3. Marshall, K.M.; Loeliger, J.; Nolte, L.; Kelaart, A.; Kiss, N.K. Prevalence of malnutrition and impact on clinical outcomes in cancer services: A comparison of two time points. Clin Nutr 2019, 38, 644-651. [CrossRef]
  4. Martin., L.; Birdsell, L.; Macdonald, N.; Reiman, T.; Clandinin, M.T.; McCargar, L.J.; Murphy, R.; Ghosh, S.; Sawyer, M. B.; Baracos, V. E. Cancer cachexia in the age of obesity: skeletal muscle depletion is a powerful prognostic factor, independent of body mass index. J Clin Oncol 2013, 31, 1539-1547. [CrossRef]
  5. Cederholm, T.; Barazzoni, R.; Austin, P.; Ballmer, P.; Biolo, G.; Bischoff, S.C.; Compher, C.; Correia, I.; Higashiguchi, T.; Holst, M.; Jensen, G. L.; Malone, A.; Muscaritoli, M.; Nyulasi, I.; Pirlich, M.; Rothenberg, E.; Schindler, K.; Schneider, S. M.; de van der Schueren, M. A.; Sieber, C.; Valentini, L.; Yu, J.C.; Van Gossum, A.; Singer, P. ESPEN guidelines on definitions and terminology of clinical nutrition. Clin Nutr 2017, 36, 49-64. [CrossRef]
  6. Deftereos, I.; Djordjevic, A.; Carter, V.M.; McNamara, J.; Yeung, J.M.; Kiss, N. Malnutrition screening tools in gastrointestinal cancer: A systematic review of concurrent validity. Surg Oncol 2021, 38, 101627. [CrossRef]
  7. Ye, X.J.; Ji, Y.B.; Ma, B.W.; Huang, D.D.; Chen, W.Z.; Pan, Z.Y.; Shen, X.; Zhuang, C. L.; Yu, Z. Comparison of three common nutritional screening tools with the new European Society for Clinical Nutrition and Metabolism (ESPEN) criteria for malnutrition among patients with geriatric gastrointestinal cancer: a prospective study in China. BMJ Open 2018, 8, e019750. [CrossRef]
  8. Seron-Arbeloa, C.; Labarta-Monzon, L.; Puzo-Foncillas, J.; Mallor-Bonet, T.; Lafita-Lopez, A.; Bueno-Vidales, N.; Montoro-Huguet, M. Malnutrition screening and assessment. Nutrients 2022, 14, 2392. [CrossRef]
  9. Cortés-Aguilar, R.; Malih, N.; Abbate, M.; Fresneda, S.; Yañez, A.; Bennasar-Veny, M. Validity of nutrition screening tools for risk of malnutrition among hospitalized adult patients: A systematic review and meta-analysis. Clin Nutr 2024, 43,1094-1116. [CrossRef]
  10. ager-Wittenaar, H.; Ottery, F.D. Assessing nutritional status in cancer: role of the Patient-Generated Subjective Global Assessment. Curr Opin Clin Nutr Metab Care 2017, 20, 322-329. [CrossRef]
  11. Gills, C.; Richer, L.; Fenton, T.R.; Gramlich, L.; Keller, H.; Culos- Reed, S.N.; Sajobi, T.T.; Awasthi, R.; Carli, F. Colorectal cancer patients with malnutrition suffer poor physical and mental health before surgery. Surgery 2021, 170, 841-847. [CrossRef]
  12. Ho, C.Y.; Majid, H.A.; Jamhuri, N.; Ahmad, A.F.; Selvarajoo, T.A. Lower ileostomy output among patients with postoperative colorectal cancer after being supplemented with partially hydrolyzed guar gum: Outcome of a pilot study. Nutrition 2022, 103-104,111758. [CrossRef]
  13. Lobo, D.N.; Gianotti, L.; Adiamah, A.; Barazzoni, R.; Deutz, N.E.P.; Dhatariya, K.; Greenhaff, P. L.; Hiesmayr, M.; Hjort Jakobsen, D.; Klek, S.; Krznaric, Z.; Ljungqvist, O.; McMillan, D. C.; Rollins, K. E.; Panisic Sekeljic, M.; Skipworth, R. J. E.; Stanga, Z.; Stockley, A.; Stockley, R.; Weimann, A. Perioperative nutrition: Recommendations from the ESPEN expert group. Clin Nutr 2020, 39, 3211-3227. [CrossRef]
  14. Al-Shahethi, A.H.; Mahdi, F.A.; Al-Shameri, E.A.; Abol Gaith, F.M. Factors associated with malnutrition in hospitalized cancer patients in a National Oncology Center in conflict-affected settings in Sana’a, Yemen: An institution-based cross-sectional study. Cureus 2023, 15, e45411. [CrossRef]
  15. Bye, A.; Sjøblom, B.; Wentzel-Larsen, T.; Grønberg, B.H.; Baracos, V.E.; Hjermstad, M.J.; Aass, N.; Bremnes, R. M.; Fløtten, Ø.; Jordhøy, M. Muscle mass and association to quality of life in non-small cell lung cancer patients. J Cachexia Sarcopenia Muscle 2017, 8, 759-767. [CrossRef]
  16. Yi, H.C.; Hong, B.Z. High Prevalence of malnutrition and associated factors in newly diagnosed upper gastrointestinal cancer patients: A cross-sectional study. Asian Pac J Cancer Care 2024, 9, 267-275. [CrossRef]
  17. Ho, C.Y.; Ibrahim, Z.; Abu Zaid, Z.; Mat Daud, Z’.; Md Yusop, N.B. Clinical malnutrition predictive model among gynecologic cancer patients prior to elective operation: A cross-sectional study. Clin Nutr 2021, 40, 4373-4379. [CrossRef]
  18. Durán Poveda, M.; Suárez-de-la-Rica, A.; Cancer Minchot, E.; Ocón Bretón, J.; Sánchez Pernaute, A.; Rodríguez Caravaca, G.; PREMAS Study Group. The prevalence and impact of nutritional risk and malnutrition in gastrointestinal surgical oncology patients: A prospective, observational, multicenter, and exploratory Study. Nutrients 2023, 15, 3283. [CrossRef]
  19. Lee, R.D.; Nieman, D.C. Nutrational Assessment, 5th ed.; McGraw-Hill: New York, USA, 2010; pp. 170-233.
  20. Huang, C.X.; Tighiouart, H.; Beddhu, S.; Cheung, A.K.; Dwyer, J.T.; Eknoyan, G.; Beck, G. J.; Levey, A. S.; Sarnak, M. J. Both low muscle mass and low fat are associated with higher all-cause mortality in hemodialysis patients. Kidney Int 2010, 77, 624–629. [CrossRef]
  21. Stratton, R.J.; Hackston, A.; Longmore, D.; Dixon, R.; Price, S.; Stroud, M.; King, C.; Elia, M. Malnutrition in hospital outpatients and inpatients: prevalence, concurrent validity and ease of use of the ‘malnutrition universal screening tool’ (‘MUST’) for adults. Br J Nutr 2004, 92, 799-808. [CrossRef]
  22. Available online: https://qol.eortc.org/questionnaire/eortc-qlq-c30/ (accessed on 8 August 2023).
  23. Parsa, N. Environmental factors inducing human cancers. Iran J Public Health 2012, 41, 1-9.
  24. Ravasco, P. Nutrition in cancer patients. J Clin Med 2019, 8, 1211. [CrossRef]
  25. Cushen, S.J.; Power, D.G.; Ryan, A.M. Nutrition assessment in oncology. Topics in Clin Nutr 2015, 30, 103-119. [CrossRef]
  26. Inciong, J. F. B.; Chaudhary, A.; Hsu, H. S.; Joshi, R.; Seo, J. M.; Trung, L. V.; Ungpinitpong, W.; Usman, N. Hospital malnutrition in northeast and southeast Asia: A systematic literature review. Clin Nutr ESPEN 2020, 39, 30-45. [CrossRef]
  27. Deftereos, I.; Yeung, J.M.C.; Arslan, J.; Carter, V.M.; Isenring, E.; Kiss N. Assessment of nutritional status and nutrition impact symptoms in patients undergoing resection for upper gastrointestinal cancer: Results from the multi-centre NOURISH point prevalence study. Nutrients 2021, 13, 3349. [CrossRef]
  28. Muscaritoli, M.; Arends, J.; Bachmann, P.; Baracos, V.; Barthelemy, N.; Bertz, H.; Bozzetti, F.; Hütterer, E.; Isenring, E.; Kaasa, S.; Krznaric, Z.; Laird, B.; Larsson, M.; Laviano, A.; Mühlebach, S.; Oldervoll, L.; Ravasco, P.; Solheim, T. S.; Strasser, F.; de van der Schueren, M.; Preiser, J.C.; Bischoff, S. C. ESPEN practical guideline: Clinical nutrition in cancer. Clin Nutr 2021, 40, 2898-2913. [CrossRef]
  29. Reber, E.; Schönenberger, K.A.; Vasiloglou, M.F.; Stanga, Z. Nutritional risk screening in cancer patients: The first step toward better clinical outcome. Front in Nutr 2021, 8, 603936. [CrossRef]
  30. Hu, W.; Cajas-Monson, L.C.; Eisenstein, S.; Parry, L.; Cosman, B.; Ramamoorthy, S. Preoperative malnutrition assessments as predictors of postoperative mortality and morbidity in colorectal cancer: an analysis of ACS-NSQIP. Nutr J 2015, 14, 91. [CrossRef]
  31. Cereda, E.; Pedrazzoli, P.; Lobascio, F.; Masi, S.; Crotti, S.; Klersy, C.; Turri, A.; Stobäus, N.; Tank, M.; Franz, K.; Cutti, S.; Giaquinto, E.; Filippi, A. R.; Norman, K.; Caccialanza, R. The prognostic impact of BIA-derived fat-free mass index in patients with cancer. Clin Nutr 2021, 40, 3901-3907. [CrossRef]
  32. Casirati, A.; Vandoni, G.; Della Valle, S.; Greco, G.; Platania, M.; Colatruglio, S.; Lalli, L.; Gavazzi, C. Nutritional status and body composition assessment in patients with a new diagnosis of advanced solid tumour: exploratory comparison of computed tomography and bioelectrical impedance analysis. Clin Nutr 2021, 40, 1268–1273. [CrossRef]
  33. Mourtzakis, M.; Prado, C.M.M.; Lieffers, J.R.; Reiman, T.; McCargar, L.J.; Baracos, V.E. practical and precise approach to quantification of body composition in cancer patients using computed tomography images acquired during routine care. Appl Physiol Nutr Metab 2008, 33, 997-1006. [CrossRef]
  34. Gascón-Ruiz, M.; Casas-Deza, D.; Torres-Ramón, I.; Zapata-García, M.; Alonso, N.; Sesma, A.; Lambea, J.; Álvarez-Alejandro, M.; Quílez, E.; Isla, D.; Arbonés-Mainar, J. M. GLIM vs ESPEN criteria for the diagnosis of early malnutrition in oncological outpatients. Clin Nutr 2021, 40, 3741–3747. [CrossRef]
  35. Kiss, N.; Prado, C. M.; Daly, R. M.; Denehy, L.; Edbrooke, L.; Baguley, B. J.; Fraser, S. F.; Khosravi, A.; Abbott, G. Low muscle mass, malnutrition, sarcopenia, and associations with survival in adults with cancer in the UK Biobank cohort. J Cachexia Sarcopenia Muscle 2023, 14, 1775-1788. [CrossRef]
  36. Abaza, H.; Taqash, A.; Shattal, M.A.; Abuhijla, F.; Abdel-Khaleq, H.; Awadallah, O.; Al-Jafari, K.; Al-Jafari, Z.; Al-Omari, A. Association between muscle mass and overall survival among colorectal cancer patients at tertiary cancer center in the Middle East. Sci Rep 2024, 14, 20836. [CrossRef]
  37. Cencioni, C.; Trestini, I.; Piro, G.; Bria, E.; Tortora, G.; Carbone, C.; Spallotta, F. Gastrointestinal cancer patient nutritional management: From specific needs to novel epigenetic dietary approaches. Nutrients 2022, 14, 1542. [CrossRef]
  38. Kubota, T.; Shoda, K.; Konishi, H.; Okamoto, K.; Otsuji, E. Nutrition update in gastric cancer surgery. Ann Gastroenterol Surg 2020, 4, 360-368. [CrossRef]
  39. Wischmeyer, P. E.; Carli, F.; Evans, D. C.; Guilbert, S.; Kozar, R.; Pryor, A.; Thiele, R. H.; Everett, S.; Grocott, M.; Gan, T. J.; Shaw, A. D.; Thacker, J. K. M.; Miller, T. E.; Hedrick, T. L.; McEvoy, M. D.; Mythen, M. G.; Bergamaschi, R.; Gupta, R.; Holubar, S. D.; Senagore, A. J.; Abola, R. E.; Bennett-Guerrero, E.; Kent, M.L.; Feldman, L.S.; Fiore Jr, J.F.; Perioperative Quality Initiative (POQI) 2 Workgroup. American Society for Enhanced Recovery and Perioperative Quality Initiative Joint Consensus Statement on Nutrition Screening and Therapy Within a Surgical Enhanced Recovery Pathway. Anesth Analg 2018, 126, 1883-1895. [CrossRef]
Table 3. Macronutrients intake compared to the recommended dietary allowances for all cancer patients (N = 100).
Macronutrients Intake
Mean ± SD
RDA
Mean ± SD
P-Value
Total energy (Kcal) 1574.8 ± 655.8 1796.0 ± 251.4* < 0.001
Protein (g) 96.8 ± 36.4 119.7 ± 16.8^ < 0.001
Carbohydrates (g) 167.0 ± 96.3 100.0 ± 0.0 < 0.001
Fat (g) 57.8 ±17.1 55.0 ± 0.0 0.108
Fiber (g) 26.9 ±7.2 30.0 ±0.0 < 0.001
Omega 3 and 6 (g) 1.9 ± 2.3 0.25 ± 0.0 < 0.001
Data are presented as means ± SD (Standard deviations). Paired sample t-test was used to test the differences between the means of actual macronutrients intake and the RDA. P-value < 0.05 considered significant for the paired sample t-test. RDA: Recommended dietary allowance for cancer patients per day. * RDA was calculated for each participants as 30 Kcal/ Kg/ day. ^ RDA was calculated for each participant as 2 g/ Kg/ day.
Disclaimer/Publisher’s Note: The statements, opinions and data contained in all publications are solely those of the individual author(s) and contributor(s) and not of MDPI and/or the editor(s). MDPI and/or the editor(s) disclaim responsibility for any injury to people or property resulting from any ideas, methods, instructions or products referred to in the content.
Copyright: This open access article is published under a Creative Commons CC BY 4.0 license, which permit the free download, distribution, and reuse, provided that the author and preprint are cited in any reuse.
Prerpints.org logo

Preprints.org is a free preprint server supported by MDPI in Basel, Switzerland.

Subscribe

Disclaimer

Terms of Use

Privacy Policy

Privacy Settings

© 2025 MDPI (Basel, Switzerland) unless otherwise stated