
Submitted:
07 November 2023
Posted:
08 November 2023
You are already at the latest version
Abstract
The phenomenon of decreased serum uric acid (UA) levels in patients with Parkinson’s disease (PD) and its relationship with purine metabolic pathways remain unclear. We compared inosine, hy-poxanthine, xanthine, and UA levels in serum and cerebrospinal fluid (CSF) of PD patients with those of controls, and investigated the effect of changes in the purine metabolic system on UA levels in PD. Overall, 134 samples (serum, 45 PD patients and 30 controls; CSF, 39 PD patients and 20 controls), were analyzed using liquid chromatography-tandem mass spectrometry. A general linear model (GLM) was used to investigate relationships among purine metabolites. Compared to controls, PD patients had significantly lower UA levels in the serum and CSF, and serum and CSF UA levels were significantly correlated. Additionally, in PD, decreased serum hypoxanthine levels were observed with decreased CSF inosine and hypoxanthine levels, suggesting the involvement of the purine recycling system. GLM analysis indicated that the reduced UA levels in PD were mainly due to sources other than the purine metabolic system, such as exercise, nutritional indices, muscle volume, or adipose tissue. Our results highlight the impairment of purine recycling pathways in PD, as evidenced by the decreased serum hypoxanthine and CSF inosine.
Keywords:
uric acid
; purine recycling disorders
; Parkinson’s disease
; cerebrospinal fluid
; general linear model
1. Introduction
Parkinson’s disease (PD) is the second most prevalent neurodegenerative disorder. Despite the undetermined pathogenesis of PD, serum uric acid (UA) levels are decreased in patients with PD [1,2]. A meta-analysis of dose–response studies established a correlation between a 6% increased risk of PD and every 1 mg/dL decrement in serum UA levels [3]. Additionally, low serum UA levels have been associated with progression [4] and non-motor dysfunction [5] in PD.
However, the causal relationship between decreased UA levels and PD onset and progression remains unclear. Although urate transporter gene polymorphisms determine UA levels, a Mendelian randomization study failed to determine any correlation between gene polymorphisms and PD development [6,7,8]. Furthermore, patients with rapid eye movement (REM) sleep behavior disorder, a prodromal feature of PD, do not exhibit a notable reduction in serum UA levels compared with healthy controls [9,10]. A recent double-blind study also found that increasing serum UA levels by inosine administration did not improve any clinical symptoms or inhibit PD progression [11]. These findings suggest that the reduction in serum UA levels in PD is not a causative factor in the onset or progression of the disease but rather a consequence of impaired mitochondrial function, altered gastrointestinal function, and impaired motor function, which may also influence the onset and progression of PD (reverse causation) [12]. Nevertheless, there are no reports examining the relationship between cerebrospinal fluid (CSF) UA levels and clinical symptoms in PD. Furthermore, studies on the relationship between blood and CSF UA levels have only been conducted in a limited number of cases.
Alterations in the purine metabolic system are also crucial for understanding the pathophysiological background of lower UA levels in patients with PD because UA is produced through the following process: inosine monophosphate (IMP) → inosine → hypoxanthine → xanthine → UA (Figure 1). An mRNA study revealed changes in gene expression related to extensive purine metabolism in the substantia nigra of patients with PD [13]. The intermediate metabolite hypoxanthine, which is recycled to the nucleotide IMP by hypoxanthine-guanine phosphoribosyltransferase, plays a significant role in producing adenosine triphosphate (ATP) alongside mitochondria in humans and is decreased in the sera of LRRK2-related PD [14]. However, to our knowledge, there have been no studies examining both UA levels and its upstream purine metabolism in the CSF and blood of patients with PD. Clarifying this issue is expected to help elucidate the mechanism behind the low blood UA levels in PD, as well as the paradox that, while lower blood UA levels in PD correlate with increased disease severity, elevating these levels does not result in improved clinical symptoms.
Therefore, this study aimed to 1) determine the levels of inosine, hypoxanthine, xanthine, and UA in the serum and CSF in patients with PD in comparison with healthy controls; 2) investigate the effect of changes in the purine metabolic system on UA levels in the serum and CSF of patients with PD using a general linear model (GLM) that assumes the production of downstream substances along metabolic pathways; and 3) investigate the influence of serum UA levels on CSF UA levels, the correlation between serum and CSF UA levels, the difference in concentrations between serum and CSF UA, and the relationship between CSF UA and blood–brain barrier permeability.
2. Materials and Methods
2.1. Participants
We enrolled 45 patients with PD (30 males and 15 females; age at examination, 68.4 ± 7.3 years; mean disease duration, 88.9 ± 53.7 months) admitted to Fujita Health University Hospital between July 2020 and September 2021 who met the Movement Disorder Society (MDS) diagnostic criteria [15], 30 age- and sex-matched healthy participants (16 males and 14 females; age at examination, 68.9 ± 9.1 years) in the serum study, and 20 age-matched participants (14 males and six females; age at examination, 68.2 ± 8.9 years) without a history of neuromuscular disease in the CSF study from our ongoing aging cohort study at Fujita Health University, Japan. We did not include patients with PD with observable anatomical abnormalities in the brain examined using magnetic resonance imaging. We ascertained the appropriate sample size for our study based on the mean and standard deviation from precedent Japanese investigation [14]. The sample size was determined using OpenEpi (version 3), an open-source calculator, which revealed a total sample size of 74 under a confidence interval of 95%, power of 80%, and ratio of sample size 1 (http://www.openepi.com/Menu/OE_Menu.htm). Ethical approval was obtained from the ethics committees of Fujita Health University Hospital, and written informed consent was procured from all participants before their involvement.
2.2. Clinical evaluation
To elucidate the relationship between purine metabolites and various clinical indices, we assessed patients with PD using the MDS-Unified Parkinson’s Disease Rating Scale (UPDRS) Parts I–IV and various cognitive function tests, including the Frontal Assessment Battery, Japanese version of Addenbrooke’s Cognitive Examination-Revised (ACE-R), Mini-Mental State Examination, and Japanese version of the Montreal Cognitive Assessment (MoCA-J). Additionally, we evaluated the quality of life of patients with PD using the Parkinson’s Disease Questionnaire-39, depression using the Geriatric Depression Scale-15, olfaction using the Odor Stick Identification Test for Japanese (OSIT-J), REM sleep behavior disorder using the Japanese version of the REM Sleep Behavior Disorder Screening Questionnaire, autonomic dysfunction using the Scales for Outcomes in Parkinson’s Disease - Autonomic Dysfunction, excessive daytime sleepiness using the Epworth Sleepiness Scale, and impulsivity using the Japanese version of the Questionnaire for Impulsive-Compulsive Disorders in Parkinson’s disease.
2.3. Blood and CSF sample preparation
We collected blood samples after >6 h of fasting. The samples were centrifuged for 10 min at 1,500 g, and 500 µL aliquots of serum were immediately frozen at −80°C until assay. We divided each aliquot to avoid repeated freezing and thawing cycles. We also obtained CSF by a standard lumbar puncture during fasting. If there were signs of bloody CSF at the time of collection, the first 1–2 mL were discarded. We collected approximately 2 mL immediately after a puncture with sterile sample tube and used it for protein, glucose, and cell counts. We obtained the subsequent 6–7 mL directly into 15 mL of sample tube, transferred it without inverted mixing, placed it on ice, centrifuged it at 1500 g for 10 min at 4°C, aliquoted it, and froze it at −80°C for future analysis.
2.4. CSF/serum albumin quotient
In assessing the kinetics of each purine metabolite between CSF and serum, to estimate the blood–brain barrier permeability, the albumin quotient (Qalb) was calculated as follows:
Data on CSF and serum albumin levels were retrospectively collected from medical records.
Qalb = (CSF albumin concentration [mg/dL]/serum albumin concentration [mg/dL]) × 1000
2.5. Purine metabolite measurement
2.5.1. Reagents and instruments
Hypoxanthine, inosine, xanthine, mass spectrometry (MS)-grade acetonitrile, and ammonium acetate were purchased from Fujifilm Wako (Osaka, Japan). UA sodium salt was purchased from Merck Sigma-Aldrich (St. Louis, MO). Hypoxanthine-15N4 and UA-15N2 were purchased from Cambridge Isotope Laboratories (Tewksbury, MA).
A Nexera ultra-high-performance liquid chromatography system (Shimadzu, Kyoto, Japan) was used, consisting of a gradient pump, vacuum degassed, and an autosampler. An Intrada Organic Acid column (150 × 2 mm, Imtakt, Kyoto, Japan) was used at 60°C. Five microliters of the analyte solution were injected into the column and eluted at a flow rate of 0.2 mL/min using a step gradient alternating between A, a mixture of acetonitrile/100 mM ammonium acetate (95:5), and B, a mixture of acetonitrile/100 mM ammonium acetate (10:90). The gradient began with 15% B and was then programmed as follows: 0–5 min, gradient to 55% B; 5–5.1 min, gradient to 70% B; 5.1–10 min, gradient to 100% B; 10–10.1 min, gradient back to 15% B; and 10.1–13 min, hold at 15% B to re-equilibrate the column.
An LCMS-8060 or LCMS-8060NX triple quadrupole mass spectrometer (Shimadzu) equipped with an electrospray ionization source was used for the MS/MS analysis. Hypoxanthine and inosine were analyzed in positive-ion multiple reaction monitoring (MRM) mode, and xanthine and UA were analyzed in negative-ion MRM mode. The mass transitions used were as follows: m/z 137 > 119 for hypoxanthine, m/z 269 > 137 for inosine, m/z 151 > 108 for xanthine, m/z 167 > 124 for UA, m/z 141 > 123 for hypoxanthine-15N4, and m/z 169 > 125 for UA-15N2.
2.5.2. Calibration curve
A mixed standard solution of hypoxanthine, xanthine, inosine, and UA was diluted to 0.05, 0.1, 0.2, 0.4, 0.8, 1.5, 3.0, 6.0, 12, 25, 50, and 100 μM, respectively. A mixed internal standard (IS) solution of hypoxanthine-15N4 and UA-15N2 was prepared by diluting the stock solution to 10 μM. Calibration curves were prepared after mixing 25 μL of the respective standard solution, 80 μL acetonitrile, 20 μL water, and 15 μL IS solution.
2.5.3. Sample preparation
In total, 80 μL acetonitrile, 20 μL water, and 15 μL IS solution were added into 25 μL serum. After the mixture was vortexed, it was centrifuged at 12,000 g for 10 min at 4°C. The supernatant was analyzed using liquid chromatography-MS/MS. Serum diluted to 1/10 was used for UA analysis.
2.6. Statistical analyses
We used JMP software version 16 (SAS Institute, Cary, NC) for the statistical analyses. Differences were considered statistically significant at p < 0.05. Fisher’s exact test was used to compare the sex distribution between the two groups. We tested the normality of the variables and homoscedasticity using the Shapiro–Wilk and Levene’s tests. The Wilcoxon rank-sum test was used to compare continuous variables between the two groups because assumptions of normality or homogeneity of variance were violated. After running the Wilcoxon rank-sum test, the effect size (r) is calculated as the standardized Z-score divided by square root of the total number of samples. Correlations between continuous variables were assessed using Spearman’s rank correlation test. Continuous variables are expressed as mean ± standard deviation. To evaluate the discrimination capacity of purine metabolites between PD and control, receiver operating characteristic (ROC) curve analysis was performed.
To estimate whether low UA levels are due to internal factors, that is, upstream changes in the purine metabolic system, or other extrinsic factors, assuming that downstream metabolites were generated along metabolic pathway, we also performed the regression analysis using a GLM formulated as follows:
where x represents the upstream metabolite concentration, 𝑦 the downstream metabolite concentration and 𝑧 a dummy variable (1 for PD, 0 for control). For the parameter, αb is the baseline for effects due to extrinsic factors, βb is the standard effects of upstream, αp the change in effects due to different paths caused by PD, and βp the amount of change in the effect due to upstream. We included standardized regression coefficients in addition to their unstandardized regression coefficients, as the latter is not interpretable as an index of the predictive strength of the variable when accounting for others in the model. We also investigated the effects of age, sex, and weight on the result.
y = αb + βbx + z(αp + βp x) + (error),
3. Results
3.1. Demographics
This study found no significant disparities in demographic parameters, such as age, sex, height, weight, or body mass index (BMI), between the PD and control groups. The PD group exhibited significantly lower MoCA-J and ACE-R scores and higher GDS-15 scores than the control group (Table 1).
3.2. Serum study
Serum UA (p<0.0001) and hypoxanthine (p=0.0001) levels were significantly lower in the PD group compared with the control group with a large effect size (r=0.5139) and a moderate effect size (r=0.4477), respectively (Figure 2). Regarding the ROC analysis, UA and hypoxanthine effectively distinguished the PD and control groups (areas under the curve [AUCs]: UA, 0.8052; hypoxanthine, 0.7333). The correlations between serum purine metabolites and clinical parameters in the PD group are summarized in Table S1. The PD group demonstrated a positive correlation between UA levels and both height (rs=0.4711, p=0.0011) and weight (rs=0.3128, p=0.0364), as well as a negative correlation between hypoxanthine levels and RBDSQ-J scores (rs = -0.3027, p=0.0433), OSIT-J scores (rs = -0.3173, p=0.0358), and ESS scores (rs = -0.3051, p=0.0415). In the control group, UA levels were positively correlated with height (r=0.4358, p=0.0161), weight (r=0.6005, p=0.0005), and BMI (r=0.3949, p=0.0308). Moreover, a sex-based disparity was observed, with higher UA levels in males than in females (PD, p=0.0177; control, p=0.0438).
GLM analysis indicated that UA concentrations were not significantly associated with upstream xanthine concentrations but were significantly influenced by extrinsic factors and negatively affected by PD. Furthermore, hypoxanthine and xanthine concentrations were influenced by both upstream and extrinsic factors (Figure 3, Table 2). These relationships were also observed when we incorporated age, sex, and weight as explanatory variables (Table S2).
3.3. CSF study
Demographic parameters, such as age, sex, height, and weight, were similar between the PD and control groups, with no significant differences. However, a significant difference in BMI was observed, with lower values observed in the PD group than in the control group (Table 1). The PD group had significantly lower UA (p=0.0028), hypoxanthine (p=0.0245), and inosine (p<0.0001) levels than the control group with moderate (r=0.3888), moderate (r=0.2929), and large effect sizes (r=0.5411), respectively (Figure 4). Regarding the ROC analysis, inosine and UA effectively distinguished the PD and control groups (AUC: inosine, 0.8333; UA, 0.7397).
The correlations between CSF purine metabolites and clinical parameters in the PD group are summarized in Table S3. The PD group demonstrated a negative correlation between UA levels and ESS scores (rs = -0.3827, p=0.0162).
GLM analysis revealed a negative correlation between UA values and upstream xanthine concentrations, and UA concentrations were significantly influenced by extrinsic factors and negatively affected by PD, although only the path from xanthine to UA was not significant in the original model without confounders but became significant when including confounders in serum. Conversely, hypoxanthine and xanthine concentrations were positively correlated with upstream inosine and hypoxanthine concentrations, respectively, and were not significantly affected by the other systems (Figure 3, Table 3). We observed these relationships even after accounting for age, sex, and weight as confounding variables (Table S4).
3.4. Relationship between serum and CSF in PD
A significant correlation was observed between serum and CSF UA levels in the PD group (rs=0.379, p=0.0188). No significant correlation was found between the serum and CSF levels of inosine, hypoxanthine, and xanthine.
Examination of the CSF-to-plasma ratio showed that UA (0.1081 ± 0.0372) and inosine (0.396 ± 0.370) had lower CSF values than serum values. Conversely, hypoxanthine had higher CSF values than plasma values (2.721 ± 1.788), and xanthine values were relatively similar (1.089 ± 0.980).
A significant correlation was observed between CSF UA and Qalb (rs=0.4361, p=0.0088), but not for inosine, hypoxanthine, or xanthine. Qalb demonstrated a significant positive correlation with the CSF-to-plasma UA ratio (rs=0.5199, p=0.0014), but not with inosine, hypoxanthine, or xanthine.
4. Discussion
We compared levels of serum and CSF inosine, hypoxanthine, xanthine, and UA between patients with PD and healthy controls, and investigated how changes in purine metabolism affect UA levels using GLM analysis. In the current study, serum and CSF UA levels were reduced in patients with PD. The results of the GLM analysis indicate that the reduction in UA may result from factors related to PD pathology but unrelated to the purine metabolic pathway, such as exercise, nutritional indices, muscle volume, or adipose tissue, which may affect UA levels. Furthermore, we observed significant reductions in serum hypoxanthine values and inosine and hypoxanthine levels in the CSF, suggesting the involvement of the purine recycling system in PD.
4.1. Reduced UA levels in PD
In the current study, as reported previously [1,2,3,4,5], the PD group had significantly lower serum UA levels than the control group. GLM analysis indicated that the PD and control groups were significantly influenced by factors other than purine metabolism, suggesting that there are factors contributing to the greater reduction in serum and CSF UA values in the PD group compared with the control group. Further studies are necessary to investigate the potential effect of changes in the gut microbiota, poor nutritional status [17], weight loss [18], and physical inactivity [19], which affect both the pathogenesis of PD and the decline in UA levels.
This study also confirmed that CSF UA values were lower in the PD group compared with the control group [20–22]. GLM analysis suggested that factors other than the purine metabolic system might influence CSF UA values. Few xanthine oxidoreductases are present in the central nervous system, which convert xanthine to UA, and UA does not cross the blood–brain barrier [23]. Thus, UA in the CSF is transferred exclusively from the blood through urate transporters in the choroid plexus [24]. This study revealed that CSF UA values correlated with serum UA and Qalb values, suggesting that disruption of the blood–brain barrier affects CSF UA values. However, the CSF concentration of UA was low, approximately one-tenth of the serum concentration. This limited effect of changes in serum UA levels on changes in CSF UA levels may be one reason why the administration of inosine, despite increasing blood UA levels with antioxidant properties, does not improve clinical symptoms in PD [11].
4.2. Reduced inosine levels in CSF
The current study found a significant reduction in inosine levels in the CSF of patients with PD, but not in the serum. There was no significant correlation between CSF inosine and Qalb. Inosine is generated from nucleotides, such as IMP and AMP [25] (Figure 1). As inosine can cross the blood–brain barrier [26], blood inosine levels may also influence CSF inosine levels. However, exogenous inosine is quickly taken up by the intestinal epithelium and hepatocytes, which metabolize most of it to hypoxanthine, supporting the view that serum inosine did not show a significant reduction in the PD group compared with the control group [27]. Furthermore, mouse experiments have shown that although a slight increase in brain inosine concentration was observed after the administration of a large dose of inosine, the concentration returned to baseline 2 h later [28], suggesting a limited effect of blood inosine on CSF inosine. Several studies have reported abnormalities in mitochondrial function [29], the glycolytic system [30], and fatty acid metabolism [31] in patients with PD. The reduced CSF inosine levels may reflect a reduction in nucleotide production in the central nervous system, and further investigation is necessary.
4.3. Reduced hypoxanthine in serum and CSF
Compared with healthy controls, patients with PD had substantially lower serum and CSF hypoxanthine levels. Over 90% of hypoxanthine is recycled as IMP [32] in the salvage pathway (Figure 1), which plays a crucial role in preserving energy-yielding purines and ATP in humans because of the limited activity of de novo synthesis of purine nucleotide systems relative to other mammals and species [33]. Hypoxanthine in the blood crosses the blood–brain barrier and is used in the central nervous system for ATP production [23,26]. The CSF study revealed hypoxanthine levels that were twice as high as those in the serum and strongly correlated with inosine generated from IMP and adenosine monophosphate in the brain. GLM analysis revealed no notable effects, except for the purine metabolic system in CSF. These findings suggest that the decline in CSF hypoxanthine mirrors a reduction in nucleotides in the brain, similar to inosine.
A decrease in serum hypoxanthine in PD has been previously documented in cases of LRRK2 mutations [14]; however, a comprehensive metabolomics study of eight patients with sporadic PD indicated elevated levels [34]. However, this study did not mention the duration of plasma storage. Despite reports indicating that a prolonged time for plasma separation leads to elevated hypoxanthine and xanthine values leached from erythrocytes [35], our study processed blood samples within 2 h, which is not considered to affect the results [36]. Serum hypoxanthine is mainly produced in muscles [22] and adipose tissues [37], and patients with PD exhibit decreased physical activity [38] and abnormalities in lipid systems [39], which may contribute to the reduction in hypoxanthine levels.
Febuxostat, an inhibitor of inosine and xanthine oxidoreductase, may improve parkinsonism in PD by augmenting plasma hypoxanthine values irrespective of decreased UA levels [40]. As the present study found no correlation between changes in UA levels and improvements in parkinsonism, in addition to the considerably lower UA levels in the CSF than in the blood and the limited impact of serum UA on CSF UA levels, our results suggest that treatments aimed at elevating serum UA levels might have limited efficacy in improving parkinsonism. The present findings suggest that impairments in the salvage pathway related to purine recycling may serve as a therapeutic target for PD.
4.4. Limitations
This study had some limitations. First, we did not assess factors such as exercise, nutritional indices, muscle volume, or adipose tissue, which may affect UA and hypoxanthine levels. Second, our study was cross-sectional and did not examine long-term changes in UA, inosine, hypoxanthine, and xanthine levels and their correlation with clinical indices. Third, we did not examine the influence of adenosine and guanosine on inosine levels or the purine recycling system. Fourth, this was a single-center study, and the number of participants was relatively limited. Finally, we did not explore the relationship between nucleotide status in the brain and inosine and hypoxanthine. Future longitudinal studies along with multimodal imaging and omics data addressing these limitations will provide novel insights into the pathogenesis of PD related to energy imbalance.
5. Conclusions
In conclusion, our findings suggest that the reduction in UA levels in PD is mainly due to sources other than the purine metabolic system. Decreased serum and CSF hypoxanthine and CSF inosine suggest the impairment of purine recycling pathways in PD, irrespective of UA production.
Supplementary Materials
The following supporting information can be downloaded at the website of this paper posted on Preprints.org. Table S1: Correlations between serum purine metabolites and clinical parameters in the PD group; Table S2: A general linear model analysis of serum metabolites in the PD group; Table S3: Correlations between CSF purine metabolites and clinical parameters in the PD group; Table S4: A general linear model analysis of CSF metabolites in the PD group.
Author Contributions
Conceptualization, H.W.; Methodology, Y.Mi. and Y.Ma.; Software, Y.Mi. and H.W.; Formal analysis, S.S., Y.Mi., J.Y. and H.W.; Investigation, S.S., R.O., R.N., To.M., A.H., A.U. and M.I.; Writing—original draft preparation, S.S.; Writing—review and editing, Y.Mi. and H.W.; Visualization, S.S. and Y.Mi.; Supervision, Ta.M. and H.W.; Project administration, S.S. and Y.Mi.; Funding acquisition, S.S. and H.W.. All authors have read and agreed to the published version of the manuscript.
Funding
This research was funded by JSPS KAKENHI Grant Number JP22K07508.
Institutional Review Board Statement
The study was conducted in accordance with the Declaration of Helsinki, and approved by the Ethics Committee of Fujita Health University Hospital (protocol code, HM22-407, HM23-205, and HG21-015; date of approval, December 19, 2022, August 25, 2023, and July 8, 2021; respectively).
Informed Consent Statement
Informed consent was obtained from all subjects involved in the study.
Data Availability Statement
Anonymized data not published within this article will be made available by request from any qualified investigator.
Conflicts of Interest
The authors declare no conflict of interest.
References
- Schwarzschild, M.A.; Schwid, S.R.; Marek, K.; Watts, A.; Lang, A.E.; Oakes, D.; Shoulson, I.; Ascherio, A.; Parkinson Study Group PRECEPT, Investigators; Hyson, C.; et al. Serum urate as a predictor of clinical and radiographic progression in Parkinson disease. Arch. Neurol. 2008, 65, 716–723. [Google Scholar] [CrossRef] [PubMed]
- Alonso, A.; Rodríguez, L.A.G.; Logroscino, G.; Hernán, M.A. Gout and risk of Parkinson disease: a prospective study. Neurology 2007, 69, 1696–1700. [Google Scholar] [CrossRef] [PubMed]
- Chang, H.; Wang, B.; Shi, Y.; Zhu, R. Dose-response meta-analysis on urate, gout, and the risk for Parkinson’s disease. NPJ Parkinsons Dis. 2022, 8, 160. [Google Scholar] [CrossRef] [PubMed]
- Ascherio, A.; LeWitt, P.A.; Xu, K.; Eberly, S.; Watts, A.; Matson, W.R.; Marras, C.; Kieburtz, K.; Rudolph, A.; Bodganov, M.B.; et al. Urate as a predictor of the rate of clinical decline in Parkinson disease. Arch. Neurol. 2009, 66, 1460–1468. [Google Scholar] [CrossRef] [PubMed]
- Grażyńska, A.; Adamczewska, K.; Antoniuk, S.; Bień, M.; Toś, M.; Kufel, J.; Urbaś, W.; Siuda, J. The influence of serum uric acid level on non-motor symptoms occurrence and severity in patients with idiopathic Parkinson’s disease and atypical parkinsonisms-a systematic review. Medicina (Kaunas) 2021, 57, 972. [Google Scholar] [CrossRef] [PubMed]
- Kobylecki, C.J.; Nordestgaard, B.G.; Afzal, S. Plasma urate and risk of Parkinson’s disease: a Mendelian randomization study. Ann. Neurol. 2018, 84, 178–190. [Google Scholar] [CrossRef] [PubMed]
- Kia, D.A.; Noyce, A.J.; White, J.; Speed, D.; Nicolas, A.; IPDGC collaborators; Burgess, S.; Lawlor, D.A.; Davey Smith, G.; Singleton, A.; et al. Mendelian randomization study shows no causal relationship between circulating urate levels and Parkinson's disease. Ann. Neurol. 2018, 84, 191–199.
- Coneys, R.; Storm, C.S.; Kia, D.A.; Almramhi, M.; Wood, N.W. Mendelian randomisation finds no causal association between urate and Parkinson’s disease progression. Mov. Disord. 2021, 36, 2182–2187. [Google Scholar] [CrossRef] [PubMed]
- Li, X.; Jia, S.; Zhou, Z.; Jin, Y.; Zhang, X.; Hou, C.; Zheng, W.; Rong, P.; Jiao, J. Effect of serum uric acid on cognition in patients with idiopathic REM sleep behavior disorder. J. Neural Transm (Vienna). 2018, 125, 1805–1812. [Google Scholar] [CrossRef]
- Hasíková, L.; Závada, J.; Serranová, T.; Kotačková, L.; Kozlík, P.; Kalíková, K.; Trnka, J.; Zogala, D.; Šonka, K.; Růžička, E.; et al. Patients with REM sleep behavior disorder have higher serum levels of allantoin. Parkinsonism Relat. Disord. 2021, 90, 38–43. [Google Scholar] [CrossRef]
- Parkinson Study Group SURE-PD3 Investigators; Schwarzschild, M.A.; Ascherio, A.; Cascaceli, C.; Curhan, G.C; Fitzgerald, R.; Kamp, C.; Lungu, C.; Macklin, E.A.; Marek, K.; et al. Effect of urate-elevating inosine on early Parkinson disease progression: the SURE-PD3 randomized clinical trial. JAMA 2021, 326, 926–939.
- Seifar, F.; Dinasarapu, A.R.; Jinnah, H.A. Uric acid in Parkinson’s disease: what is the connection? Mov. Disord. 2022, 37, 2173–2183. [Google Scholar] [CrossRef] [PubMed]
- Garcia-Esparcia, P.; Hernández-Ortega, K.; Ansoleaga, B.; Carmona, M.; Ferrer, I. Purine metabolism gene deregulation in Parkinson’s disease. Neuropathol. Appl. Neurobiol. 2015, 41, 926–940. [Google Scholar] [CrossRef] [PubMed]
- Johansen, K.K.; Wang, L.; Aasly, J.O.; White, L.R.; Matson, W.R.; Henchcliffe, C.; Beal, M.F.; Bogdanov, M. Metabolomic profiling in LRRK2-related Parkinson’s disease. PLoS One 2009, 4, e7551. [Google Scholar] [CrossRef]
- Postuma, R.B.; Berg, D.; Stern, M.; Poewe, W.; Olanow, C.W.; Oertel, W.; Obeso, J.; Marek, K.; Litvan, I.; Lang, A.E.; et al. MDS clinical diagnostic criteria for Parkinson’s disease. Mov. Disord. 2015, 30, 1591–1601. [Google Scholar] [CrossRef]
- Ikeda, K.; Nakamura, Y.; Kiyozuka, T.; Aoyagi, J.; Hirayama, T.; Nagata, R.; Ito, H.; Iwamoto, K.; Murata, K.; Yoshii, Y.; et al. Serological profiles of urate, paraoxonase-1, ferritin, and lipid in Parkinson’s disease: changes linked to disease progression. Neurodegener. Dis. 2011, 8, 252–258. [Google Scholar] [CrossRef] [PubMed]
- Yemula, N.; Dietrich, C.; Dostal, V.; Hornberger, M. Parkinson’s disease and the gut: symptoms, nutrition, and microbiota. J. Parkinsons Dis. 2021, 11, 1491–1505. [Google Scholar] [CrossRef] [PubMed]
- Ghourchian, S.; Gruber-Baldini, A.L.; Shakya, S.; Herndon, J.; Reich, S.G.; von Coelln, R.; Savitt, J.M.; Shulman, L.M. Weight loss and weight gain in Parkinson disease. Parkinsonism Relat. Disord. 2021, 83, 31–36. [Google Scholar] [CrossRef] [PubMed]
- Zhang, X.; Molsberry, S.A.; Schwarzschild, M.A.; Ascherio, A.; Gao, X. Association of diet and physical activity with all-cause mortality among adults with Parkinson disease. JAMA Netw. Open 2022, 5, e2227738–e2227738. [Google Scholar] [CrossRef]
- Maetzler, W.; Stapf, A.K.; Schulte, C.; Hauser, A.-K.; Lerche, S.; Wurster, I.; Schleicher, E.; Melms, A.; Berg, D. Serum and cerebrospinal fluid uric acid levels in Lewy body disorders: associations with disease occurrence and amyloid-β pathway. J. Alzheimers. Dis. 2011, 27, 119–126. [Google Scholar] [CrossRef]
- Constantinescu, R.; Andreasson, U.; Holmberg, B.; Zetterberg, H. Serum and cerebrospinal fluid urate levels in synucleinopathies versus tauopathies. Acta Neurol. Scand. 2013, 127, e8–e12. [Google Scholar] [CrossRef]
- The Parkinson Study Group SURE-PD, Investigators; Schwarzschild, M.A.; Ascherio, A.; Beal, M.F.; Cudkowicz, M.E.; Curhan, G.C.; Hare, J.M.; Hooper, D.C.; Kieburtz, K.D.; Macklin, E.A.; et al. Inosine to increase serum and cerebrospinal fluid urate in Parkinson disease: a randomized clinical trial. JAMA Neurol. 2014, 71, 141–150. [Google Scholar]
- Johnson, T.A.; Jinnah, H.A.; Kamatani, N. Shortage of cellular ATP as a cause of diseases and strategies to enhance ATP. Front. Pharmacol. 2019, 10, 98. [Google Scholar] [CrossRef]
- Chiba, Y.; Murakami, R.; Matsumoto, K.; Wakamatsu, K.; Nonaka, W.; Uemura, N.; Yanase, K.; Kamada, M.; Ueno, M. Glucose, fructose, and urate transporters in the choroid plexus epithelium. Int. J. Mol. Sci. 2020, 21, 7230. [Google Scholar] [CrossRef] [PubMed]
- Srinivasan, S.; Torres, A.G.; Ribas de Pouplana, L. Inosine in biology and disease. Genes 2021, 12, 600. [Google Scholar] [CrossRef] [PubMed]
- Cornford, E.M.; Oldendorf, W.H. Independent blood-brain barrier transport systems for nucleic acid precursors. Biochim. Biophys. Acta 1975, 394, 211–219. [Google Scholar] [CrossRef]
- Yamamoto, T.; Moriwaki, Y.; Cheng, J.; Takahashi, S.; Tsutsumi, Z.; Ka, T.; Hada, Y. Effect of inosine on the plasma concentration of uridine and purine bases. Metabolism 2002, 51, 438–442. [Google Scholar] [CrossRef]
- Muto, J.; Lee, H.; Lee, H.; Uwaya, A.; Park, J.; Nakajima, S.; Nagata, K.; Ohno, M.; Ohsawa, I.; Mikami, T. Oral administration of inosine produces antidepressant-like effects in mice. Sci. Rep. 2014, 4, 4199. [Google Scholar] [CrossRef] [PubMed]
- Borsche, M.; Pereira, S.L.; Klein, C.; Grünewald, A. Mitochondria and Parkinson’s disease: clinical, molecular, and translational aspects. J. Parkinsons Dis. 2021, 11, 45–60. [Google Scholar] [CrossRef]
- Foltynie, T. Glycolysis as a therapeutic target for Parkinson’s disease. Lancet Neurol. 2019, 18, 1072–1074. [Google Scholar] [CrossRef]
- Wang, Q.; Luo, Y.; Ray Chaudhuri, K.; Reynolds, R.; Tan, E.-K.; Pettersson, S. The role of gut dysbiosis in Parkinson’s disease: mechanistic insights and therapeutic options. Brain 2021, 144, 2571–2593. [Google Scholar] [CrossRef] [PubMed]
- Murray, A.W. The biological significance of purine salvage. Annu. Rev. Biochem. 1971, 40, 811–826. [Google Scholar] [CrossRef] [PubMed]
- Stepanova, V.; Moczulska, K.E.; Vacano, G.N.; Kurochkin, I.; Ju, X.; Riesenberg, S.; Macak, D.; Maricic, T.; Dombrowski, L.; Schörnig, M.; et al. Reduced purine biosynthesis in humans after their divergence from Neandertals. Elife 2021, 10, e58741. [Google Scholar] [CrossRef] [PubMed]
- Yakhine-Diop, S.M.S.; Morales-García, J.A.; Niso-Santano, M.; González-Polo, R.A.; Uribe-Carretero, E.; Martinez-Chacon, G.; Durand, S.; Maiuri, M.C.; Aiastui, A.; Zulaica, M.; et al. Metabolic alterations in plasma from patients with familial and idiopathic Parkinson’s disease. Aging 2020, 12, 16690–16708. [Google Scholar] [CrossRef]
- Saugstad, O.D. Hypoxanthine as an indicator of hypoxia: its role in health and disease through free radical production. Pediatr. Res. 1988, 23, 143–150. [Google Scholar] [CrossRef] [PubMed]
- Nakamura, T.; Murase, T.; Satoh, E.; Hibi, C.; Nakayama, Y.; Katoh, N.; Yokoyama, H.; Tomita, H. Establishment of the process in blood sampling and sample handling as a biomarker of hypoxia-inducible diseases; plasma hypoxanthine and xanthine measurement. J. Mol. Biomark. Diagn. 2018, 9. [Google Scholar] [CrossRef]
- Furuhashi, M. New insights into purine metabolism in metabolic diseases: role of xanthine oxidoreductase activity. Am. J. Physiol. Endocrinol. Metab. 2020, 319, E827–E834. [Google Scholar] [CrossRef] [PubMed]
- van Nimwegen, M.; Speelman, A.D.; Hofman-van Rossum, E.J.M.; Overeem, S.; Deeg, D.J.H.; Borm, G.F.; van der Horst, M.H.L.; Bloem, B.R.; Munneke, M. Physical inactivity in Parkinson’s disease. J. Neurol. 2011, 258, 2214–2221. [Google Scholar] [CrossRef] [PubMed]
- Galper, J.; Dean, N.J.; Pickford, R.; Lewis, S.J.G.; Halliday, G.M.; Kim, W.S.; Dzamko, N. Lipid pathway dysfunction is prevalent in patients with Parkinson’s disease. Brain 2022, 145, 3472–3487. [Google Scholar] [CrossRef]
- Watanabe, H.; Hattori, T.; Kume, A.; Misu, K.; Ito, T.; Koike, Y.; Johnson, T.A.; Kamitsuji, S.; Kamatani, N.; Sobue, G. Improved Parkinsons disease motor score in a single-arm open-label trial of febuxostat and inosine. Medicine (Baltimore) 2020, 99, e21576. [Google Scholar] [CrossRef]
Figure 1.
Purine metabolite pathway. Uric acid (UA) is produced through the following process: inosine monophosphate (IMP) → inosine → hypoxanthine → xanthine → UA. We evaluated metabolites colored with yellow in this study. GTP, guanosine triphosphate; GDP, guanosine diphosphate; GMP, guanosine monophosphate; XMP, 5'-xanthylic acid; IMP, inosine monophosphate; S-AMP, succinyl adenosine monophosphate; AMP, adenosine monophosphate; ADP, adenosine diphosphate; ATP, adenosine triphosphate; PPRP, phosphoribosyl pyrophosphate; PNP, purine nucleoside phosphorylase; HGPRT, hypoxanthine-guanine phosphoribosyltransferase; XOR, xanthine oxidoreductase; GDA, guanine deaminase; ADA, adenine deaminase.
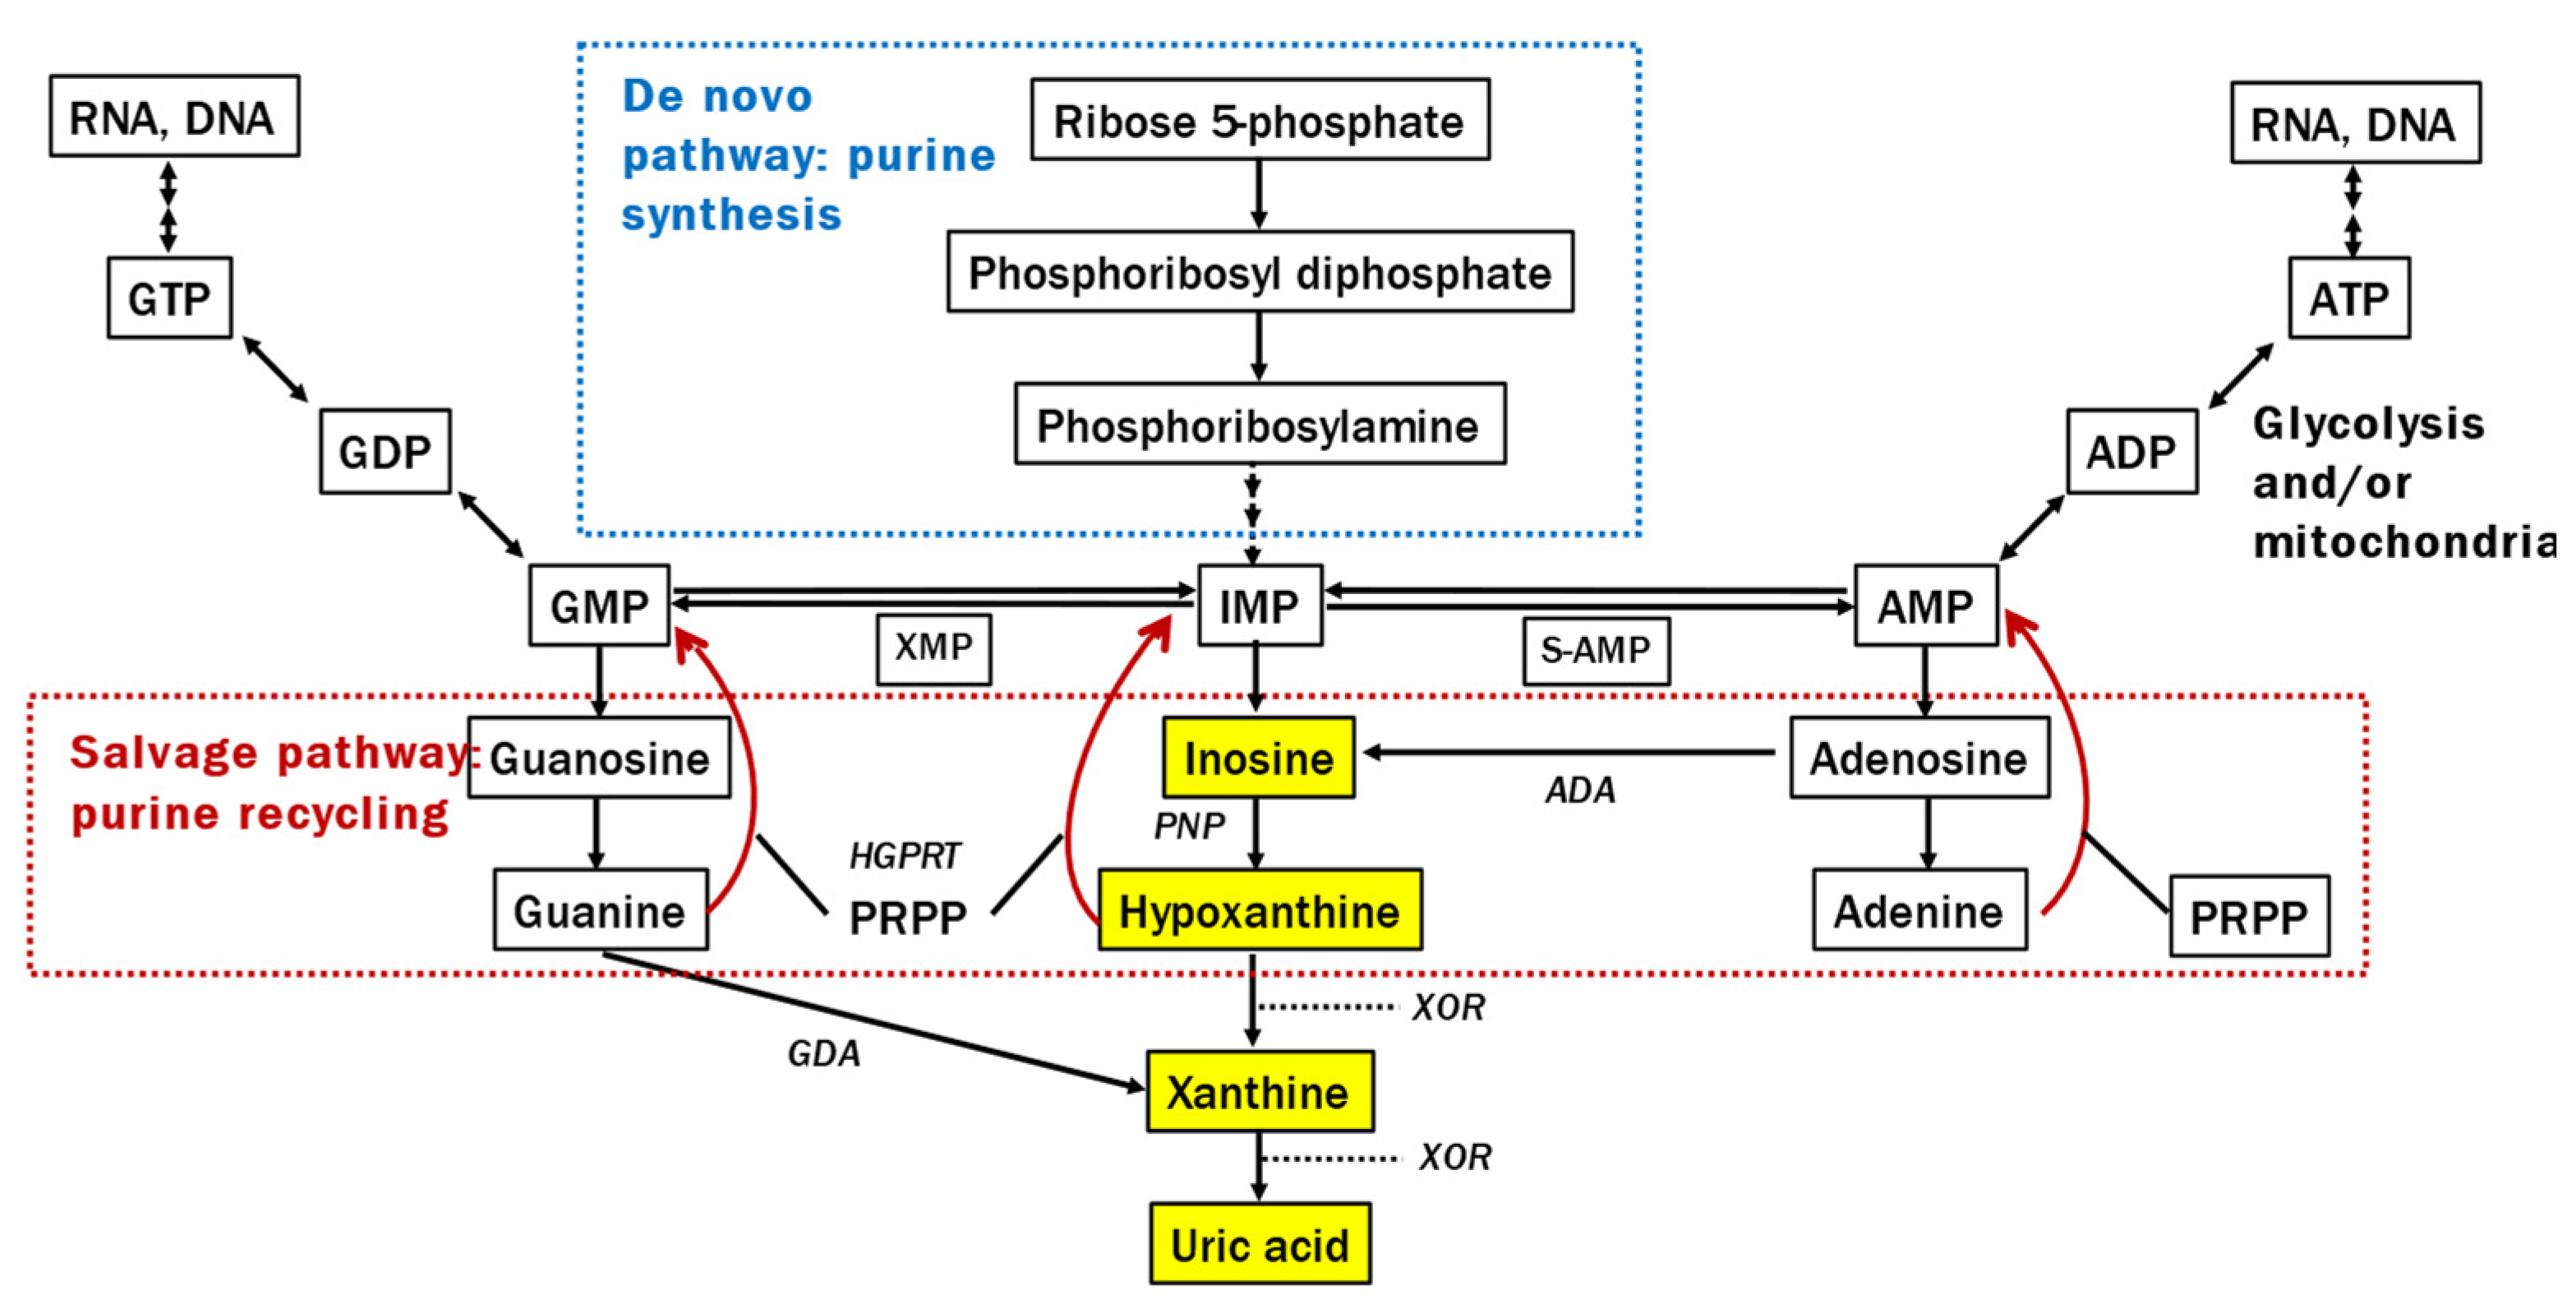
Figure 2.
Comparison of serum purine metabolites between patients with Parkinson’s disease (PD) and healthy controls. Patients with Parkinson’s disease had significantly lower serum hypoxanthine and uric acid levels compared with healthy controls. AUC, area under the curve.
Figure 2.
Comparison of serum purine metabolites between patients with Parkinson’s disease (PD) and healthy controls. Patients with Parkinson’s disease had significantly lower serum hypoxanthine and uric acid levels compared with healthy controls. AUC, area under the curve.
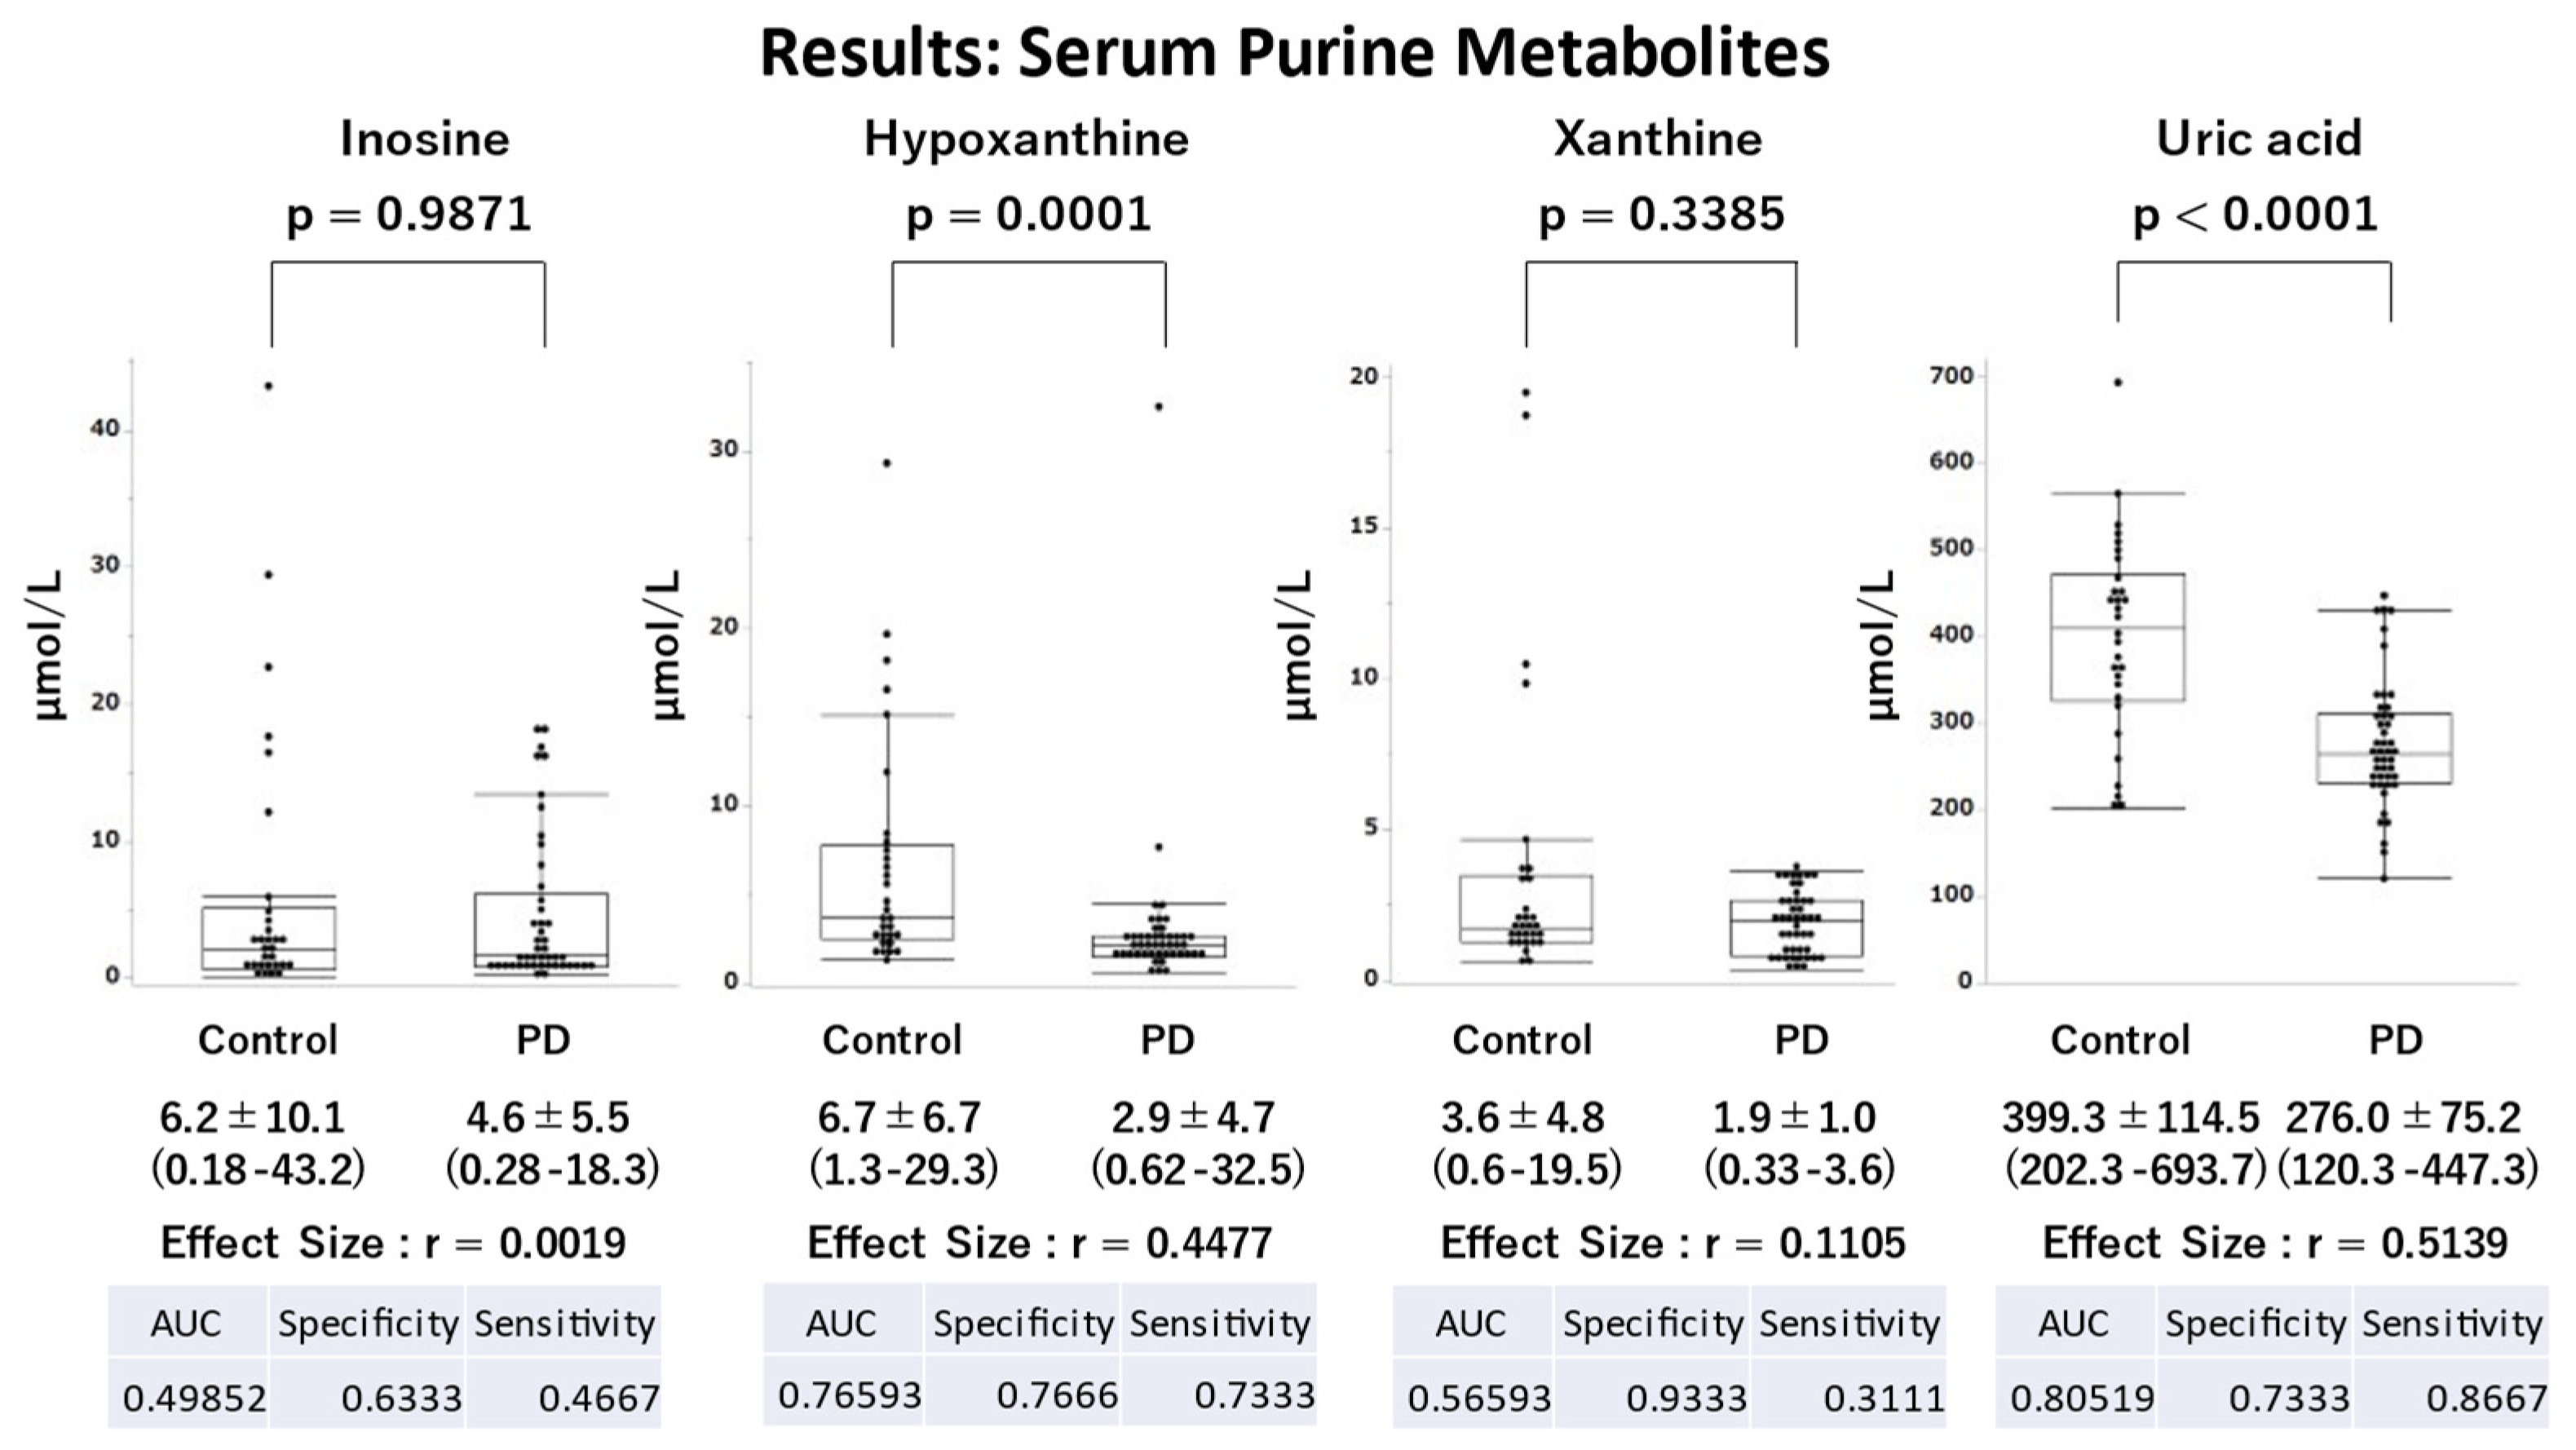
Figure 3.
Path diagram estimated by the linear regression analysis. The arrows are shown only for when the regression coefficients (indicated by the numeric values) are statistically significant (significance level = 0.05; *p<0.05; **p<0.01; ***p<0.001). The panels are inserted to show the analyzed data and the regression lines. CSF, cerebrospinal fluid; NC, normal control; PD, Parkinson’s disease.
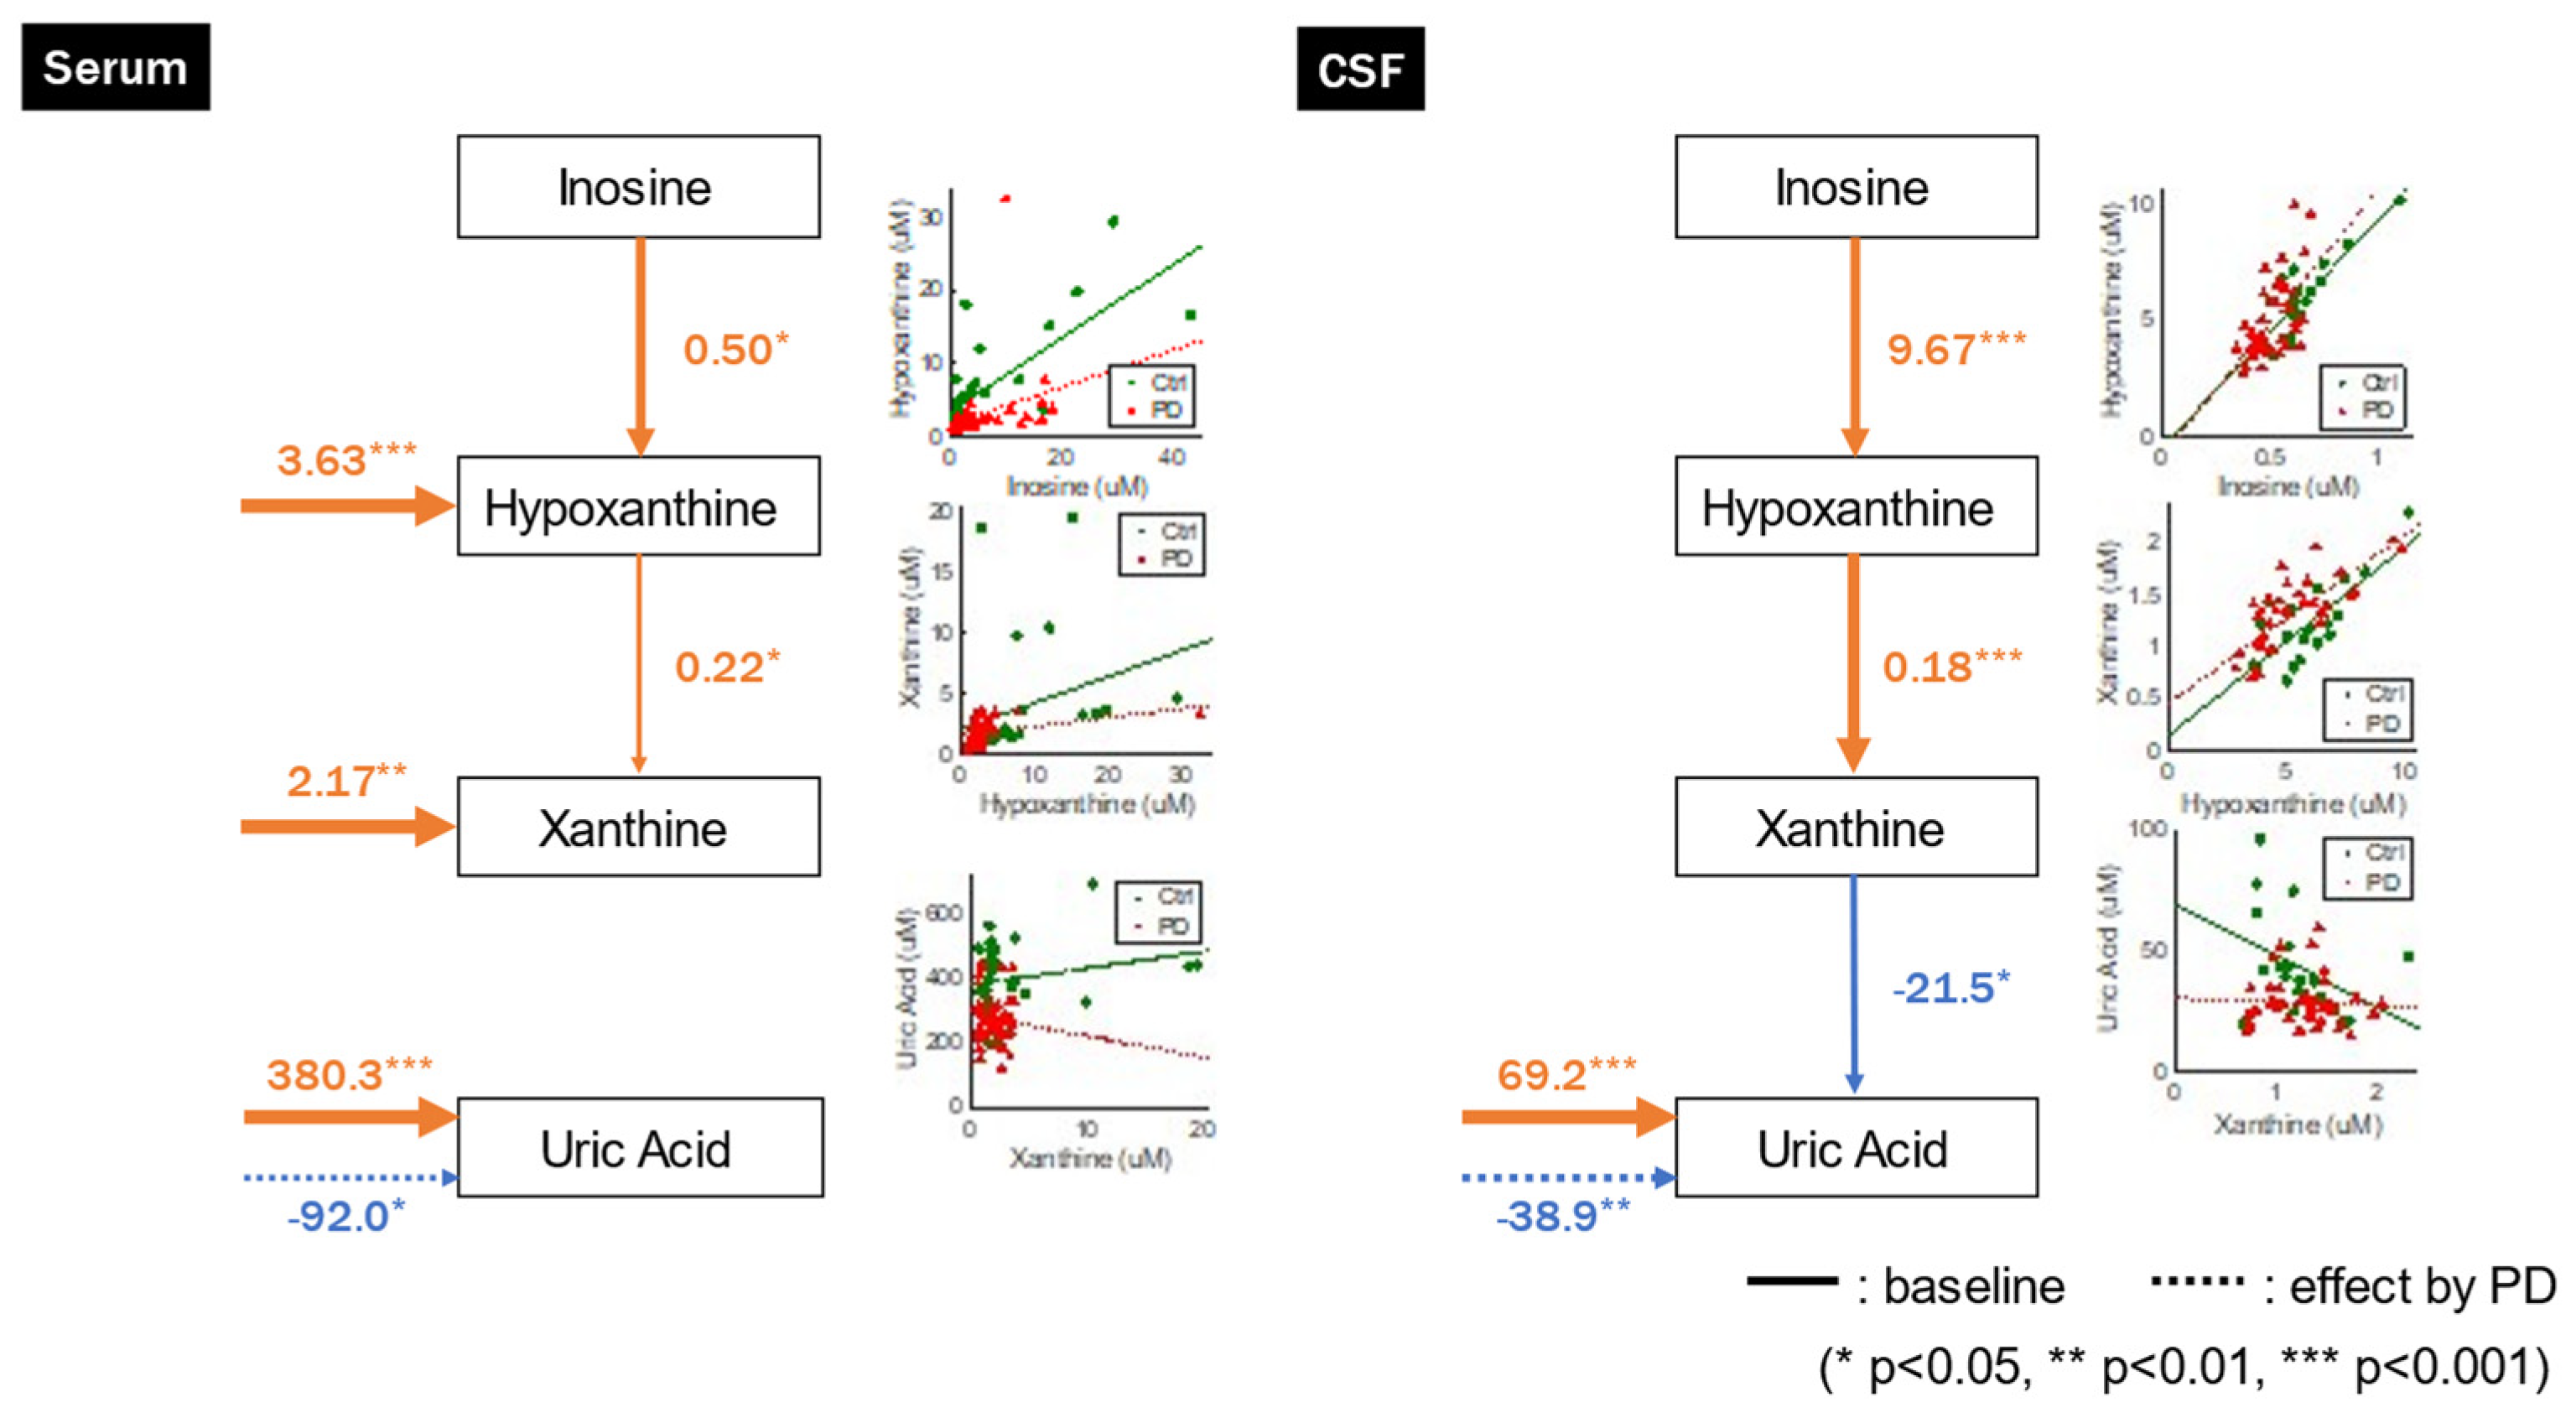
Figure 4.
Comparison of cerebrospinal fluid (CSF) purine metabolites between patients with Parkinson’s disease (PD) and healthy controls. Patients with Parkinson’s disease had significantly lower inosine, hypoxanthine, and uric acid levels compared with healthy controls in the CSF. AUC, area under the curve.
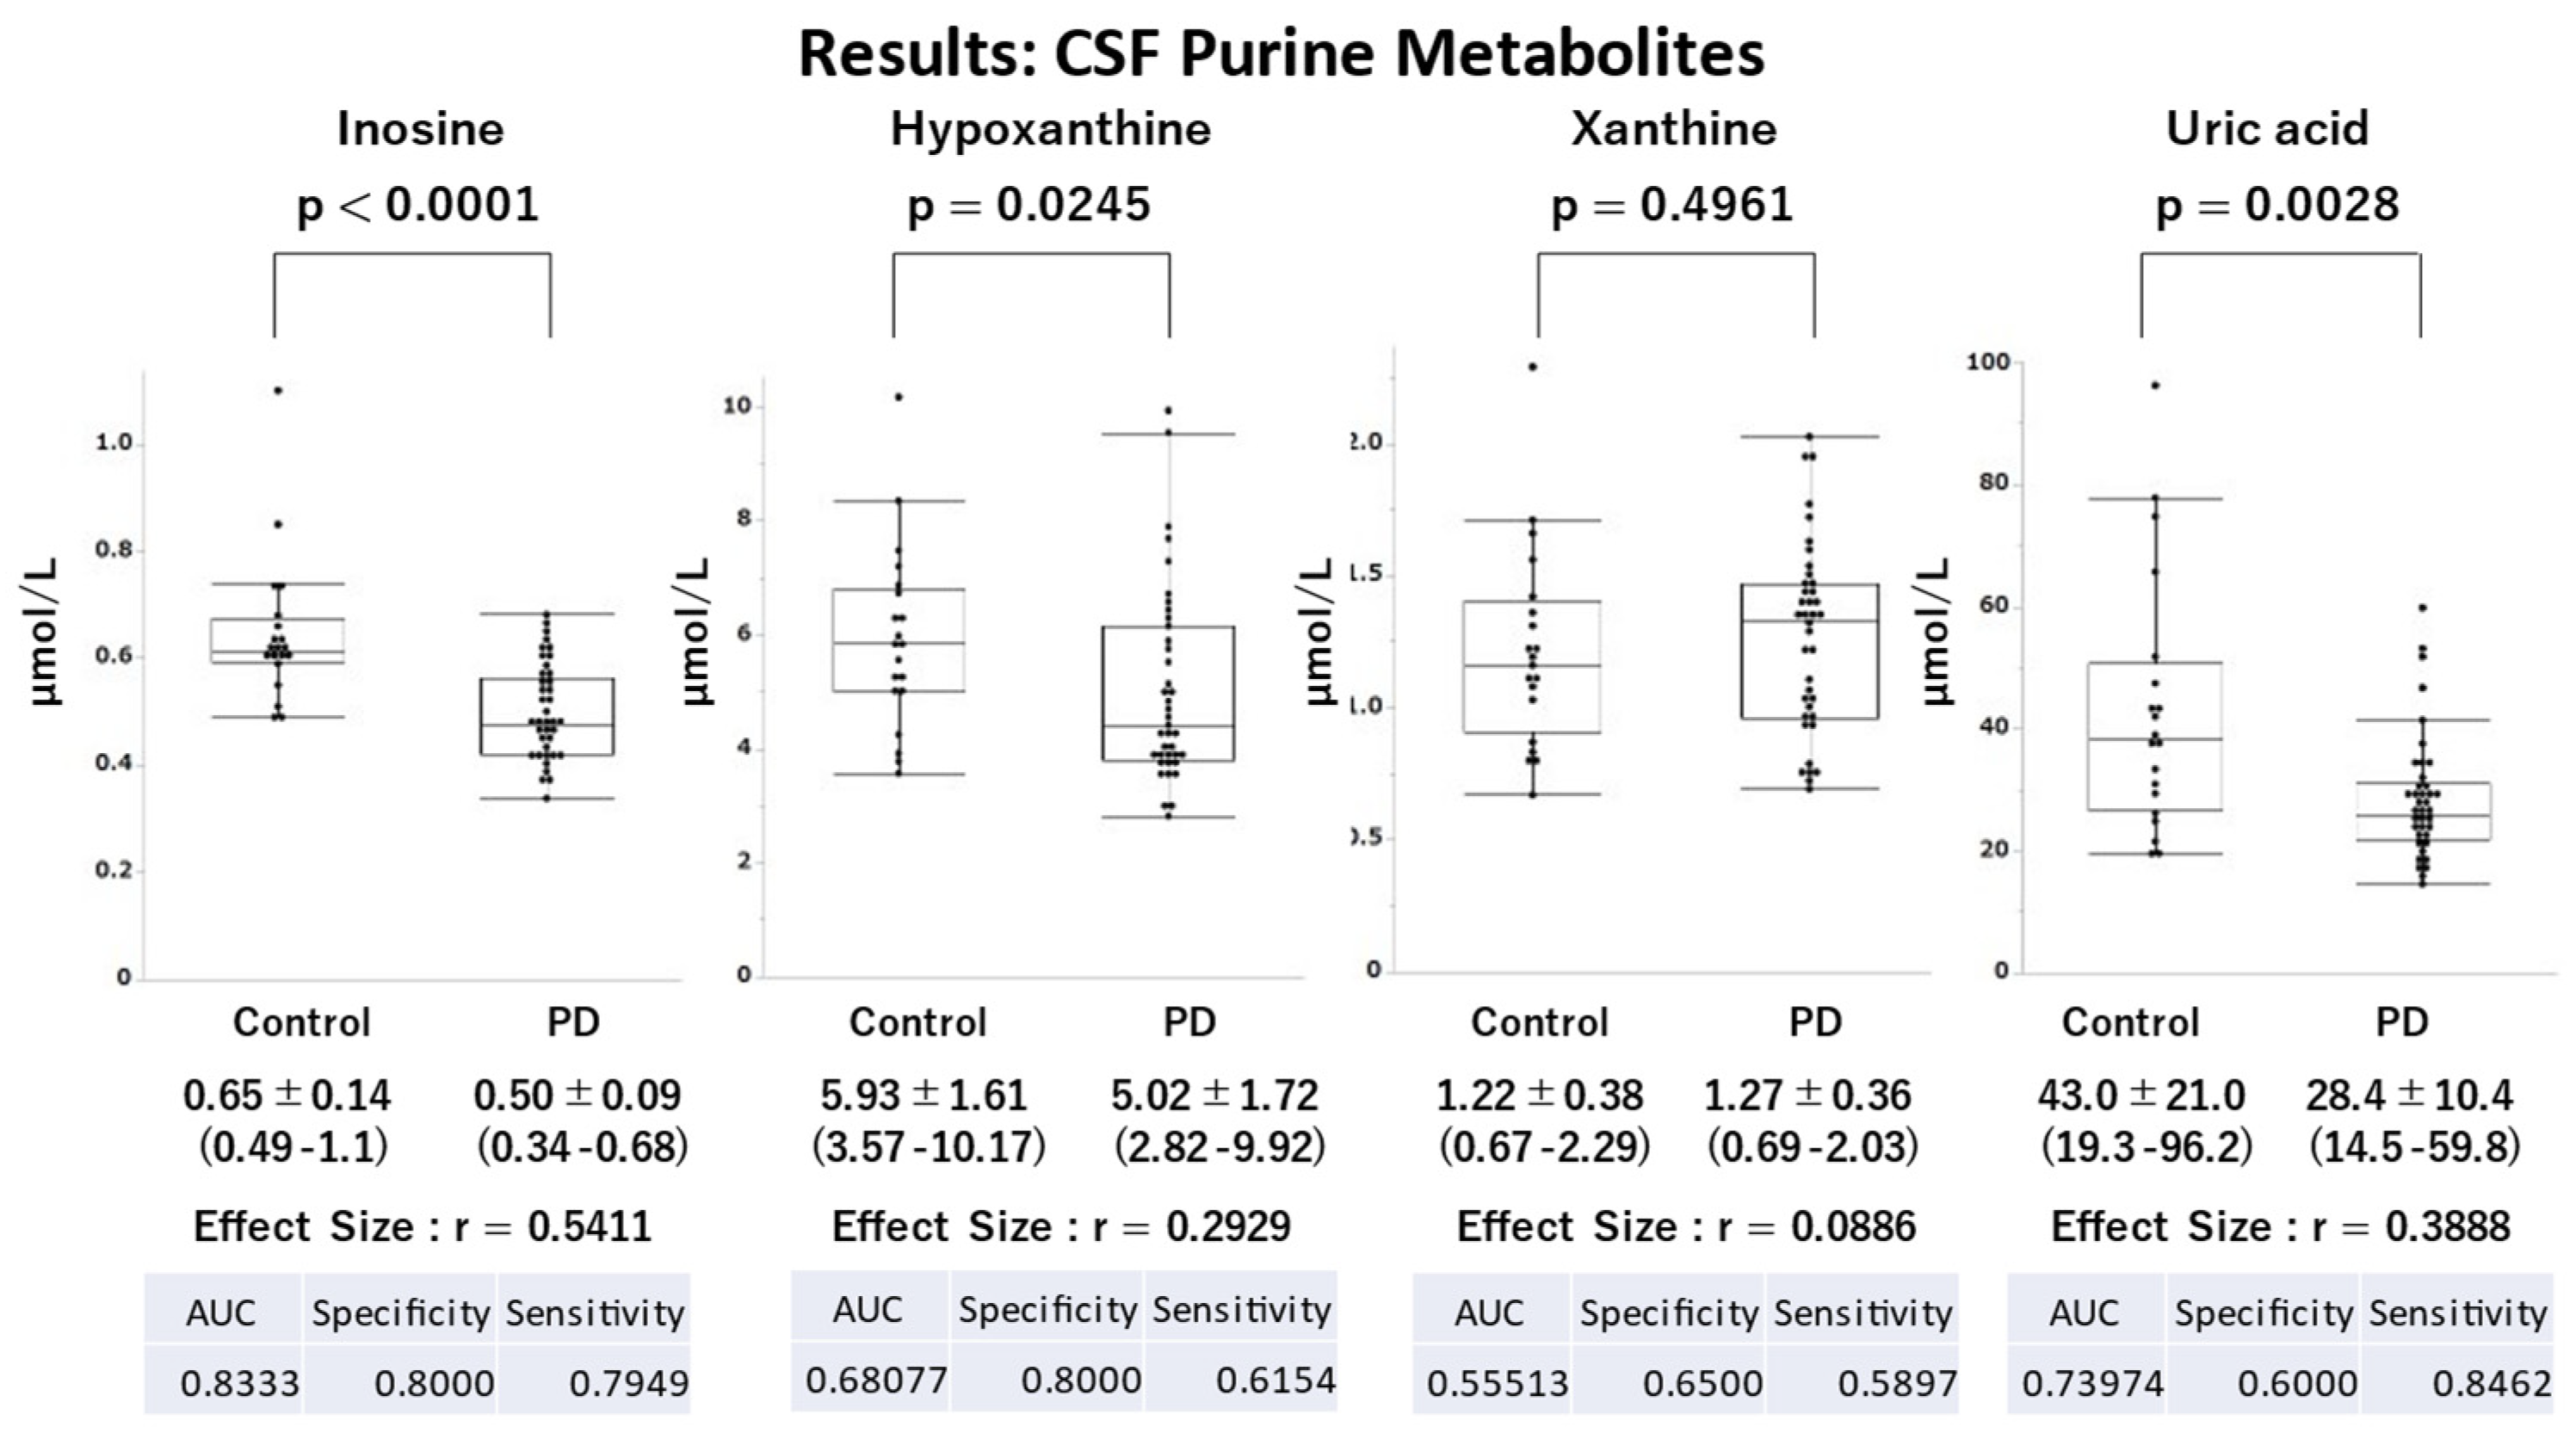

Table 1.
Demographic and clinical features.
| Serum | CSF | |||||||||
| Control (N = 30) | PD (N = 45) | P value | Control (N = 20) | PD (N = 39) | P value | |||||
| Mean | Range | Mean | Range | Mean | Range | Mean | Range | |||
| Age (years) | 68.9 (9.1) | 49–95 | 68.4 (7.3) | 52–78 | 0.9741 | 68.2 (8.9) | 48–79 | 67.9 (6.9) | 52–77 | 0.6190 |
| Sex, % female | (F14, M16; 46.7%) | (F15, M30; 33.3%) | 0.3336 | F6, M14: 30.0% | F12, M27: 30.8% | 1.0000 | ||||
| Height, cm | 161.5 (7.8) | 148–176 | 162.4 | 143–182 | 0.6377 | 161.6 (9.0) | 148–177.2 | 162.6 (8.3) | 143–182 | 0.6251 |
| Weight, kg | 60.6 (10.4) | 37–80 | 58.5 (12.8) | 33.7–90.6 | 0.3467 | 63.8 (11.9) | 43.4–88.1 | 59.8 (12.3) | 36–90.6 | 0.2001 |
| BMI, kg/m2 | 23.2 (3.5) | 16.4–31.2 | 22.1 (4.5) | 15.4–17.1 | 0.0668 | 24.2 (2.7) | 18.3–28.73 | 22.6 (4.4) | 16–37.5 | 0.0225 |
| Age at PD onset, years | 60.9 | 38–74 | 60.9 | 41–74 | ||||||
| Duration of PD, years | 7.4 | 0.75–19.75 | 5.1 | 3.4–6.2 | ||||||
| LEDD, mg/day | 634.1 | 0–1425 | 621.0 | 0–1425 | ||||||
| MDS-UPDRS Part I | 10.1 | 0–25 | 10.3 | 0–25 | ||||||
| MDS-UPDRS Part II | 12.6 | 0–30 | 13.1 | 0–30 | ||||||
| MDS-UPDRS Part III | 36.2 | 12–78 | 35.7 | 12–78 | ||||||
| MDS-UPDRS Part IV | 5.2 | 0–13 | 4.8 | 0–13 | ||||||
| Hoehn and Yahr stage | 3.0 | 1–5 | 3.0 | 1–5 | ||||||
| MoCA total score | 24.9 (3.1) | 17–30 | 21.9 (4.3) | 11–29 | 0.0020 | 22.2 | 11–29 | |||
| ACE-R total score | 93.6 (4.9) | 76–100 | 84.7 (12.9) | 53–99 | 0.0014 | 86.4 | 53–99 | |||
| MMSE total score | 28.4 (1.7) | 23–30 | 26.8 (3.3) | 17–30 | 0.0533 | 27.1 | 17–30 | |||
| FAB total score | 13.0 | 8–18 | 13.1 | 9–18 | ||||||
| PDQ-39 | 51.4 | 4–105 | 53.0 | 4–105 | ||||||
| GDS-15 | 2.9 (2.3) | 0–9 | 6.3 (3.6) | 0–15 | < 0.0001 | 6.5 | 0–15 | |||
| OSIT-J | 3.6 | 0–11 | 3.9 | 0–11 | ||||||
| RBDSQ-J | 5.5 | 1–11 | 5.2 | 1–11 | ||||||
| SCOPA-Aut | 14.5 | 3–47 | 14.8 | 3–47 | ||||||
| ESS | 9.1 | 0–24 | 8.3 | 0–24 | ||||||
| J-QUIP | 0.53 | 0–3 | 0.49 | 0–3 | ||||||
ACE-R, Addenbrooke’s Cognitive Examination-Revised; BMI, body mass index; ESS, Epworth Sleepiness Scale; FAB, PDQ-39, Parkinson’s Disease Questionnaire-39; GDS-15, Geriatric Depression Scale-15; J-QUIP, Japanese version of the Questionnaire for Impulsive-Compulsive Disorders in Parkinson’s disease; LEDD, levodopa-equivalent daily dose; MDS-UPDRS, Movement Disorder Society Unified Parkinson’s Disease Rating Scale; MMSE, Mini-Mental State Examination; MoCA, Montreal Cognitive Assessment; OSIT-J, Odor Stick Identification Test for Japanese; PD, Parkinson’s disease; RBDSQ-J, Japanese version of Rapid Eye Movement Sleep Behavior Disorder Screening Questionnaire; SCOPA-Aut, Scales for Outcomes in Parkinson’s Disease - Autonomic Dysfunction. Bold values indicate statistical significance.
Table 2.
General linear model analysis of serum metabolites in Parkinson’s disease.
| Unstandardized Coefficient |
Standardized Coefficient |
|||||||
|---|---|---|---|---|---|---|---|---|
| Objective Variable | Explanatory variable | B | SE | Beta | t | P | Adjusted R2 | Model p value |
| Hypoxanthine | Constant | 3.63 | 0.98 | 3.72 | 0.0004 | |||
| Inosine | 0.50 | 0.08 | 0.65 | 5.95 | <0.0001 | |||
| Group (1=PD; 0=Ctrl) | -1.83 | 1.31 | -0.15 | -1.40 | 0.1670 | |||
| Inosine x Group | -0.24 | 0.15 | -0.20 | -1.64 | 0.1050 | |||
| 0.40 | <0.0001 | |||||||
| Xanthine | Constant | 2.17 | 0.79 | 2.76 | 0.0073 | |||
| Hypoxanthine | 0.22 | 0.08 | 0.39 | 2.59 | 0.0117 | |||
| Group (1=PD; 0=Ctrl) | -0.51 | 0.95 | -0.08 | -0.54 | 0.5921 | |||
| Hypoxanthine x Group | -0.14 | 0.13 | -0.17 | -1.11 | 0.2719 | |||
| 0.12 | 0.0066 | |||||||
| Uric Acid | Constant | 380.25 | 21.31 | 17.84 | <0.0001 | |||
| Xanthine | 5.27 | 3.59 | 0.15 | 1.47 | 0.1463 | |||
| Group (1=PD; 0=Ctrl) | -91.96 | 35.88 | -0.41 | -2.56 | 0.0125 | |||
| Xanthine x Group | -11.84 | 13.99 | -0.13 | -0.85 | 0.4002 | |||
| 0.30 | <0.0001 | |||||||
SE, standard error; PD, Parkinson’s disease. Bold values indicate statistical significance.
Table 3.
General linear model analysis of cerebrospinal fluid metabolites in Parkinson’s disease.
| Unstandardized Coefficient |
Standardized Coefficient |
|||||||
|---|---|---|---|---|---|---|---|---|
| Objective Variable | Explanatory variable | B | SE | Beta | t | P | Adjusted R2 | Model p value |
| Hypoxanthine | Constant | -0.31 | 1.40 | -0.22 | 0.8264 | |||
| Inosine | 9.67 | 2.13 | 0.71 | 4.54 | 0.0008 | |||
| Group (1=PD; 0=Ctrl) | -0.38 | 1.83 | -0.11 | -0.21 | 0.8347 | |||
| Inosine x Group | 1.73 | 3.14 | 0.25 | 0.55 | 0.5830 | |||
| 0.46 | <0.0001 | |||||||
| Xanthine | Constant | 0.15 | 0.21 | 0.70 | 0.4880 | |||
| Hypoxanthine | 0.18 | 0.03 | 0.85 | 5.24 | <0.0001 | |||
| Group (1=PD; 0=Ctrl) | 0.32 | 0.24 | 0.41 | 1.30 | 0.2005 | |||
| Hypoxanthine x Group | -0.02 | 0.04 | -0.15 | -0.49 | 0.6290 | |||
| 0.56 | <0.0001 | |||||||
| Uric Acid | Constant | 69.22 | 10.89 | 6.36 | <0.0001 | |||
| Xanthine | -21.48 | 8.54 | -0.48 | -2.51 | 0.0149 | |||
| Group (1=PD; 0=Ctrl) | -38.91 | 13.77 | <-1.00 | -2.82 | 0.0066 | |||
| Xanthine x Group | 20.00 | 10.68 | 0.83 | 1.87 | 0.0664 | |||
| 0.23 | 0.0006 | |||||||
SE, standard error; PD, Parkinson’s disease. Bold values indicate statistical significance.
Disclaimer/Publisher’s Note: The statements, opinions and data contained in all publications are solely those of the individual author(s) and contributor(s) and not of MDPI and/or the editor(s). MDPI and/or the editor(s) disclaim responsibility for any injury to people or property resulting from any ideas, methods, instructions or products referred to in the content. |
© 2023 by the authors. Licensee MDPI, Basel, Switzerland. This article is an open access article distributed under the terms and conditions of the Creative Commons Attribution (CC BY) license (http://creativecommons.org/licenses/by/4.0/).
Copyright: This open access article is published under a Creative Commons CC BY 4.0 license, which permit the free download, distribution, and reuse, provided that the author and preprint are cited in any reuse.


