
Submitted:
02 October 2023
Posted:
05 October 2023
You are already at the latest version
Abstract
FeZnNa@SiO2-C catalyst with graphitized carbon (GC) modified mesoporous SiO2 support metal nanoparticles was prepared by sol-gel method. The effect of adding metal Na and Zn promoters as a dispersion on the CO2 hydrogenation to low olefins was systematically studied. The results showed that Zn-Na, as a combination, promoted the absorption of CO2 and improved the conversion rate of CO2. Na as an alkaline substance can improve the absorption of more acidic CO2, improving the conversion rate of CO2 to 59.03%. Meanwhiles, addition of secondary metal Zn into Fe-based catalysts to form a surface alloy could alter the adsorption of CO2 and the activation of C-O bonds, inhibit the subsequent hydrogenation of olefins to paraffins, facilitate the reduction of Fe2O3 and the formation of active Fe5C2 species. From TEM and XRD, the formation of active Fe5C2 species was found, the selectivity of the target product was 41.07%. The deep hydrogenation of olefins is inhibited, by inhibiting their deep hydrogenations, the STY of C2=-C4= was raised again, up to 0.0436. However, the corresponding STY does not increase infinitely with the increase of Na content, and when the Na content to 6.4%, which can be shown higher CO2 hydrogenation catalytic performance. Compared with Fe@SiO2-C catalyst, Na and Zn promoted Fe-based catalysts prepared by modified sol-gel method, can be used directly for highly efficient CO2 hydrogenation to low olefins and thus will be more promising in the future.
Keywords:
FeZnNa@SiO2-C
; promoters effects
; low olefins
; CO2 hydrogenation
1. Introduction
Massive CO2 emissions owing to the excessive use of fossil fuels lead to global warming and ocean acidification. Catalytic conversion of CO2 is a promising means to alleviate the effect of greenhouse [1,2] and intensive efforts have been contributed to hydrogenation of CO2 to value-added products (e.g. alcohols, aromatics, gasoline and olefins) recently [3,4,5,6,7,8,9]. Among of these, CO2 hydrogenation to olefin mainly occurs via a methanol-mediated mechanism or a CO2 modified Fischer-Tropsch route. The latter usually includes two consecutive steps: RWGS (CO2 + H2 → CO + H2O, ΔH298 = 41 kJ/mol) and CO hydrogenation to olefins (FTO, CO + 2H2 → -(CH2)- + H2O, ΔH298 = -166 kJ/mol) [10]. Compared to other catalysts [11,12,13], Fe-based catalysts showed low CO selectivity and high CO2 conversion of C2+ olefins [14,15,16,17,18,19,20,21,22]. It has been widely accepted that Fe3O4 and Fe5C2 [15] are the main active phases responsible for these two steps, respectively, and are generally formed in situ on metallic Fe particles at the initial reactionst age. As a consequence, the precise mediation of these active phases and their intrinsic reactivity and selectivity becomes crucial to improve the performance of Fe catalysts in CO2 hydrogenation, especially the selectivities to CO and CH4 and the olefin/paraffin ratio among the C2+ productsat high CO2 conversions.
Inspired by the advanced studies of FTS, the introduction of alkaline species [10,21,23,24] (e.g. Na [15,21,23,25] and K [24,26,27]) and transition metals [28,29,30] has been attempted to modify the Fe catalysts for CO2 hydrogenation. Na (in the form of Na2O) promotes the adsorption of CO2 by bringing strong basic sites, and also stabilizes the Fe5C2 active phase and inhibits the hydrogenation of olefins by increasing the electron density of the active sites, leading to higher CO2 conversion rates and improved olefin selectivities [10,28,31,32]. Yao Xu [21] confirmed that O/P was significantly increased by the addition of the adjuvant Na, rising from 0.7 to 4.8. Zhiqiang Zhang [10] found that the addition of Na to the iron-based catalyst increased the CO2 conversion rate from 18% to 31%, the CH4 selectivity significantly decreased from 48% to 13%, and the O/P reached 9.9 on the Na-Fe catalyst. Addition of secondary metal Cu, Co or metal oxide (ZnO) into Fe based catalysts to form a surface alloy or decorate the Fe cluster surfaces, could alter the adsorption of CO2 and the activation of C–O bonds, inhibit the subsequent hydrogenation of olefins to paraffins, facilitate the reduction of Fe2O3 and the formation of active Fe5C2 species. However, the effects of secondary metal and Na promoters on catalyst structures and performances of CO2 hydrogenation remain ambiguous. For instance, the Zn promoter is usually considered as structure promoter, but it was proposed as an electronic promoter or the active phase in the form of ZnO for RWGS. Furthermore, the studies on the synergistic effects of Zn and Na promoters were seldom in previous literatures.
Combined with our previous work [33,34], GC [35,36,37] modified mesoporous silica encapsulated metal nanoparticles can effectively improve reducibility and electron conductivity properties similar to those of expensive noble metals (Pt and Ru). In this study, FeZnNa@SiO2-C catalysts are prepared via sol-gel method with carefully controlled contents of Zn and Na. We show here that the co-decoration of Zn and Na significantly improves the activity and selectivity of Fe catalysts in CO2 hydrogenation, leading to unprecedentedly high space-time yields of olefins. The roles of these two additives are rigorously analyzed by decoupling the rates of the RWGS and FTS steps and taking the degree of approach to reaction equilibrium into account. Quasi in situ structural characterization measurements, including X-ray absorption fine structure spectroscopy and X-ray photoelectron spectroscopy, are further combined to establish a clear structure-property relationship for CO2 hydrogenation on Fe-based catalysts. In doing so, synergetic promoting effects by Zn and Na are elucidated, which account for the concurrently enhanced CO2 net conversion rates and olefin selectivities. These results would contribute to the rational regulation of catalytic performance by multiple additives, especially for complex reaction systems that are generally encountered in heterogeneous catalysis.
2. Experimental
2.1. Catalyst preparation
Practical information on various types of drugs: Fe(NO3)3·9H2O, Zn(NO3)2·6H2O, NaNO3, polyether P123, TEOS and Absolute ethanol.
FeZnNa1.5@SiO2-C: The preparation method is to dissolve Fe(NO3)3·9H2O, Zn(NO3)2·6H2O, NaNO3 and P123 in a mixed solvent formed by ethanol and deionized water and vigorously stir for two hours to form a homogeneous solution, the mass of P123, Fe(NO3)3·9H2O, Zn(NO3)2·6H2O and NaNO3 were 2.5 g, 6.87 g, 4.36 g, 0.21 g, respectively. The volume ratio of ethanol deionized water in 40 mL mixed solvent is 1:1, add 4.46 mL tetraethyl orthosilicate dropwise to the solution in the previous step for hydrolysis, stir for 1 h to form a homogeneous solution. After the end of the reaction, the solution is put into a reaction dish and placed in a fume hood for ventilation for 12-24h, with the purpose of removing the surface ethanol and deionized water. Put the sample with the surface solvent removed into the oven for heating and heat preservation operation, heat to 80 °C, and hold for 12h. The sample was taken out, put into a tubular furnace for calcination operation, calcined in an air state, held at 600°C, held for 4h, and the rate was 2 °C/min to obtain the final catalyst material.
Two groups of catalysts were prepared according to the different Zn content, namely Fe@SiO2-C and FeZn@SiO2-C, Fe accounted for 25% of the entire catalyst mass, and the Zn content changed from 0 to 25 compared with the former. Four groups of catalysts were prepared with Na content as variables,with contents of 1.5%, 3.1%, 6.4% and 7.6%, respectively. Fe and Zn each account for 25% of the mass of the entire catalyst, named FeZnNa1.5@SiO2-C, FeZnNa3.1@SiO2-C, FeZnNa6.4@SiO2-C and FeZnNa7.6@SiO2-C. Among them, FeNa catalyst is additionally produced, named FeNa@SiO2-C, Fe accounts for 25% of the mass of the entire catalyst, and Na accounts for 6.4% of the mass of the entire catalyst.
2.2. Catalytic reaction
We use it as a catalyst in carbon dioxide hydrogenation reactions to evaluate its catalytic performance. First, put the catalyst into the mesh screen with the help of grinding rod to obtain an experimental catalyst of about 0.5g (40-50 mesh). Secondly, the reaction tube in the high-pressure catalytic evaluation system is disassembled, and the quartz sand, catalyst, and quartz sand (20-30 mesh) are poured into the Reaction tubes from bottom to top, and the catalyst is put in after the quartz sand reaches half of the reaction tube height. The upper and lower ends are blocked with quartz wool. The screws in each part are tightened and reconnected to the high-pressure catalytic evaluation system. Before the formal reaction, the reduction operation is carried out, the hydrogen cylinder is connected, and the reaction is determined to be 18 hours under the premise that the whole system is not leaking, and the reaction conditions are 400 °C, 0.35 MPa,and the airspeed is 2500 mL/(g*h). Subsequently, CO2/H2/N2 mixture cylinders (mixing ratio of 23/69/8) and argon cylinders are connected,nitrogen is used as standard gas, and argon is used as support gas.The catalytic reaction conditions were temperature 340°C, pressure 2.5 MPa, and airspeed 1500 mL/(g*h). Among them, the airspeed of FeNa@SiO2-C and FeZnNa@SiO2-C is about 2150 mL/(g*h) and 1350 ml/(g*h), respectively.
3. Results and discussion
3.1. Characterization of the Fe-based catalysts
3.1.1. Textural property, structure and morphology
The phase of the catalyst was identified by XRD test, and the approximate size of the average particle size was calculated by the D=K*γ/(B*COSθ) formula. The specific results are shown in Figure 1 and Table 1 The size of Fe2O3 evaluated by the Scherrer equation over FeZn@SiO2-C catalyst was 15.65nm, respectively, which was much smaller than the Fe2O3 sizes of ~20 nm in any FeZnNax@SiO2-C (x=1.5, 3.1, 6.4, 7.6) catalysts. The results indicate that the Na promoter significantly increases the size of Fe species over FeZn/Fe catalysts. Xiong [38] reported that the introduction of alkali metals promoted the agglomeration of iron particles, thus increasing the size of iron oxide particles. The presence of alkali metals appears to promote the agglomeration of the iron precursor and as a result enlarge the crystallite size of the iron oxide. Table 1 shows that the addition of Na changes the particle size of the phase in the Fe-based catalyst. With the increase of Na content, the particle size of Fe2O3 generally showed a trend of first rising, then decreasing and finally rising. The particle size of ZnO changed in the same law. Subscript a is measured by XRD and subscript b is measured by N2 physical adsorption and desorption test. Through Figure 1, we found that the main components of the catalyst are Fe2O3 and ZnO. The content of Na was low, so it was not shown on XRD, and the FeZnNa catalyst studied by Zhang Zhiqiang did not show a peak of Na in XRD test. There is also another possibility, the absence of XRD patterns relevant to Na 2O/Na phases indicates that high dispersion of Na2O/Na was existing in these catalysts [21]. Figure 1 shows four FeZnNa@SiO2-C catalysts, FeZn catalyst, FeNa catalyst and Fe catalyst, respectively. Among them, the peak of ZnO at 36.25°/34.42° was more obvious when the Na content was high. Fe@SiO2-C and FeNa@SiO2-C only have the peak of Fe2O3 (33.15°/35.63°). It can be found that the specific surface area (SSA) of FeZnNa catalysts was increased from 9.261 m2/g to 20.572 m2/g as the particle size of Fe2O3 decreases. Combined with the larger specific surface area of the remaining catalysts and the final actual CO2 conversion rate (Table 3), it can be found that although the remaining catalysts have a larger specific surface area, the actual CO2 conversion rate is lower than any FeZnNax@SiO2-C catalysts, which shows that Zn-Na as a combination can overcome the disadvantage of its own smaller specific surface area and obtain a more practical advantage of higher CO2 conversion rate. If we only consider that alkaline Na promotes the absorption of acidic CO2, by comparing FeNa@SiO2-C and FeZnNa6.4@SiO2-C, it can be found that there is still a clear difference between their CO2 conversion rate (Table 3). So the increase in CO2 conversion rate is still attributed to the joint effect of Zn-Na.
Figure 2 shows the TEM images and High-resolution TEM images of FeZnNax@SiO2-C, it can be determined that the FeZnNa@SiO2-C series catalysts have a mesoporous structure, with a large number of particles distributed. The nanoparticles are not easy to produce carbon deposits at critical size. The reason for the small particle size is that P123 is rich in hydroxyl groups (-OH), which can tightly bind with TEOS molecules to form micelles. The C overlay produced by polymer carbonization inhibits the sintering of metal nanoparticles, metal and support interaction is enhanced during high temperature treatment. As shown in Figure 2, the well-dispersed Fe nanoparticles, with an average diameter of 15-21 nm, on Fe2O3 can be clearly observed. The lattice spacing of the Fe2O3 particle on SiO2 is 0.26 nm, which can be attributed to the (400) planes, suggesting that the catalyst exists in the form of Fe2O3 and retains good crystallinity, consistent with the XRD results. Figure 2 (f) and (h) can been show clearly that there are two different oxides, Fe2O3 and ZnO.These metal particles have a very small particle size and are dispersed on mesoporous SiO2, including Fe2O3 and ZnO or Na2O/Na. In the reduction step, these metal oxides are reduced to Fe3O4/ZnO at a temperature of 673K. In the catalytic process, more active Fe5C2 particles are generated to improve the selectivity of the target product.
Among the four groups of FeZnNax@Si-C catalysts, as shown in Figure 3, the catalyst has a distinct mesoporous structure. As shown in Table 2, with the increase of Na content, the specific surface area generally showed a trend of first increasing and then decreasing, FeZnNa6.4@SiO2-C had the highest specific surface area compared with other catalysts, at 20.572 m2/g. In the process of research, Liang [16] found that when the Na content was 0.1%, 0.5% and 5%, respectively, the specific surface area also increased first and then decreased, which were 31, 45, 28. The smaller the size of the metal, the larger its surface area and the more CO2 it adsorbs. When all catalysts were studied, the specific surface area decreased due to the increase in the size of metal particles. Although the other three catalysts have a higher specific surface area than FeZnNa catalysts,the actual CO2 conversion rate is lower than that of FeZnNa catalysts (Table 3), which shows that ZnNa as a whole can significantly improve the CO2 conversion rate. The change in conversion rate is also consistent with the reference conclusion of Liang [16], the alkaline additives can promote the adsorption and conversion of CO2.

Table 2.
Pore characteristic of the Fe@SiO2-C, FeNa@SiO2-C and FeZnNax@SiO2-GC catalysts.
| Catalyst | Na/Fea(wt%) | SBET(m2/g) | PVb(cm3/g) | APSc(nm) |
|---|---|---|---|---|
| Fe@SiO2-C | / | 75.579 | 0.087 | 3.19 |
| FeZn@SiO2-C | / | 48.519 | 0.144 | 4.199 |
| FeNa@SiO2-C | / | 78.41 | 0.111 | 4.189 |
| FeZnNa(1.5%)@SiO2-C | / | 9.261 | 0.035 | 4.46 |
| FeZnNa(3.1%)@SiO2-C | / | 16.247 | 0.035 | 2.951 |
| FeZnNa(6.4%)@SiO2-C | 0.12 | 20.572 | 0.047 | 2.956 |
| FeZnNa(7.6%)@SiO2-C | / | 14.691 | 0.035 | 2.952 |
a XPS , b Pore volume, c Average pore-size.
Table 3.
Comparison of CO2 hydrogenation Catalytic Performances with Fe@SiO2-GC, FeNa@SiO2-GC and FeZnNax@SiO2-GC catalysts.
Table 3.
Comparison of CO2 hydrogenation Catalytic Performances with Fe@SiO2-GC, FeNa@SiO2-GC and FeZnNax@SiO2-GC catalysts.
| Catalyst | CO2 Con(%) |
CH4 Sel(%) |
C2-C4 Sel(%) |
C5+ Sel(%) |
O/P |
|---|---|---|---|---|---|
| Fe@SiO2-C | 52.17 | 83.06 | 11.52 | 5.45 | 1.06 |
| FeZn@SiO2-C | 53.78 | 64.32 | 32.41 | 3.29 | 0.05 |
| FeNa@SiO2-C | 52.26 | 66.56 | 26.71 | 8.33 | 0.32 |
| FeZnNa(1.5%)@SiO2-C | 58.41 | 22.89 | 43.65 | 33.42 | 2.01 |
| FeZnNa(3.1%)@SiO2-C | 59.03 | 33.00 | 43.07 | 23.83 | 2.15 |
| FeZnNa(6.4%)@SiO2-C | 58.32 | 18.30 | 50.00 | 31.69 | 4.21 |
| FeZnNa(7.6%)@SiO2-C | 58.4 | 18.63 | 49.75 | 31.72 | 4.73 |
The results are in good consistency with those reported, alkali promoter will increase the CO2 adsorption and adsorption strength. Therefore, the stronger CO2 adsorption on the surface made the CO2 activation on the FeZnNa catalyst easier than the case of other catalyst, which in turn favors the subsequent conversions.The pore volume is also FeZnNa(6.4%)@SiO2-C has a maximum of 0.047 cm3/g. The average pore size reached a maximum at 1.5% content, and the remaining three groups of catalysts were not much different, and still achieved a maximum value of 2.956 nm at 6.4%. The pore volume decreased from 0.047 cm3/g at 6.4%Na to 0.035cm3/g at 7.6% Na. However, the pore volume changes by a small margin, it can be seen that the excessive increase of Na has little effect on the volume of the pore. However, the pores of the catalyst do become clogged with excess Na. When the Na content is 1.5% to 6.4%, the Na content is not excessive at this time, and the pores are not be blocked.Hence the decrease in surface area is suggested to be due to crystallite size growth and not pore blocking [38].
As can be seen from Figure 3, a typical Type IV curve is shown,it can be concluded that the prepared catalyst has a mesoporous structure, which conforms to a series of characteristics of mesopores, and the comparative analysis of the four groups of FeZnNa@SiO2-C catalysts shows that the increase of Na content promotes the increase of average pore size, BET and pore volume, all of which are 6.4%. The maximum value is obtained.
3.1.2. XPS results
As shown in Figure 4a, compared with FeZn catalyst, FeZn Na catalyst has peak shift to the left, indicating that the introduction of Na promoter leads to a lower binding energy of Fe 2p3/2 of Na-Zn-Fe catalyst. The decreased in binding energy suggests the charge transfer from Na ions to the vacant d orbits of Fe species. These peaks are higher than that of the standard ferric oxide sample (710.5 eV) [39]. Among them, the existence of C-O bonds indicates that there may be close interactions between C-Fe2O3-SiO2 in the form of C-O-Fe/Fe-C-O or C-O-Si (Figure 4b). The O/Si ratio is higher than that of 2.0 for SiO2, indicating that it may be due to the enhanced interaction between C and Fe nanoparticles and SiO2. The satellite peak is approximately 718.4 eV, consistent with standard Fe2O3 samples, which confirms the existence of the Fe species in a form of Fe3+ species [23]. The catalyst has part of ZnFe2O4,so there is Fe2+ inside (Figure 1), in Figure 4a, the binding energy peak (B.E.P.) at 711,713.3,719.2 and 725.3eV are associated with Fe2+ and Fe3+ species.
3.1.3. Reduction behavior
As shown in Figure 5, FeZnNa catalyst has two obvious reduction peaks, taking FeZnNa (6.4%)@SiO2-C as an example, the temperature of the two reduction peaks is 856.7K and 1015.8K,respectively, and the rest of the catalysts also have two obvious reduction peaks. At 856.7K, Fe3O4 is reduced to FeO, and at 1015.8K, FeO is reduced to Fe. The temperature at which FeO is reduced to Fe is generally 950 K-1050K.With the increase of Na content, the reduction temperature of the reduction peak shifted to the left, from 920.6K, 1042.2K at the lowest content to 856.7K and 1015.8K. The reduction temperature is reduced compared to the original.
However, when the Na content reached 7.6%, the reduction temperature shifted to the right, and the reduction temperature changed from 856.7 K and 1015.8 K to 874 K and 1020.1K. The reduction temperature increased. Combined with the content of Table 1 and its related discussions, it is found that the particle size change law of Fe2O3 has the same law as the change of reduction temperature: from the initial 21.20 nm to 16.89 nm, and finally grow to 18.53 nm, the particle size first decreases and then increases, the reduction temperature first decreases and then increases, and the reduction temperature decreases continuously with the decrease of Fe particles size.
3.1.4. Chemisorption behavior
As shown in Figure 6, three distinct peaks were observed for all of the samples [39]. The lower temperature peaks around 390.9 K (α peak) and 434.7 K (β peak) are ascribed to the desorption of CO2 weakly adsorbed in the bulk phase,and the peaks in the temperature range of 950 K (γ peak) correspond to the decomposition of SiO2 or the desorption of CO2 interacting strongly with the surface basic sites [39]. The increased Na loading also enhances the amount of CO2 uptake at strongly basic sites.indicating charge transfer from sodium ions to the surface iron species,which enhances surface basicity.
FeZnNa catalysts show weak CO2 adsorption at 370-440K (Figure 6a). Among them, 1.5% Na has the worst adsorption, and these peaks are significantly enhanced after the increase of Na, indicating that the increase of Na provides more alkaline sites, which is conducive to CO2 absorption (Figure 6b). At 950K, the adsorption capacity of CO2 further increases, at this time, SiO2 decomposes, which promotes the further adsorption of CO2, 1.5% Na and 6.4% Na catalysts have a better support structure at this temperature. As the temperature continues to rise, the 6.4% Na catalyst will also usher in a strong adsorption peak similar to the 7.6% Na catalyst at about 950K.Considering that 1.5% Na has weaker CO2 adsorption in the early stage, so 6.4% Na FeZnNa catalyst has better CO2 adsorption and support structure than other catalysts. This may be related to the SSA enhancement and particle size reduction of the catalyst, and the advantage of specific surface area also proves that the adsorption of CO2 is better, and the two characterizations can support each other.
3.2. Catalytic performances for CO2 hydrogenation
Table 3 and Table 4 show the catalytic performance of CO2 hydrogenation reaction of this series of catalysts. The ultimate goal of this series of catalysts is to improve the selectivity of olefins, so this section needs to focus on STY (space-time yield) of C2=-C4=. The catalysts discussed are divided into seven types,each averaging over multiple samples. Among them, STY has a maximum value of 0.0436 when the Na content is 6.4%. Observing FeZnNa7.6@SiO2-C, it can be found that although the corresponding Na content exceeds that of FeZnNa6.4@SiO2-C, STY is relatively low, which shows that this series of catalysts is the best quality catalyst when the Na content is less than 7.6%. The results of four catalysts with different Na content (1.5%-7.6%) were analyzed, and it was found that the re-increase of Na content would not increase the conversion rate of CO2 again, which could inhibit the selectivity of methane, improve the selectivity of C2+, and significantly increase the value of low-carbon olefin STY. Zn-Na as a combination can greatly improve the overall performance of this series of catalysts. Taking FeNa@SiO2-C as an example,its performance is far inferior to any of the FeZnNa@SiO2-C catalysts.
3.3. Effect of different Na content on final catalytic performance
Figure 7 shows the effects of different Na contents of the same series of catalysts on the selectivity of CO, CH4, C2=-C4=, C20-C40 and C5+, CO2 conversion rate and STY. It can be seen that the conversion rate of CO2 has increased with the addition of Na, from about 54% to about 59%, but the subsequent increase of Na content has not increased significantly. With the increase of Na content in the catalyst, the selectivity of the target product C2=-C4= increased, from 1.54% to 41.07%.STY achieved a maximum when the Na content was 6.4%, which showed that although Na increased the activity of the catalyst, it inhibited the activity of the catalyst when the Na content was too high. From the above characterization data, it can also be seen that FeZnNa(6.4%)@SiO2-C has the most excellent test data, with excellent mesoporous structure, highly dispersed metal nanoparticles, active component Fe5C2 (Figure 8) particles are also more obvious, metal and support have a strong interaction, these advantages accelerate electron transport, improve hydrothermal stability and catalytic activity, the characterization results are consistent with the experimental results, persuasive.
Figure 9 shows the TEM images of the spent sample, we can find that the metal particles have a slight enlargement, but do not gather together uncontrollably, which shows that graphitized carbon plays a certain role, combined with the 100-hour working condition diagram of Figure 10, it can be concluded that the catalyst has good structural stability.
XRD shows that iron-based catalysts containing Fe2O3 and ZnO components were successfully prepared. The approximate metal particle size(Fe2O3, ZnO) are calculated by the corresponding formula. The presence of Na and the proportion of components of each element were confirmed by XPS testing.From BET and TEM, it can be concluded that the FeZnNa catalysts is indeed mesoporous structure. The pore size, pore volume, specific surface area and Precise metal particle size are also obtained, the high-resolution TEM diagram shows the carbon layer wrapped on the surface of the catalyst and the highly dispersed metal nanoparticles. From the H2-TPR test, it can be seen that the increase of Na content significantly changes the reduction temperature of Fe2O3 species. FeZnNa(6.4%)@SiO2-C has the lowest reduction temperature: 856.7K (Fe3O4 FeO), 1015.8K (FeO αFe). The initially prepared Fe2O3 phase has been reduced to Fe3O4 at about 679K [10]. CO2-TPD shows that due to the introduction of Na, more alkaline sites were provided to absorb more acidic CO2 in the early stage, which once again proved that the introduction of Na enhanced the adsorption of CO2. In the later stage, SiO2 is decomposed with the increase of temperature. However, FeZnNa@SiO2-C does not have a strong CO2 absorption peak due to the decomposition of the carrier. It can be seen that compared with other catalysts, FeZnNa@SiO2-C has a more stable support structure and CO2 adsorption. These advantages show that FeZnNa catalysts do have a better internal structure than other iron-based catalysts. Among them, FeZnNa (6.4%)@SiO2-C has the most advantages in FeZnNa catalysts.
Combined with the full-text analysis, we can find that the reduction temperature, specific surface area, pore volume,average pore size and CO2 adsorption are closely related to the particle size of Fe2O3. We introduce the reasons for the particle size change: due to the addition of alkaline elements (Na), Fe particles are promoted, and the metal particle size begins to increase [38]. When Na reached a certain amount, Na acted as a dispersant, inhibited the aggregation of Fe particles, thereby reducing the particle size of Fe2O3. But as the Na content increased again, the amount that acted as a dispersant was broken,and then the pore was blocked. Fe particles with a slightly larger particle size do not have extra positions to enter, and then agglomeration phenomenon is produced again, and the particle size of Fe particles increases again. Therefore, the particle size change phenomenon of Fe2O3 is first increased, then reduced, and finally increased. The reduction temperature, specific surface area, pore volume and average pore size are all affected by the Fe2O3 particle size and change accordingly. The specific internal connection is referred to above.
4. Conclusion
Fe-based catalysts with sodium and zinc additives with stable mesoporous structure and graphitized carbon on the surface of the active components have high selectivity for the hydrogenation of carbon dioxide to produce high-value olefins. In this paper, the CO2 conversion of FeZnNa catalyst was stable at about 59%, and the CH4 selectivity was significantly inhibited compared with other catalysts and its STY value was the highest 0.0436. The result shows that the presence of Na and Zn additives is beneficial for carburizing of Fe species to produce smaller active Fe5C2 particles,improve the adsorption of carbon dioxide,inhibit the deep hydrogenation of olefins, which is the key to the conversion of carbon dioxide into olefins.Catalysts with sinter resistance and mesoporous resistance to collapse have more stable and long-lasting catalytic performance than other catalysts. The catalyst in this paper has sinter resistance and mesoporous collapse resistance, so it has a more stable structure than other catalysts.However, during the above reaction, the generated water will inhibit the RWGS step, thereby reducing the conversion rate of CO2, hindering the formation of olefins in the FTO process, affecting the final catalytic performance. Therefore, the development of catalysts with hydrophobic surfaces to ensure stable and long-lasting catalytic performance is a difficult point for further development.
Data Availability: The data that support the findings of this study are available from the corresponding author upon reasonable request.
Acknowledgements
This work was carried out with financial supports from National Natural Science Foundation of China (Grant No. 21905031) and Science Foundation of Changzhou university (ZMF18020299).
References
- Peter, S. C. Reduction of CO2 to Chemicals and Fuels: A Solution to Global Warming and Energy Crisis. ACS Energy Letters 2018, 3, 1557–1561. [Google Scholar] [CrossRef]
- Zhang, F.; Chen, W.; Li, W. Recent advances in the catalytic conversion of CO2 to chemicals and demonstration projects in China. Molecular Catalysis 2023, 541. [Google Scholar] [CrossRef]
- Zhang, W.; Wang, S.; Guo, S.; Qin, Z.; Dong, M.; Wang, J.; Fan, W. Effective conversion of CO2 into light olefins along with generation of low amounts of CO. Journal of Catalysis 2022, 413, 923–933. [Google Scholar] [CrossRef]
- Wang, J.; Xu, Y.; Ma, G.; Lin, J.; Wang, H.; Zhang, C.; Ding, M. Directly Converting Syngas to Linear alpha-Olefins over Core-Shell Fe(3)O(4)@MnOCatalysts. ACS Appl Mater Interfaces 2018, 10, 43578–43587. [Google Scholar] [CrossRef]
- Liu, W.; Cheng, S.; Malhi, H. S.; Gao, X.; Zhang, Z.; Tu, W. Hydrogenation of CO2 to Olefins over Iron-Based Catalysts: A Review. Catalysts 2022, 12. [Google Scholar] [CrossRef]
- Liu, G.; Liu, P.; Meng, D.; Zhao, T.; Qian, X.; He, Q.; Guo, X.; Qi, J.; Peng, L.; Xue, N.; et al. CO(x) hydrogenation to methanol and other hydrocarbons under mild conditions with Mo(3)S(4)@ZSM-5. Nat Commun 2023, 14, 513. [Google Scholar] [CrossRef]
- Gao, P.; Zhang, L.; Li, S.; Zhou, Z.; Sun, Y. Novel Heterogeneous Catalysts for CO(2) Hydrogenation to Liquid Fuels. ACS Cent Sci 2020, 6, 1657–1670. [Google Scholar] [CrossRef]
- Gao, R.; Zhang, C.; Jun, K.-W.; Kim, S. K.; Park, H.-G.; Zhao, T.; Wang, L.; Wan, H.; Guan, G. Transformation of CO2 into liquid fuels and synthetic natural gas using green hydrogen: A comparative analysis. Fuel 2021, 291. [Google Scholar] [CrossRef]
- Aresta, M.; Dibenedetto, A.; Quaranta, E. State of the art and perspectives in catalytic processes for CO2 conversion into chemicals and fuels: The distinctive contribution of chemical catalysis and biotechnology. Journal of Catalysis 2016, 343, 2–45. [Google Scholar] [CrossRef]
- Zhang, Z.; Huang, G.; Tang, X.; Yin, H.; Kang, J.; Zhang, Q.; Wang, Y. Zn and Na promoted Fe catalysts for sustainable production of high-valued olefins by CO2 hydrogenation. Fuel 2022, 309. [Google Scholar] [CrossRef]
- Liu, X.; Wang, M.; Yin, H.; Hu, J.; Cheng, K.; Kang, J.; Zhang, Q.; Wang, Y. Tandem Catalysis for Hydrogenation of CO and CO2 to Lower Olefins with Bifunctional Catalysts Composed of Spinel Oxide and SAPO-34. ACS Catalysis 2020, 10, 8303–8314. [Google Scholar] [CrossRef]
- Shekari, A.; Labrecque, R.; Larocque, G.; Vienneau, M.; Simoneau, M.; Schulz, R. Conversion of CO2 by reverse water gas shift (RWGS) reaction using a hydrogen oxyflame. Fuel 2023, 344. [Google Scholar] [CrossRef]
- Ma, Z.; Porosoff, M. D. Development of Tandem Catalysts for CO2 Hydrogenation to Olefins. ACS Catalysis 2019, 9, 2639–2656. [Google Scholar] [CrossRef]
- Zhu, J.; Zhang, G.; Li, W.; Zhang, X.; Ding, F.; Song, C.; Guo, X. Deconvolution of the Particle Size Effect on CO2 Hydrogenation over Iron-Based Catalysts. ACS Catalysis 2020, 10, 7424–7433. [Google Scholar] [CrossRef]
- Zhang, Z.; Liu, Y.; Jia, L.; Sun, C.; Chen, B.; Liu, R.; Tan, Y.; Tu, W. Effects of the reducing gas atmosphere on performance of FeCeNa catalyst for the hydrogenation of CO2 to olefins. Chemical Engineering Journal 2022, 428. [Google Scholar] [CrossRef]
- Liang, B.; Duan, H.; Sun, T.; Ma, J.; Liu, X.; Xu, J.; Su, X.; Huang, Y.; Zhang, T. Effect of Na Promoter on Fe-Based Catalyst for CO2 Hydrogenation to Alkenes. ACS Sustainable Chemistry & Engineering 2018, 7, 925–932. [Google Scholar] [CrossRef]
- Zhang, Z.; Yin, H.; Yu, G.; He, S.; Kang, J.; Liu, Z.; Cheng, K.; Zhang, Q.; Wang, Y. Selective hydrogenation of CO2 and CO into olefins over Sodium- and Zinc-Promoted iron carbide catalysts. Journal of Catalysis 2021, 395, 350–361. [Google Scholar] [CrossRef]
- Yang, C.; Wang, B.; Wen, Y.; Fan, M.; Jia, Y.; Zhou, S.; Huang, W. Composition control of CuFeZn catalyst derived by PDA and its effect on synthesis of C2+ alcohols from CO2. Fuel 2022, 327. [Google Scholar] [CrossRef]
- Zhao, B.; Sun, M.; Chen, F.; Shi, Y.; Yu, Y.; Li, X.; Zhang, B. Unveiling the Activity Origin of Iron Nitride as Catalytic Material for Efficient Hydrogenation of CO(2) to C(2+) Hydrocarbons. Angew Chem Int Ed Engl 2021, 60, 4496–4500. [Google Scholar] [CrossRef]
- Yao, B.; Xiao, T.; Makgae, O. A.; Jie, X.; Gonzalez-Cortes, S.; Guan, S.; Kirkland, A. I.; Dilworth, J. R.; Al-Megren, H. A.; Alshihri, S. M.; et al. Transforming carbon dioxide into jet fuel using an organic combustion-synthesized Fe-Mn-K catalyst. Nat Commun 2020, 11, 6395. [Google Scholar] [CrossRef]
- Xu, Y.; Zhai, P.; Deng, Y.; Xie, J.; Liu, X.; Wang, S.; Ma, D. Highly Selective Olefin Production from CO(2) Hydrogenation on Iron Catalysts: A Subtle Synergy between Manganese and Sodium Additives. Angew Chem Int Ed Engl 2020, 59, 21736–21744. [Google Scholar] [CrossRef] [PubMed]
- Jiang, J.; Wen, C.; Tian, Z.; Wang, Y.; Zhai, Y.; Chen, L.; Li, Y.; Liu, Q.; Wang, C.; Ma, L. Manganese-Promoted Fe3O4 Microsphere for Efficient Conversion of CO2 to Light Olefins. Industrial & Engineering Chemistry Research 2020, 59, 2155–2162. [Google Scholar] [CrossRef]
- Zhai, P.; Xu, C.; Gao, R.; Liu, X.; Li, M.; Li, W.; Fu, X.; Jia, C.; Xie, J.; Zhao, M.; et al. Highly Tunable Selectivity for Syngas-Derived Alkenes over Zinc and Sodium-Modulated Fe5 C2 Catalyst. Angew Chem Int Ed Engl 2016, 55, 9902–9907. [Google Scholar] [CrossRef]
- Yang, Y.; Zhang, H.; Ma, H.; Qian, W.; Sun, Q.; Ying, W. Effect of alkalis (Li, Na, and K) on precipitated iron-based catalysts for high-temperature Fischer-Tropsch synthesis. Fuel 2022, 326. [Google Scholar] [CrossRef]
- Wu, H. C.; Chen, T. C.; Wu, J. H.; Pao, C. W.; Chen, C. S. Influence of sodium-modified Ni/SiO(2) catalysts on the tunable selectivity of CO(2) hydrogenation: Effect of the CH(4) selectivity, reaction pathway and mechanism on the catalytic reaction. J Colloid Interface Sci 2021, 586, 514–527. [Google Scholar] [CrossRef]
- Zeng, F.; Mebrahtu, C.; Xi, X.; Liao, L.; Ren, J.; Xie, J.; Heeres, H. J.; Palkovits, R. Catalysts design for higher alcohols synthesis by CO2 hydrogenation: Trends and future perspectives. Applied Catalysis B: Environmental 2021, 291. [Google Scholar] [CrossRef]
- Kangvansura, P.; Chew, L. M.; Saengsui, W.; Santawaja, P.; Poo-arporn, Y.; Muhler, M.; Schulz, H.; Worayingyong, A. Product distribution of CO 2 hydrogenation by K- and Mn-promoted Fe catalysts supported on N -functionalized carbon nanotubes. Catalysis Today 2016, 275, 59–65. [Google Scholar] [CrossRef]
- Yang, H.; Dang, Y.; Cui, X.; Bu, X.; Li, J.; Li, S.; Sun, Y.; Gao, P. Selective synthesis of olefins via CO2 hydrogenation over transition-metal-doped iron-based catalysts. Applied Catalysis B: Environmental 2023, 321. [Google Scholar] [CrossRef]
- Shadravan, V.; Kennedy, E.; Stockenhuber, M. An experimental investigation on the effects of adding a transition metal to Ni/Al2O3 for catalytic hydrogenation of CO and CO2 in presence of light alkanes and alkenes. Catalysis Today 2018, 307, 277–285. [Google Scholar] [CrossRef]
- Wu, Y.; Lin, J.; Xu, Y.; Ma, G.; Wang, J.; Ding, M. Transition Metals Modified Ni−M (M=Fe, Co, Cr and Mn) Catalysts Supported on Al2O3−ZrO2 for Low-Temperature CO2 Methanation. ChemCatChem 2020, 12, 3553–3559. [Google Scholar] [CrossRef]
- Liang, J.; Wang, X.-y.; Gao, X.-h.; Tian, J.-m.; Duan, B.; Zhang, W.; Jiang, Y.-j.; Reubroycharoen, P.; Zhang, J.-l.; Zhao, T.-s. Effect of Na promoter and reducing atmosphere on phase evolution of Fe-based catalyst and its CO2 hydrogenation performance. Journal of Fuel Chemistry and Technology 2022, 50, 1573–1580. [Google Scholar] [CrossRef]
- Wei, C.; Tu, W.; Jia, L.; Liu, Y.; Lian, H.; Wang, P.; Zhang, Z. The evolutions of carbon and iron species modified by Na and their tuning effect on the hydrogenation of CO2 to olefins. Applied Surface Science 2020, 525. [Google Scholar] [CrossRef]
- Ni, Z.; Zhang, X.; Bai, J.; Wang, Z.; Li, X.; Zhang, Y. Potassium promoted core–shell-structured FeK@SiO2-GC catalysts used for Fischer–Tropsch synthesis to olefins without further reduction. New Journal of Chemistry 2020, 44, 87–94. [Google Scholar] [CrossRef]
- Ni, Z.; Qin, H.; Kang, S.; Bai, J.; Wang, Z.; Li, Y.; Zheng, Z.; Li, X. Effect of graphitic carbon modification on the catalytic performance of Fe@SiO(2)-GC catalysts for forming lower olefins via Fischer-Tropsch synthesis. J Colloid Interface Sci 2018, 516, 16–22. [Google Scholar] [CrossRef] [PubMed]
- Ding, M.; Yang, Y.; Wu, B.; Wang, T.; Ma, L.; Xiang, H.; Li, Y. Transformation of carbonaceous species and its influence on catalytic performance for iron-based Fischer–Tropsch synthesis catalyst. Journal of Molecular Catalysis A: Chemical 2011, 351, 165–173. [Google Scholar] [CrossRef]
- Xie, R.; Wang, H.; Gao, P.; Xia, L.; Zhang, Z.; Zhao, T.; Sun, Y. Core@shell Co3O4@C-m-SiO2 catalysts with inert C modified mesoporous channel for desired middle distillate. Applied Catalysis A: General 2015, 492, 93–99. [Google Scholar] [CrossRef]
- Qin, H.; Zhou, Y.; Bai, J.; Zhu, B.; Ni, Z.; Wang, L.; Liu, W.; Zhou, Q.; Li, X. Lignin-Derived Thin-Walled Graphitic Carbon-Encapsulated Iron Nanoparticles: Growth, Characterization, and Applications. ACS Sustainable Chemistry & Engineering 2017, 5, 1917–1923. [Google Scholar] [CrossRef]
- Xiong, H.; Motchelaho, M. A.; Moyo, M.; Jewell, L. L.; Coville, N. J. Effect of Group I alkali metal promoters on Fe/CNT catalysts in Fischer–Tropsch synthesis. Fuel 2015, 150, 687–696. [Google Scholar] [CrossRef]
- Cui, X.; Gao, P.; Li, S.; Yang, C.; Liu, Z.; Wang, H.; Zhong, L.; Sun, Y. Selective Production of Aromatics Directly from Carbon Dioxide Hydrogenation. ACS Catalysis 2019, 9, 3866–3876. [Google Scholar] [CrossRef]
Figure 1.
XRD patterns of the Fe@SiO2-C, FeNa@SiO2-C and FeZnNax@SiO2-GC catalysts.
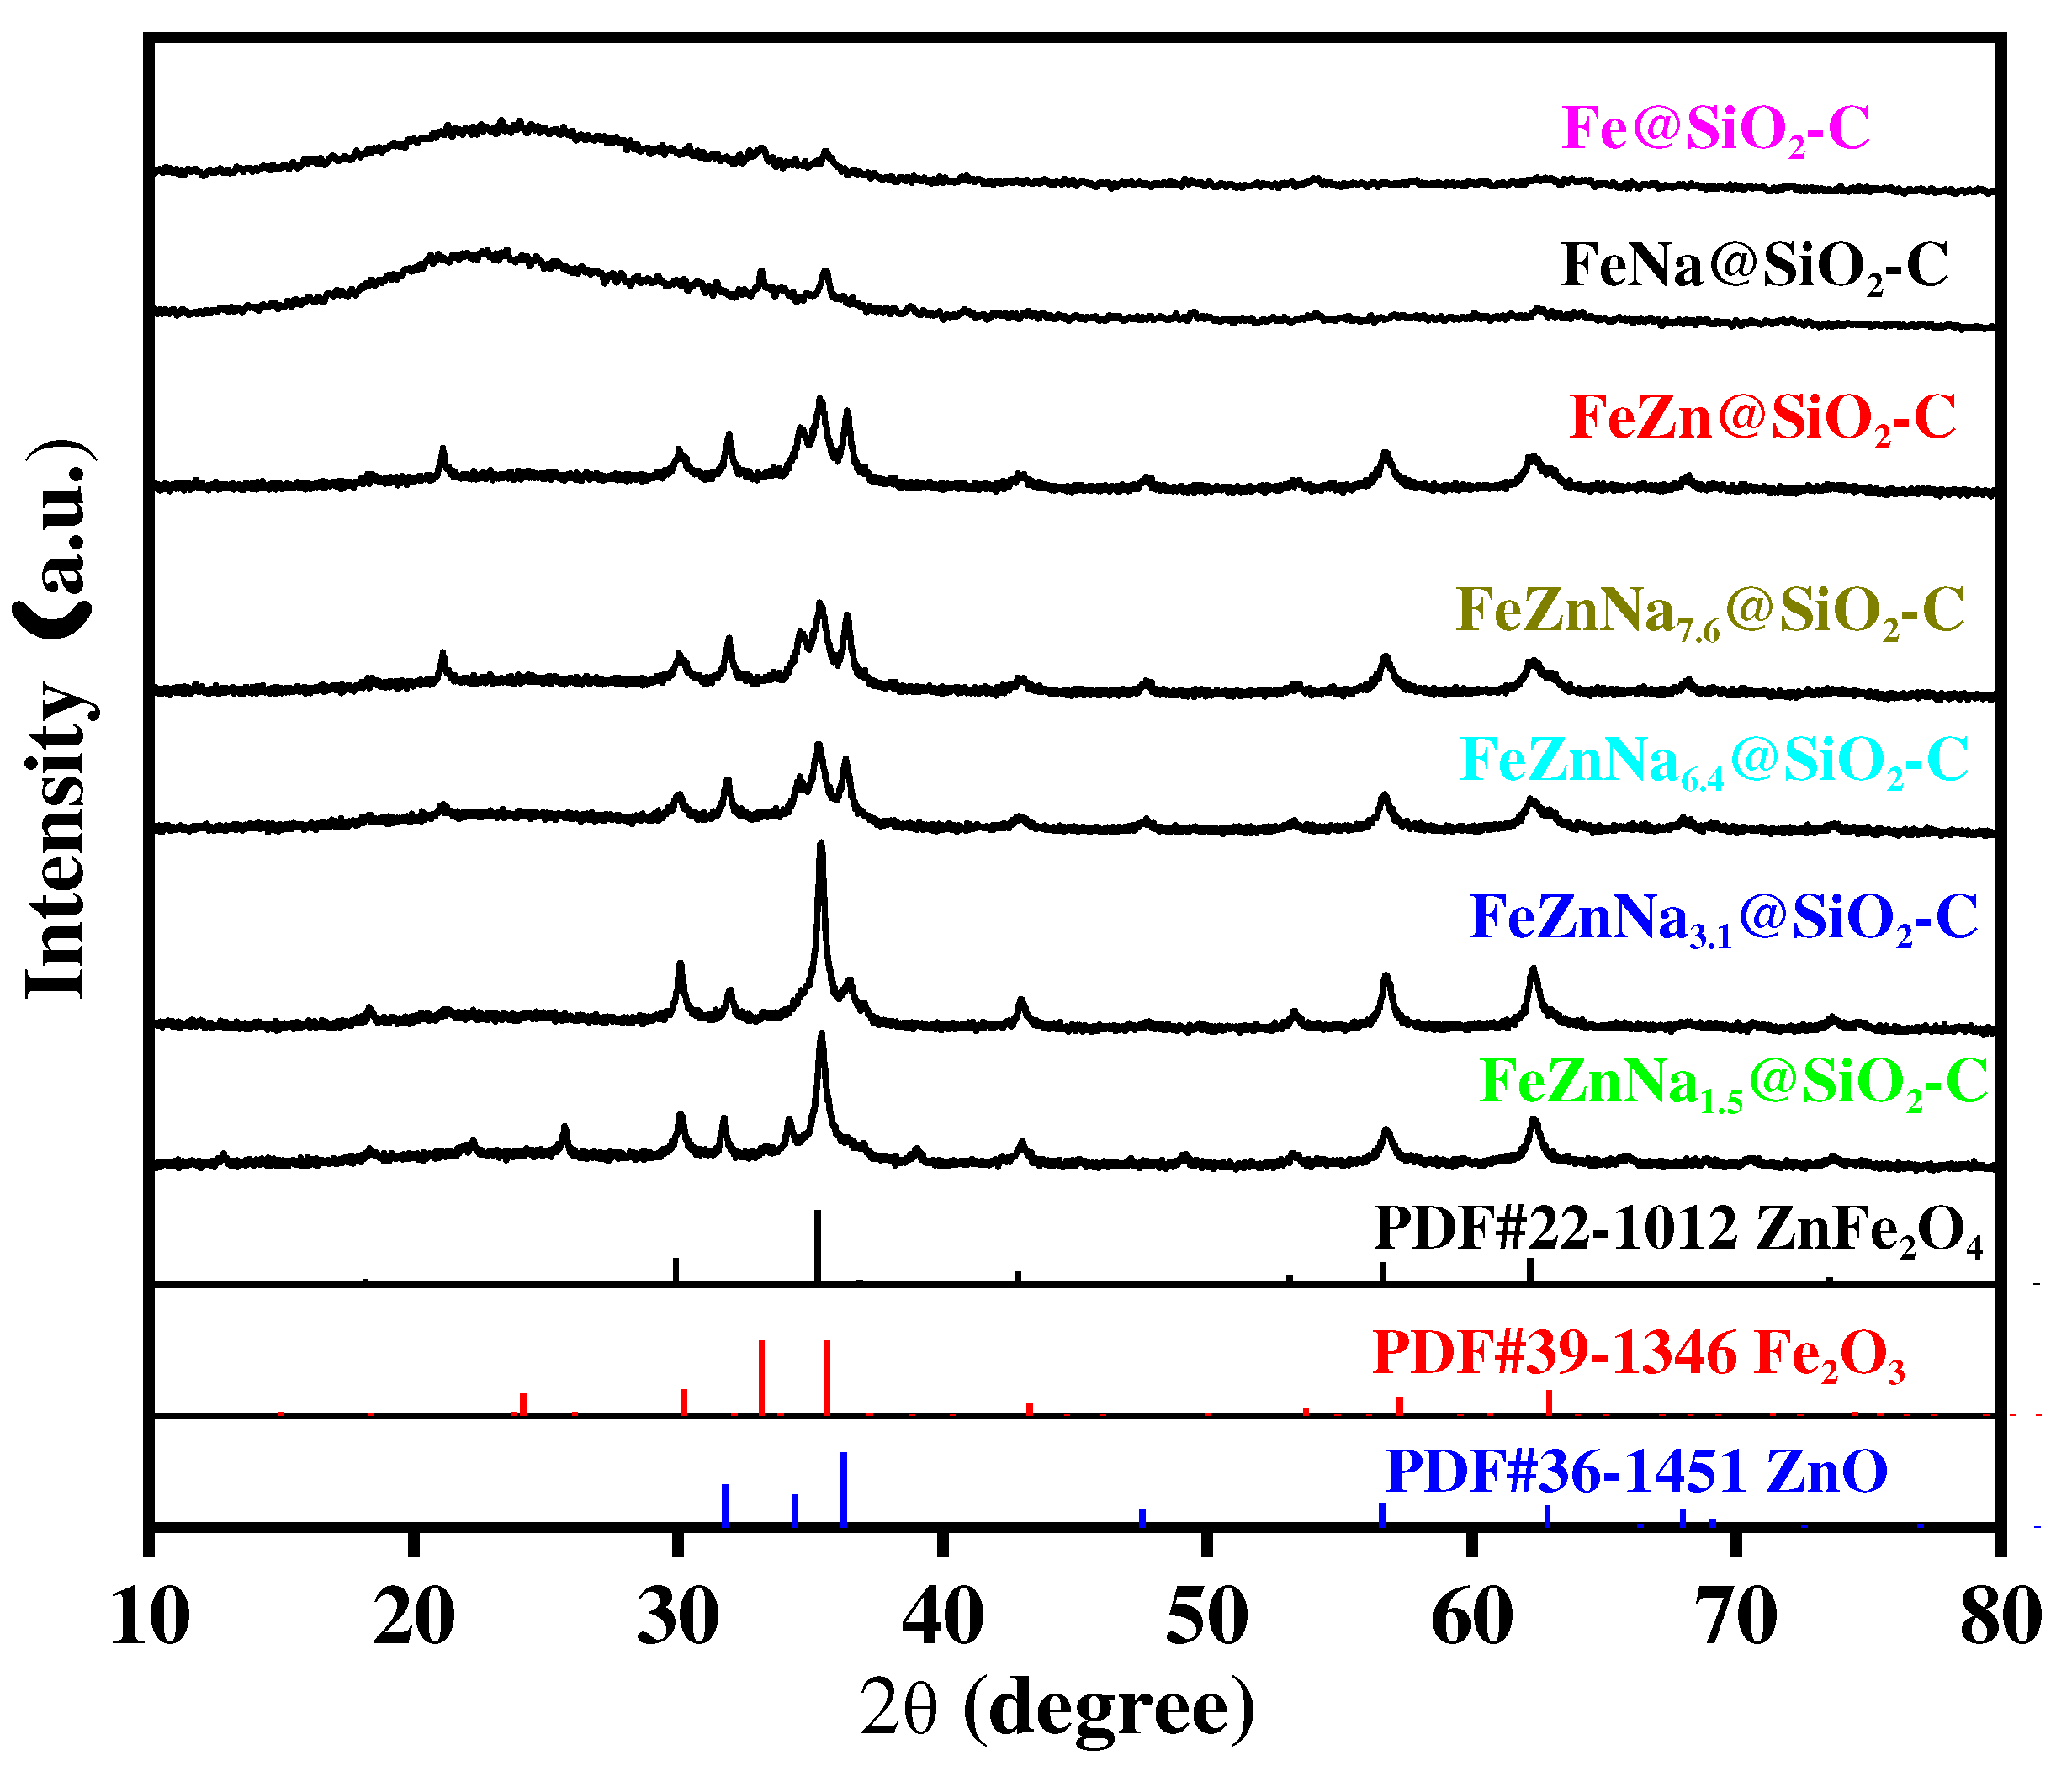
Figure 2.
TEM images and High-resolution TEM images of (a) and (b) FeZnNa1.5@SiO2-GC, (c) and (d) FeZnNa3.1@SiO2-GC, (e) and (f) FeZnNa6.4@SiO2-GC, (g) and (h) FeZnNa7.6@SiO2-GC.
Figure 2.
TEM images and High-resolution TEM images of (a) and (b) FeZnNa1.5@SiO2-GC, (c) and (d) FeZnNa3.1@SiO2-GC, (e) and (f) FeZnNa6.4@SiO2-GC, (g) and (h) FeZnNa7.6@SiO2-GC.
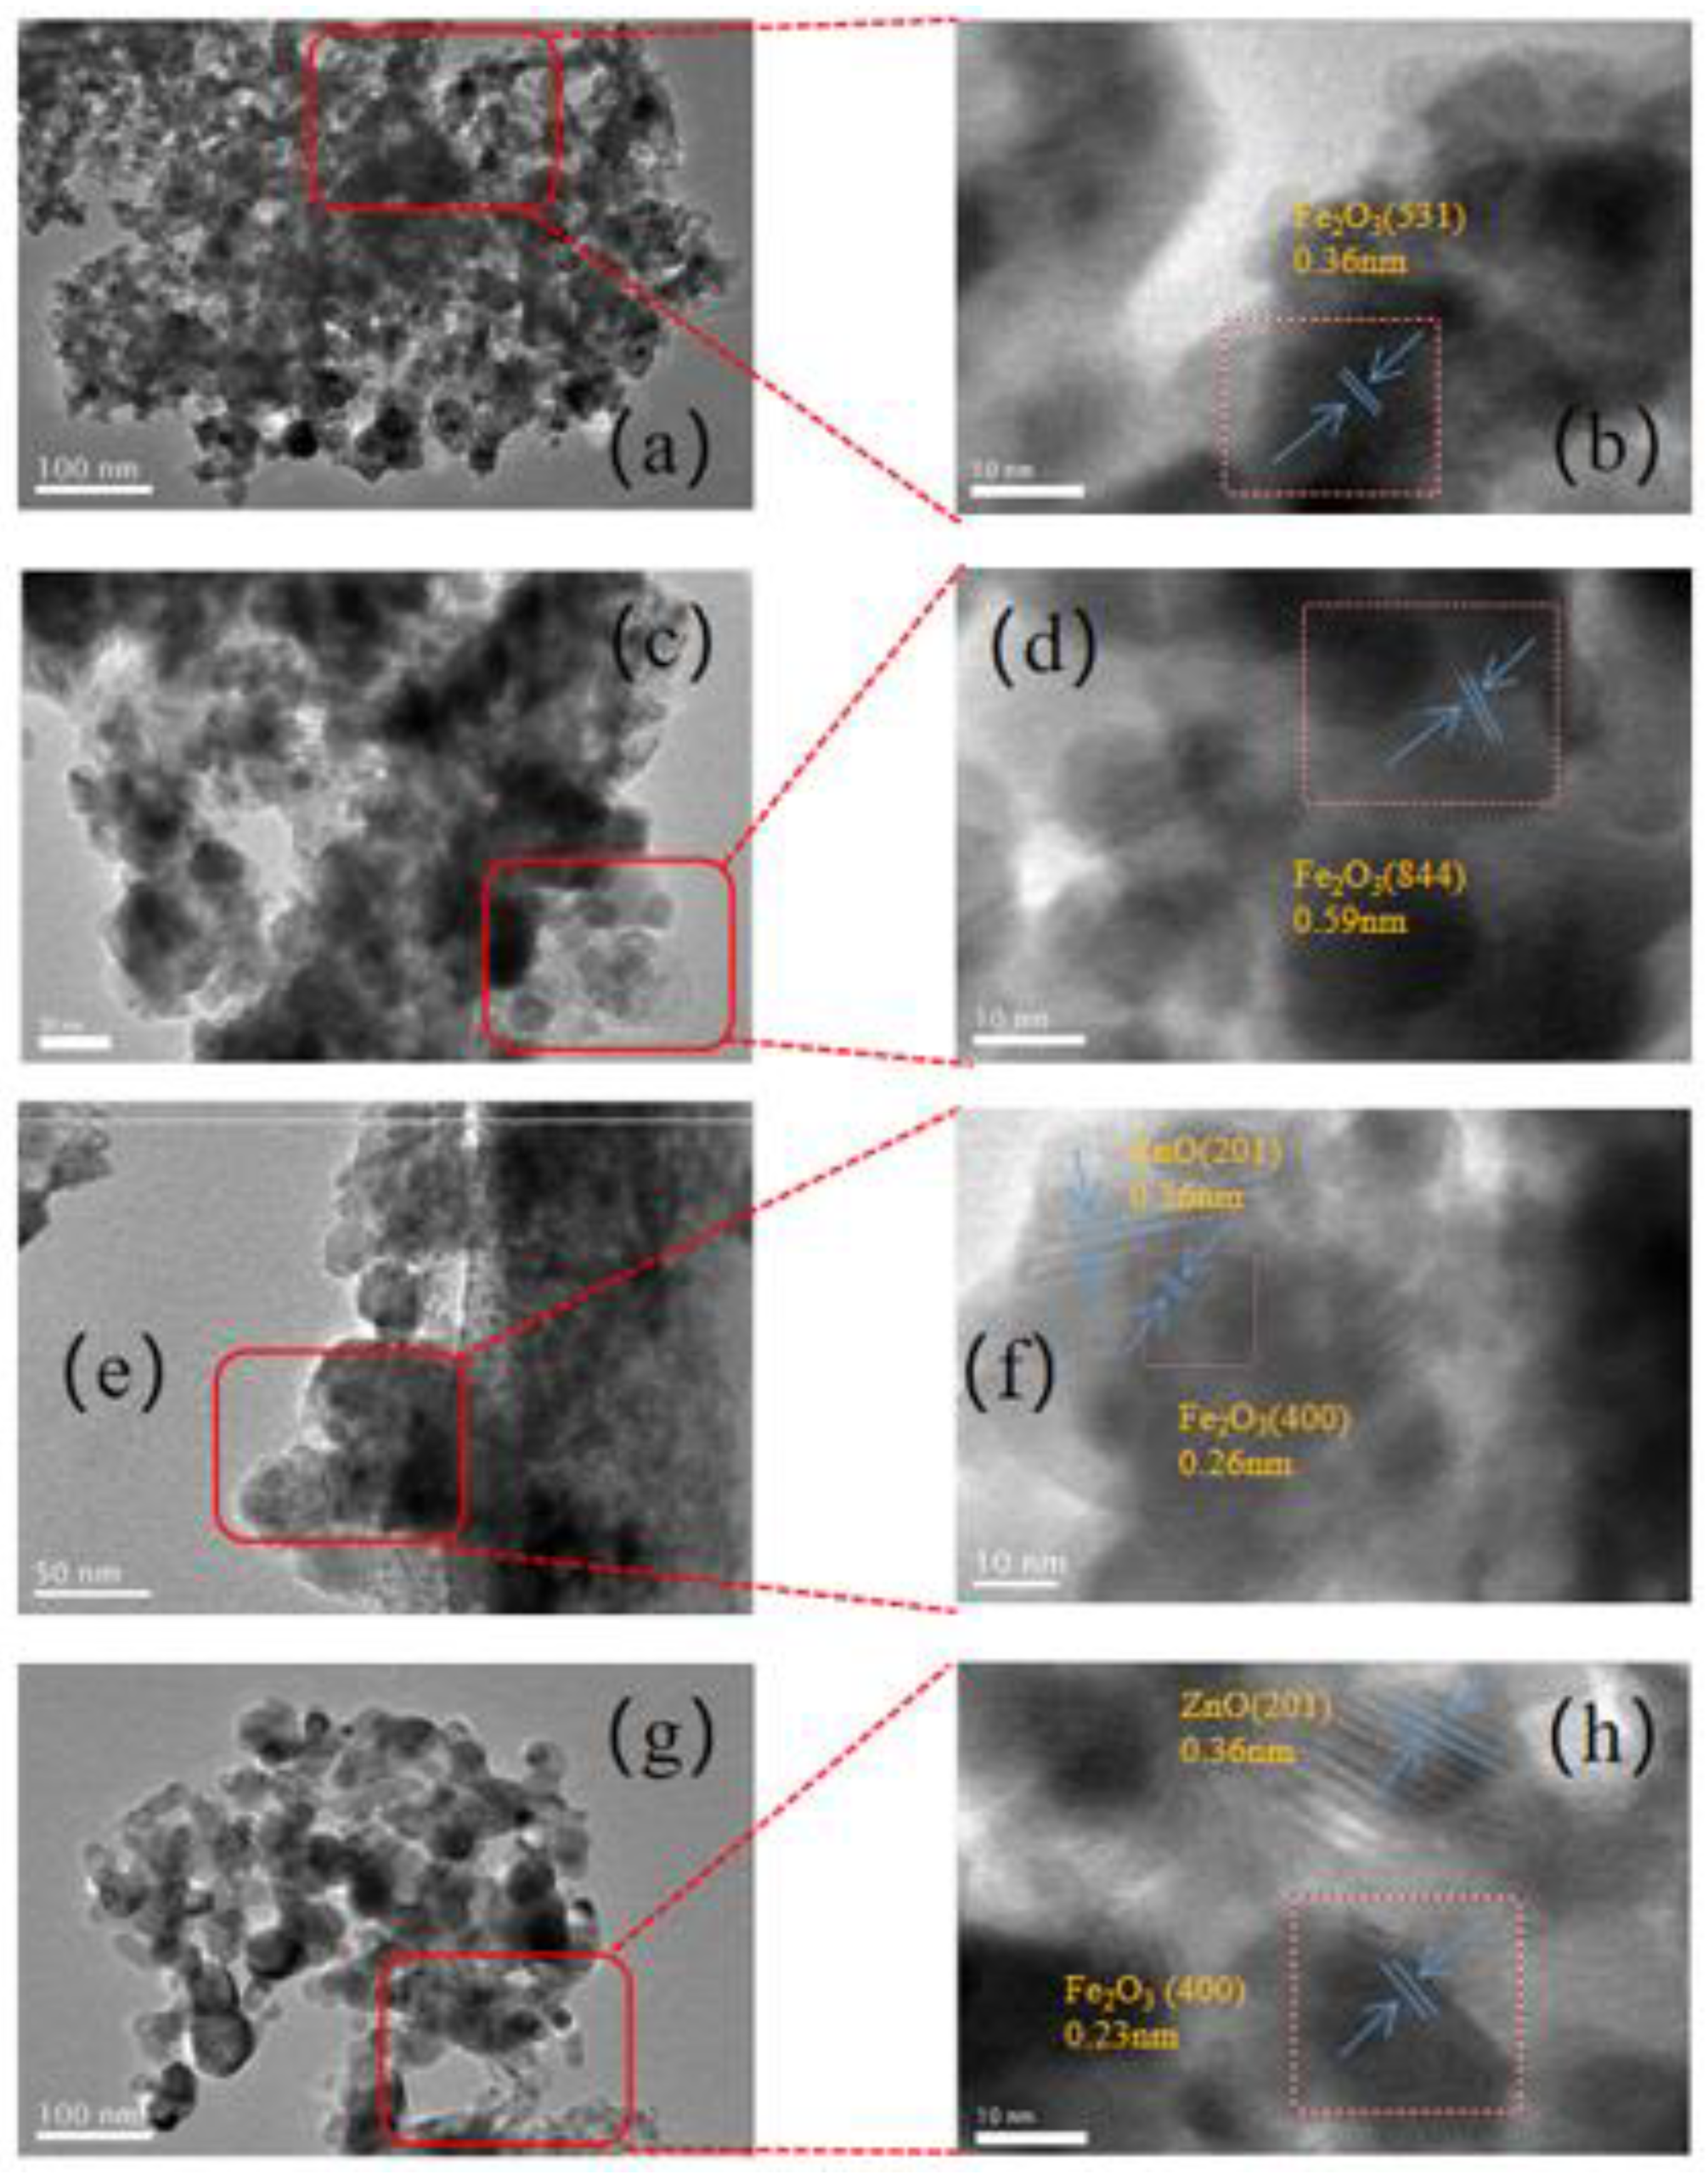
Figure 3.
N2 adsorption-desorption curves of the FeZnNax@SiO2-C catalysts with the different Na doping.
Figure 3.
N2 adsorption-desorption curves of the FeZnNax@SiO2-C catalysts with the different Na doping.
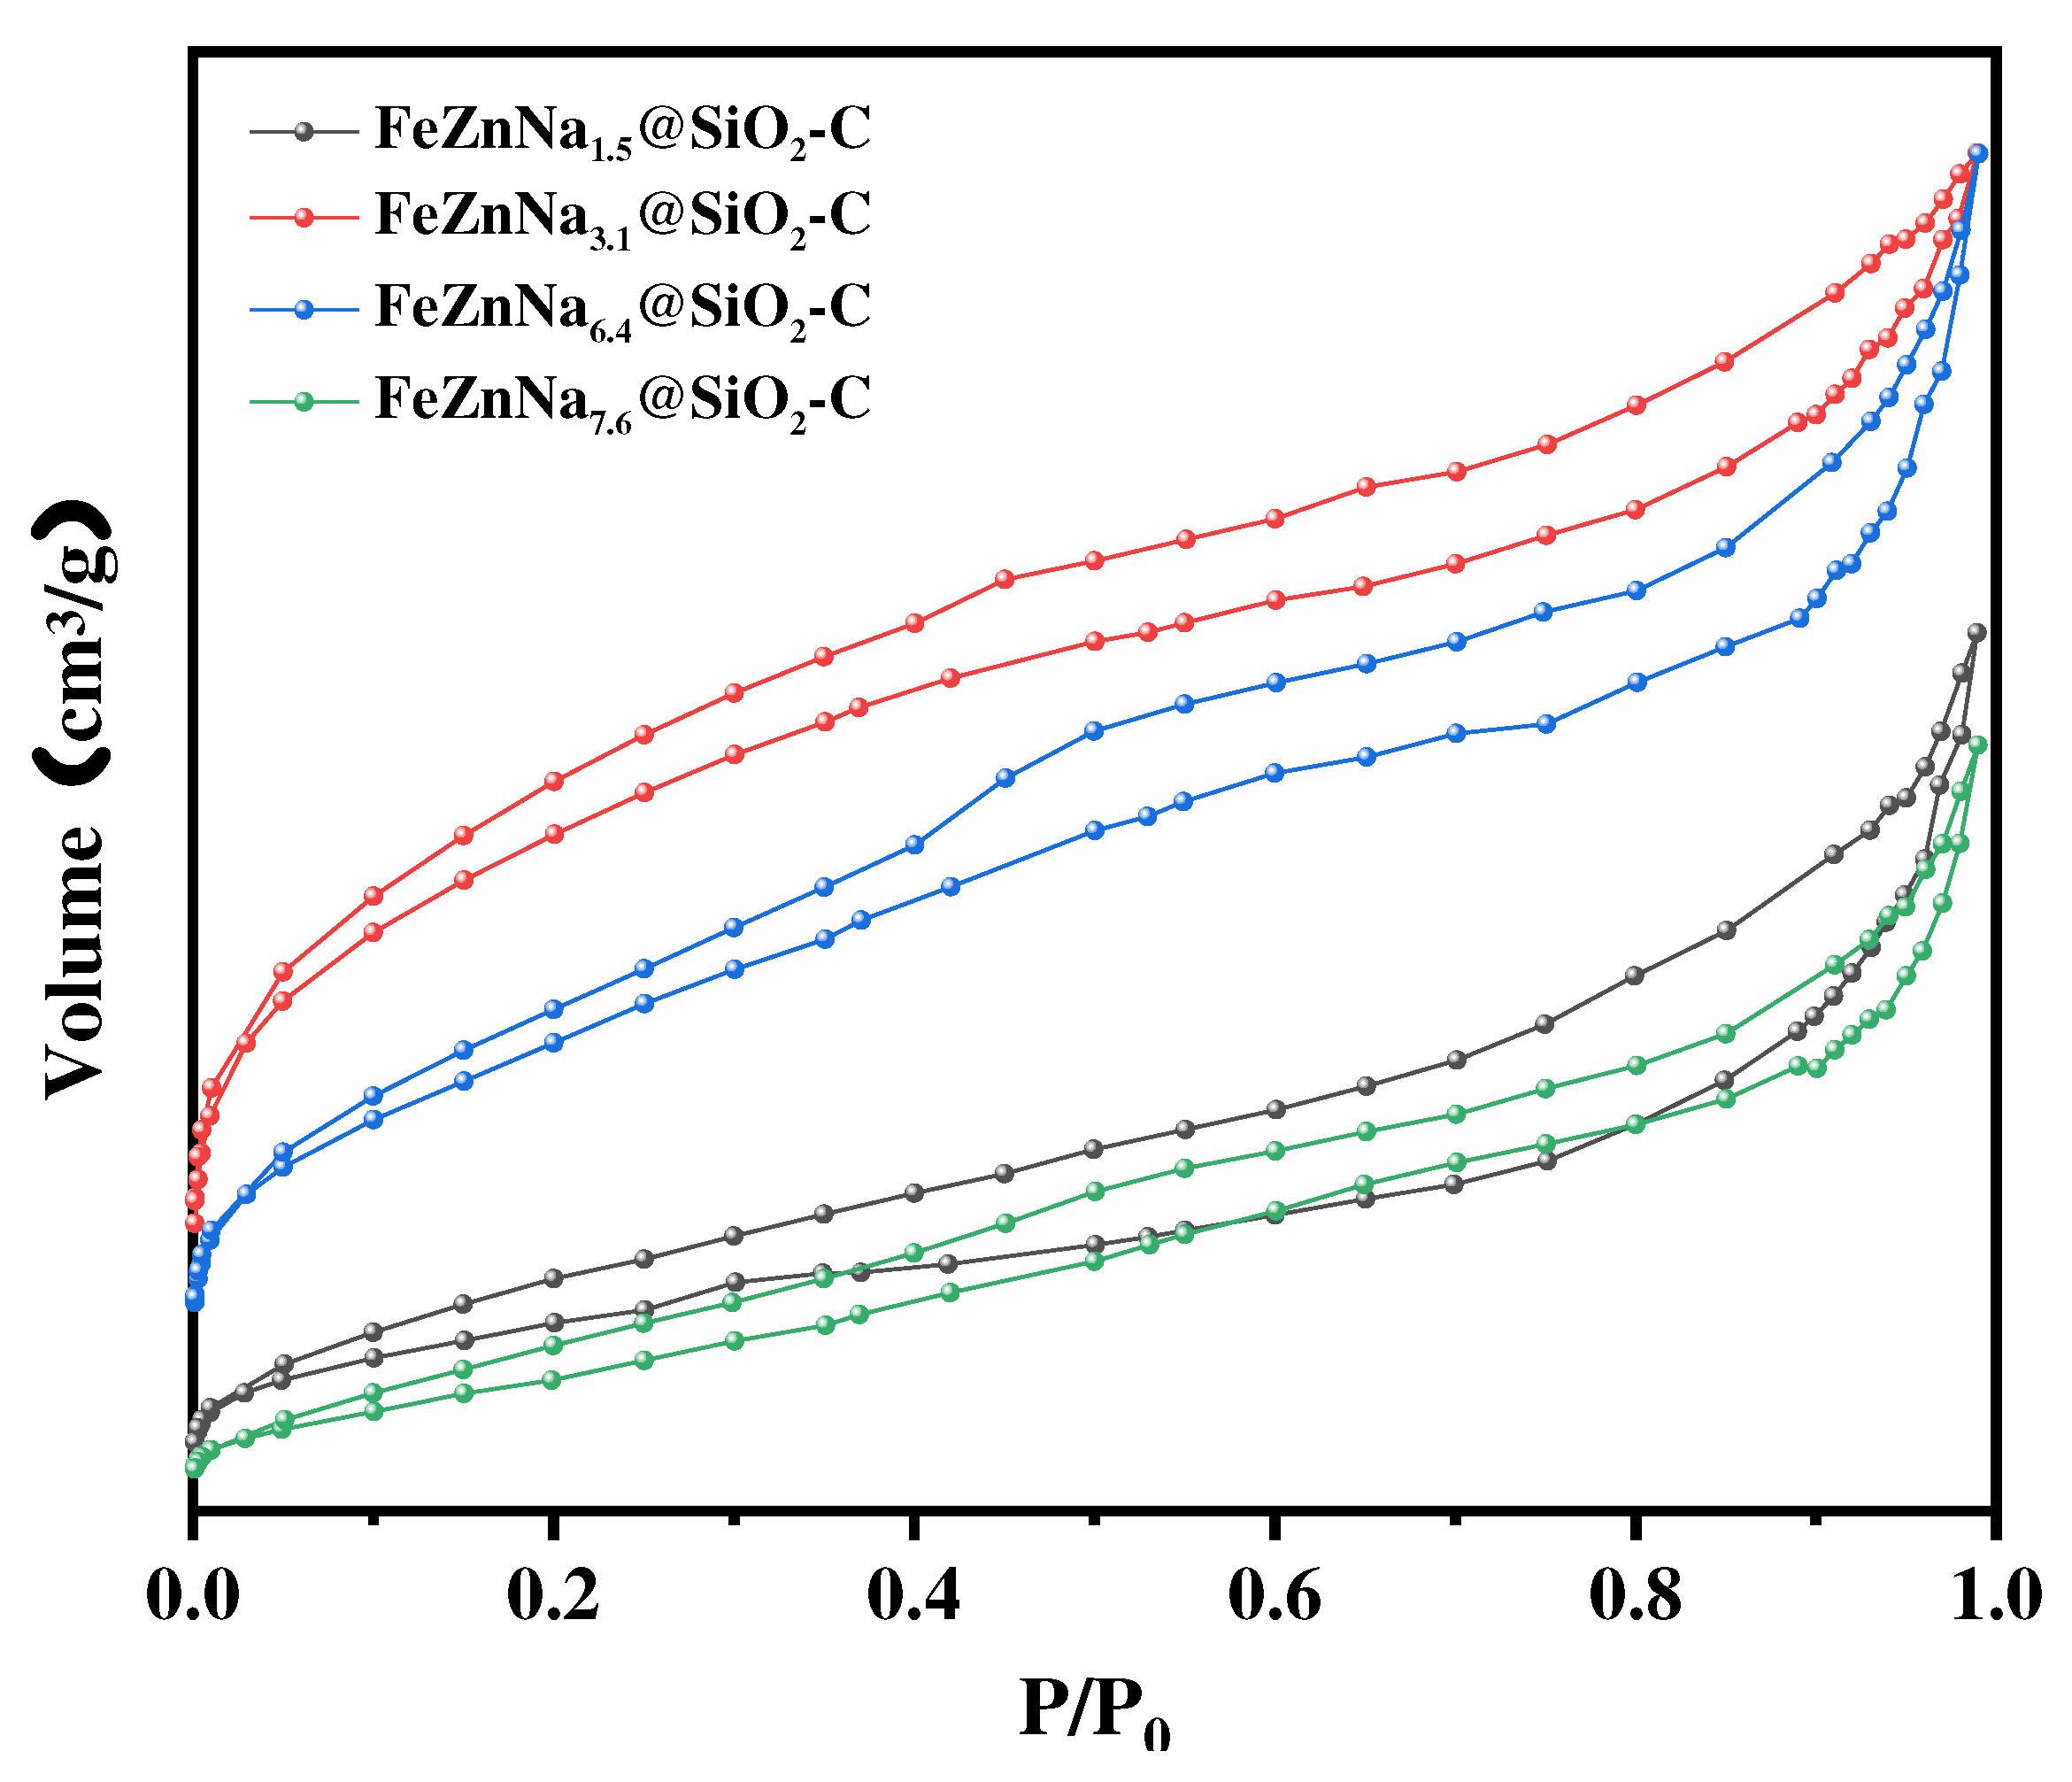
Figure 4.
(a) Fe 2p and (b) C 1s XPS spectra of the FeZnNax@SiO2-C catalyst.
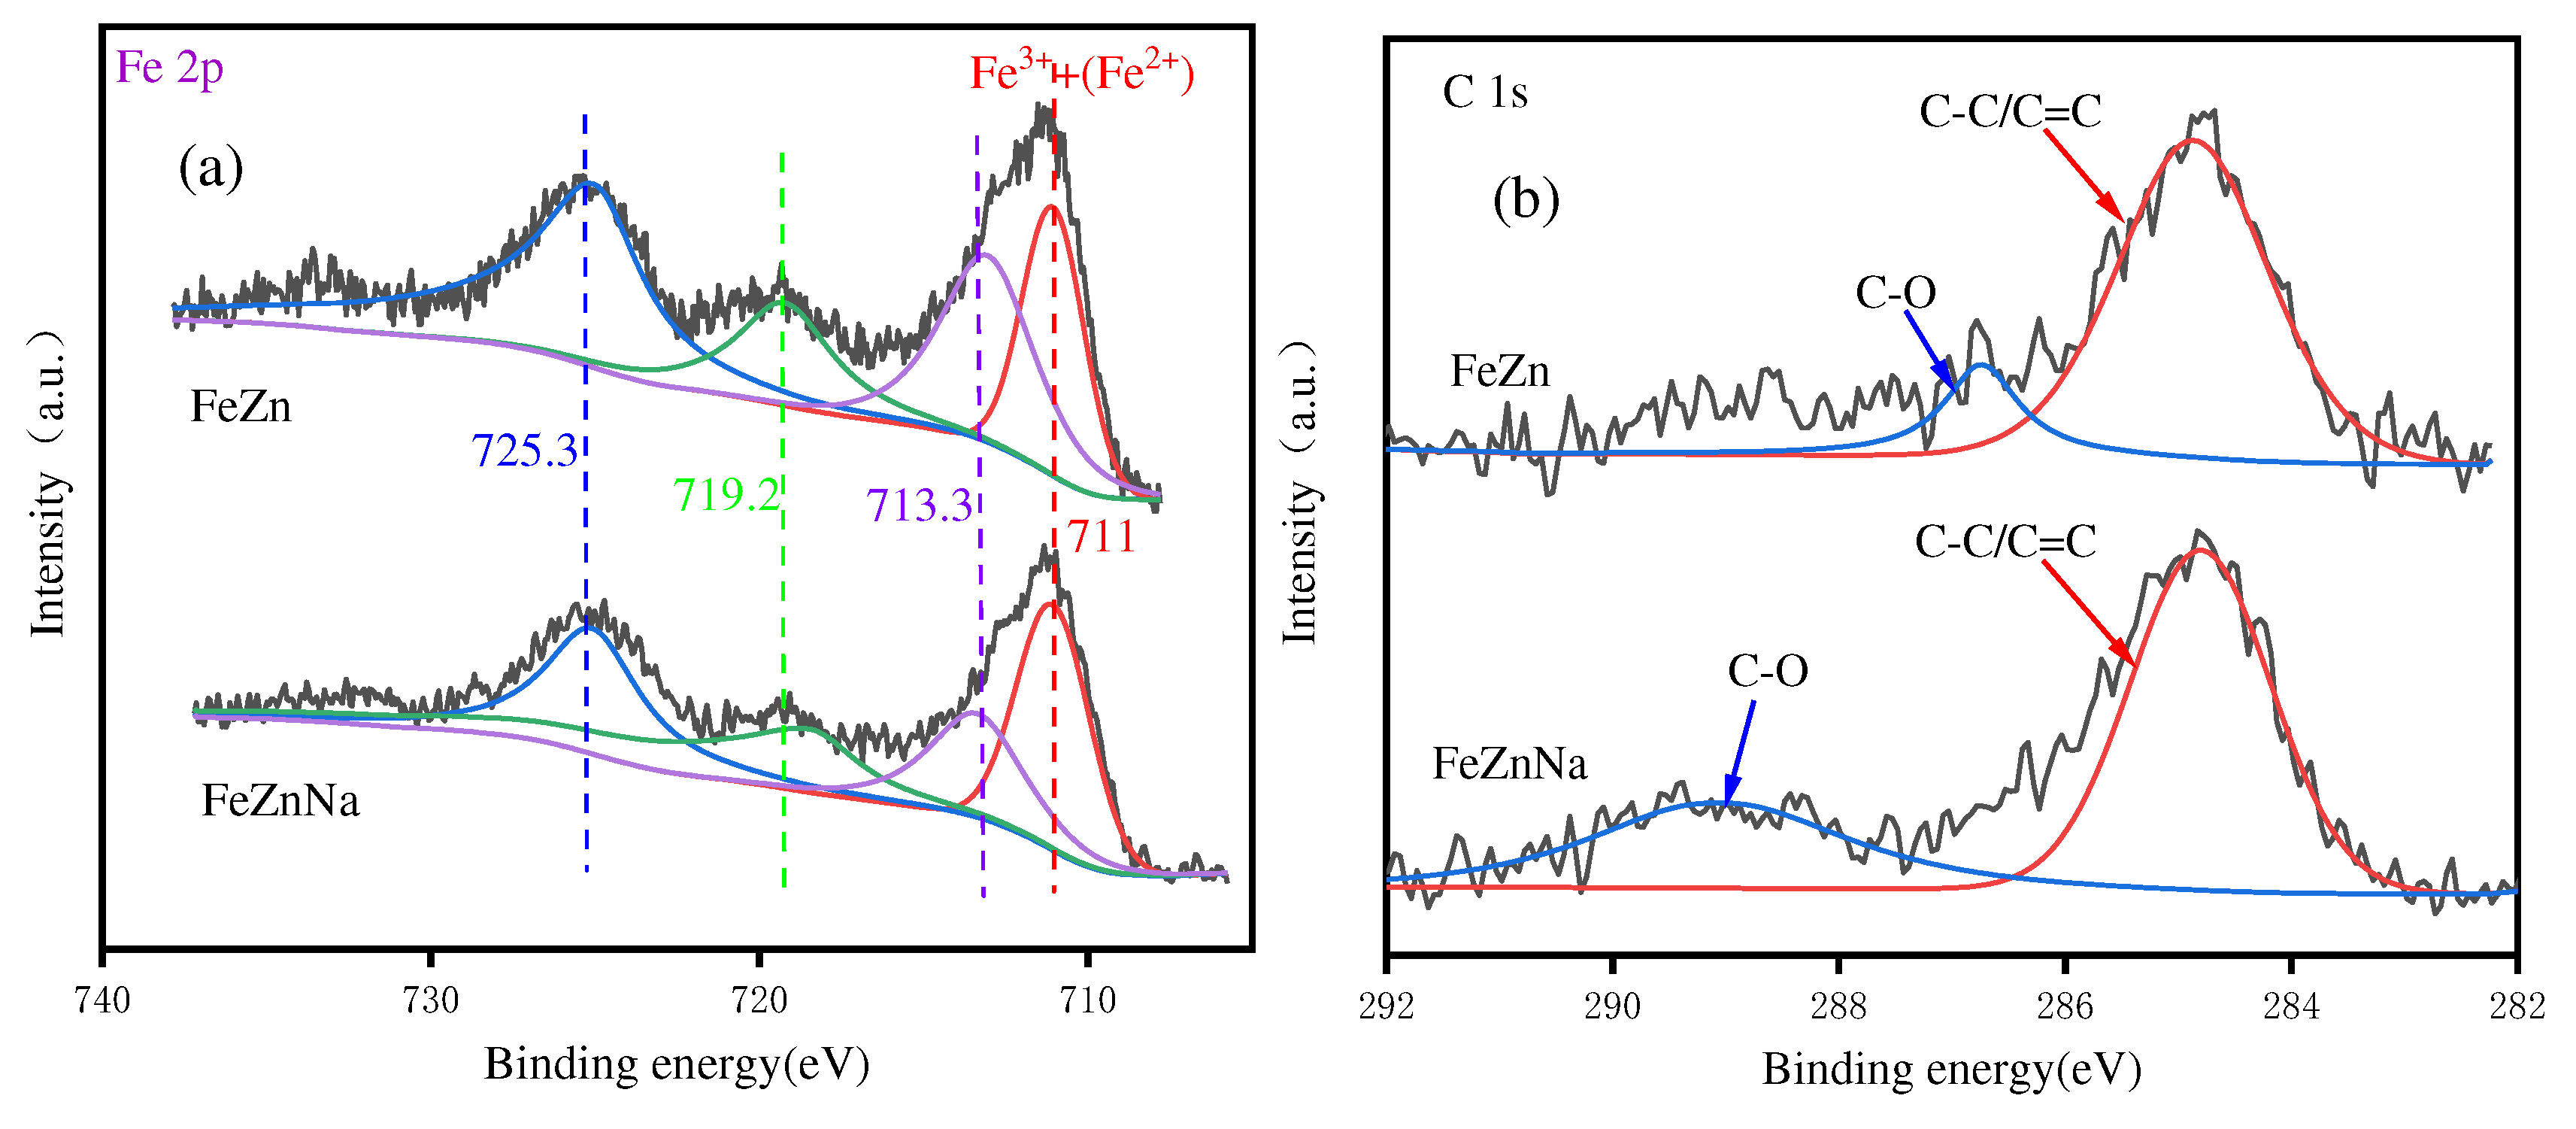
Figure 5.
H2-TPR profiles of the FeZnNax@SiO2-GC catalysts.
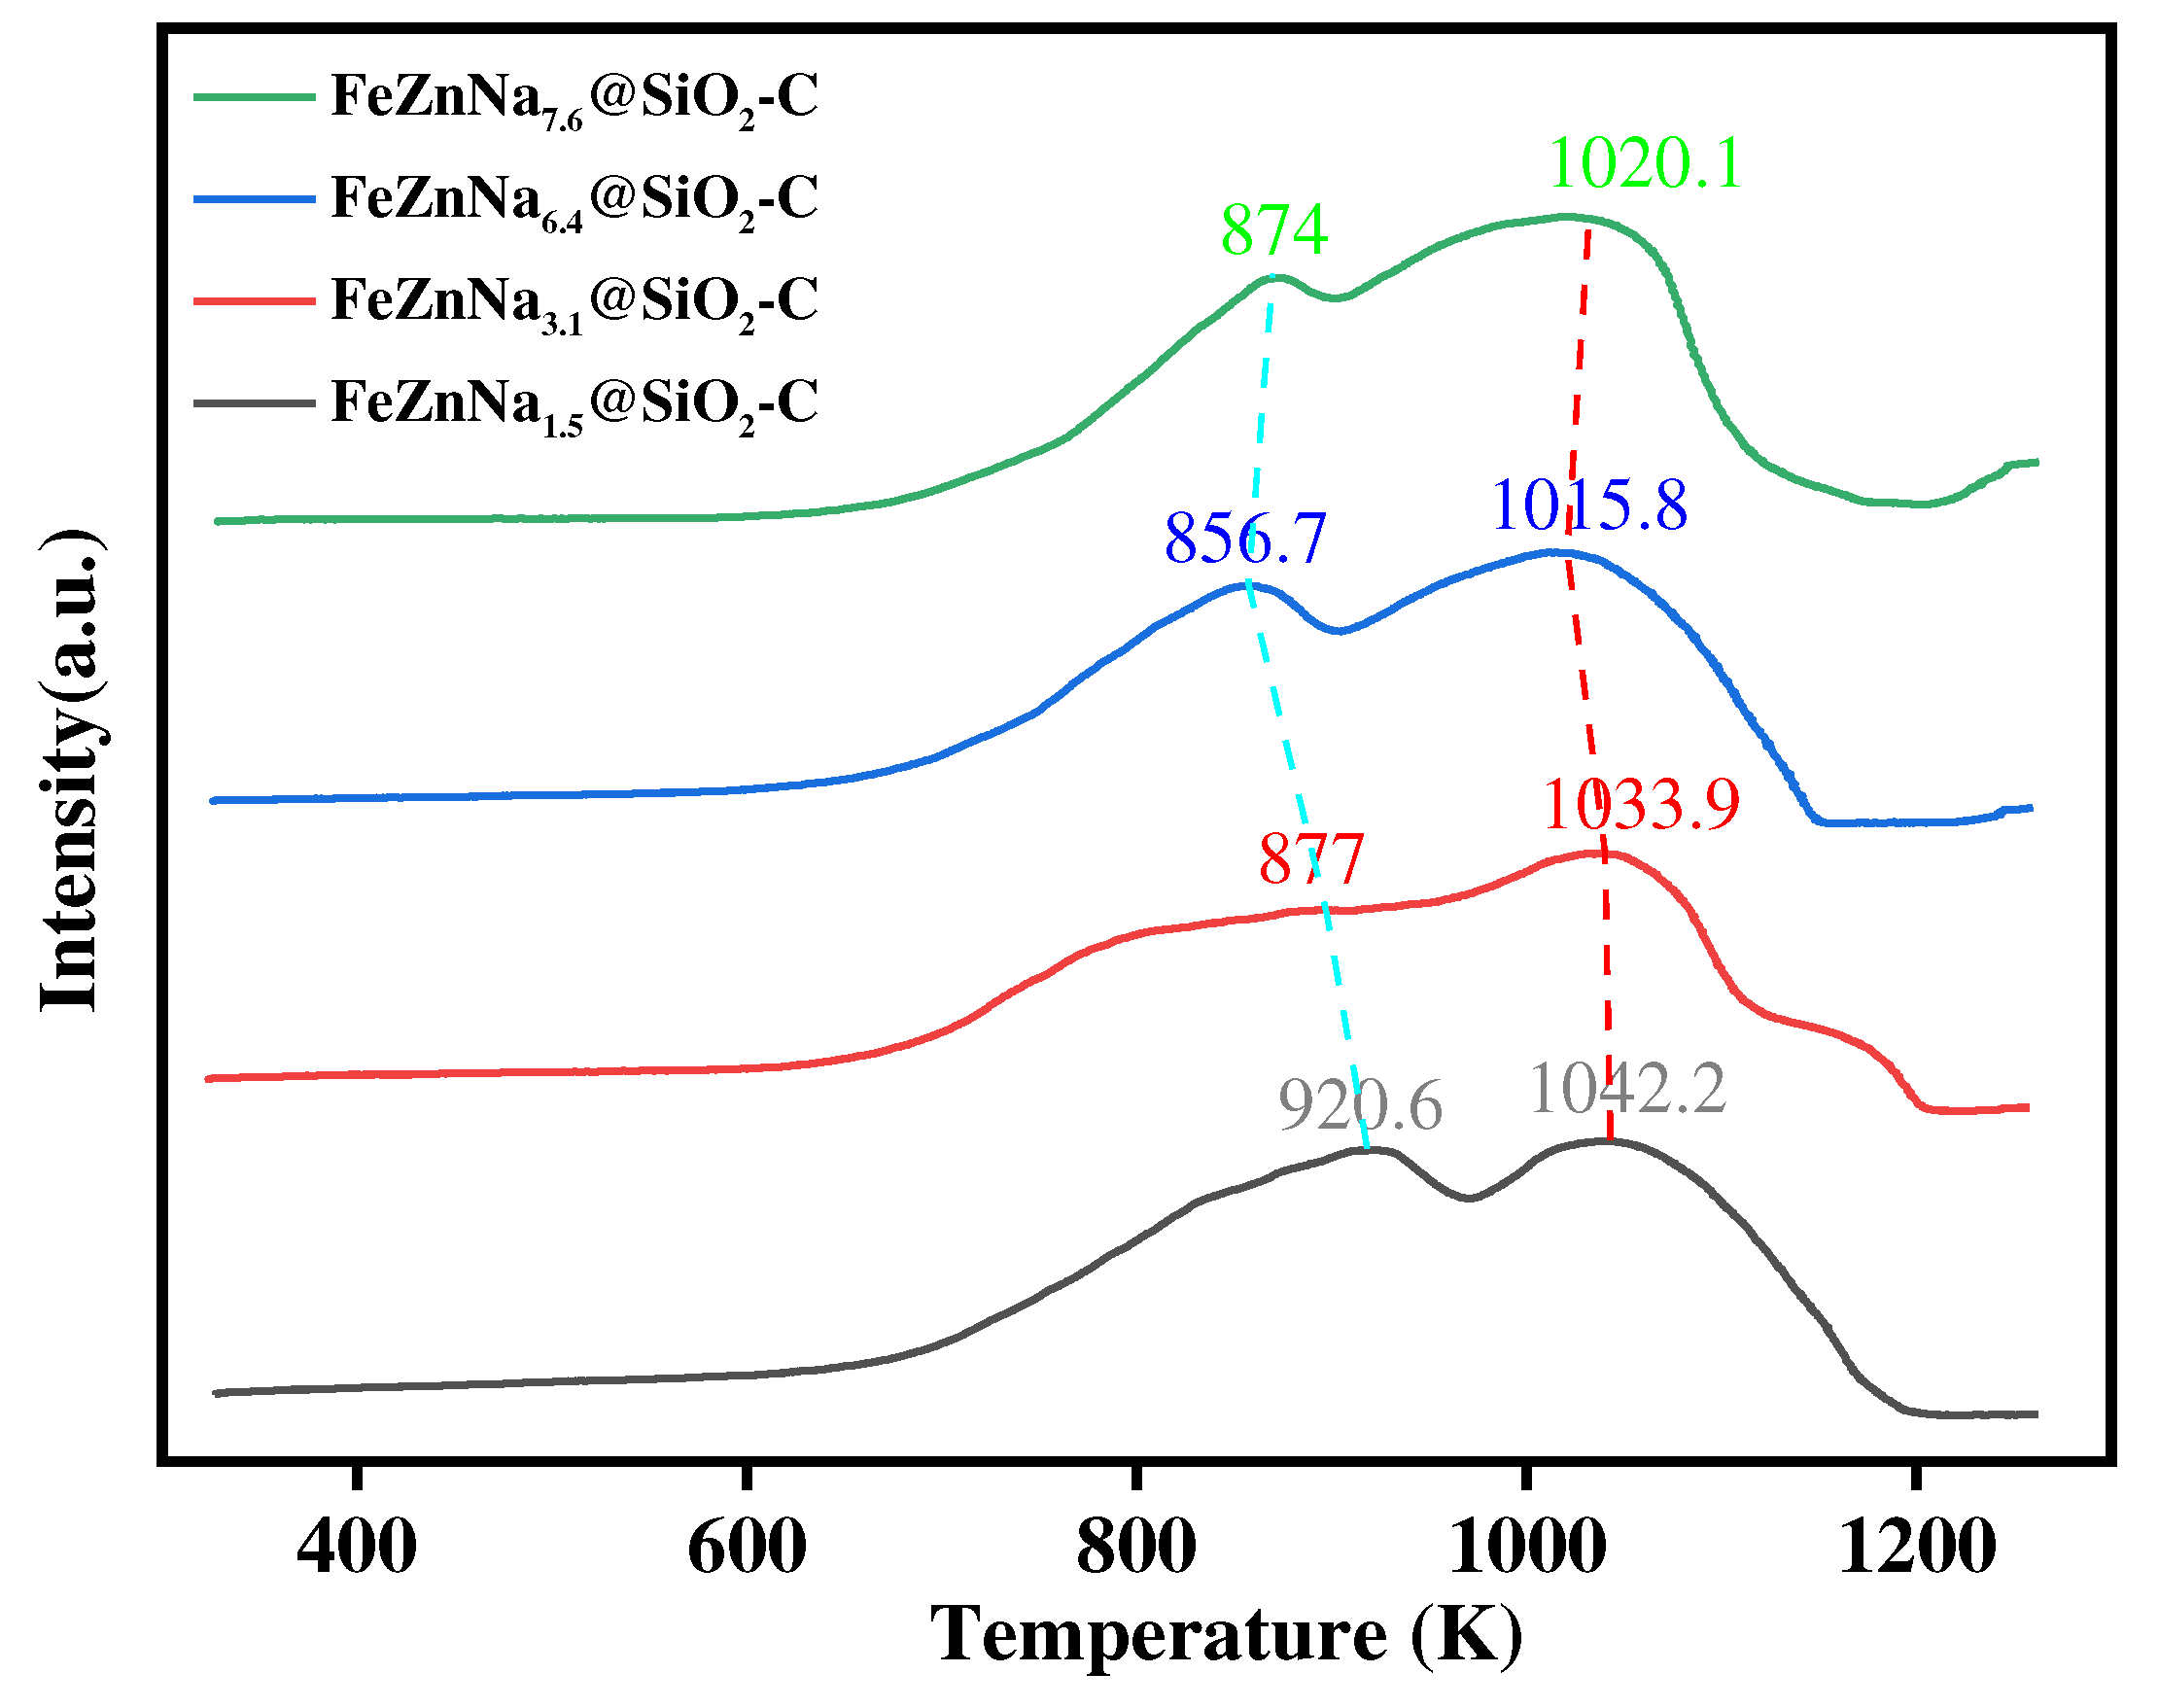
Figure 6.
CO2-TPD profiles of the FeZnNax@SiO2-GC catalysts in (a) 300-1100 K and (b) 320-500 K.
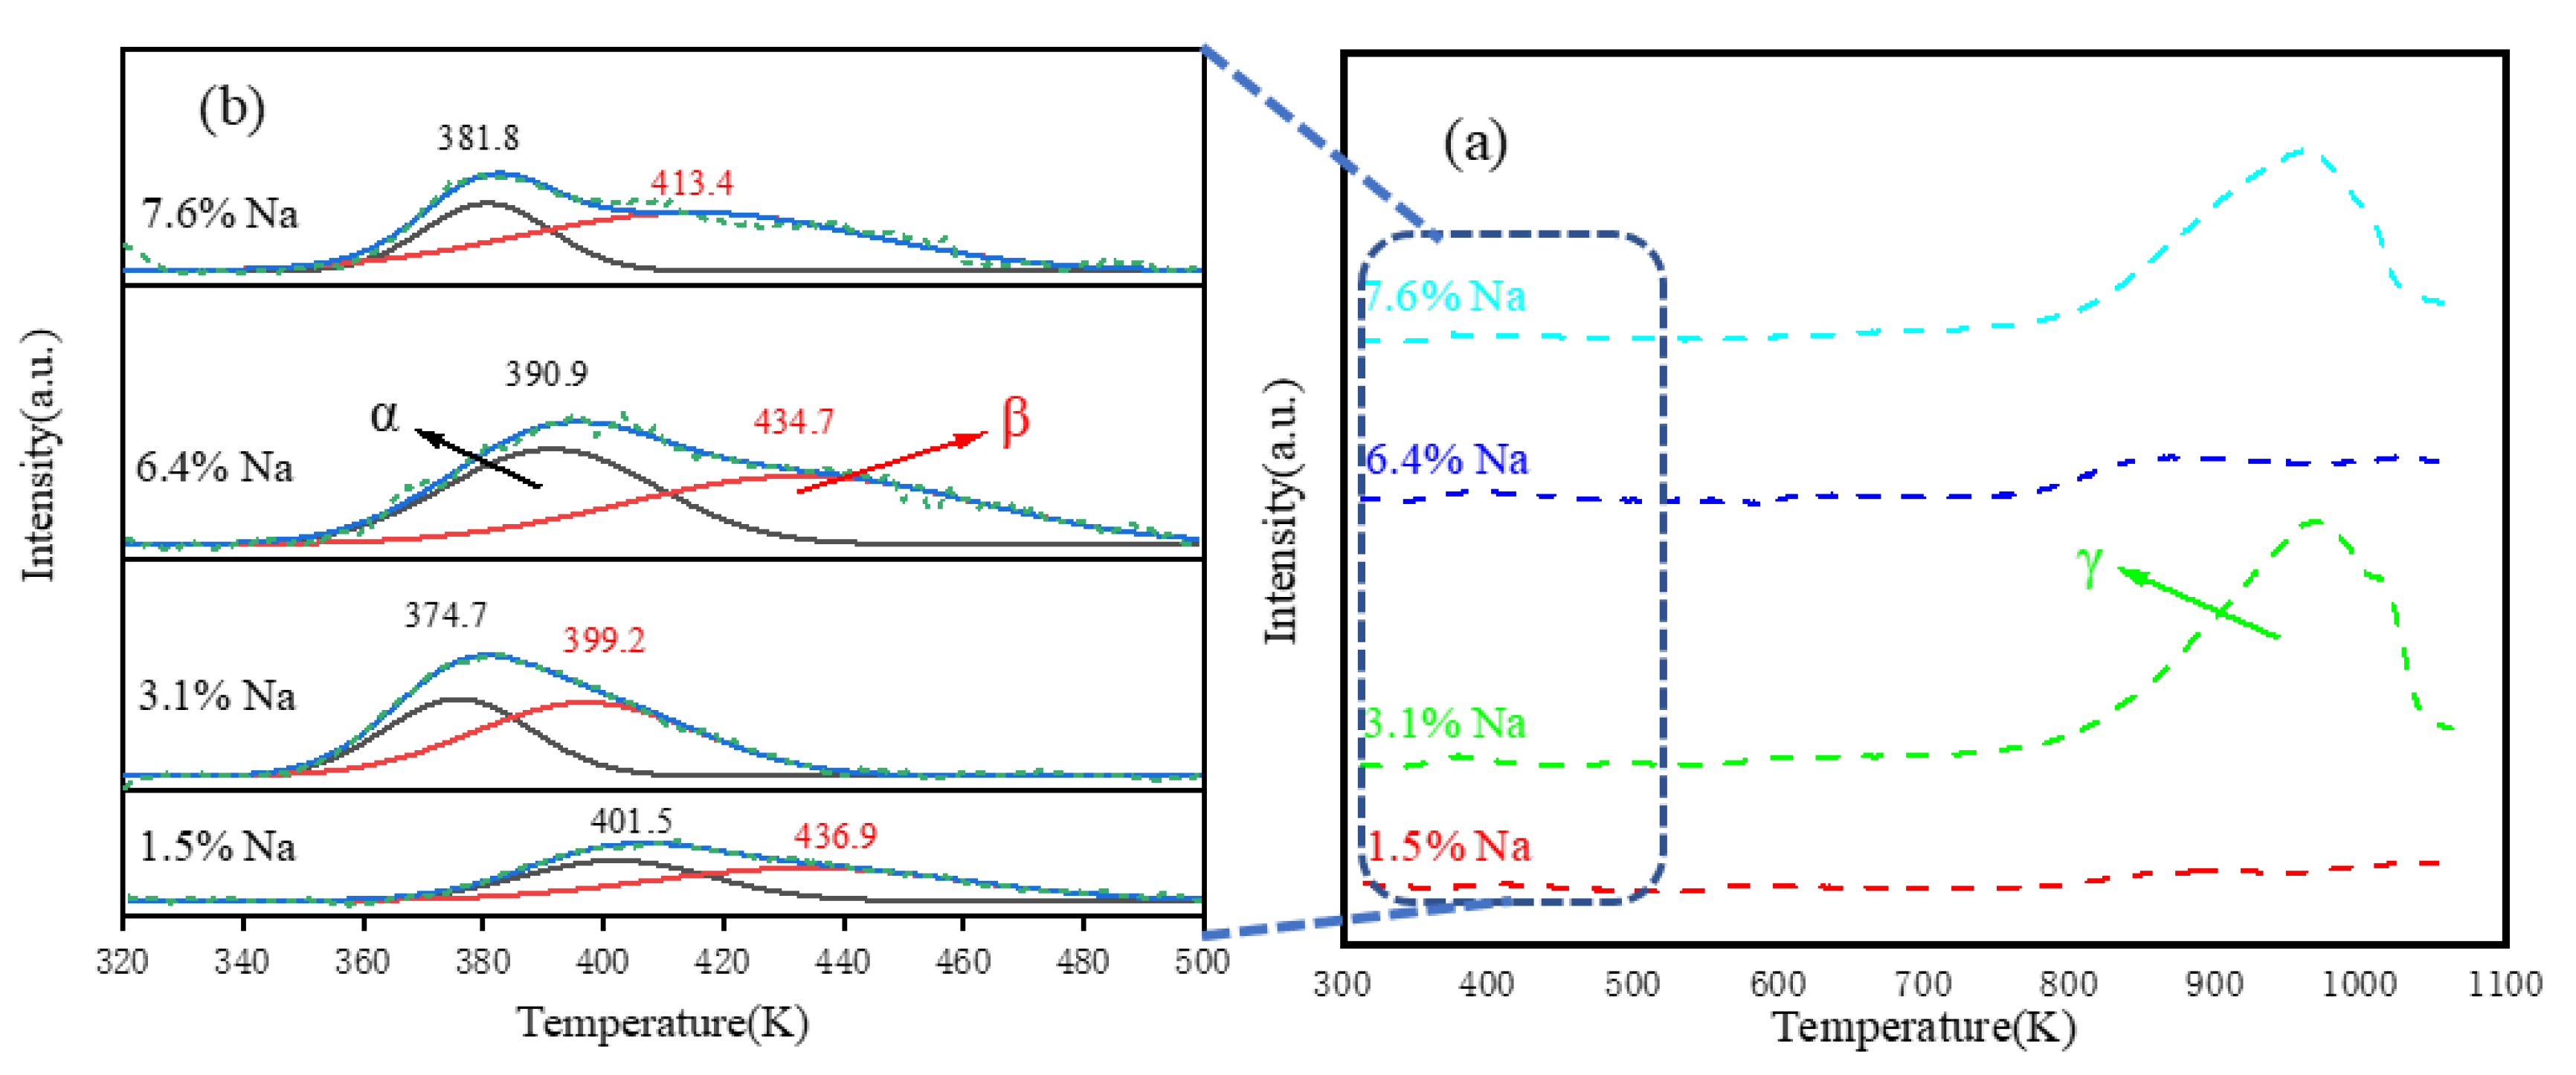
Figure 7.
Effect of different Na content on final catalytic performance.
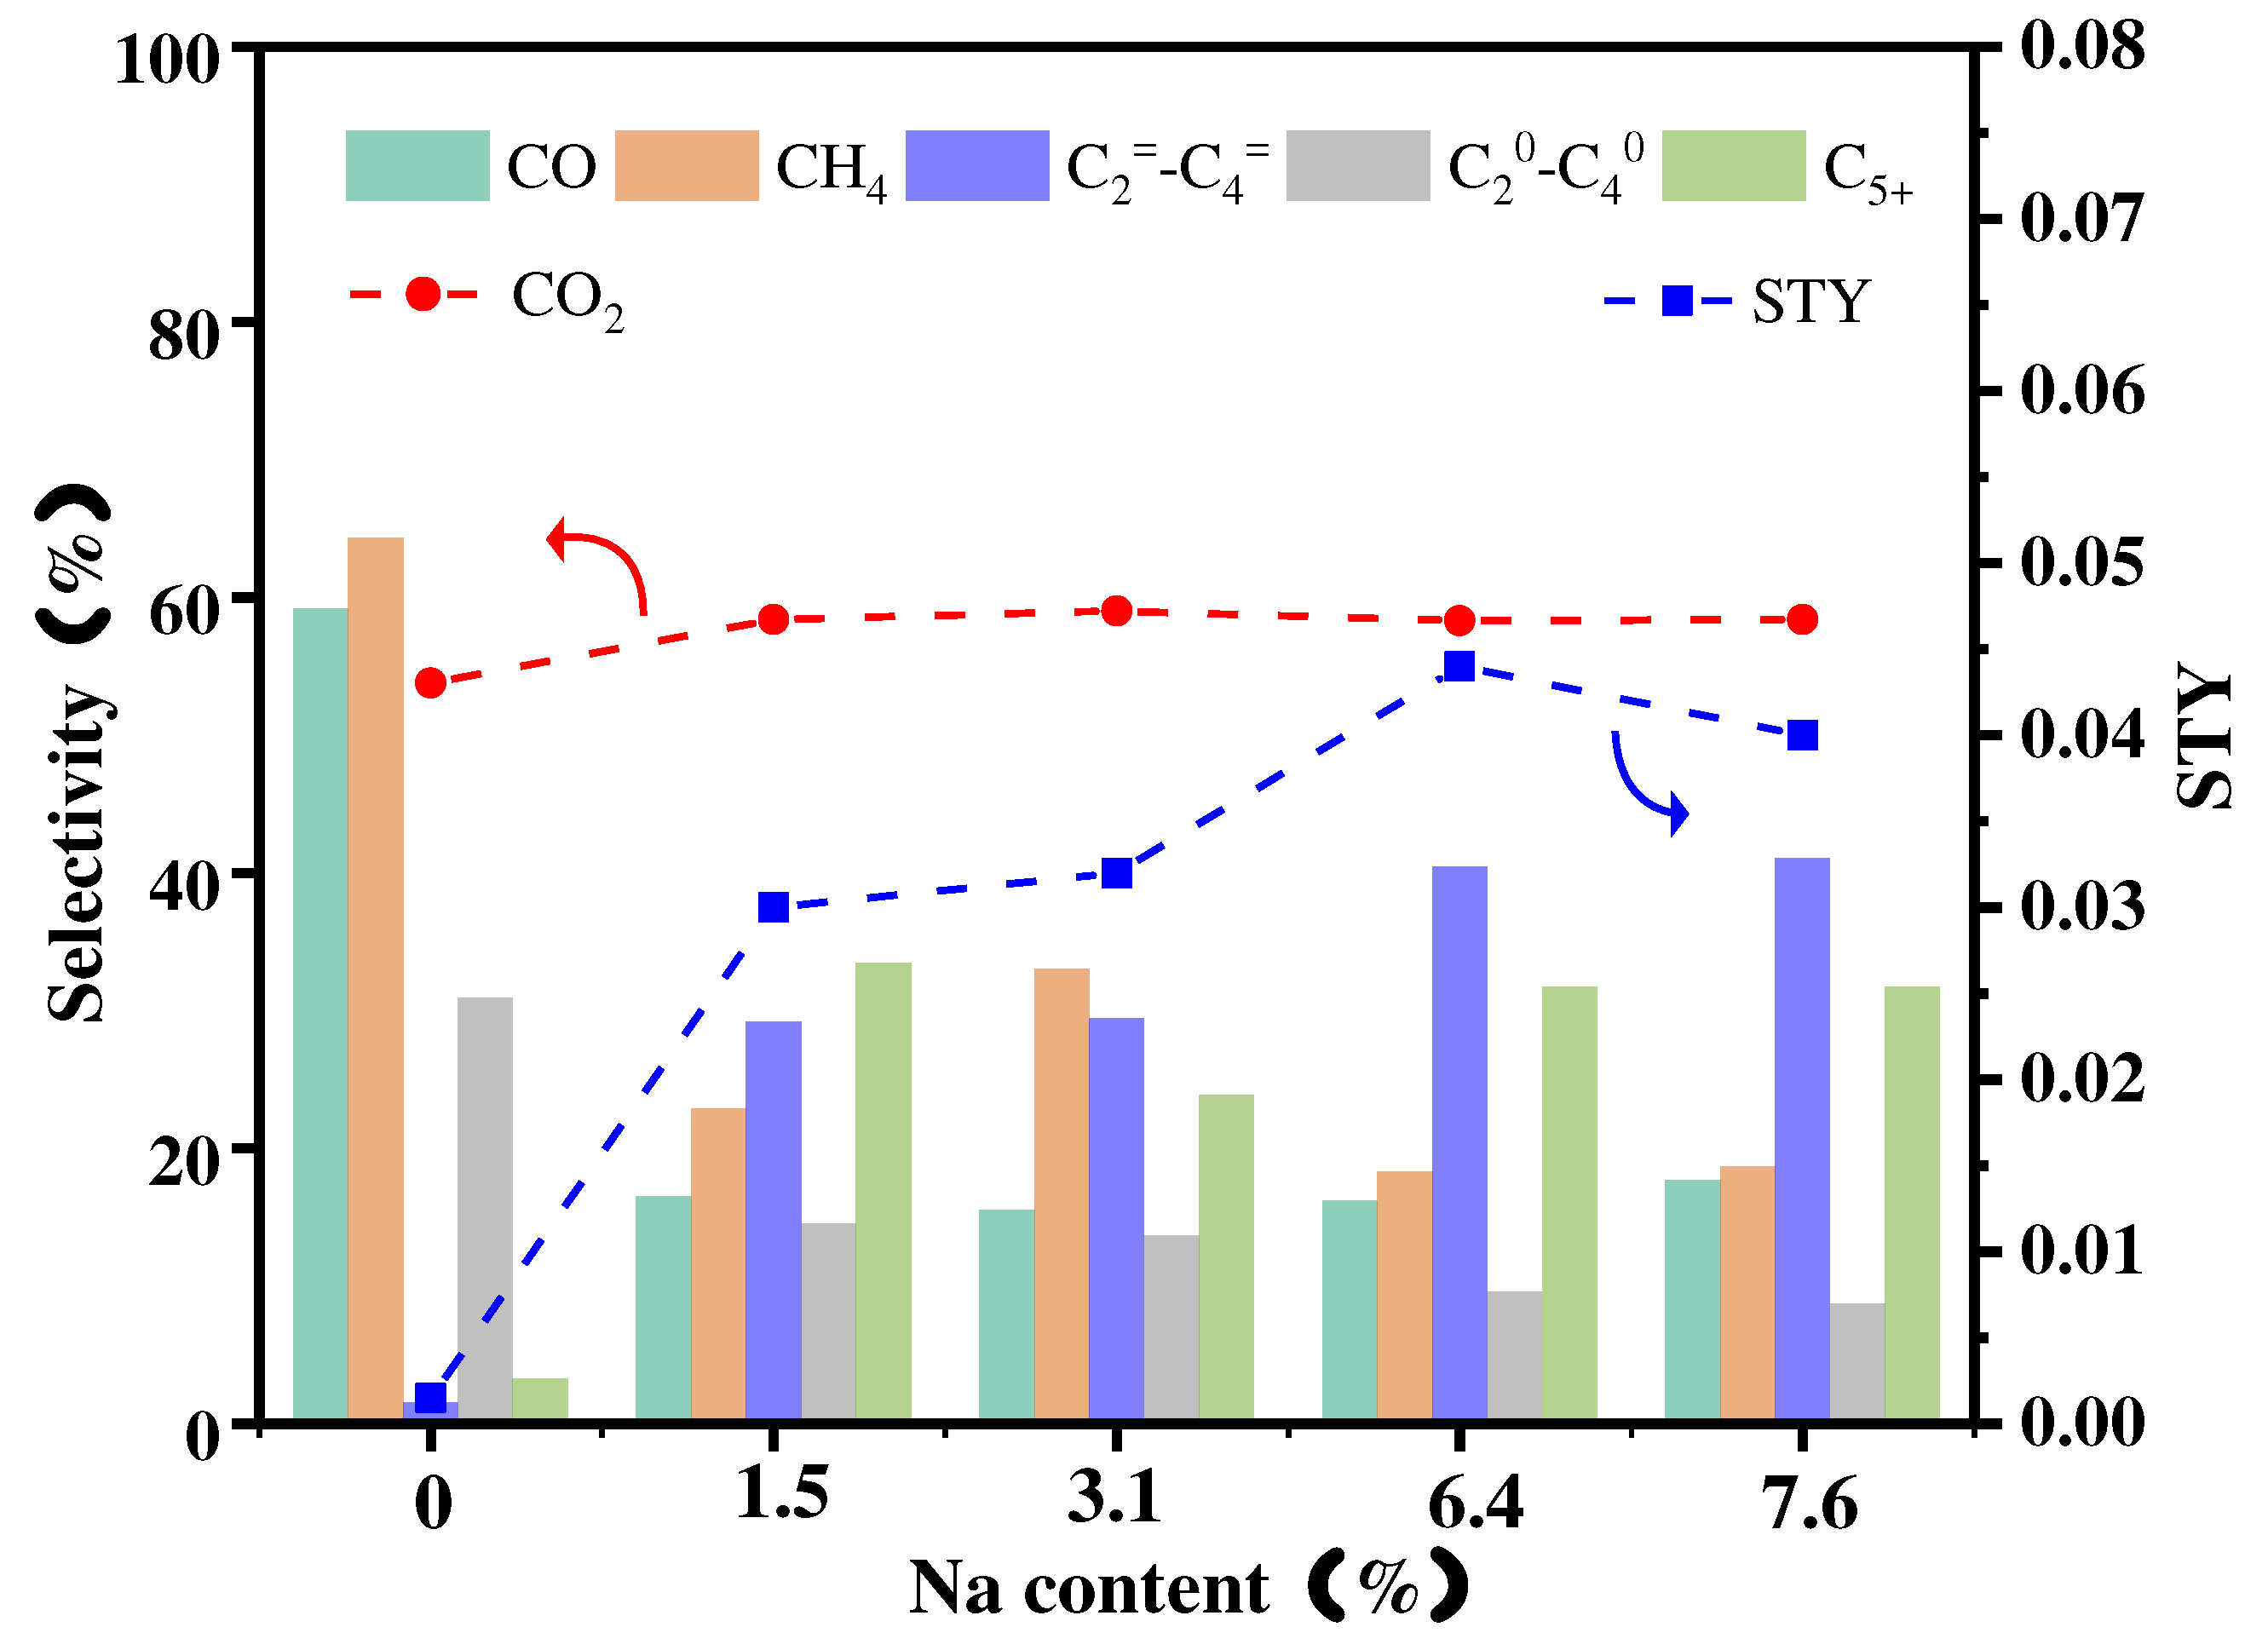
Figure 8.
XRD pattern of the spent sample-FeZnNa6.4@SiO2-C.
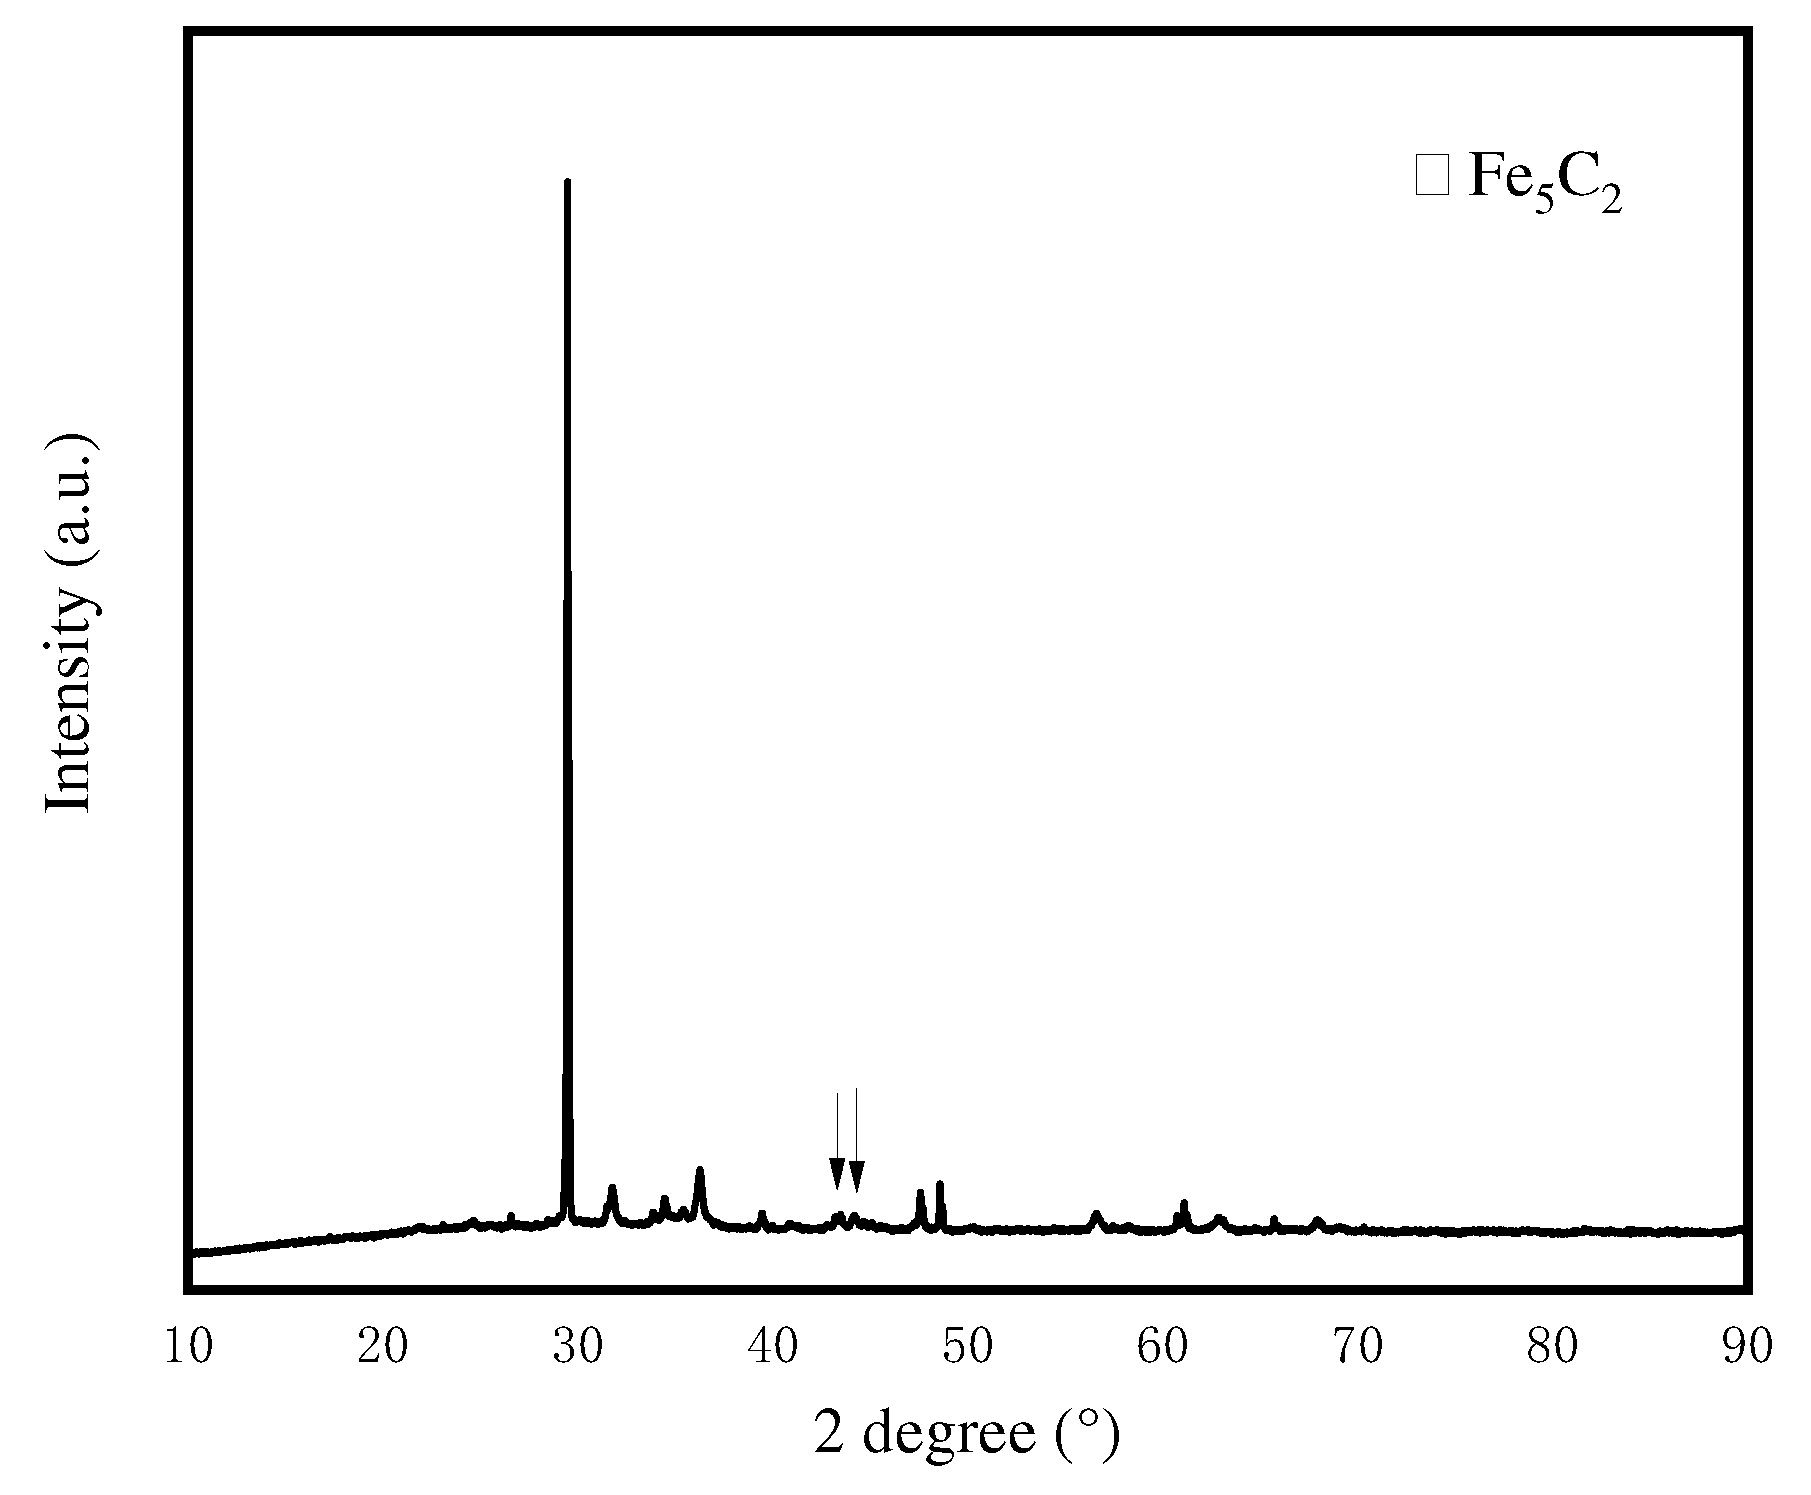
Figure 9.
TEM images of the spent sample-FeZnNa6.4@SiO2-C.
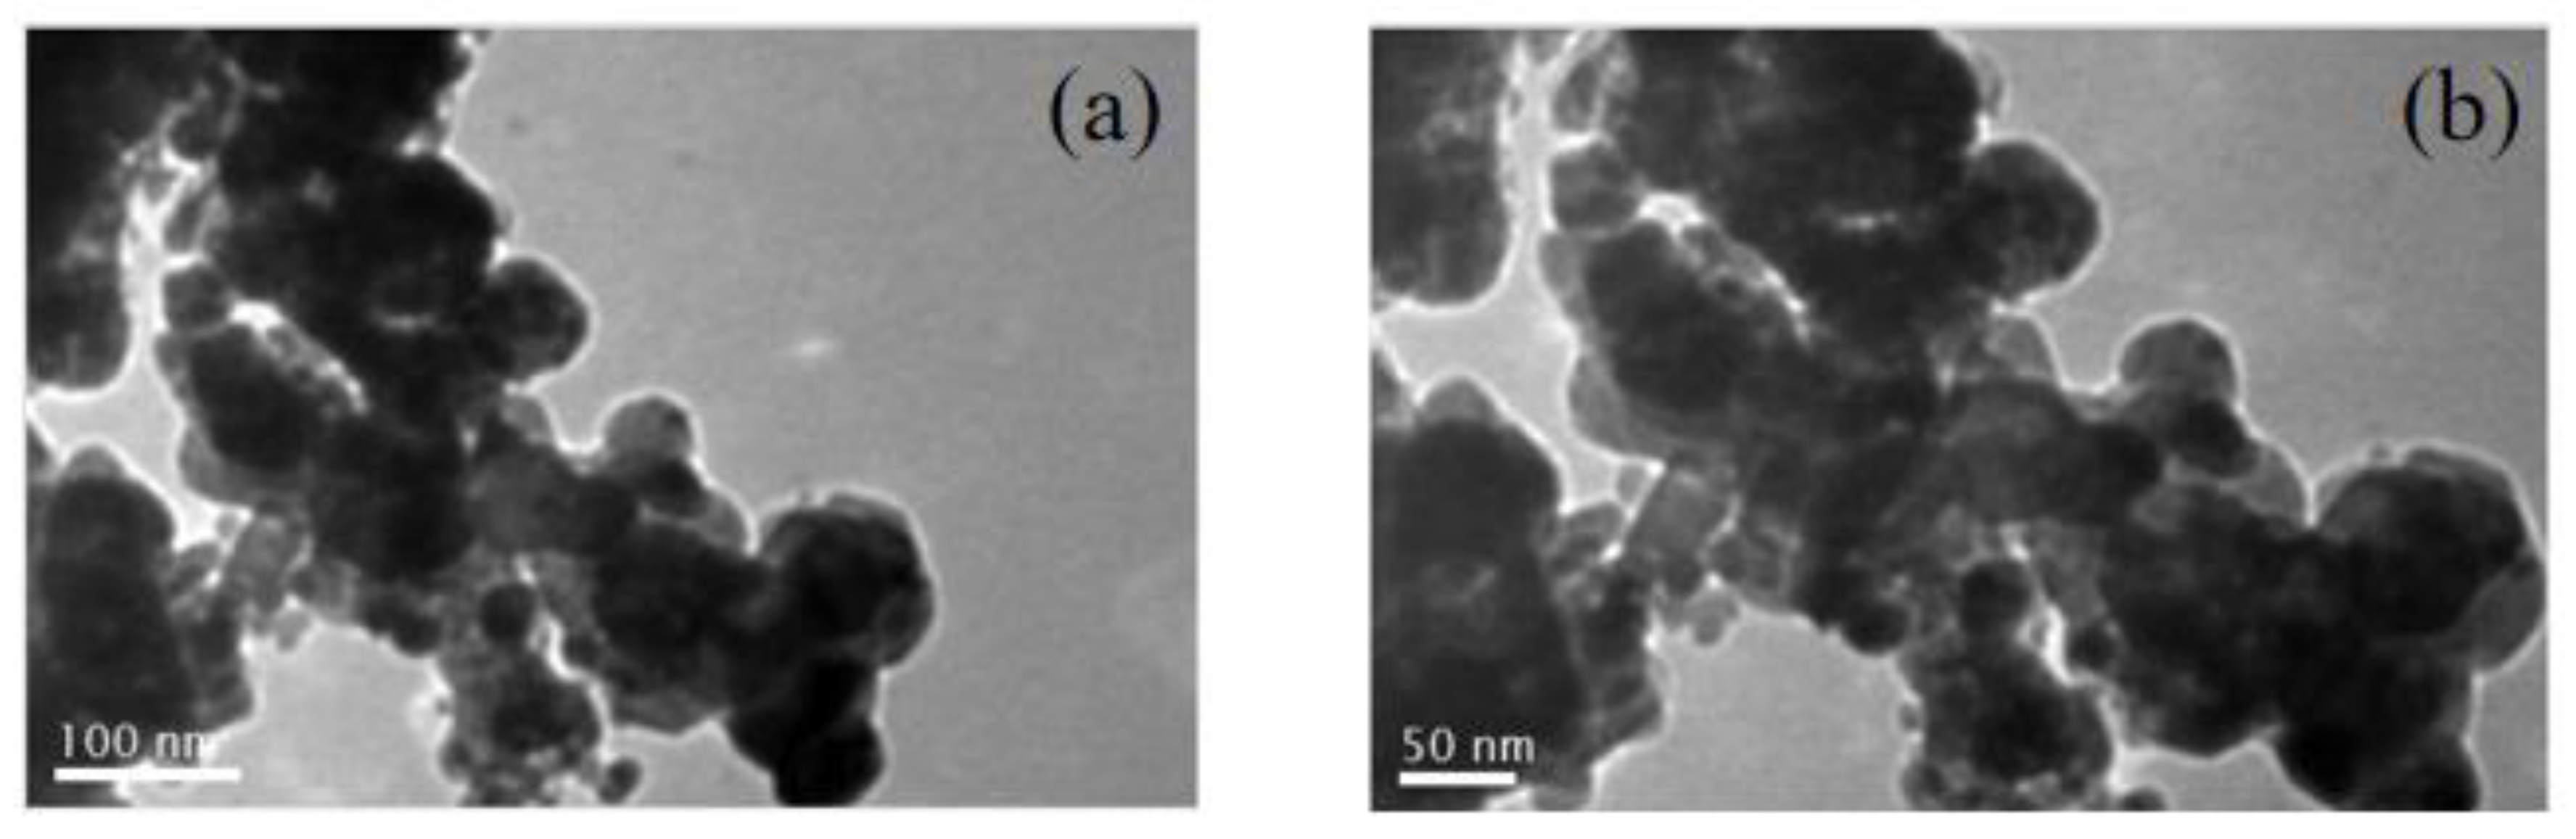
Figure 10.
The image of 100-hour working condition and the selectivity of C2=-C4=.
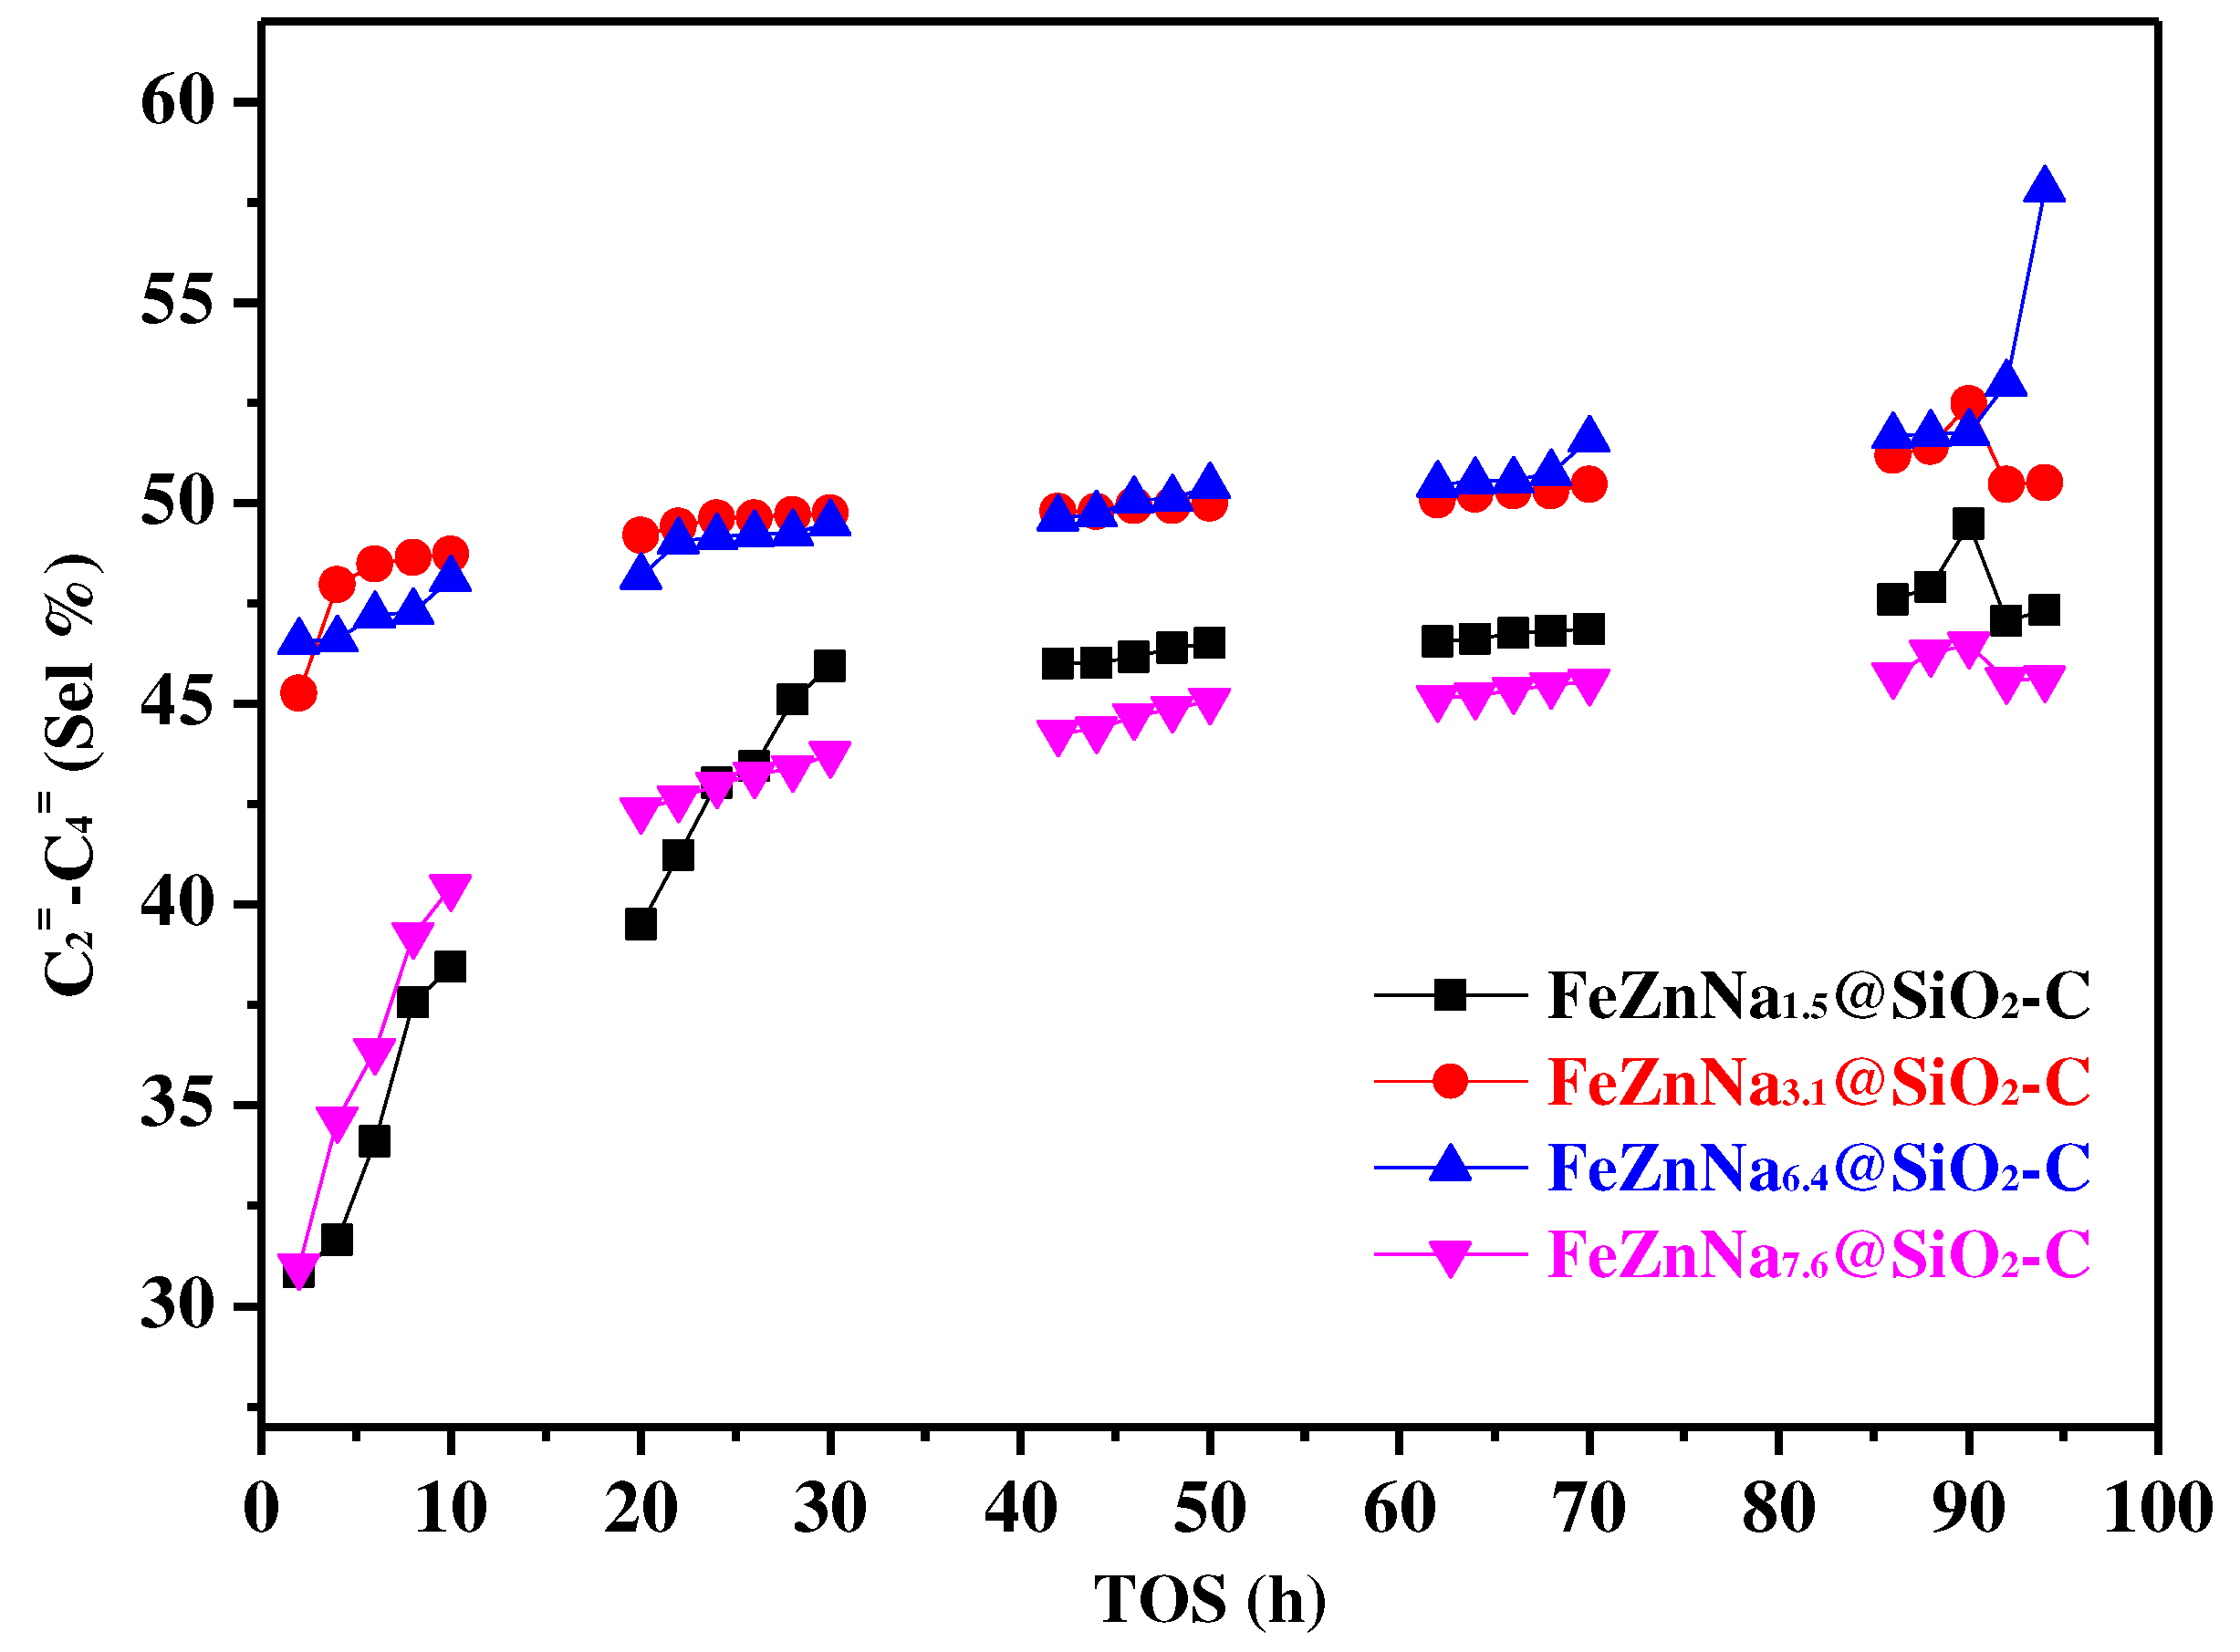
Table 1.
Physicochemical characteristics of the Fe@SiO2-C, FeNa@SiO2-C and FeZnNax@SiO2-GC catalysts.
Table 1.
Physicochemical characteristics of the Fe@SiO2-C, FeNa@SiO2-C and FeZnNax@SiO2-GC catalysts.
| Catalyst | Fe2O3 size(nm)a | ZnO size(nm)a | SSA(m2/g)b |
|---|---|---|---|
| Fe@SiO2-C | 23.69 | / | 75.579 |
| FeZn@SiO2-C | 15.65 | 28.38 | 48.519 |
| FeNa@SiO2-C | 33.85 | / | 78.41 |
| FeZnNa1.5@SiO2-C | 21.20 | 36.14 | 9.261 |
| FeZnNa3.1@SiO2-C | 23.36 | 26.03 | 16.427 |
| FeZnNa6.4@SiO2-C | 16.89 | 23.08 | 20.572 |
| FeZnNa7.6@SiO2-C | 18.53 | 28.38 | 14.691 |
a measured by XRD patterns; b measured by N2 physical adsorption.
Table 4.
Comparison of CO2 hydrogenation Catalytic Performances: STY, selectivity of CH4, C2-C4 olefins (C2=-C4=), C2-C4 paraffins (C20-C40) and C5+ hydrocarbon.
Table 4.
Comparison of CO2 hydrogenation Catalytic Performances: STY, selectivity of CH4, C2-C4 olefins (C2=-C4=), C2-C4 paraffins (C20-C40) and C5+ hydrocarbon.
| Catalyst | CH4 Sel(%) |
C2=-C4= Sel(%) |
C20-C40 Sel(%) |
C5+ Sel(%) |
STY |
|---|---|---|---|---|---|
| Fe@SiO2-C | 83.06 | 5.93 | 5.59 | 5.45 | 0.0057 |
| FeZn@SiO2-C | 64.32 | 1.54 | 30.87 | 3.29 | 0.0015 |
| FeNa@SiO2-C | 66.56 | 6.48 | 20.23 | 8.33 | 0.0090 |
| FeZnNa(1.5%)@SiO2-C | 22.89 | 29.15 | 14.50 | 33.42 | 0.0315 |
| FeZnNa(3.1%)@SiO2-C | 33.00 | 29.40 | 13.67 | 23.83 | 0.0321 |
| FeZnNa(6.4%)@SiO2-C | 18.30 | 40.40 | 9.60 | 31.69 | 0.0436 |
| FeZnNa(7.6%)@SiO2-C | 18.63 | 41.07 | 8.68 | 31.72 | 0.0400 |
Disclaimer/Publisher’s Note: The statements, opinions and data contained in all publications are solely those of the individual author(s) and contributor(s) and not of MDPI and/or the editor(s). MDPI and/or the editor(s) disclaim responsibility for any injury to people or property resulting from any ideas, methods, instructions or products referred to in the content. |
© 2023 by the authors. Licensee MDPI, Basel, Switzerland. This article is an open access article distributed under the terms and conditions of the Creative Commons Attribution (CC BY) license (http://creativecommons.org/licenses/by/4.0/).
Copyright: This open access article is published under a Creative Commons CC BY 4.0 license, which permit the free download, distribution, and reuse, provided that the author and preprint are cited in any reuse.


