Submitted:
18 April 2023
Posted:
19 April 2023
You are already at the latest version
Abstract
Keywords:
1. Introduction
2. Material and Methods
2.1. Broiler Building
2.2. Field Measurements
3. CFD Model
3.1. Geometry, Numerical Model and Boundary Conditions
3.2. Conditions or Configurations Simulated and Boundary Conditions
3.3. Mesh Independence Tests
4. Results and Discussion
4.1. Comparison of Experimental and Numerical Results for NH3 Concentration
4.2. Characterization of Indoor Air Flow for Different Configurations
5. Conclusions
Funding
Acknowledgment
References
- USAD of Agriculture. Livestock and Poultry: World Markets and Trade. USDA Foreign Agricultural Service 2022. https://www.fas.usda.gov/data/livestock-and-poultry-world-markets-and-trade (accessed , 2022). 15 September.
- Anderson K, Moore PA, Martin J, Ashworth AJ. Evaluation of a Novel Poultry Litter Amendment on Greenhouse Gas Emissions. Atmosphere 2021;12:563. [CrossRef]
- Pereira JLS, Ferreira S, Pinheiro V, Trindade H. Ammonia, Nitrous Oxide, Carbon Dioxide and Methane Emissions from Commercial Broiler Houses in Mediterranean Portugal. Water Air Soil Pollut 2018;229:377. [CrossRef]
- S N, Aj K. Ammonia production in poultry houses can affect health of humans, birds, and the environment-techniques for its reduction during poultry production. Environmental Science and Pollution Research International 2018;25. [CrossRef]
- Bittman S, Sheppard SC, Hunt D. Potential for mitigating atmospheric ammonia in Canada. Soil Use and Management 2017;33:263–75. [CrossRef]
- Oliveira MD, Sousa FC, Saraz JO, Calderano AA, Tinôco IFF, Carneiro APS. Ammonia Emission in Poultry Facilities: A Review for Tropical Climate Areas. Atmosphere 2021;12:1091. [CrossRef]
- Berry Lott. Amônia. Avicultura Industrial 2016. https://www.aviculturaindustrial.com.br/imprensa/amonia/20030711-113203-0098 (accessed , 2022). 15 September.
- Broucek, J. Nitrous Oxide Release from Poultry and Pig Housing. Polish Journal of Environmental Studies 2018;27. [CrossRef]
- Anderson Kelsey, Moore Philip Jr. A., Martin Jerry, Ashworth Amanda. Effect of a new manure amendment on ammonia emissions from poultry litter. Atmosphere 2020;257:1–14. [CrossRef]
- Inoue KRA, Tinôco I de FF, Cassuce DC, Bueno MM, Graña AL. ANÁLISE DA CONCENTRAÇÃO DE AMÔNIA EM GALPÕES DE FRANGO DE CORTE SUBMETIDOS A DIFERENTES DIETAS. Revista Engenharia na Agricultura - REVENG 2012;20:19–24. [CrossRef]
- Khan DR, Wecke C, Liebert F. An Elevated Dietary Cysteine to Methionine Ratio Does Not Impact on Dietary Methionine Efficiency and the Derived Optimal Methionine to Lysine Ratio in Diets for Meat Type Chicken. Open Journal of Animal Sciences 2015;5:457–66. [CrossRef]
- Medeiros R, Santos BJM, Freitas M, Silva OA, Alves FF, Ferreira E. A adição de diferentes produtos químicos e o efeito da umidade na volatilização de amônia em cama de frango. Cienc Rural 2008;38:2321–6. [CrossRef]
- Moore, P. Methods of treating manure. Patents Granted 2006.
- Vilela M de O, Gates RS, Souza C de F, Junior CG de ST, Sousa FC. Nitrogen transformation stages into ammonia in broiler production: sources, deposition, transformation and emission to environment. DYNA 2020;87:221–8. [CrossRef]
- Küçüktopcu E, Cemek B, Simsek H, Ni J-Q. Computational Fluid Dynamics Modeling of a Broiler House Microclimate in Summer and Winter. Animals 2022;12:867. [CrossRef]
- Blanes-Vidal V, Guijarro E, Balasch S, Torres AG. Application of computational fluid dynamics to the prediction of airflow in a mechanically ventilated commercial poultry building. Biosystems Engineering 2008;100:105–16. [CrossRef]
- Gonçalves JC, Costa JJ, Figueiredo AR, Lopes AMG. CFD modelling of aerodynamic sealing by vertical and horizontal air curtains. Energy and Buildings 2012;52:153–60. [CrossRef]
- Eva Hilda Guerra Galdo. Evaluación de alternativas en las instalaciones avícolas de pollos de carne para la mejora de las condiciones de confort de los animales. Instituto de Ciencia y Tecnología Animal, Universitat Politècnica de València, 2017.
- Rong L, Nielsen PV, Bjerg B, Zhang G. Summary of best guidelines and validation of CFD modeling in livestock buildings to ensure prediction quality. Computers and Electronics in Agriculture 2016;121:180–90. [CrossRef]
- Iqbal A, Gautam KR, Zhang G, Rong L. Modelling of animal occupied zones in CFD. Biosystems Engineering 2021;204:181–97. [CrossRef]
- Shin H, Kwak Y, Jo S-K, Kim S-H, Huh J-H. Applicability evaluation of a demand-controlled ventilation system in livestock. Computers and Electronics in Agriculture 2022;196:106907. [CrossRef]
- Pakari A, Ghani S. Comparison of different mechanical ventilation systems for dairy cow barns: CFD simulations and field measurements. Computers and Electronics in Agriculture 2021;186:106207. [CrossRef]
- Tong X, Zhao L, Heber AJ, Ni J-Q. Development of a farm-scale, quasi-mechanistic model to estimate ammonia emissions from commercial manure-belt layer houses. Biosystems Engineering 2020;196:67–87. [CrossRef]
- Li H, Rong L, Zong C, Zhang G. A numerical study on forced convective heat transfer of a chicken (model) in horizontal airflow. Biosystems Engineering 2016;150:151–9. [CrossRef]
- Li J, Suvarna M, Li L, Pan L, Pérez-Ramírez J, Ok YS, et al. A review of computational modeling techniques for wet waste valorization: Research trends and future perspectives. Journal of Cleaner Production 2022;367:133025. [CrossRef]
- Osorio Hernandez R, Tinôco I, Mendes L, Guerra Garcia L, Barbari M, Baptista F, et al. CFD modeling of the thermal environment in a negative pressure tunnel ventilated broiler barn during the first week of life. 2015.
- Chepete HJ, Xin H. Heat and Moisture Production of Poultry and Their Housing Systems: Pullets and Layers. ASHRAE Transactions 2004:15.
- Franco A, Valera DL, Peña A, Pérez AM. Aerodynamic analysis and CFD simulation of several cellulose evaporative cooling pads used in Mediterranean greenhouses. Computers and Electronics in Agriculture 2011;76:218–30. [CrossRef]
- Fidaros D, Baxevanou C, Bartzanas T, Kittas C. Numerical study of mechanically ventilated broiler house equipped with evaporative pads. Computers and Electronics in Agriculture 2018;149:101–9. [CrossRef]
- Küçüktopcu E, Cemek B. Evaluating the influence of turbulence models used in computational fluid dynamics for the prediction of airflows inside poultry houses. Biosystems Engineering 2019;183:1–12. [CrossRef]
- Yahav S, Straschnow A, Vax E, Razpakovski V, Shinder D. Air Velocity Alters Broiler Performance Under Harsh Environmental Conditions1. Poultry Science 2001;80:724–6. [CrossRef]
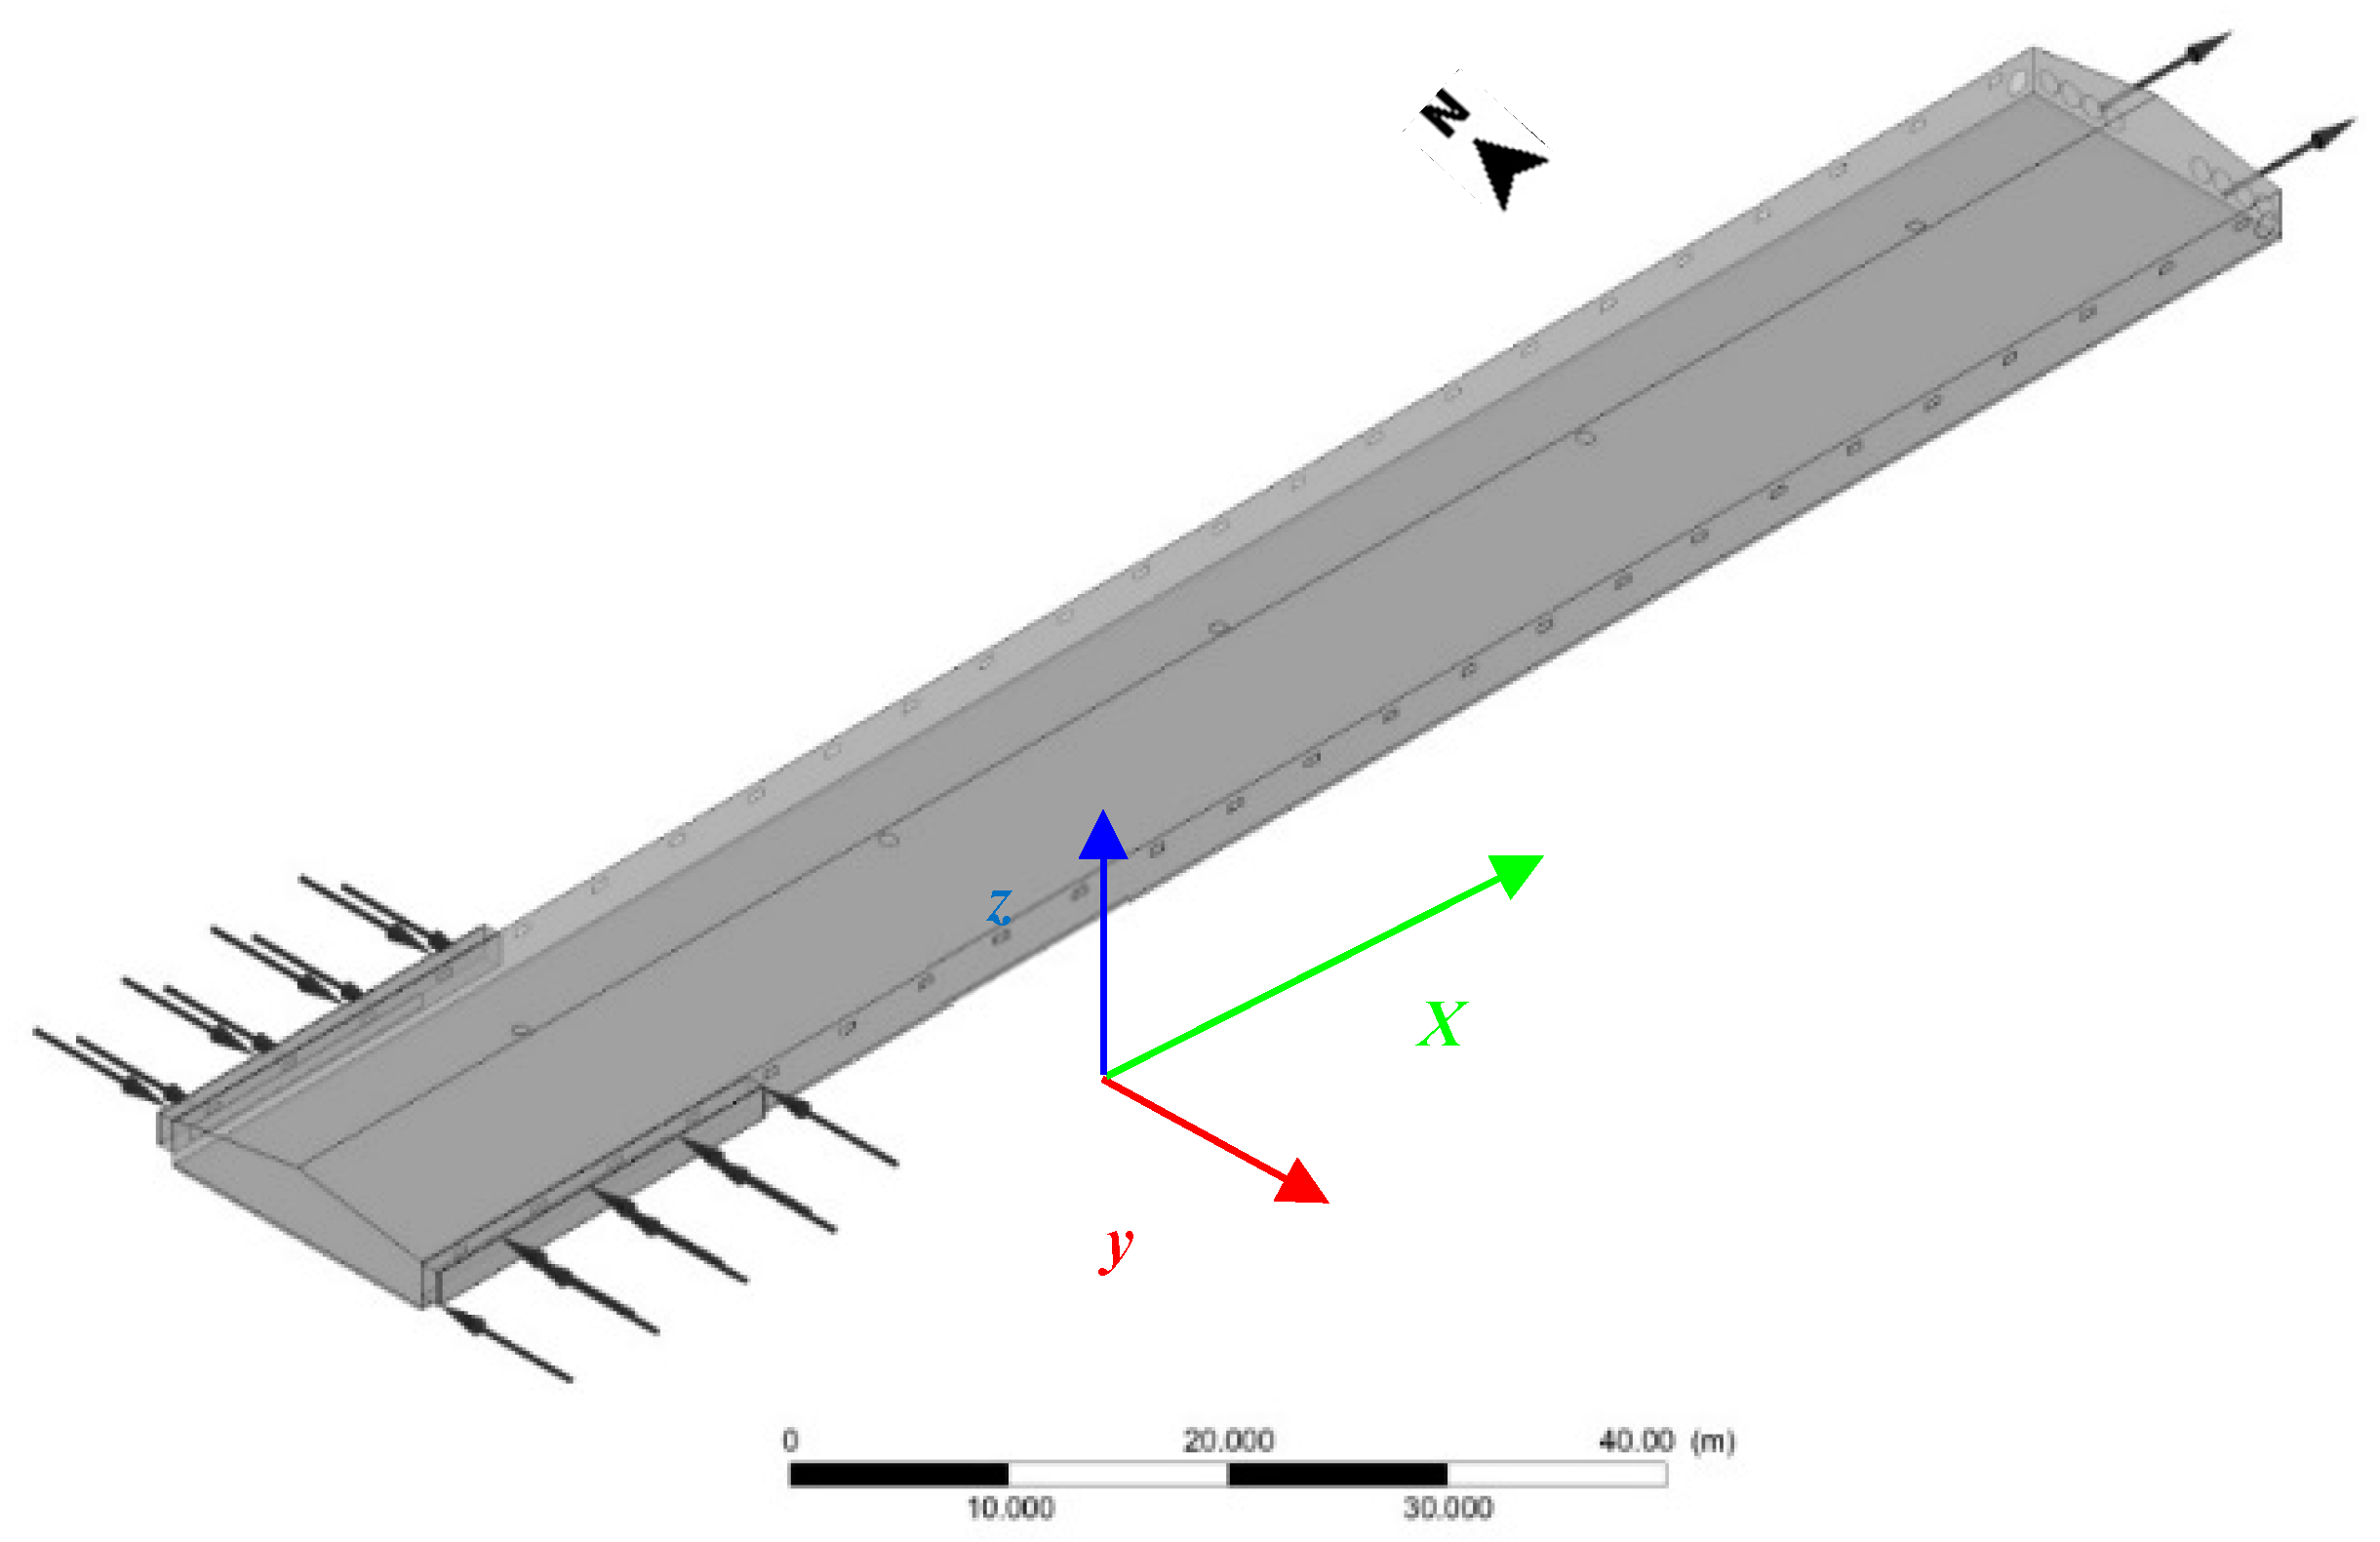

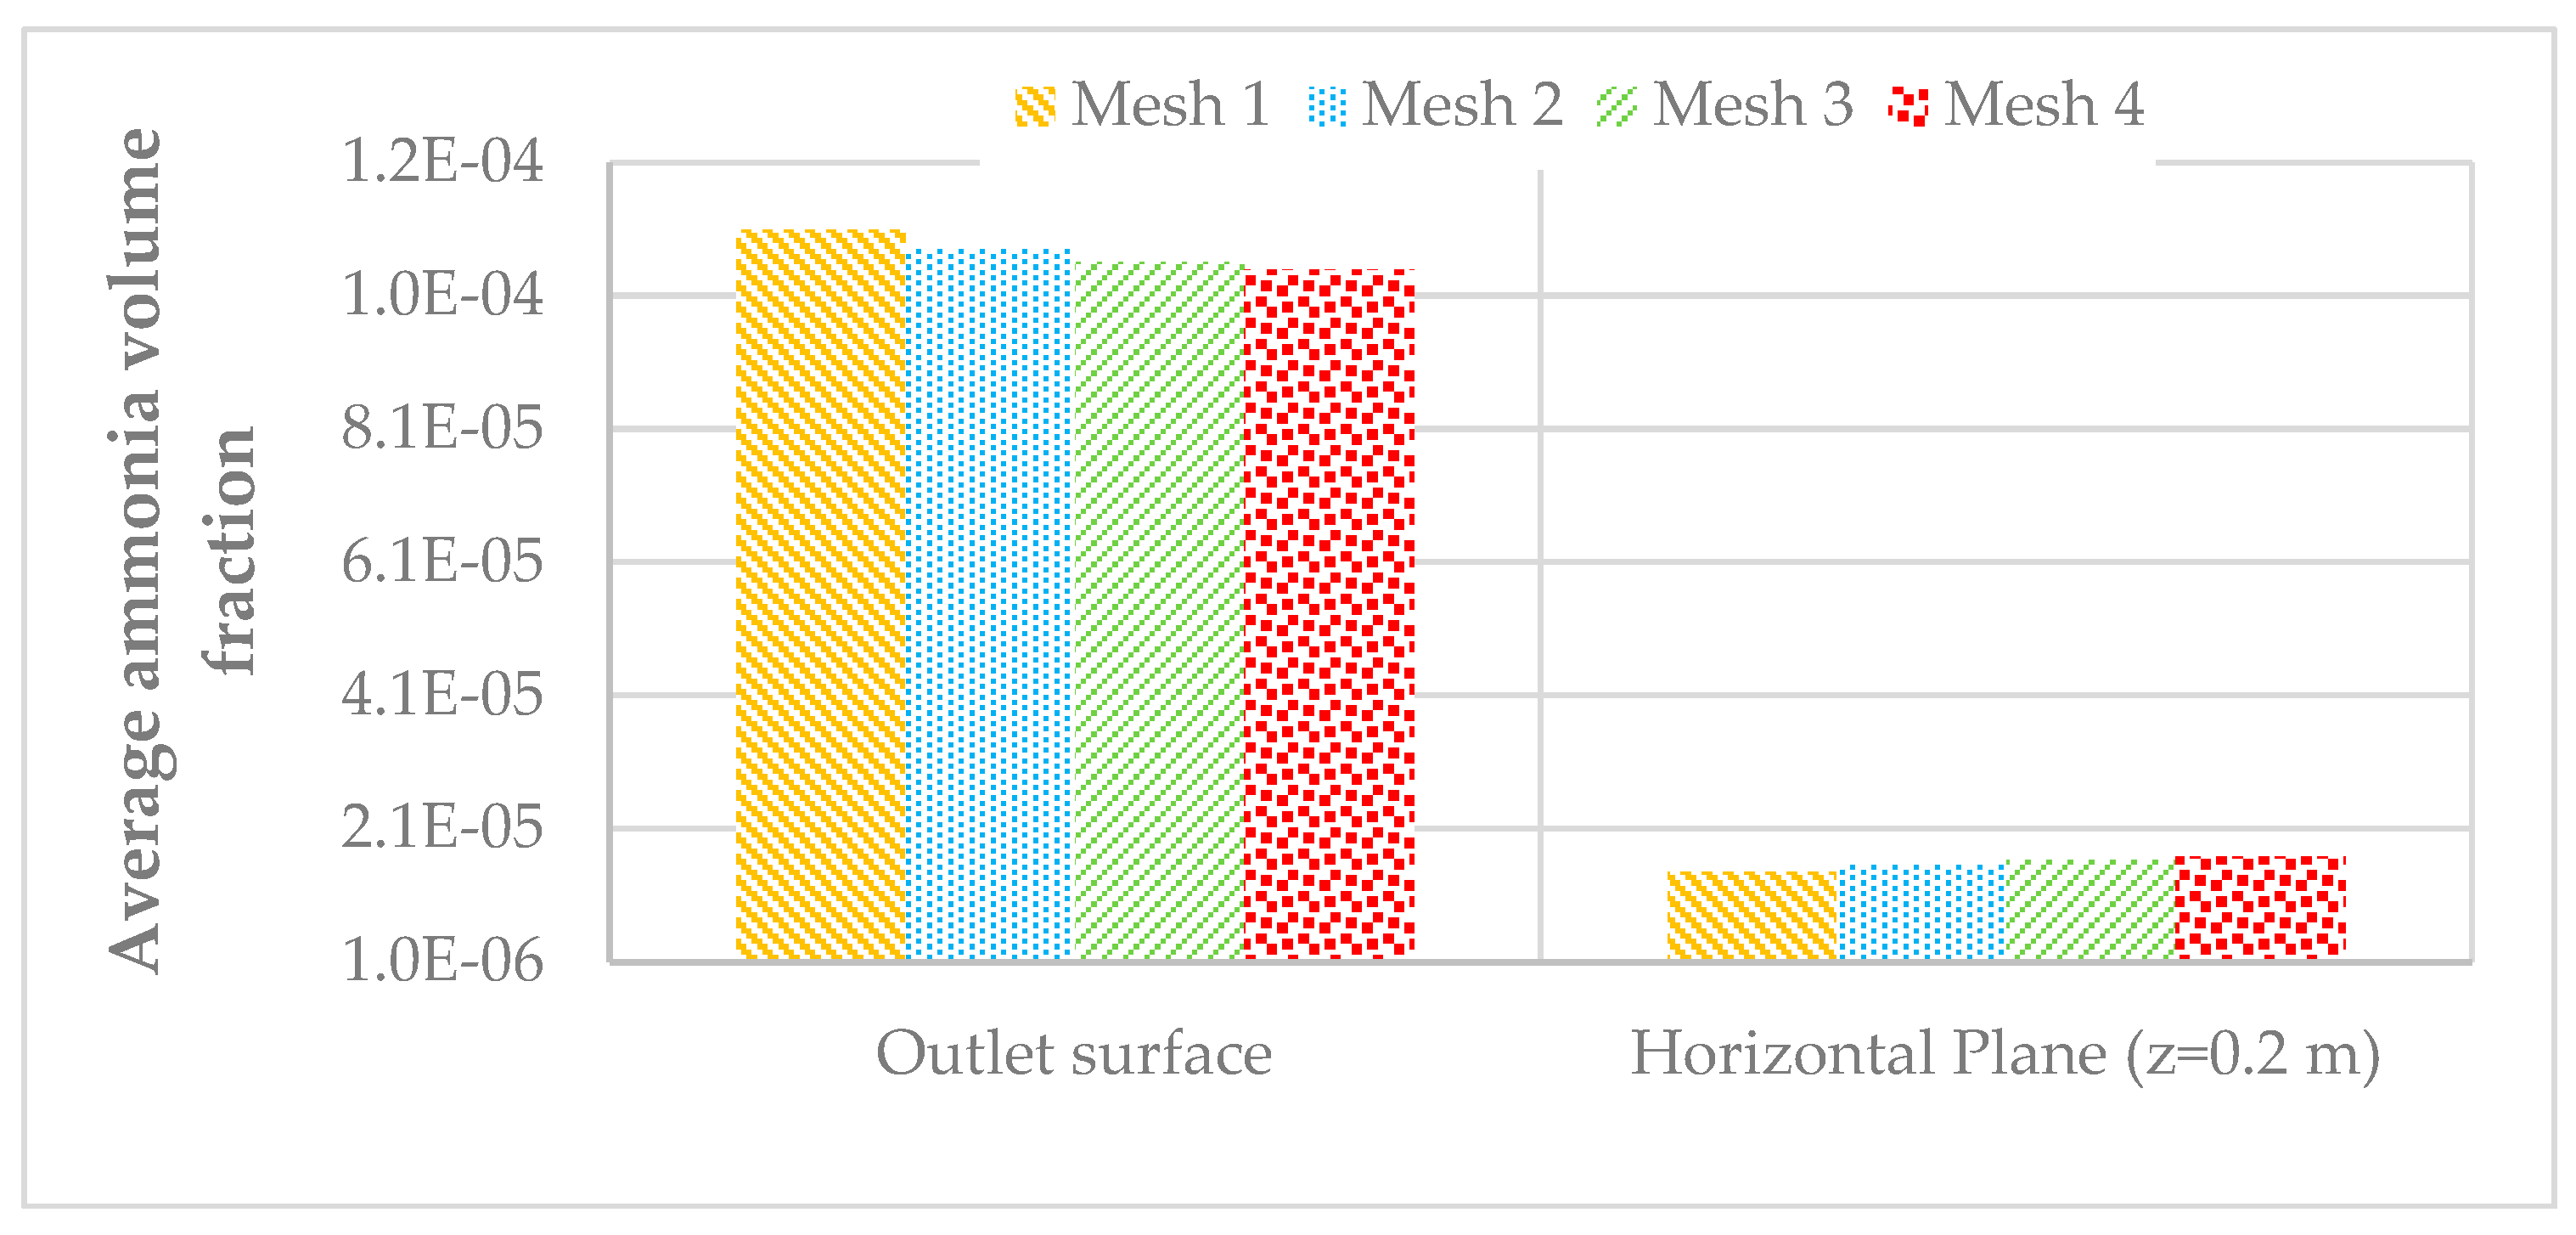
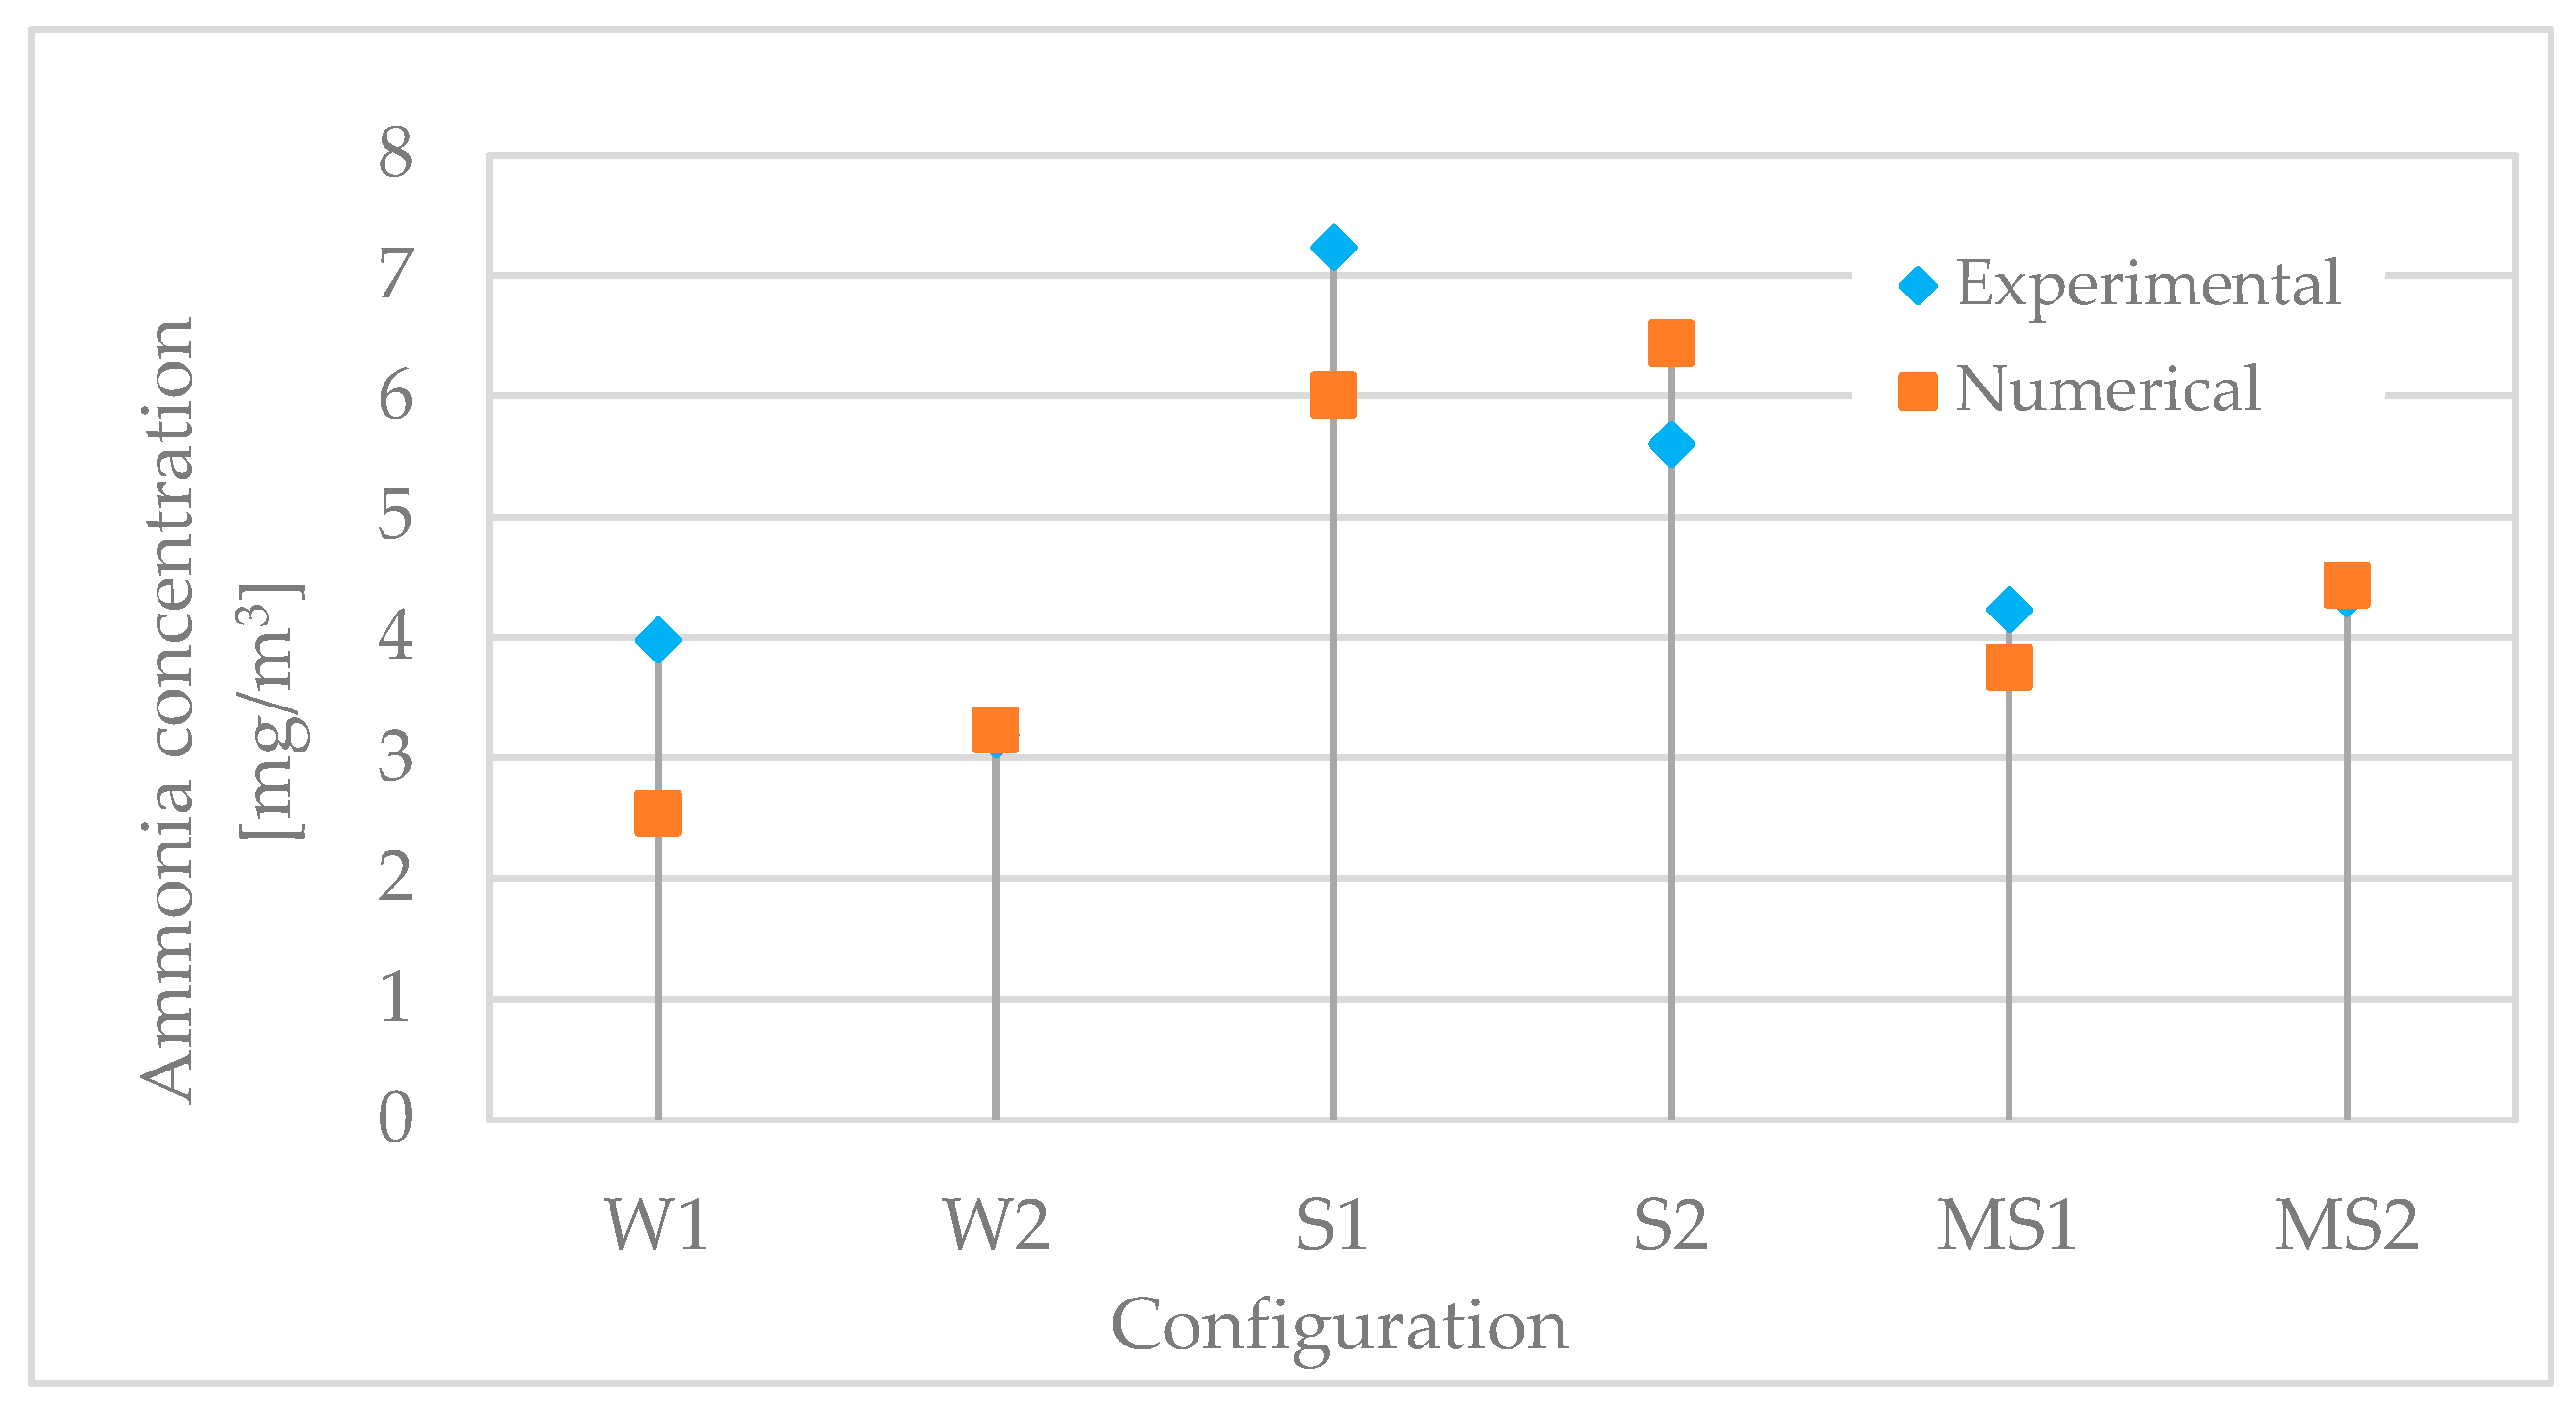
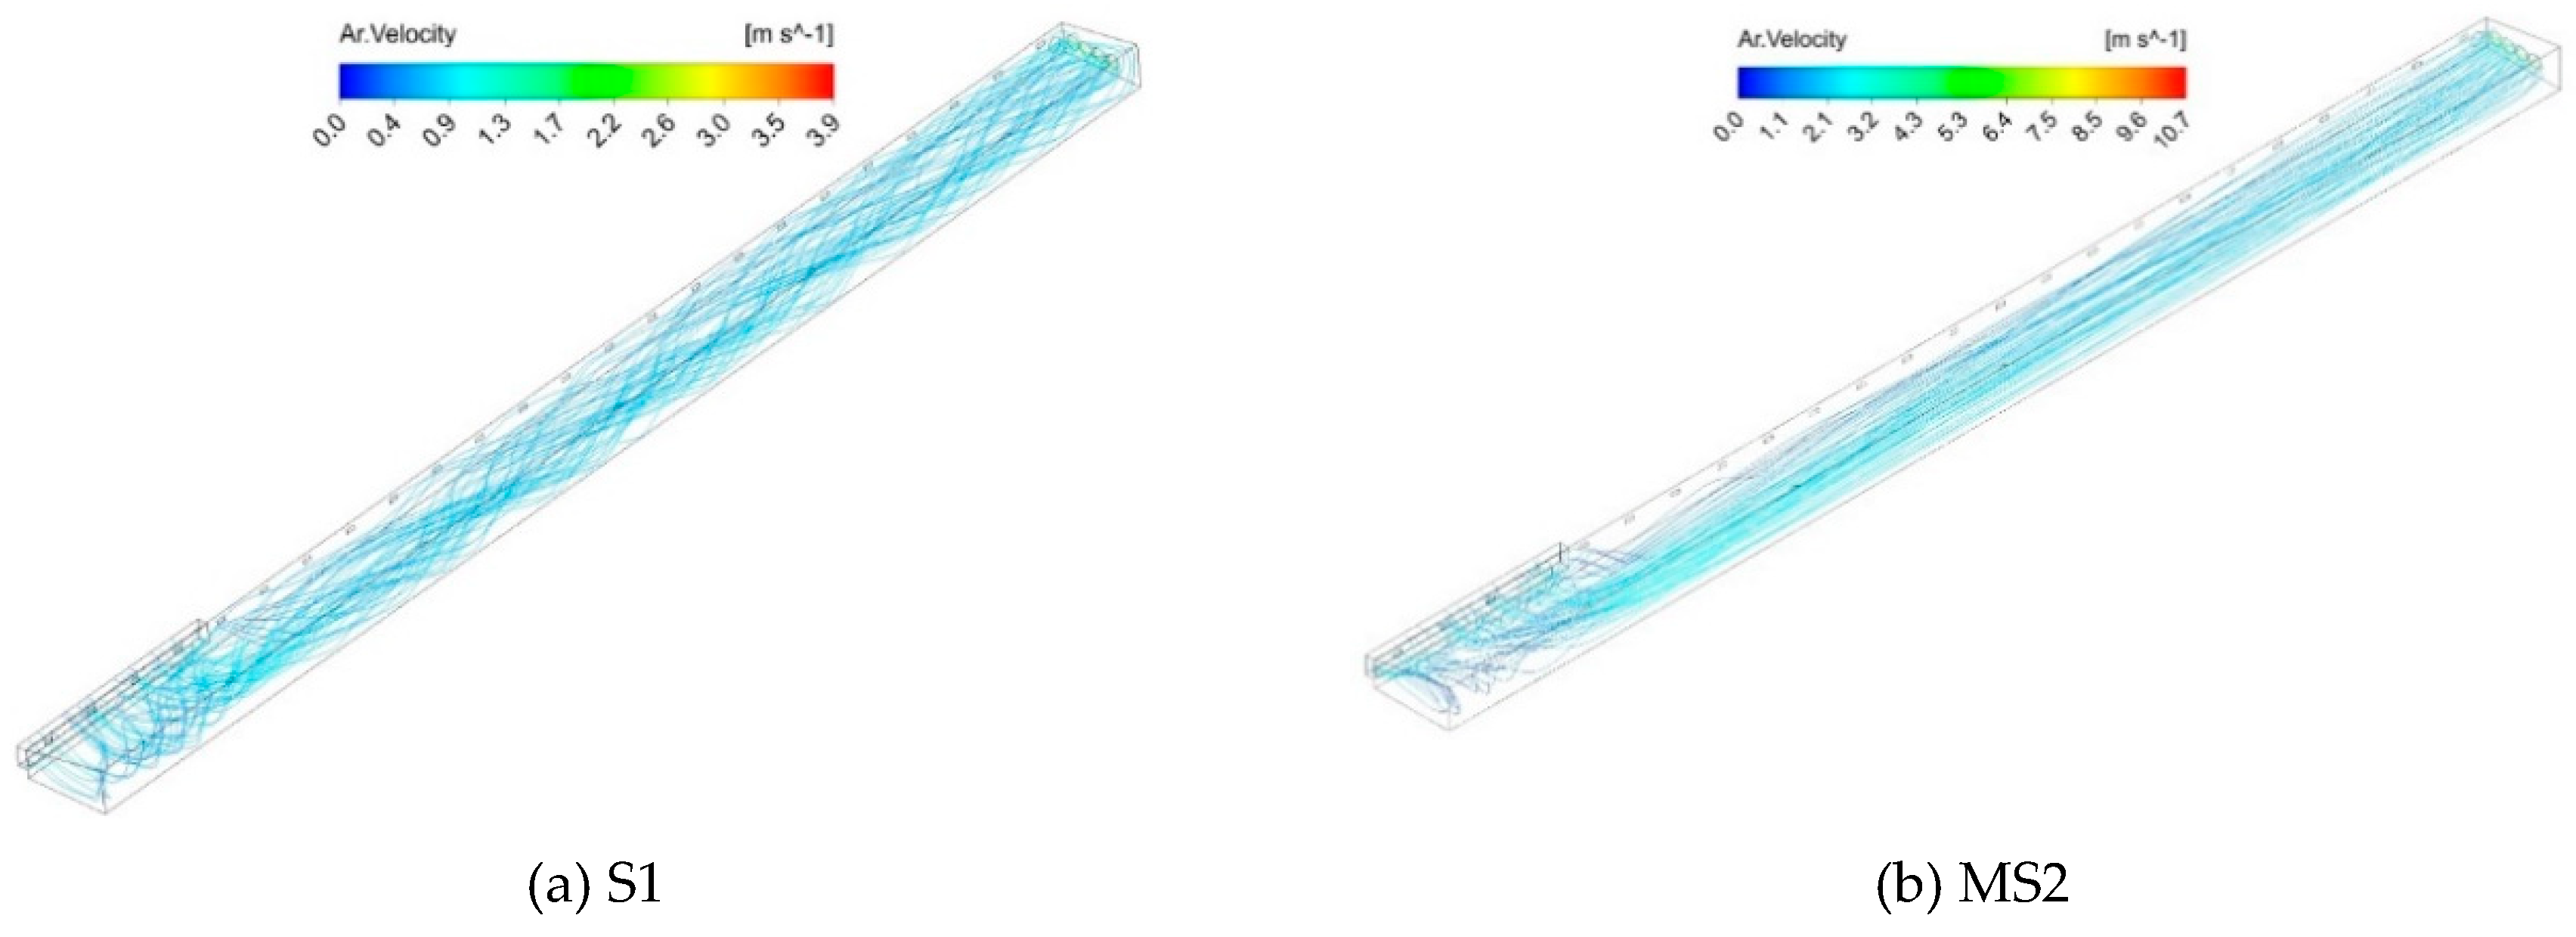

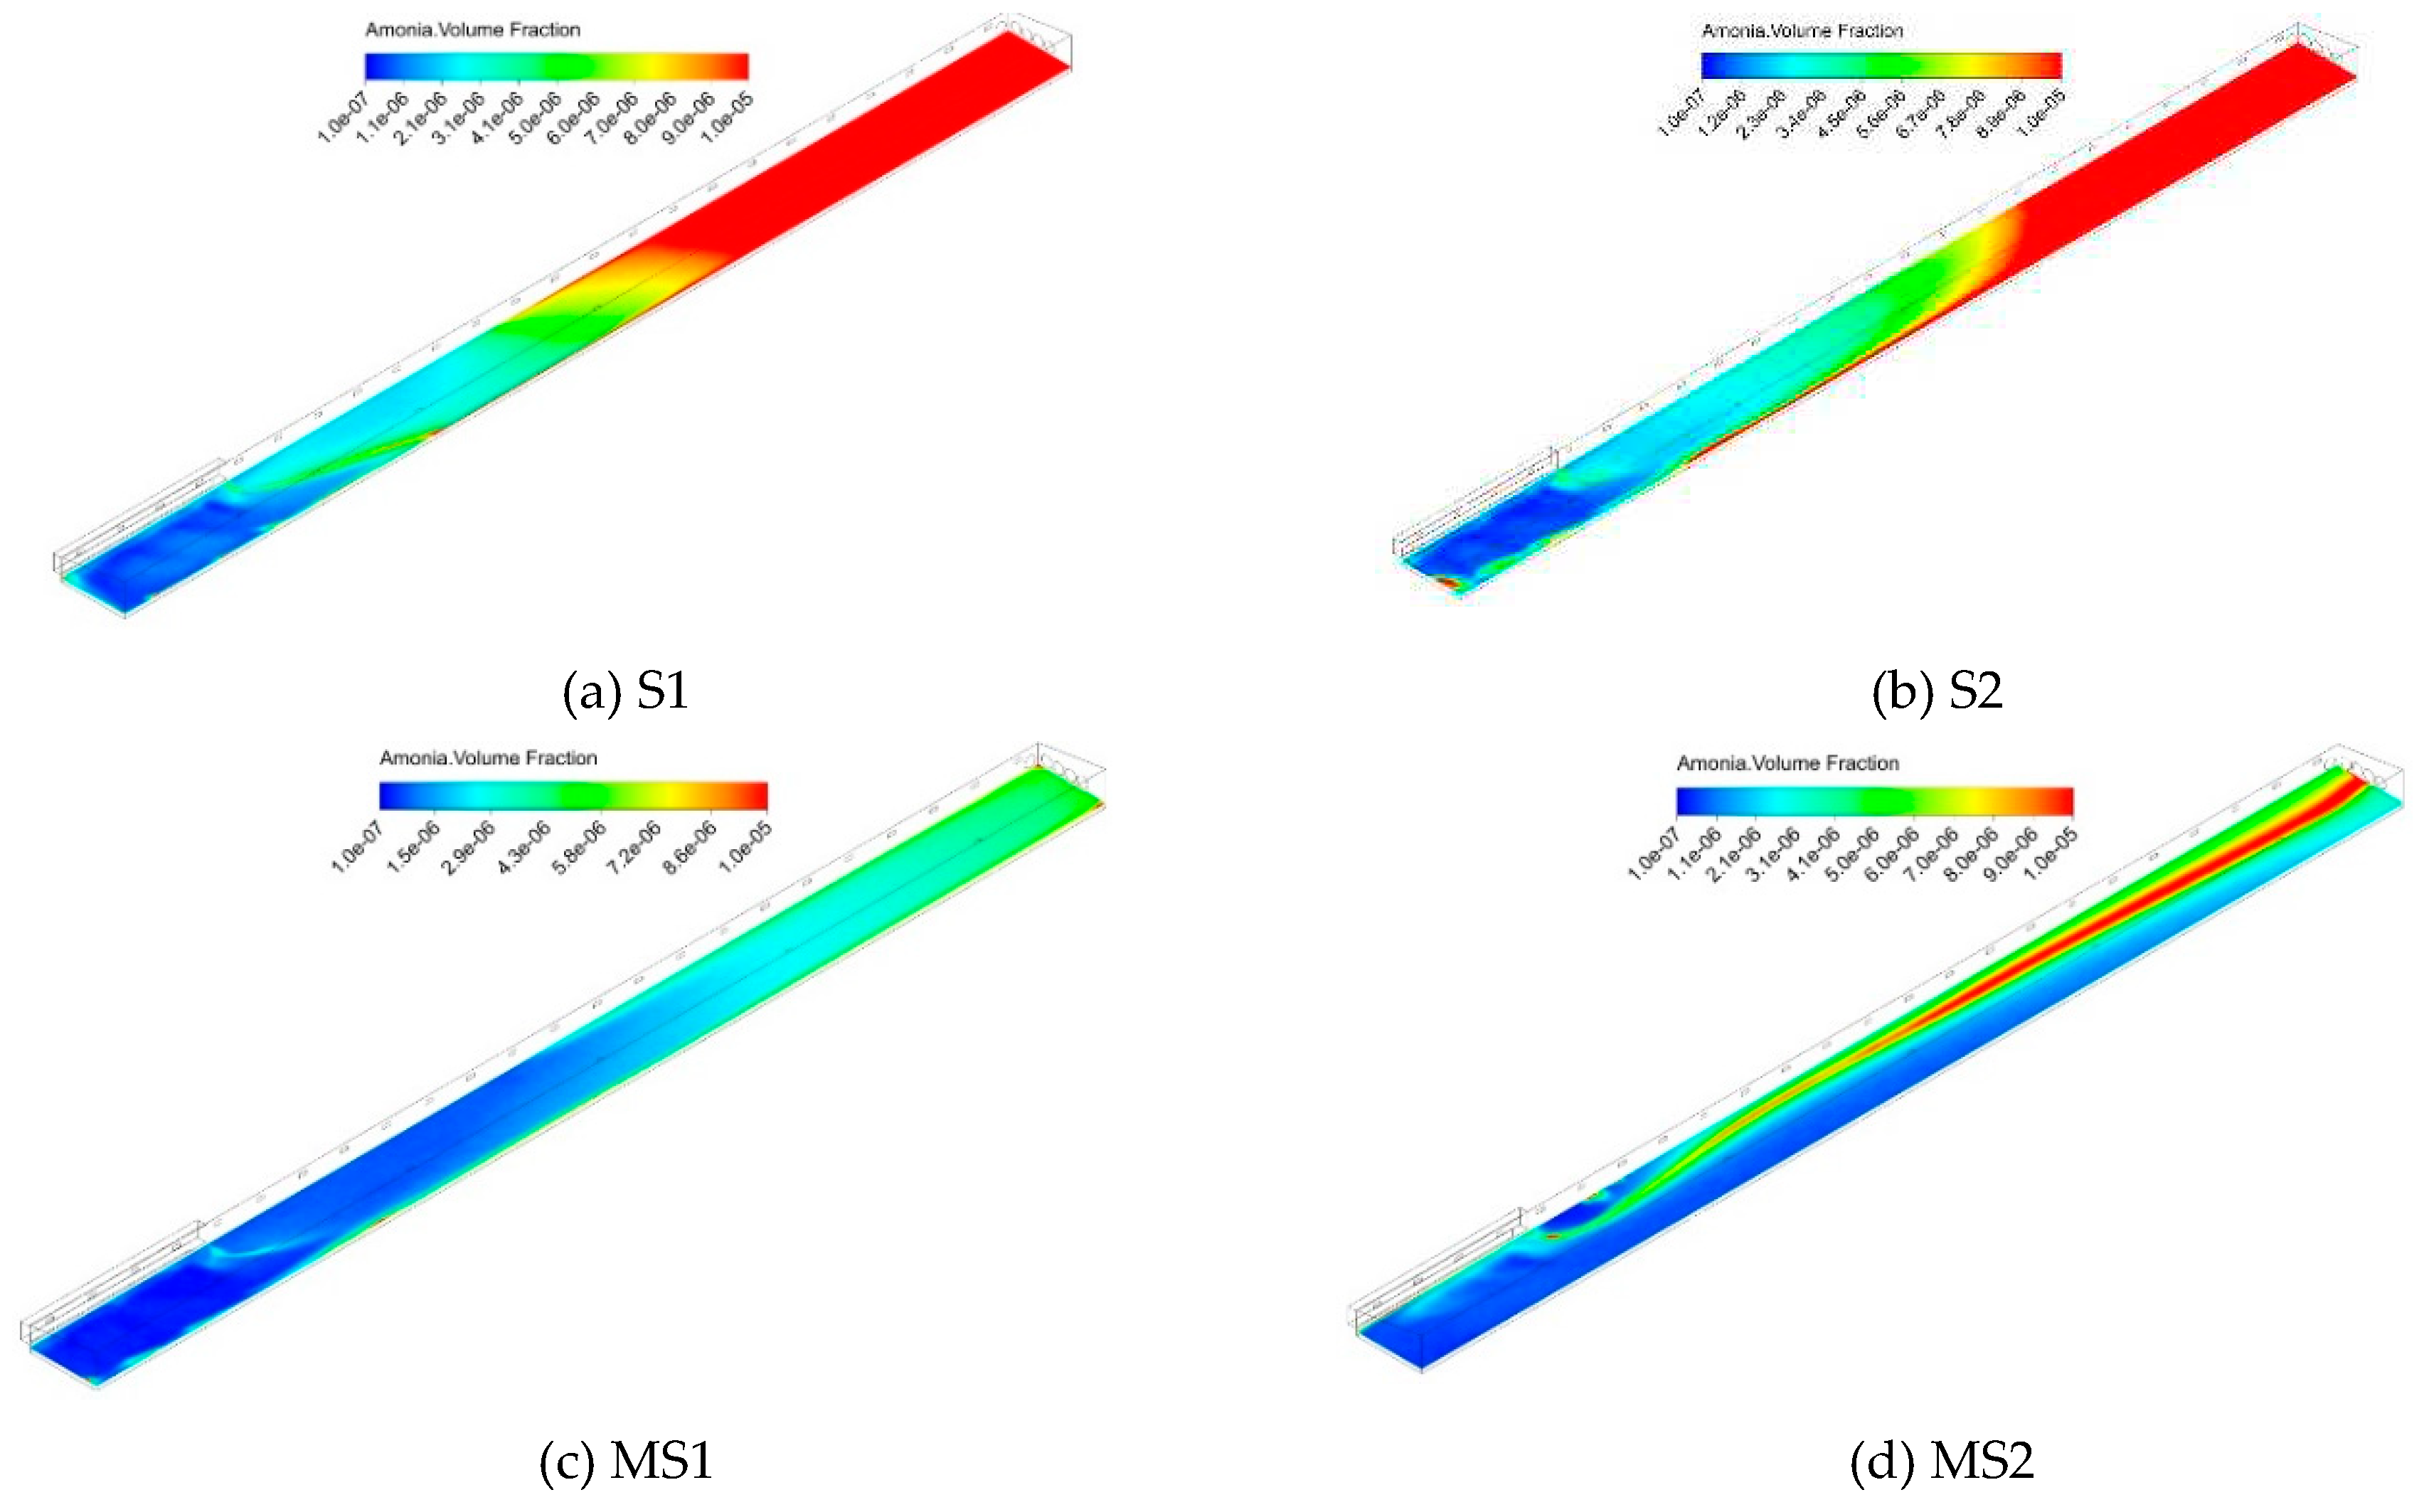
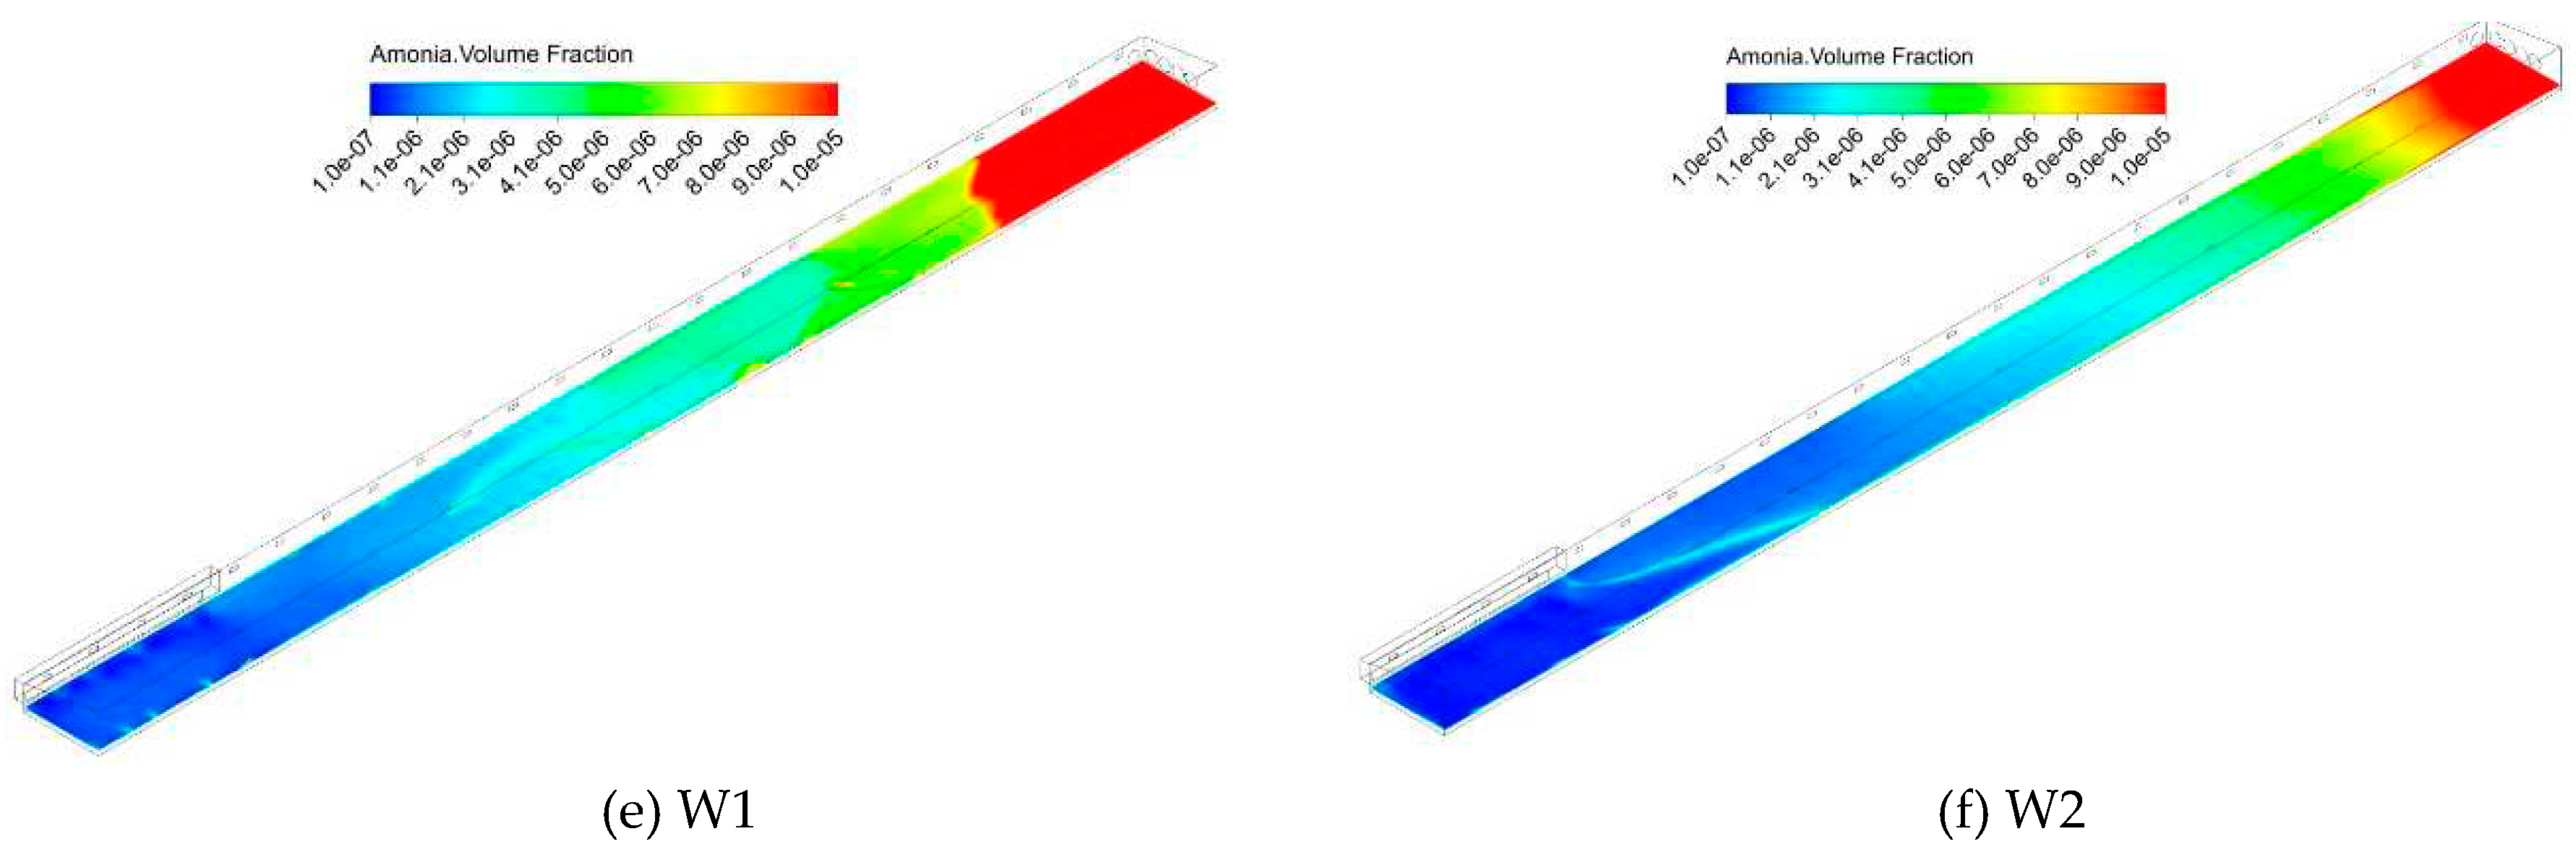
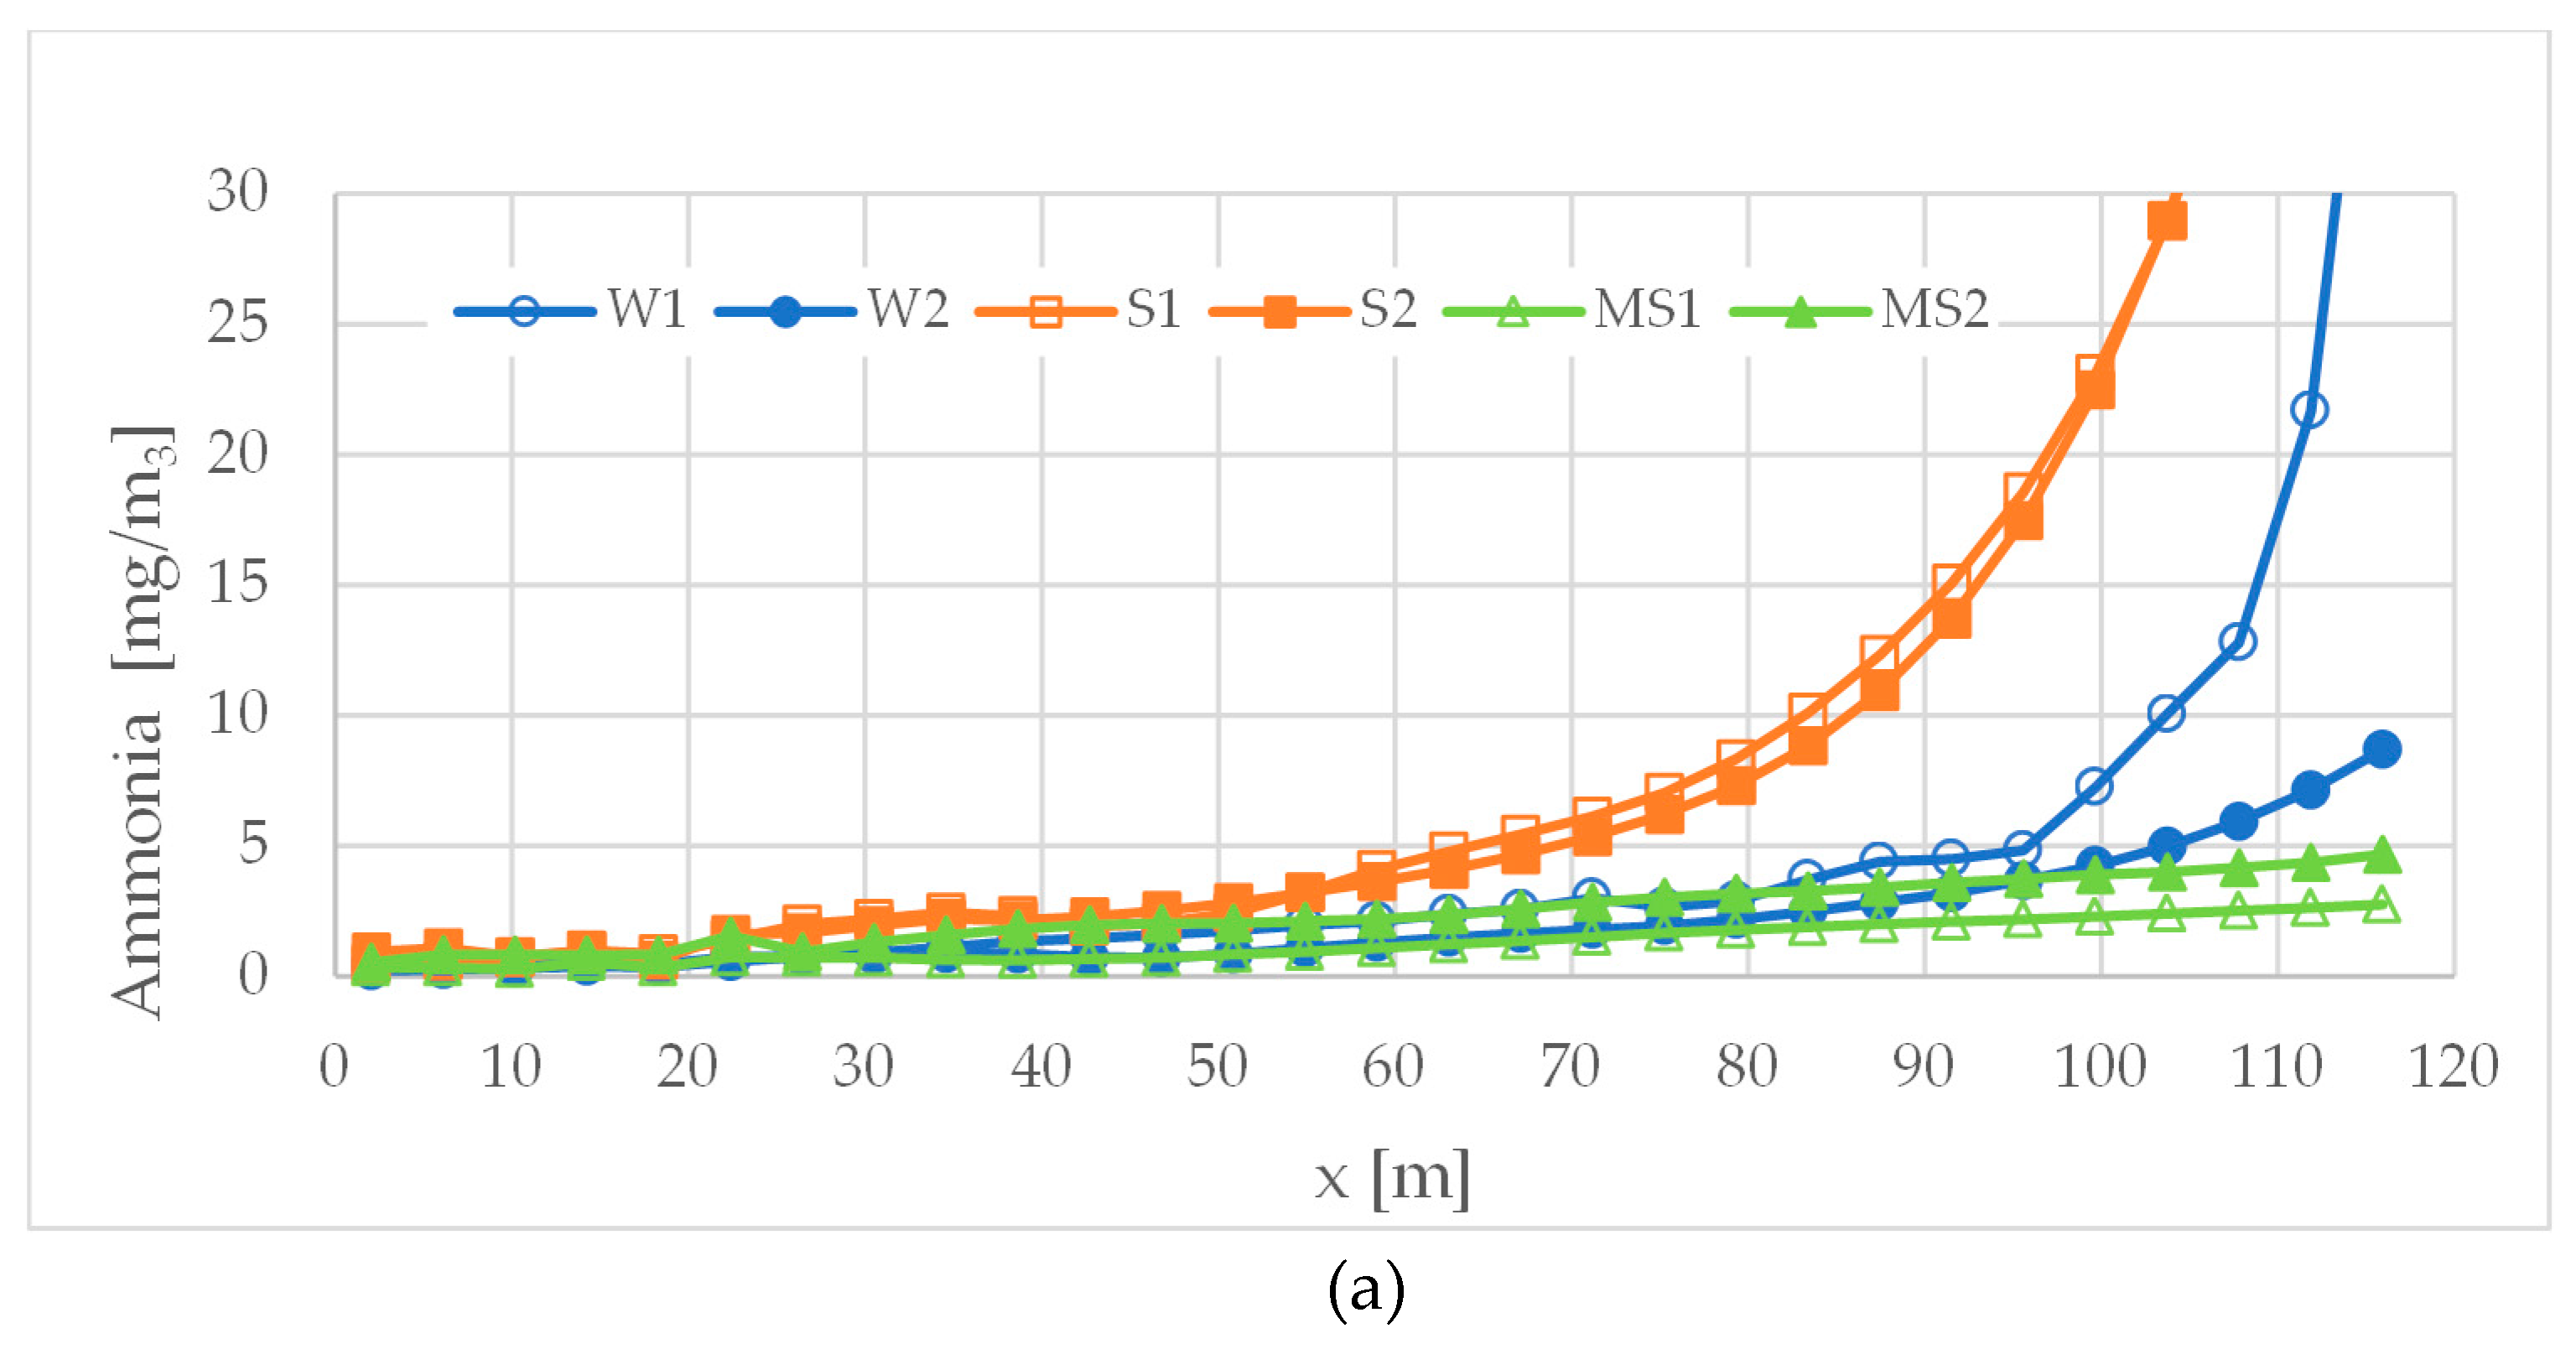
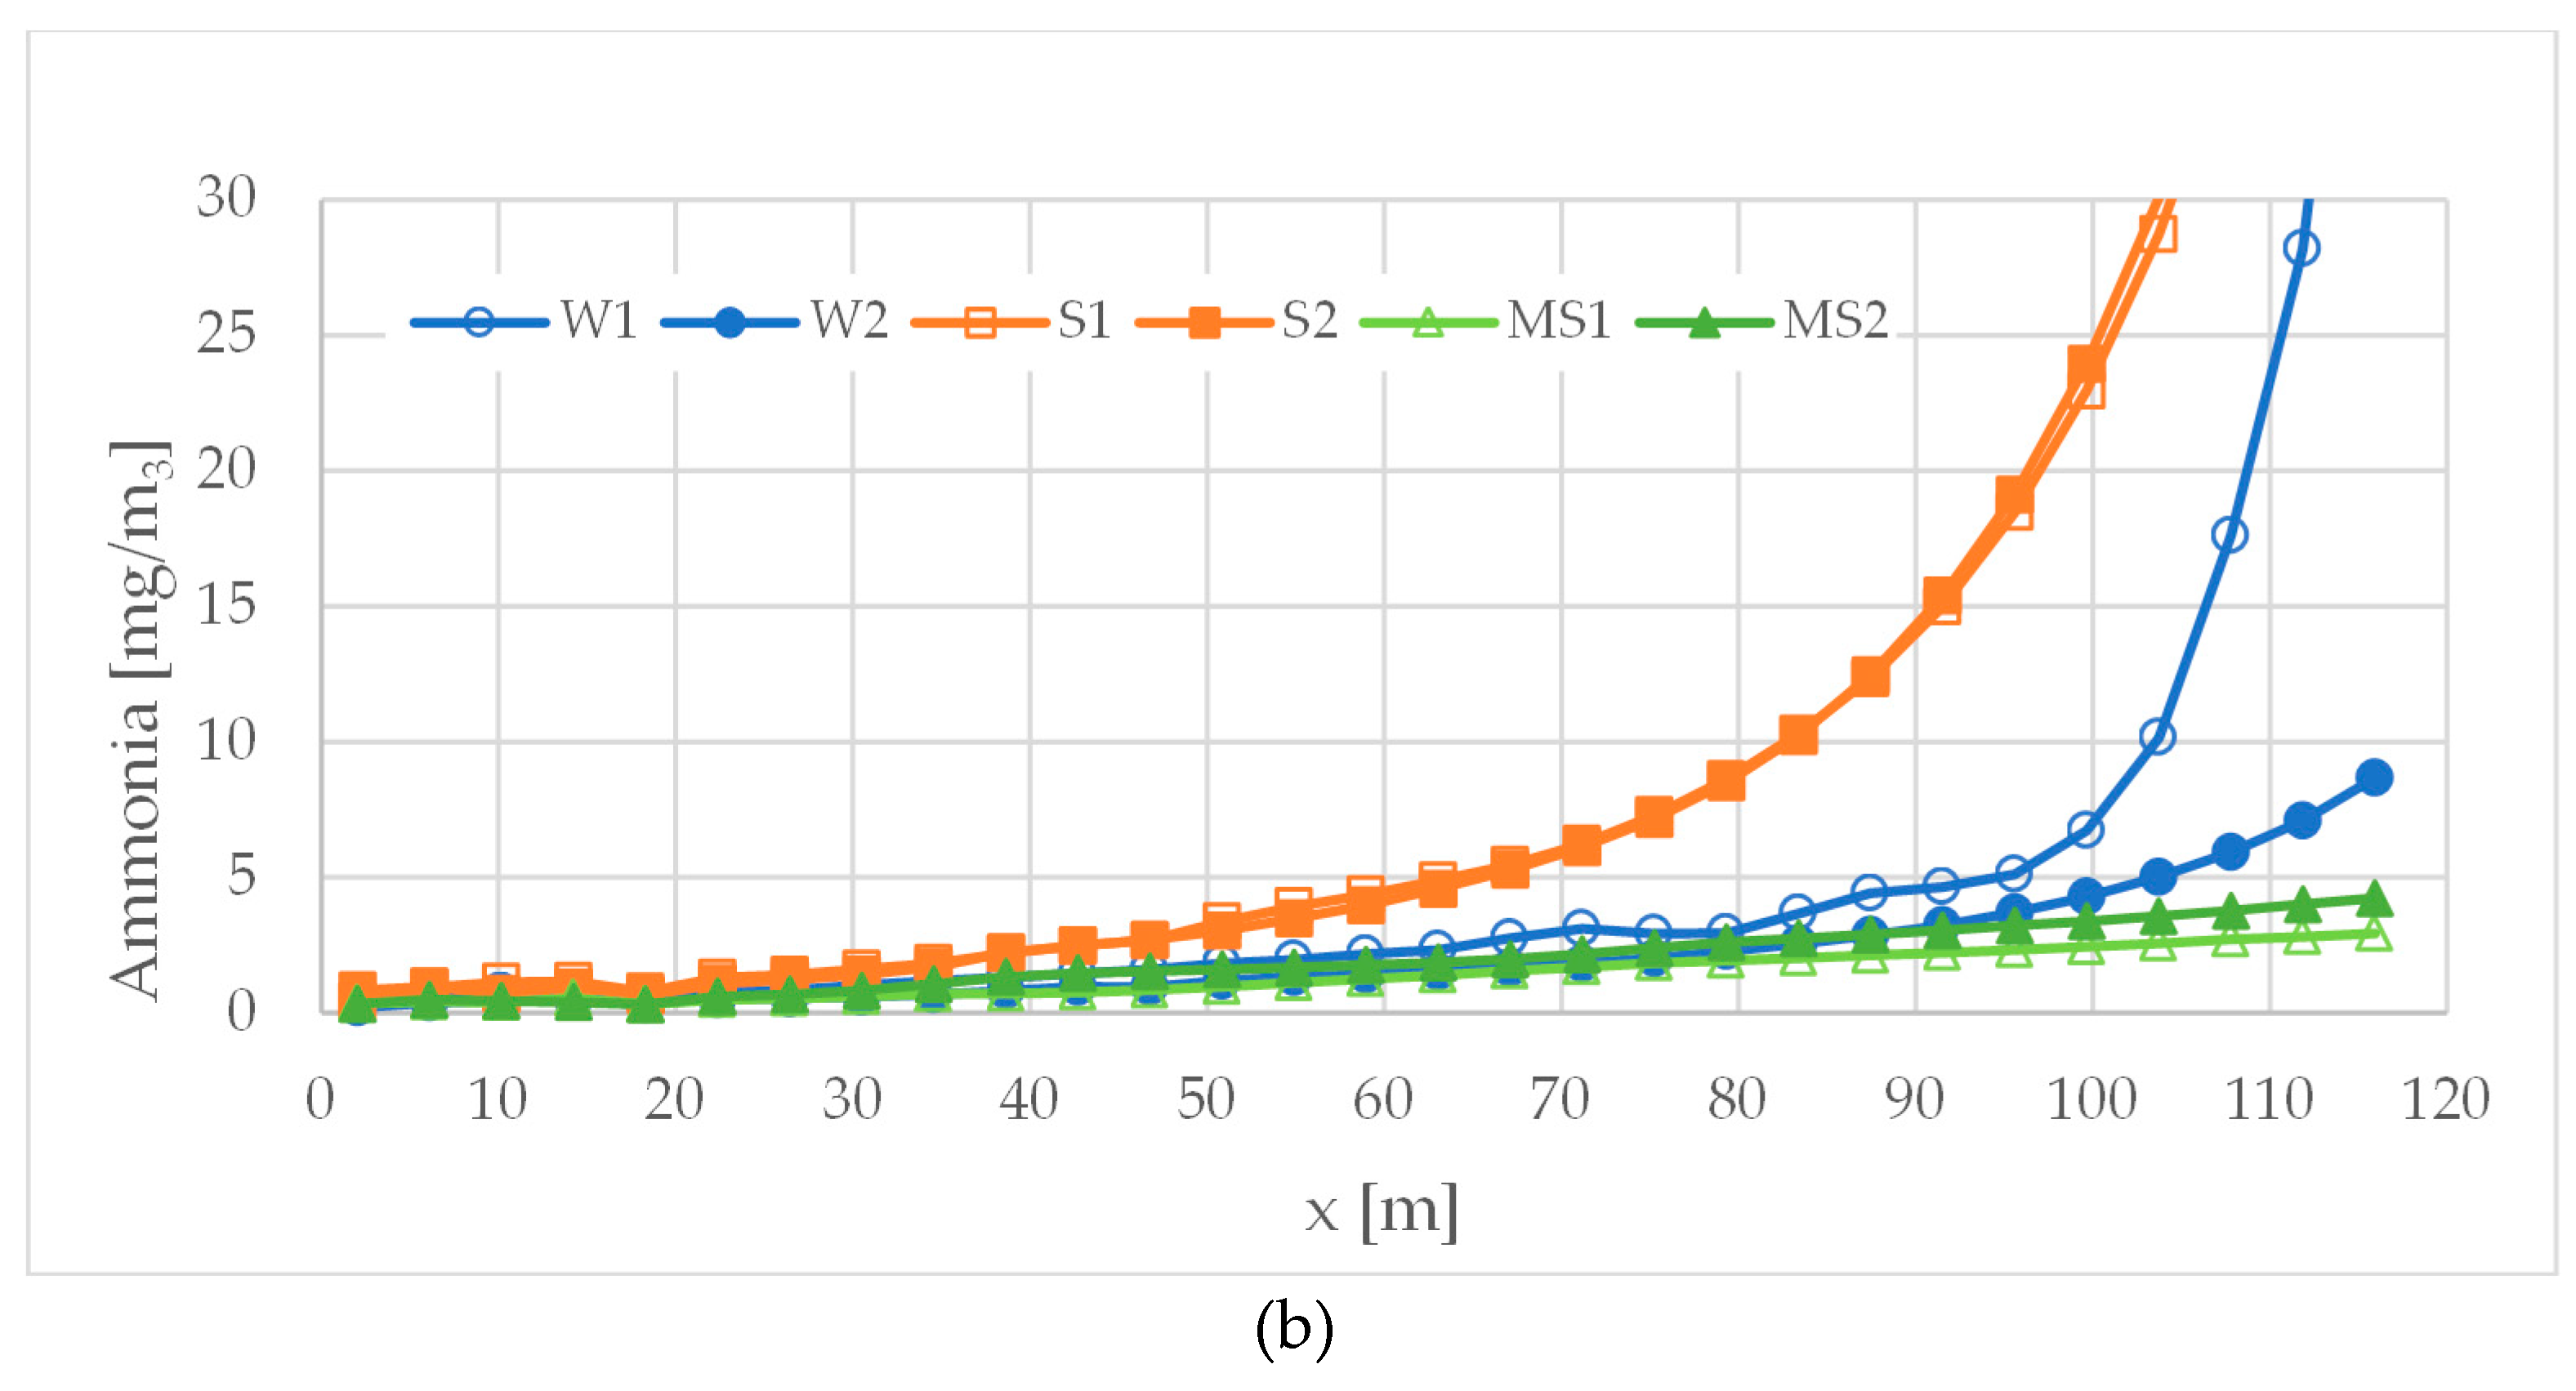
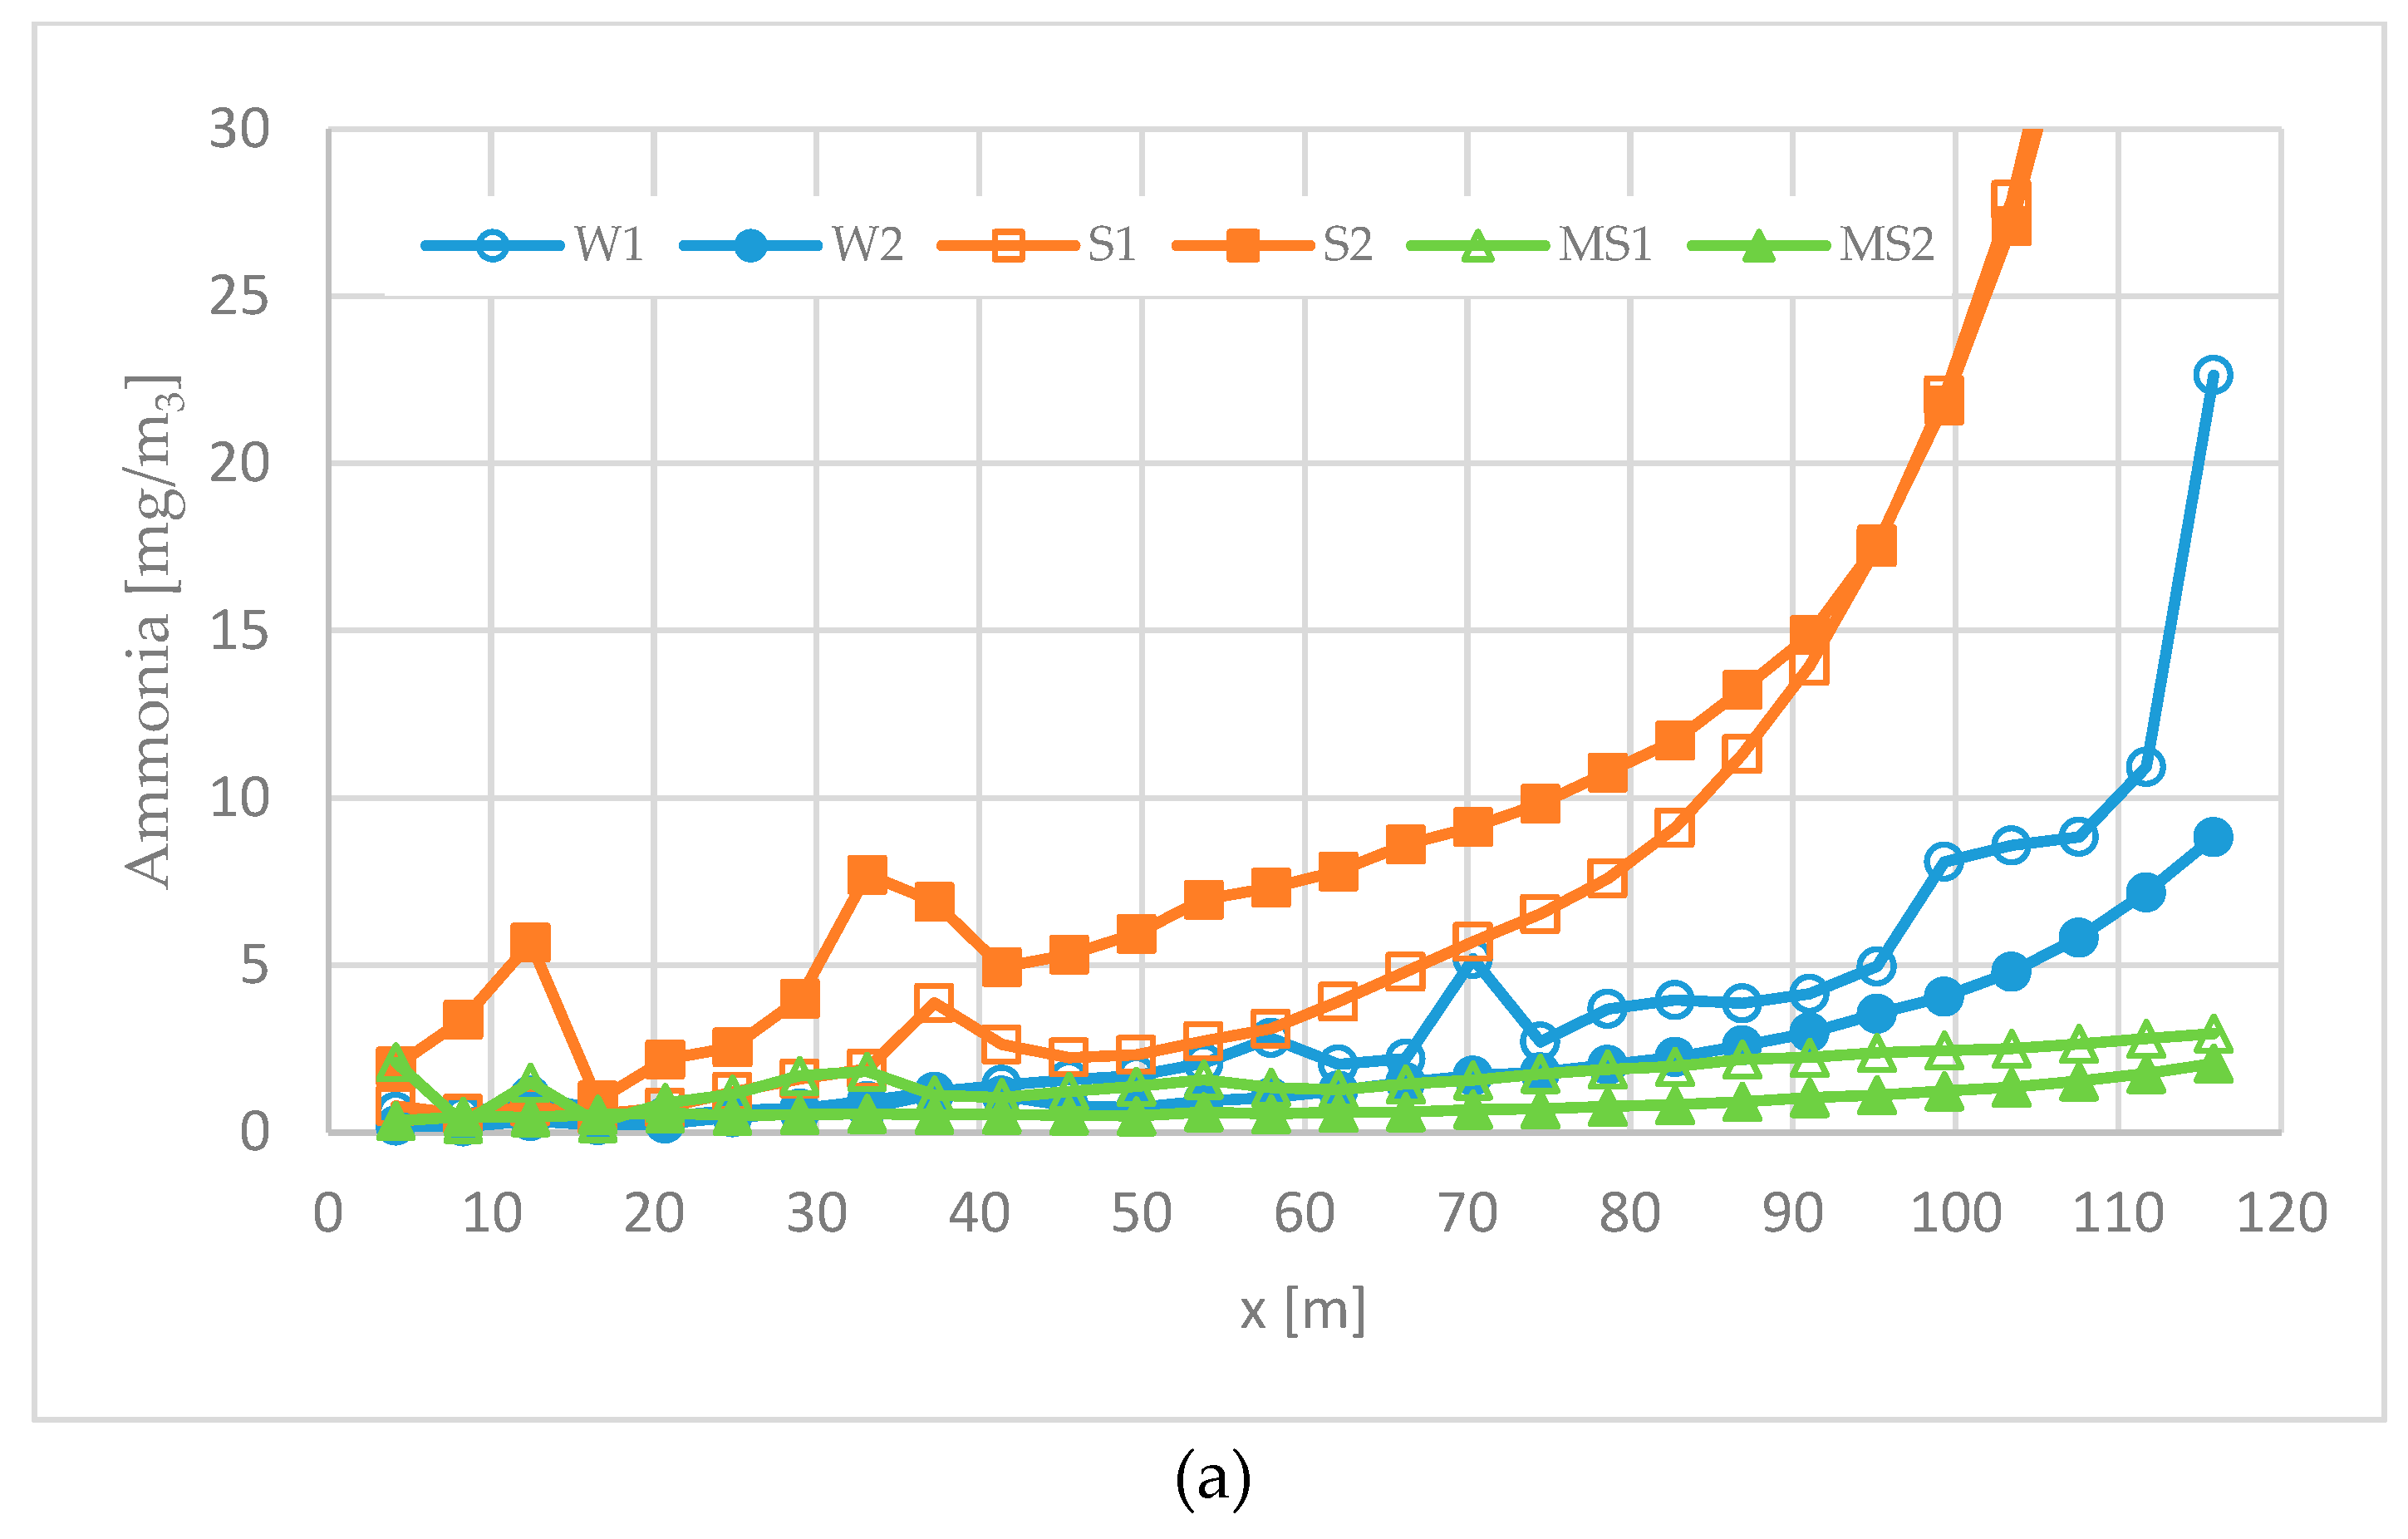
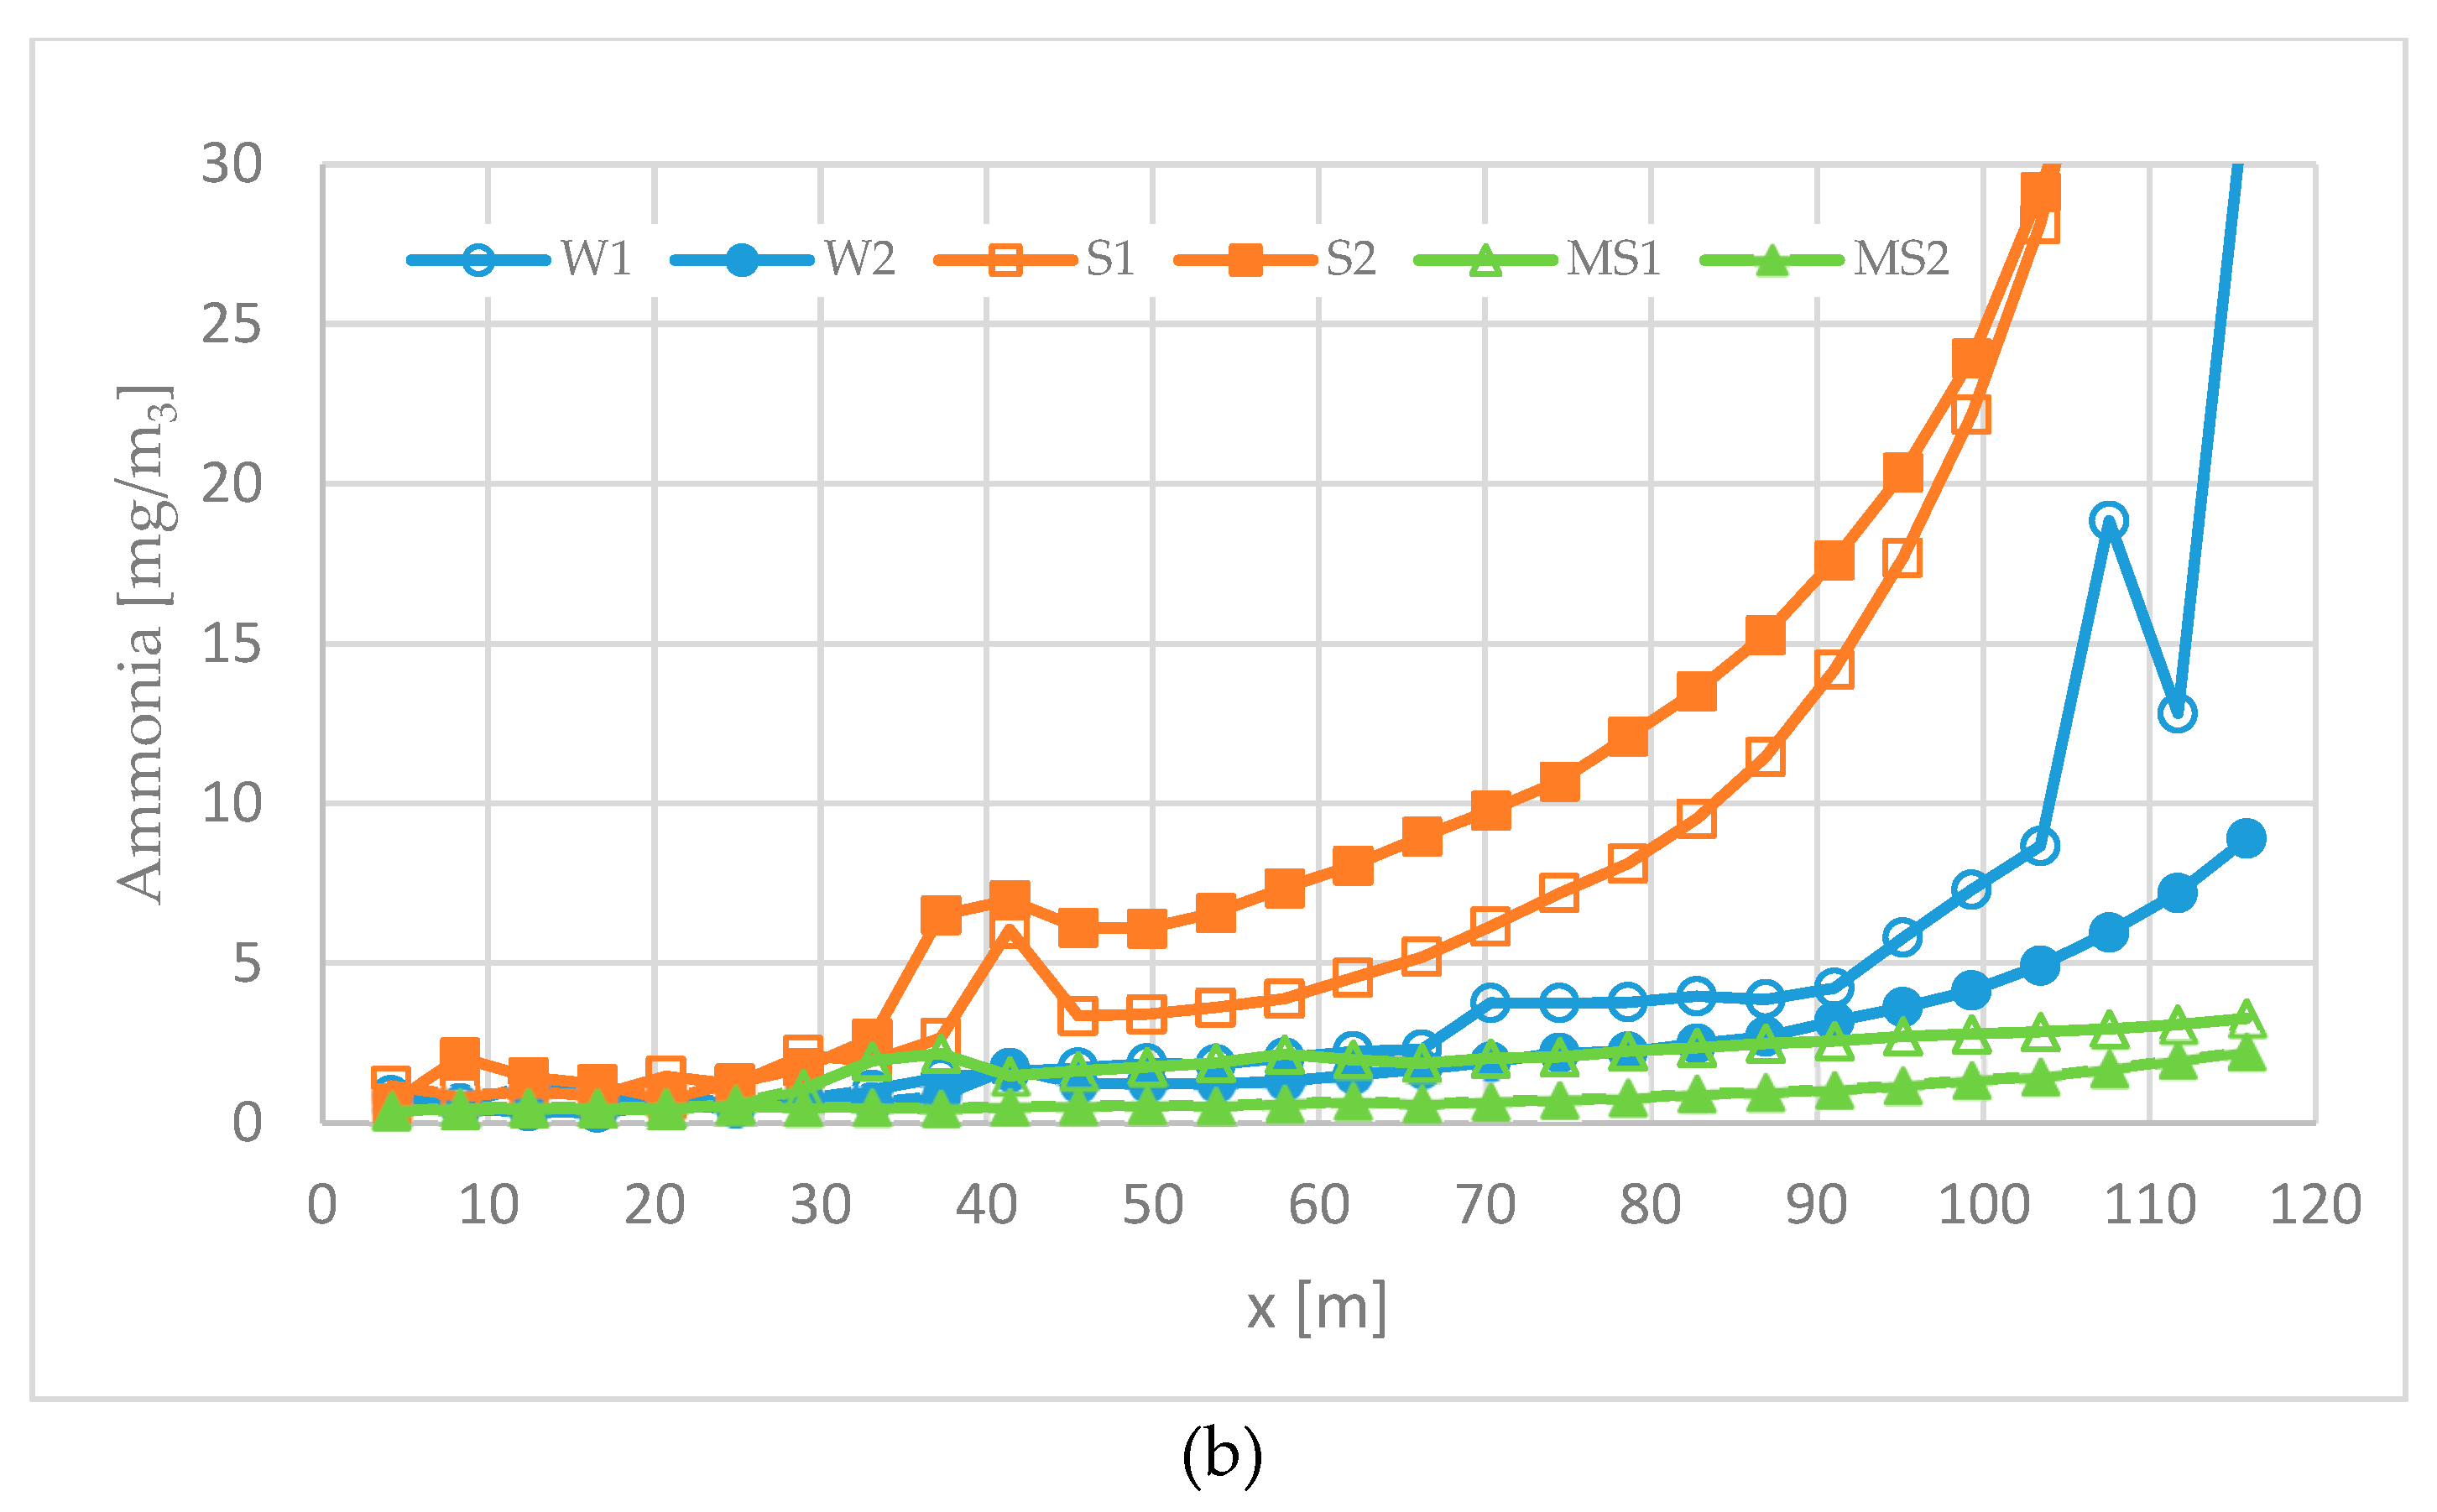
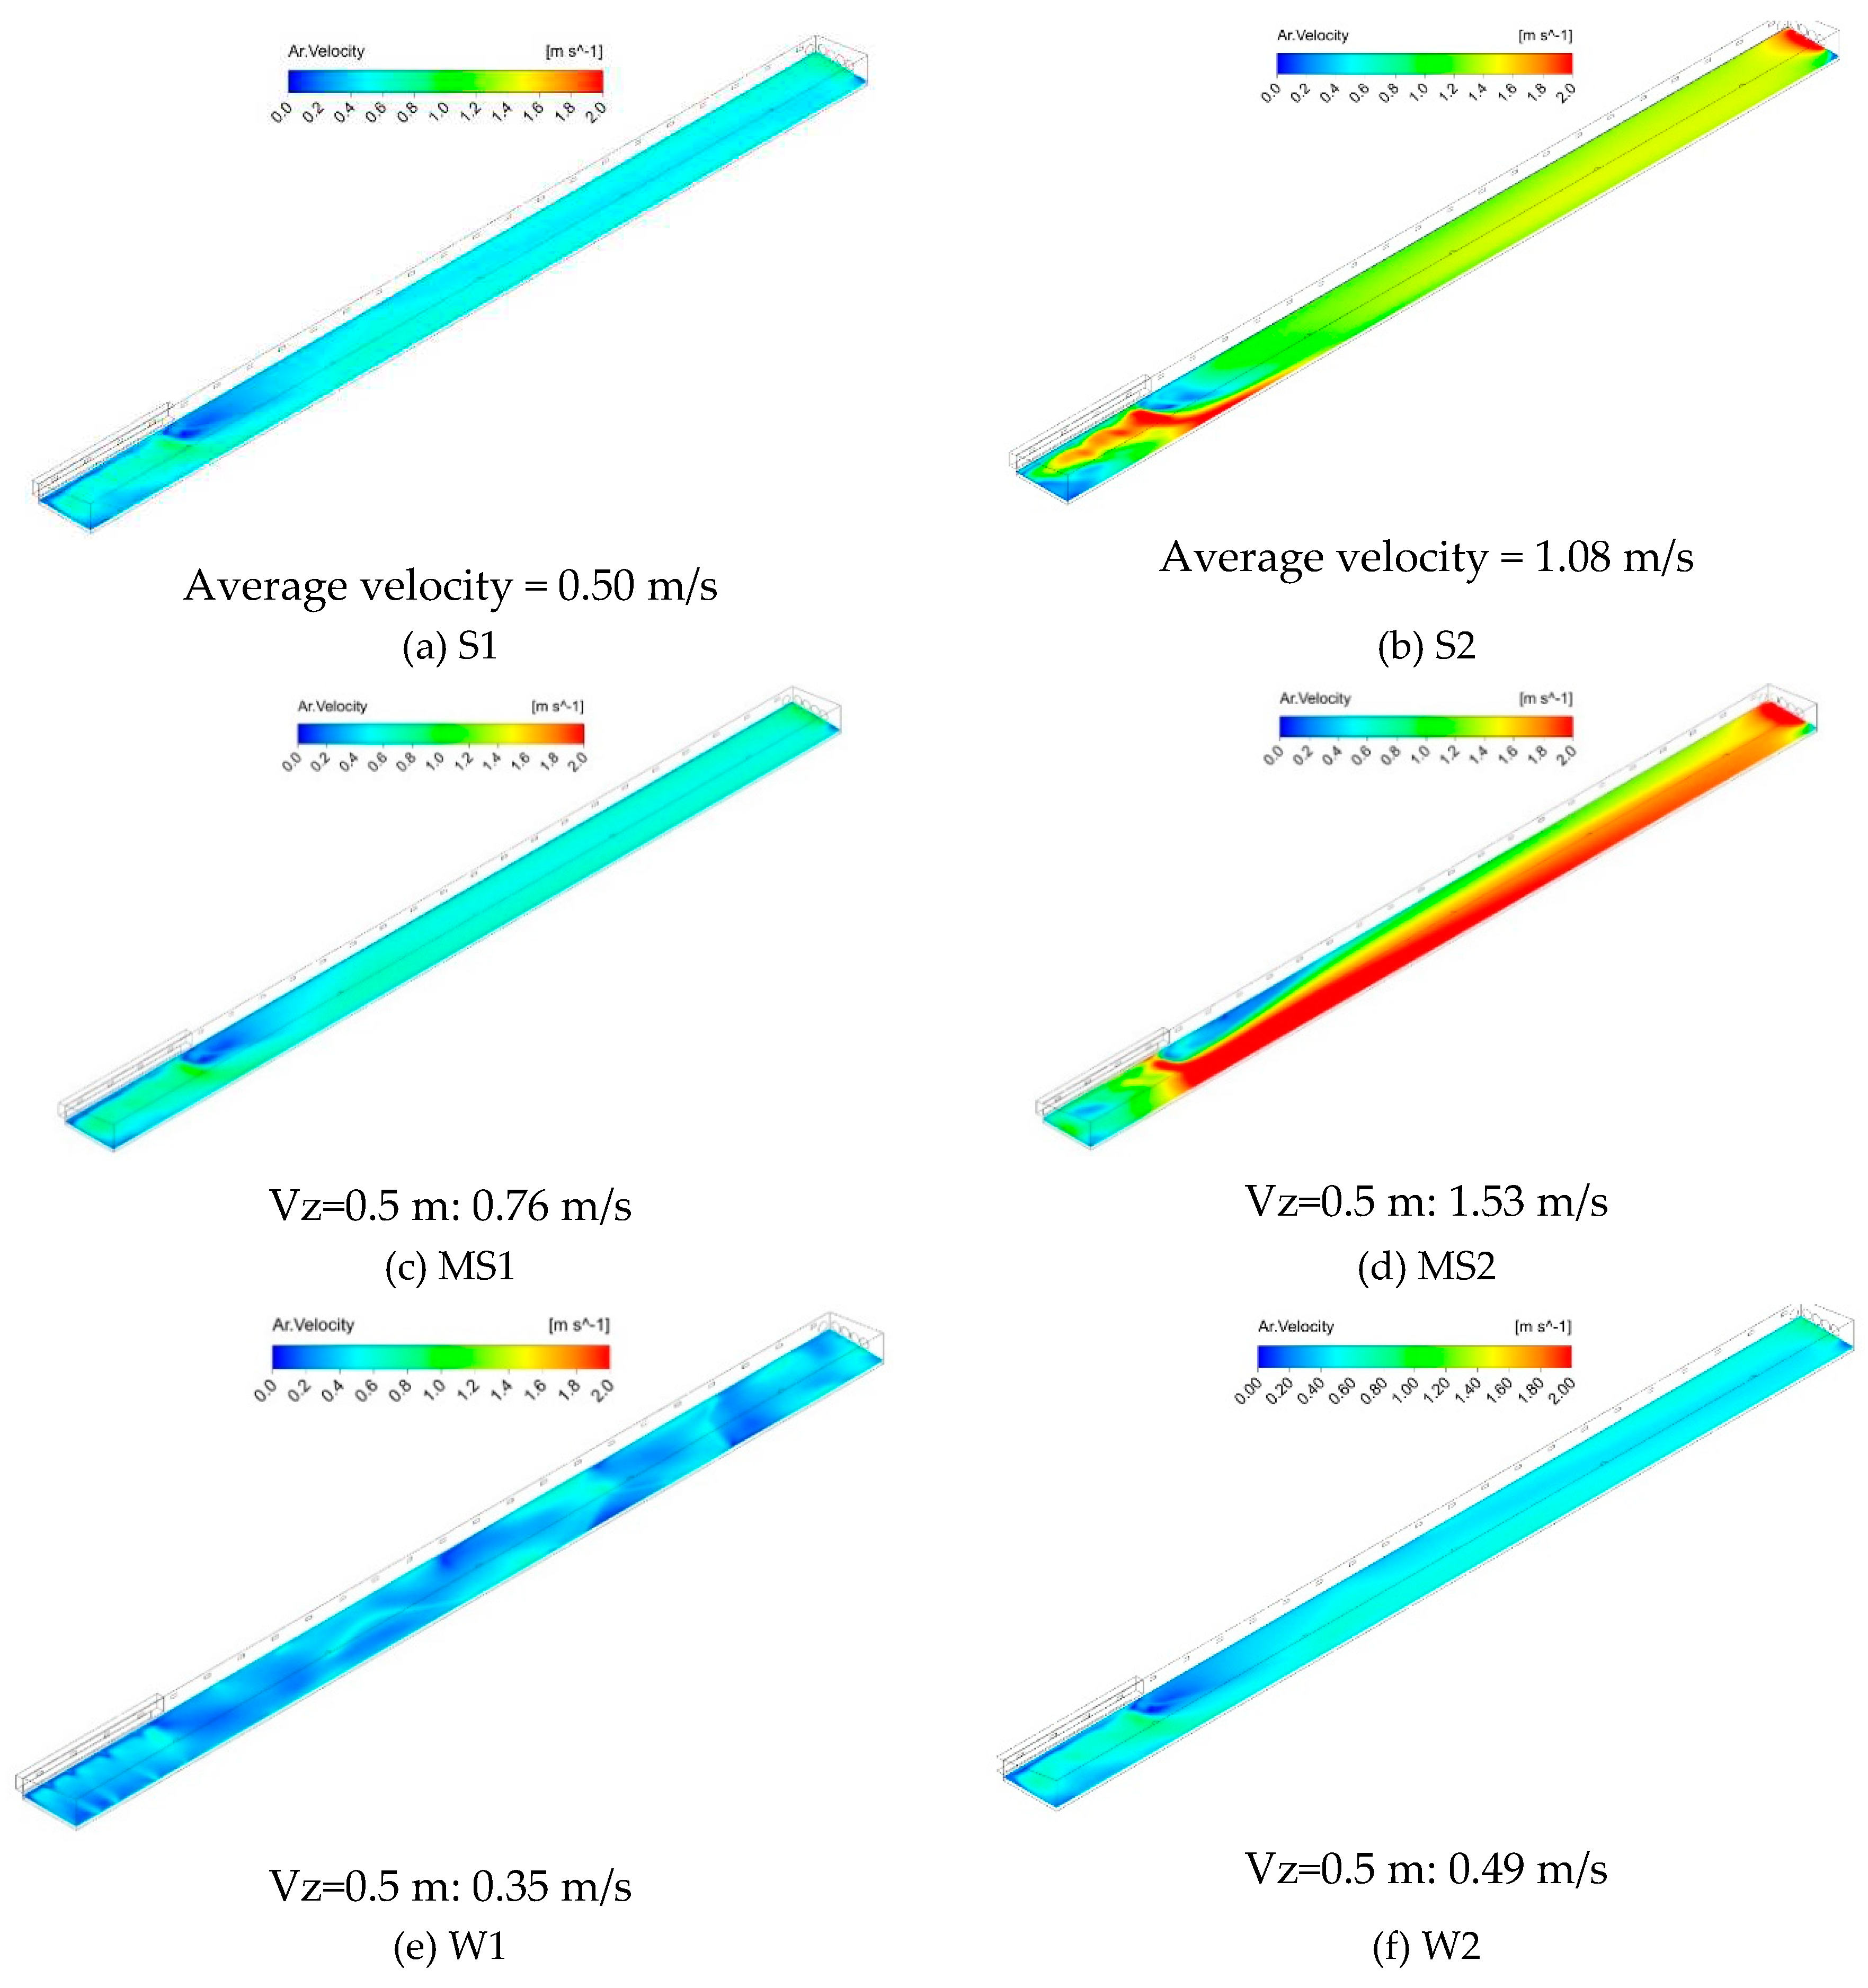
| Configuration | Season | Correspondent Date | Grow period (day) | Hour of the day [h] | Broilers number | Liveweight [g] |
|---|---|---|---|---|---|---|
| W1 | Winter | 21/03/2018 | 31 | 6 | 37180 | 1141.0 |
| W2 | Winter | 21/03/2018 | 31 | 14 | 37153 | 1170.0 |
| S1 | Summer | 23/07/2018 | 28 | 6 | 36309 | 1214.1 |
| S2 | Summer | 23/07/2018 | 28 | 14 | 36292 | 1245.0 |
| MS1 | Mid-season | 07/10/2017 | 30 | 6 | 38718 | 1515.6 |
| MS2 | Mid-season | 07/10/2017 | 30 | 14 | 38712 | 1533.0 |
| Configuration | Tint [ºC] | Hrint [%] | Tout [ºC] | Hrout [%] | Outlet volume flow rate [m3/h] | Outlet mass flow rate [kg/s] | NH3 Litter emission [kg/(m2.s)] | Broiler Heat Released [W/m2] |
|---|---|---|---|---|---|---|---|---|
| W1 | 24.0 | 61.6 | 6.0 | 65.4 | 46300.3 | 16.0 | 2.87E-08 | 220.95 |
| W2 | 25.3 | 59.0 | 13.2 | 54.7 | 72906.9 | 22.0 | 3.44E-08 | 226.40 |
| S1 | 26.1 | 80.9 | 19.6 | 88.2 | 90620.5 | 30.2 | 9.40E-08 | 344.39 |
| S2 | 29.1 | 62.7 | 25.9 | 55.5 | 210754.2 | 70.3 | 1.86E-07 | 353.00 |
| MS1 | 24.7 | 73.4 | 9.5 | 94.3 | 115777.4 | 39.1 | 6.99E-08 | 305.06 |
| MS2 | 30.4 | 39.2 | 28.7 | 26.9 | 300510.0 | 100.7 | 1.90E-07 | 309.09 |
| Nº nodes | Nº Elements | |
|---|---|---|
| Mesh 1 | 479973 | 1656020 |
| Mesh 2 | 608814 | 2343413 |
| Mesh 3 | 1222894 | 5478648 |
| Mesh 4 | 2241341 | 10581101 |
Disclaimer/Publisher’s Note: The statements, opinions and data contained in all publications are solely those of the individual author(s) and contributor(s) and not of MDPI and/or the editor(s). MDPI and/or the editor(s) disclaim responsibility for any injury to people or property resulting from any ideas, methods, instructions or products referred to in the content. |
© 2023 by the authors. Licensee MDPI, Basel, Switzerland. This article is an open access article distributed under the terms and conditions of the Creative Commons Attribution (CC BY) license (http://creativecommons.org/licenses/by/4.0/).


